Exhibit 99.1
Saving More Lives Financial Report April-june 2021 Stockholm, Sweden,July 16,2021 (Nyse: ALV and SSE: ALIV.sdb)Autoliv
|
Financial Report April – June 2021 |
Q2 2021: Recovery in a challenging environment
Financial highlights Q2 2021 $2,022m net sales 85% organic sales growth* 8.1% operating margin 8.2% adjusted operating margin* $1.19 EPS - an increase of $3.19 $1.20 adjusted EPS* - an increase of $2.60 | | Full year 2021 indications Around 20-22% net sales growth Around 16-18% organic sales growth Around 9-9.5% adjusted operating margin |
Key business developments in the second quarter of 2021
• | Strong organic sales growth* in all regions, except China, as global LVP grew by 52% vs. Q2 last year (according to IHS Markit June 2021). Sales increased organically by 85%, outperforming global LVP by more than 33pp, largely due to launches and positive vehicle and geographical mix effects. All regions except Rest of Asia outperformed LVP by 4-38pp. Sequentially, LVP declined by 8% compared to Q1 2021. |
• | Major profitability improvement, mainly driven by the strong sales growth. Adjusted operating margin* improved by 24.6pp to 8.2%. ROCE improved to 17.7% and ROE improved to 16.3%. |
• | Improved cash flow and balance sheet. Operating cash flow increased to $63m while free cash flow* was negative $33 million. Net debt* declined substantially and our leverage ratio* improved to 1.1x. Quarterly dividend of $0.62 was declared for Q2 2021. |
*For non-U.S. GAAP measures see enclosed reconciliation tables. All change figures in this release compare to the same period of previous year except when stated otherwise.
| | | | | | |
Key Figures | | | | | | |
(Dollars in millions, except per share data) | Q2 2021 | Q2 2020 | Change | 6 M 2021 | 6 M 2020 | Change |
Net sales | $2,022 | $1,048 | 93.0% | $4,265 | $2,893 | 47.4% |
Operating income (loss) | $164 | $(234) | n/a | $401 | $(99) | n/a |
Adjusted operating income (loss)1) | $166 | $(172) | n/a | $403 | $(36) | n/a |
Operating margin, % | 8.1 | (22.3) | 30.4pp | 9.4 | (3.4) | 12.8pp |
Adjusted operating margin, %1) | 8.2 | (16.4) | 24.6pp | 9.4 | (1.2) | 10.6pp |
Earnings (loss) per share, diluted2, 3) | $1.19 | $(2.00) | n/a | $2.98 | $(1.14) | n/a |
Adj earnings (loss) per share, diluted1, 2, 3) | $1.20 | $(1.40) | n/a | $2.99 | $(0.53) | n/a |
Operating cash flow | $63 | $(128) | n/a | $249 | $28 | 795% |
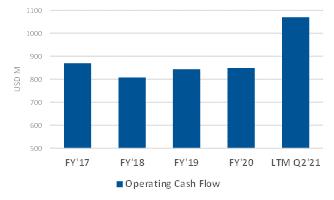
Return on capital employed, %4) | 17.7 | (25.0) | 42.7pp | 21.8 | (5.3) | 27.1pp |
Adjusted return on capital employed, %5) | 17.8 | (18.2) | 36.0pp | 21.9 | (1.9) | 23.8pp |
1) Excluding costs for capacity alignment. 2) Assuming dilution when applicable and net of treasury shares. 3) Participating share awards with right to receive dividend equivalents are (under the two-class method) excluded from the EPS calculation. 4) Annualized operating income and income from equity method investments, relative to average capital employed. 5) Annualized operating income and income from equity method investments, relative to average capital employed. Non-U.S. GAAP measure, see reconciliation table. |
Comments from Mikael Bratt, President & CEO | | for net-zero emissions across our supply chain by 2040, and committing to the Science Based Targets initiative. Raw material prices have continued to increase, with some key commodities increasing by more than 20% in the past three months and despite significant mitigation actions, we now expect raw material cost for the full year to amount to around 130 basis points operating margin headwind. We continue to be diligent in our cost control to manage demand volatility. However, as a result of continued demand and supply chain uncertainty, we are adjusting our full year indication. Based on an assumption of 9-11% global LVP growth for the full year 2021, we expect an organic sales growth of around 16-18%, and an adjusted operating margin of around 9-9.5%. We also continue to drive forward with our strategic initiatives, such as increased digitalization and automation of the value chain, which are yielding good results. Our internal progress and a light vehicle market outlook with a production recovery in the next few years makes us confident of our 2022-24 targets of average annual 4-5% growth over LVP and 12% adjusted operating margin. We will elaborate on this and our long-term opportunities at our virtual CMD on November 16, 2021. |

| The COVID-19 pandemic continues to affect us in several ways. Supply shortage of semiconductors resulted in a Q2 global LVP that was 8% lower than what was expected at the beginning of the quarter, and 8% lower than the first quarter (according to IHS Markit, June | |
2021). The lower than anticipated LVP, along with the material changes in customer call offs with short notice, negatively impacted our sales and profitability in the quarter. The low visibility of these changes prevented us from using furloughs effectively to mitigate the effects of the lower customer demand. Although the situation improved towards the end of the quarter, we still expect supply disruptions to impact LVP negatively in the third quarter with some improvement in the fourth quarter. I am pleased with our strong sales growth and outperformance vs. LVP in Q2, and the level of our order intake for the first half of the year. I am also pleased with our leverage ratio* coming down to 1.1x and that we reinstated a quarterly dividend. We took an important sustainability step in the quarter when we announced ambitious climate targets. This includes plans to become carbon neutral in our own operations by 2030, aiming | |
2
|
Financial Report April – June 2021 |
Full year 2021 indications
Our outlook indications for 2021 reflect continuing uncertainty in the automotive markets and are mainly based on our customer call-offs and global LVP outlook according to IHS Markit, indicating a full year 2021 global LVP growth of 9%-11%.
| Full Year Indication | | Full Year Indication |
Net sales growth | Around 20-22% | Tax rate2) | Around 30% |
Organic sales growth | Around 16-18% | Operating cash flow3) | Similar level as 2020 |
Adjusted operating margin1) | Around 9-9.5% | Capex, net % of sales | Below 6% |
R,D&E, net % of sales | Around 4.5% | Organic growth vs LVP growth | Around +7pp |
1) Excluding costs for capacity alignments and antitrust related matters. 2) Excluding unusual tax items. 3) Excluding unusual items.
The forward-looking non-U.S. GAAP financial measures above are provided on a non-U.S. GAAP basis. Autoliv has not provided a U.S. GAAP reconciliation of these measures because items that impact these measures, such as costs related to capacity alignments and antitrust matters, cannot be reasonably predicted or determined. As a result, such reconciliation is not available without unreasonable efforts and Autoliv is unable to determine the probable significance of the unavailable information.
Conference call and webcast
An earnings conference call will be held at 2:00 p.m. CET today, July 16, 2021. Information regarding how to participate is available on www.autoliv.com. The presentation slides for the conference call will be available on our website shortly after the publication of this financial report.
COVID-19 pandemic related business update
The COVID-19 pandemic continued to impact our business in the second quarter 2021 both directly through several weeks long lock-downs in India and indirectly through limited LVP by our customers caused by semiconductor and other industry supply chain disruptions, especially in North America and Europe. Second quarter 2021 global LVP was around 8% lower than expected at the beginning of the quarter (according to IHS Markit June 2021). Although Autoliv has fulfilled its delivery commitments, the lower than anticipated LVP has negatively impacted our sales and profitability. Supply chain disruptions leading to low customer demand visibility and material changes to call offs with short notice also negatively impacted our production efficiency and profitability in the quarter.
Direct COVID-19 related costs, such as personal protective equipment, quarantine costs, premium freight and other items were around $3 million in Q2 2021. Governmental support in connection with furloughing, short-term work weeks, and other similar activities was not material to our financial results in Q2 2021.
The current industry-wide semiconductor shortage will continue to negatively impact LVP, and hence our sales and profitability, in the second half of the year, and a stabilization of supply may not emerge until the fourth quarter. We expect adverse cost development from rising raw material prices through the remainder of 2021.
This report includes content supplied by IHS Markit Automotive; Copyright © Light Vehicle Production Forecast, June, 2021. All rights reserved.
3
|
Financial Report April – June 2021 |
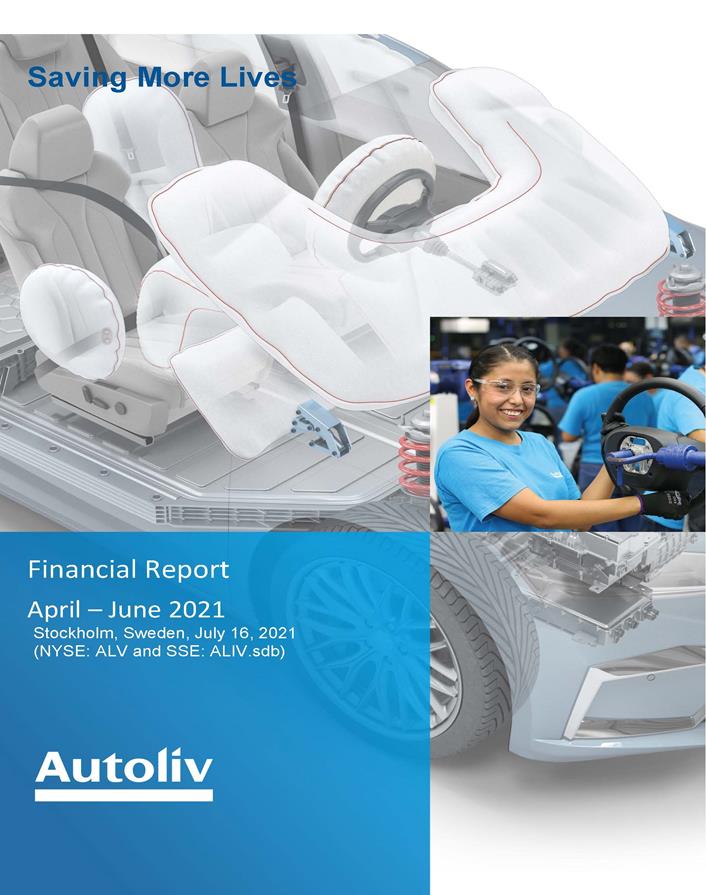
Key Performance Trends | | |
Sales Development by region | | Adj. operating income and margin* |
| | 
|
| | |
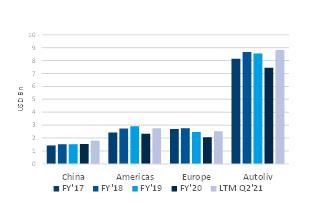
Capex and D&A | | Operating Cash Flow excl EC antitrust payment* |

| | 
|
| | |
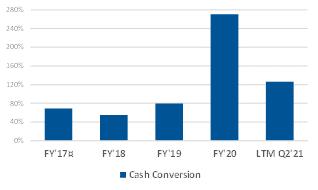
Return on Capital Employed | | Cash Conversion* |
| | 
|
Key definitions ---------------------------------------------------------------------------------------------------------
Capex: Capital Expenditures, net.
D&A: Depreciation and Amortization.
Adj. operating income and margin*: Operating income adjusted for capacity alignments, antitrust related matters and separation of our business segments. Capacity alignments include non-recurring costs related to our structural efficiency and business cycle management programs.
Operating cash flow excluding EC antitrust payment*: Management estimate for Continuing Operations derived from cash flow including Discontinued Operations 2017-2018. Adjusted for EC antitrust payment of $203 million in 2019.
Cash conversion*: Free cash flow* in relation to net income adjusted for EC antitrust accrual in 2018 and payment in 2019. Free cash flow defined as operating cash flow less capital expenditure, net.
4
|
Financial Report April – June 2021 |
Consolidated sales development
Second quarter 2021
Consolidated sales | | Second quarter | Reported
(U.S. GAAP) | Currency
effects1) | Organic
change* |
(Dollars in millions) | | 2021 | 2020 |
Airbag Products and Other2) | | $1,310 | $654 | 100% | 7.5% | 92.9% |
Seatbelt Products2) | | $712 | $394 | 80.9% | 9.1% | 71.7% |
Total | | $2,022 | $1,048 | 93.0% | 8.1% | 84.9% |
| | | | | | |
Asia | | $794 | $588 | 35.1% | 6.6% | 28.5% |
Whereof: | China | $399 | $366 | 9.0% | 9.3% | (0.3)% |
| Japan | $175 | $105 | 67.4% | (3.9)% | 71.3% |
| RoA | $219 | $117 | 87.9% | 7.4% | 80.4% |
Americas | | $621 | $213 | 191% | 9.7% | 181% |
Europe | | $608 | $246 | 147% | 10.4% | 136% |
Total | | $2,022 | $1,048 | 93.0% | 8.1% | 84.9% |
1) Effects from currency translations. 2) Including Corporate and other sales. |
Sales by product - Airbags
All major product categories within Airbags grew strongly organically* in the quarter. The largest contributor to growth was inflatable curtains and steering wheels, followed by passenger airbags, driver airbags and side airbags. The highest growth rate was in knee airbags and steering wheels, with both growing by more than 100%.
Sales by product - Seatbelts
The main contributor to Seatbelt products organic growth* was Europe and Americas. Seatbelt products grew organically in all major regions except China.
Sales by region
Our global organic sales* grew by 85% compared to the LVP growth of 52% (according to IHS Markit June 2021). The more than 33pp outperformance was largely due to product launches and positive geographical mix effects as LVP in higher content per vehicle markets such as Europe and North America grew more than
lower CPV markets such as China and Rest of Asia. We also saw positive vehicle mix effects within several regions. All regions except Rest of Asia outperformed LVP by 4-38pp. LVP grew in all regions except China, which declined by 4.6% as domestic OEMs grew by 9% and global OEMs declined by 14%.
| | | | | | |
Q2 2021 organic growth* | Americas | Europe | China | Japan | Rest of Asia | Global |
Autoliv | 181% | 136% | (0.3)% | 71% | 80% | 85% |
Main growth drivers | Stellantis, Honda, Nissan | VW, Stellantis, Daimler | GM, Geely, Xpeng | Toyota, Mitsubishi, Mazda | Hyundai/Kia, Suzuki, Mitsubishi | Stellantis, Toyota, VW |
Main decline drivers | n/a | n/a | VW, Nissan, Hyundai/Kia | Honda | SsangYong, Renault | SsangYong |
Light vehicle production development
Change vs same period last year according to IHS Markit
| | | | | | |
Q2 2021 | Americas | Europe | China | Japan | Rest of Asia | Global |
LVP (June 2021) | 159% | 98% | (4.6)% | 52% | 99% | 52% |
LVP (Apr 2021) | 189% | 109% | (1.2)% | 51% | 108% | 60% |
5
|
Financial Report April – June 2021 |
Consolidated sales development
First six months 2021
| | | | | | |
Consolidated sales | | First 6 months | Reported
(U.S. GAAP) | Currency
effects1) | Organic
change* |
(Dollars in millions) | | 2021 | 2020 |
Airbag Products and Other2) | | $2,773 | $1,856 | 49.4% | 4.6% | 44.8% |
Seatbelt Products2) | | $1,491 | $1,037 | 43.8% | 6.3% | 37.4% |
Total | | $4,265 | $2,893 | 47.4% | 5.2% | 42.2% |
| | | | | | |
Asia | | $1,671 | $1,185 | 41.0% | 5.7% | 35.3% |
Whereof: | China | $814 | $564 | 44.3% | 8.7% | 35.5% |
| Japan | $386 | $308 | 25.5% | 0.6% | 25.0% |
| RoA | $471 | $314 | 50.3% | 5.1% | 45.2% |
Americas | | $1,307 | $886 | 47.6% | 1.2% | 46.5% |
Europe | | $1,287 | $823 | 56.4% | 8.9% | 47.5% |
Total | | $4,265 | $2,893 | 47.4% | 5.2% | 42.2% |
1) Effects from currency translations. 2) Including Corporate and other sales. |
First six months 2021 development
Sales by product - Airbags
All major product categories within Airbags grew strongly organically* in the first half of the year. The largest contributor to growth was inflatable curtains and steering wheels, followed by passenger airbags, driver airbags and side airbags.
Sales by product - Seatbelts
All regions except Japan, which was close to unchanged, showed a strong organic* seatbelt sales growth between 34 and 45%.
Sales by region
The global organic sales growth* of 42% was 12pp better than LVP (according to IHS Markit June 2021). Sales increased organically in all regions. The largest organic sales increase drivers were Americas and
Europe, followed by China, Rest of Asia and Japan. Our organic sales development outperformed LVP in all regions - by 15pp in Europe, by 10pp in China and Japan, by 9pp in Americas, and by 5pp in Rest of Asia.
| | | | | | |
First six months 2021 organic growth* | Americas | Europe | China | Japan | Rest of Asia | Global |
Autoliv | 46% | 47% | 36% | 25% | 45% | 42% |
Main growth drivers | Stellantis, Toyota, Honda | VW, Stellantis, BMW | GM, Great Wall, Honda | Toyota, Nissan, Mitsubishi | Hyundai/Kia Suzuki, Mitsubishi | Stellantis, Toyota, VW |
Main decline drivers | n/a | n/a | Hyundai/Kia, Daimler, Mazda | Honda | SsangYong, Renault | SsangYong |
Light vehicle production development
Change vs same period last year
| | | | | | |
First six months 2021 | Americas | Europe | China | Japan | Rest of Asia | Global |
IHS LVP (June 2021) | 37% | 32% | 25% | 15% | 40% | 30% |
IHS LVP (Jan 2021) | 63% | 40% | 26% | 21% | 36% | 37% |
6
|
Financial Report April – June 2021 |
Key launches in the second quarter 2021
Toyota Land Cruiser 300 | | Nissan Pathfinder | | Skoda Fabia | |

| | 
| | 
| |

| | 
| | 
| |
Mercedes EQS | | Zeekr 001 | | Chevrolet Bolt EUV | |

| 
| 
| 
| 
| 
|

| | 
| | 
| |
WEY Macchiato | | Citroën C5X | | Renault Kangoo | |

| 
| 
| 
| 
| 
|

| | 
| | 
| |

| Driver/Passenger Airbags | 
| Seatbelts | 
| Side Airbags |
| | | | | |

| Head/Inflatable Curtain Airbags | 
| Steering Wheel | 
| Knee Airbag |
| | | | | |

| Front Center Airbag | 
| Bag-in-Belt | 
| Pyrotechnical Safety Switch |
| | | | | |

| Pedestrian Airbag | 
| Hood Lifter | 
| Available as EV/PHEV |
7
|
Financial Report April – June 2021 |
Financial development
Selected income statement items
| | | | | | |
Condensed income statement | Second quarter | First 6 months |
(Dollars in millions, except per share data) | 2021 | 2020 | Change | 2021 | 2020 | Change |
Net sales | $2,022 | $1,048 | 93.0% | $4,265 | $2,893 | 47.4% |
Cost of sales | $(1,638) | $(1,033) | 58.5% | $(3,422) | $(2,548) | 34.3% |
Gross profit | $384 | $14 | 2568% | $843 | $345 | 144% |
S,G&A | $(111) | $(98) | 12.8% | $(219) | $(192) | 13.9% |
R,D&E, net | $(107) | $(88) | 21.3% | $(213) | $(191) | 12.0% |
Amortization of intangibles | $(3) | $(2) | 5.4% | $(5) | $(5) | 0.3% |
Other income (expense), net | $0 | $(59) | n/a | $(4) | $(57) | (92.6)% |
Operating income (loss) | $164 | $(234) | n/a | $401 | $(99) | n/a |
Adjusted operating income (loss)1) | $166 | $(172) | n/a | $403 | $(36) | n/a |
Financial and non-operating items, net | $(12) | $(13) | (10.0)% | $(32) | $(36) | (12.2)% |
Income (loss) before taxes | $152 | $(247) | n/a | $370 | $(135) | n/a |
Tax rate | 31.3% | 29.3% | 2.0pp | 29.2% | 26.5% | 2.7pp |
Net income (loss) | $105 | $(174) | n/a | $262 | $(99) | n/a |
Earnings (loss) per share2, 3) | $1.19 | $(2.00) | n/a | $2.98 | $(1.14) | n/a |
Adjusted earnings (loss) per share1, 2, 3) | $1.20 | $(1.40) | n/a | $2.99 | $(0.53) | n/a |
| | | | | | |
Gross margin | 19.0% | 1.4% | 17.6pp | 19.8% | 11.9% | 7.9pp |
S,G&A in relation to sales | (5.5)% | (9.4)% | (3.9)pp | (5.1)% | (6.6)% | (1.5)pp |
R,D&E net in relation to sales | (5.3)% | (8.4)% | (3.1)pp | (5.0)% | (6.6)% | (1.6)pp |
Operating margin | 8.1% | (22.3)% | 30.4pp | 9.4% | (3.4)% | 12.8pp |
Adjusted operating margin1) | 8.2% | (16.4)% | 24.6pp | 9.4% | (1.2)% | 10.6pp |
| | | | | | |
Other data | | | | | | |
No. of shares at period-end in millions4) | 87.5 | 87.3 | 0.2% | 87.5 | 87.3 | 0.2% |
Weighted average no. of shares in millions5) | 87.4 | 87.3 | 0.1% | 87.4 | 87.3 | 0.1% |
Weighted average no. of shares in millions, diluted5) | 87.7 | 87.3 | 0.5% | 87.7 | 87.3 | 0.5% |
1) Non-U.S. GAAP measure, excluding costs for capacity alignment. See reconciliation table. 2) Assuming dilution when applicable and net of treasury shares. 3) Participating share awards with right to receive dividend equivalents are (under the two-class method) excluded from the EPS calculation. 4) Excluding dilution and net of treasury shares. 5) Net of treasury shares. |
Second quarter 2021 development
Gross profit increased by $370 million and the gross margin increased by 17.6pp compared to the same quarter 2020. The gross margin increase was primarily driven by the higher sales and direct material and labor productivity.
S,G&A costs increased by $13 million compared to the prior year, mainly relating to higher personnel costs due to extensive furloughing the prior year. In relation to sales, S,G&A costs decreased from 9.4% to 5.5%.
R,D&E, net costs increased by $19 million compared to the prior year, mainly relating to higher personnel costs due to extensive furloughing the prior year, and adverse FX effects. In relation to sales, R,D&E costs declined from 8.4% to 5.3%.
Other income (expense), net improved by $59 million compared to prior year, mainly due to $61 million lower capacity alignment accruals.
Operating income (loss) improved by $398 million compared to the same period in 2020, mainly as a consequence of the higher gross profit and lower capacity alignment accruals, partially offset by higher
costs for S,G&A and R,D&E, net.
Adjusted operating income (loss)* improved by $337 million compared to the prior year, mainly due to higher gross profit partially offset by higher costs for S,G&A and R,D&E, net.
Financial and non-operating items, net, were close to unchanged vs. prior year.
Income (loss) before taxes increased by $399 million compared to the prior year, mainly due to the higher operating income.
Tax rate was 31.3%, compared to 29.3% in the same quarter last year, impacted by unfavorable country mix.
Earnings per share, diluted increased by $3.19 compared to a year earlier, where the main drivers were $2.90 from higher adjusted operating income* and $0.59 from lower capacity alignment costs partially offset by $0.31 from higher tax.
8
|
Financial Report April – June 2021 |
First six months 2021 development
Gross profit increased by $497 million and the gross margin increased by 7.9pp compared to the same period 2020. The gross margin increase was primarily driven by higher sales and direct material and labor productivity.
S,G&A increased by $27 million, mainly relating to higher personnel costs due to extensive furloughing the prior year, and adverse FX effects. In relation to sales, S,G&A costs decreased from 6.6% to 5.1%.
R,D&E, net increased by $23 million mainly due to higher personnel costs due to extensive furloughing the prior year, and adverse FX effects. In relation to sales, R,D&E costs declined from 6.6% to 5.0%.
Other income (expense), net improved by $53 million compared to a year earlier, mainly due to $63 million in lower capacity alignment accruals, partly offset by adverse effects from FX effects and lower government income.
Operating income (loss) improved by $500 million, mainly as a consequence of the increase in gross profit and other income (expense), net, partly offset by higher costs for S,G&A and R,D&E, net.
Adjusted operating income (loss)* improved by $438 million, mainly due to the higher gross profit, partly offset by higher costs for S,G&A and R,D&E, net.
Financial and non-operating items, net improved by around $4 million to $32 million, mainly due to higher income from equity method investments and FX effects.
Income (loss) before taxes improved by $505 million, mainly as a consequence of higher operating income.
Tax rate was 29.2%, compared to 26.5% the prior year, impacted by unfavorable country mix.
Earnings per share, diluted increased by $4.12 where the main drivers were $4.06 from higher adjusted operating income* and $0.60 from lower capacity alignment costs partly mitigated by $0.57 from higher tax.
9
|
Financial Report April – June 2021 |
Selected Balance Sheet and Cash Flow items
| | | |
Selected Balance Sheet items | Second quarter |
(Dollars in millions) | 2021 | 2020 | Change |
Trade working capital | $1,495 | $1,322 | 13.1% |
Trade working capital in relation to sales, % | 18.5 | 31.5 | (13.0)pp |
Receivables outstanding in relation to sales, %1) | 21.3 | 28.1 | (6.8)pp |
Inventory outstanding in relation to sales, %2) | 11.1 | 18.1 | (7.0)pp |
Payables outstanding in relation to sales, %3) | 13.9 | 14.7 | (0.8)pp |
Cash & cash equivalents | $893 | $1,223 | (27.0)% |
Gross Debt4) | $2,075 | $3,060 | (32.2)% |
Net Debt5) | $1,200 | $1,838 | (34.7)% |
Capital employed6) | $3,815 | $3,793 | 0.6% |
Return on capital employed, %7) | 17.7 | (25.0) | 42.7pp |
Total equity | $2,615 | $1,955 | 33.7% |
Return on total equity, %8) | 16.3 | (34.9) | 51.2pp |
Leverage ratio9) | 1.1 | 2.8 | (60.6)% |
1) Outstanding receivables relative to annualized quarterly sales. 2) Outstanding inventory relative to annualized quarterly sales. 3) Outstanding payables relative to annualized quarterly sales. 4) Short- and long-term interest-bearing debt. 5) Short- and long-term debt less cash and cash equivalents and debt-related derivatives. Non U.S. GAAP measure. See reconciliation table. 6) Total equity and net debt. 7) Annualized operating income and income from equity method investments, relative to average capital employed. 8) Annualized net income relative to average total equity. 9) Net debt adjusted for pension liabilities in relation to EBITDA. Non U.S. GAAP measure. See reconciliations table. |
| | | | | | | |
Selected Cash Flow items | Second quarter | | First 6 months |
(Dollars in millions) | 2021 | 2020 | Change | | 2021 | 2020 | Change |
Net income (loss) | $105 | $(174) | n/a | | $262 | $(99) | n/a |
Changes in operating working capital | $(125) | $44 | n/a | | $(214) | $25 | n/a |
Depreciation and amortization | $100 | $87 | 15.6% | | $199 | $175 | 13.2% |
Other, net | $(16) | $(85) | (80.6)% | | $2 | $(74) | n/a |
Operating cash flow | $63 | $(128) | n/a | | $249 | $28 | 795% |
Capital expenditure, net | $(96) | $(64) | 50.7% | | $(189) | $(152) | 24.5% |
Free cash flow1) | $(33) | $(192) | (82.9)% | | $60 | $(124) | n/a |
Cash conversion2) | n/a | n/a | n/a | | 22.8% | n/a | n/a |
Dividends paid | $(54) | – | n/a | | $(54) | $(54) | 0.2% |
Cash dividend paid per share | $0.62 | – | n/a | | $0.62 | $0.62 | 0.0% |
Capital expenditures, net in relation to sales, % | 4.8% | 6.1% | (1.3)pp | | 4.4% | 5.3% | (0.9)pp |
1) Operating cash flow less Capital expenditures, net. Non U.S. GAAP measure. See enclosed reconciliation table. 2) Free cash flow relative to Net income. Non U.S. GAAP measure. See reconciliation table. |
|
Second quarter 2021 development
Trade working capital* increased by $173 million compared to the same period last year, mainly related to increased inventories as a consequence of higher sales, the low demand visibility and supply chain challenges. Compared to the first quarter 2021, trade working capital increased by $8 million.
Operating cash flow increased by $191 million to $63 million. The improvement was mainly due to positive effects from higher net income and deferred income taxes. Operating cash flow in the quarter was impacted negatively by effects from changes in operating working capital, mainly relating to tax, recalls and insurance while effects from trade working capital was limited.
Capital expenditure, net increased by 51%, supporting the organic growth. Capital expenditure, net in relation to sales was 4.8% vs. 6.1% a year earlier.
Free cash flow* amounted to negative $33 million, compared to negative $192 million a year earlier. The improvement was due to the higher operating cash flow, partially offset by the higher capital expenditure, net.
Cash conversion* defined as free cash flow* in relation to net income, was not meaningful in the second quarter as free cash flow was negative.
Net debt* was $1,200 million as of June 30, 2021, which was $638 million lower than a year earlier and $85 million higher compared to March 31, 2021.
Liquidity position. At June 30, 2021, our cash balance was $0.9 billion, and including committed, unused loan facilities, our liquidity position was $2.0 billion.
Leverage ratio*. As of June 30, 2021, the Company had a leverage ratio of 1.1x, compared to 2.8x at June 30, 2020 as the net debt decreased substantially and the 12 months trailing adjusted EBITDA* increased substantially.
Total equity increased by $660 million compared to June 30, 2020 mainly due to $550 million from net income and $146 million from currency translation effects partially offset by dividend payments of $55 million.
10
|
Financial Report April – June 2021 |
First six months 2021 development
Operating cash flow was $249 million compared to $28 million a year earlier. The increase of $221 million was primarily due to positive effects of the higher net income and deferred income taxes, partly offset by negative effects from changes in operating working capital.
Capital expenditure, net of $189 million was 24% higher than a year earlier, reflecting our efforts to reduce capital expenditure to support cash flow in the first half of 2020. Capital expenditure, net in relation to sales was 4.4% compared to 5.3% in the same period 2020.
Free cash flow* amounted to $60 million compared to negative $124 million a year earlier, driven by the improvement in operating cash flow, partially offset by a higher capital expenditure, net.
Cash conversion* defined as free cash flow in relation to net income, was 23%.
Headcount
| Jun 30 | Mar 31 | Jun 30 |
| 2021 | 2021 | 2020 |
Headcount | 64,500 | 66,600 | 61,800 |
Whereof: Direct employees in manufacturing | 46,400 | 48,700 | 43,400 |
Indirect employees | 18,000 | 17,900 | 18,400 |
Temporary personnel | 9% | 10% | 6% |
By June 30, 2021, total headcount increased by 2,700 compared to a year earlier, reflecting a significant increase in production. The direct workforce increased by around 7% while the indirect workforce declined by around 2%. Compared to March 31, 2021, total
headcount decreased by around 3.1%. This was driven by a decrease of around 4.6% of the direct workforce reflecting a lower LVP, while the indirect workforce increased by 0.8%.
11
|
Financial Report April – June 2021 |
Other Items
| • | On May 12, 2021, Autoliv announced that its Board of Directors decided to reinstate quarterly dividends and declared a quarterly dividend of $0.62 per share for the second quarter of 2021. “Although the COVID-19 pandemic is not yet behind us, the significant improvement in profitability and free cash flow generation over the recent quarters shows that we have built a solid platform towards our mid-term financial targets” said Jan Carlson, Chairman of the Board of Directors. “It is our ambition to consistently create competitive shareholder value through our purpose-led strategy and operations and I am happy that we can now reinstate our quarterly dividend.” continued Mr. Carlson. |
| • | On May 18, 2021, Autoliv announced plans to construct a new steering wheel manufacturing plant in Aguascalientes, Mexico. When fully operational, the 30,000 sqm/322,000 sq ft facility will have the potential to employ up to 3,000 people. “We are |
| | doing this expansion to meet growing customer demand,” said Kevin Fox, President, Autoliv Americas. “This new facility, along with our Matamoros, Mexico facility, will allow us to continue to provide world-class support to our customers. This investment will increase capacity, but it will also allow us to optimize our manufacturing processes at both facilities and it will create exciting opportunities for our team members in Mexico,” continued Mr. Fox. |
| • | On June 17, 2021, Autoliv announced ambitious climate targets including its plan to become carbon neutral in its own operations by 2030, and aims for net-zero emissions across its supply chain by 2040, and its commitment to the Science Based Targets initiative. |
Next Report
Autoliv intends to publish the quarterly earnings report for the third quarter of 2021 on Friday, October 22, 2021.
Inquiries: Investors and Analysts
Anders Trapp
Vice President Investor Relations
Tel +46 (0)8 5872 0671
Henrik Kaar
Director Investor Relations
Tel +46 (0)8 5872 0614
Inquiries: Media
Gabriella Ekelund
Senior Vice President Communications
Tel +46 (0)70 612 6424
Autoliv, Inc. is obliged to make this information public pursuant to the EU Market Abuse Regulation. The information was submitted for publication, through the agency of the VP of Investor Relations set out above, at 12.00 CET on July 16, 2021.
Footnotes
*Non-U.S. GAAP measure, see enclosed reconciliation tables.
Definitions and SEC Filings
Please refer to www.autoliv.com or to our Annual Report for definitions of terms used in this report. Autoliv’s annual report to stockholders, annual report on Form 10-K, quarterly reports on Form 10‑Q, proxy statements, management certifications, press releases, current reports on Form 8-K and other documents filed with the SEC can be obtained free of charge from Autoliv at the Company’s address. These documents are also available at the SEC’s website www.sec.gov and at Autoliv’s corporate website www.autoliv.com.
This report includes content supplied by IHS Markit Automotive; Copyright © Light Vehicle Production Forecast, June 2021. All rights reserved. IHS Markit is a global supplier of independent industry information. The permission to use IHS Markit copyrighted reports, data and information does not constitute an endorsement or approval by IHS Markit of the manner, format, context, content, conclusion, opinion or viewpoint in which IHS Markit reports, data and information or its derivations are used or referenced herein.
12
|
Financial Report April – June 2021 |
“Safe Harbor Statement”
This report contains statements that are not historical facts but rather forward-looking statements within the meaning of the Private Securities Litigation Reform Act of 1995. Such forward-looking statements include those that address activities, events or developments that Autoliv, Inc. or its management believes or anticipates may occur in the future. All forward-looking statements are based upon our current expectations, various assumptions and/or data available from third parties. Our expectations and assumptions are expressed in good faith and we believe there is a reasonable basis for them. However, there can be no assurance that such forward-looking statements will materialize or prove to be correct as forward-looking statements are inherently subject to known and unknown risks, uncertainties and other factors which may cause actual future results, performance or achievements to differ materially from the future results, performance or achievements expressed in or implied by such forward-looking statements. In some cases, you can identify these statements by forward-looking words such as “estimates”, “expects”, “anticipates”, “projects”, “plans”, “intends”, “believes”, “may”, “likely”, “might”, “would”, “should”, “could”, or the negative of these terms and other comparable terminology, although not all forward-looking statements contain such words. Because these forward-looking statements involve risks and uncertainties, the outcome could differ materially from those set out in the forward-looking statements for a variety of reasons, including without limitation, general economic conditions; the impacts of the coronavirus (COVID-19) pandemic on the Company’s financial condition, business operations, operating costs, liquidity and competition and on the global economy; changes in light vehicle production; fluctuation in vehicle production schedules for which the Company is a supplier; supply chain disruptions and component shortages impacting the Company or the automotive industry; changes in general industry and market conditions or regional growth or decline; changes in and the successful execution of our capacity alignment, restructuring, cost reduction and efficiency initiatives and the market reaction thereto; loss of business
from increased competition; higher raw material, fuel and energy costs; changes in consumer and customer preferences for end products; customer losses; changes in regulatory conditions; customer bankruptcies, consolidations, or restructuring or divestiture of customer brands; unfavorable fluctuations in currencies or interest rates among the various jurisdictions in which we operate; market acceptance of our new products; costs or difficulties related to the integration of any new or acquired businesses and technologies; continued uncertainty in pricing negotiations with customers; successful integration of acquisitions and operations of joint ventures; successful implementation of strategic partnerships and collaborations; our ability to be awarded new business; product liability, warranty and recall claims and investigations and other litigation and customer reactions thereto; higher expenses for our pension and other postretirement benefits, including higher funding needs for our pension plans; work stoppages or other labor issues; possible adverse results of pending or future litigation or infringement claims; our ability to protect our intellectual property rights; negative impacts of antitrust investigations or other governmental investigations and associated litigation relating to the conduct of our business; tax assessments by governmental authorities and changes in our effective tax rate; dependence on key personnel; legislative or regulatory changes impacting or limiting our business; political conditions; dependence on and relationships with customers and suppliers; and other risks and uncertainties identified under the headings “Risk Factors” and “Management’s Discussion and Analysis of Financial Condition and Results of Operations” in our Annual Reports and Quarterly Reports on Forms 10-K and 10-Q and any amendments thereto. For any forward-looking statements contained in this or any other document, we claim the protection of the safe harbor for forward-looking statements contained in the Private Securities Litigation Reform Act of 1995, and we assume no obligation to update publicly or revise any forward-looking statements in light of new information or future events, except as required by law.
13
|
Financial Report April – June 2021 |
Consolidated Statements of Net Income
| | | | | | |
(Dollars in millions, except per share data) | Second quarter | First 6 months | Latest 12 | Full Year |
(Unaudited) | 2021 | 2020 | 2021 | 2020 | months | 2020 |
Airbag and Other products1) | $1,310 | $654 | $2,773 | $1,856 | $5,741 | $4,824 |
Seatbelt products1) | 712 | 394 | 1,491 | 1,037 | 3,077 | 2,623 |
Total net sales | $2,022 | $1,048 | $4,265 | $2,893 | $8,819 | $7,447 |
Cost of sales | (1,638) | (1,033) | (3,422) | (2,548) | (7,074) | (6,201) |
Gross profit | $384 | $14 | $843 | $345 | $1,744 | $1,247 |
| | | | | | |
Selling, general & administrative expenses | (111) | (98) | (219) | (192) | (416) | (389) |
Research, development & engineering expenses, net | (107) | (88) | (213) | (191) | (398) | (376) |
Amortization of intangibles | (3) | (2) | (5) | (5) | (10) | (10) |
Other income (expense), net | 0 | (59) | (4) | (57) | (37) | (90) |
Operating income (loss) | $164 | $(234) | $401 | $(99) | $883 | $382 |
| | | | | | |
Income from equity method investments | 0 | 0 | 2 | 0 | 4 | 2 |
Interest income | 2 | 1 | 2 | 3 | 4 | 5 |
Interest expense | (16) | (16) | (32) | (32) | (73) | (73) |
Other non-operating items, net | 2 | 1 | (4) | (7) | (22) | (25) |
Income (loss) before income taxes | $152 | $(247) | $370 | $(135) | $796 | $291 |
| | | | | | |
Income taxes | (48) | 72 | (108) | 36 | (247) | (103) |
Net income (loss) | $105 | $(174) | $262 | $(99) | $550 | $188 |
| | | | | | |
Less: Net income attributable to non-controlling interest | 0 | 0 | 1 | 0 | 2 | 1 |
Net income (loss) attributable to controlling interest | $104 | $(175) | $261 | $(100) | $548 | $187 |
| | | | | | |
Earnings (loss) per share2, 3) | $1.19 | $(2.00) | $2.98 | $(1.14) | $6.25 | $2.14 |
1) Including Corporate and other sales. 2) Assuming dilution when applicable and net of treasury shares. 3) Participating share awards with right to receive dividend equivalents are (under the two-class method) excluded from EPS calculation. |
14
|
Financial Report April – June 2021 |
Consolidated Balance Sheets
| | | | | | |
| | Jun 30 | Mar 31 | Dec 31 | Sep 30 | Jun 30 |
(Dollars in millions, unaudited) | | 2021 | 2021 | 2020 | 2020 | 2020 |
Assets | | | | | | |
Cash & cash equivalents | | $893 | $1,254 | $1,178 | $1,477 | $1,223 |
Receivables, net | | 1,719 | 1,846 | 1,822 | 1,616 | 1,180 |
Inventories, net | | 901 | 856 | 798 | 714 | 758 |
Prepaid expenses | | 230 | 183 | 164 | 179 | 172 |
Other current assets | | 60 | 260 | 307 | 52 | 50 |
Total current assets | | $3,804 | $4,399 | $4,269 | $4,037 | $3,383 |
| | | | | | |
Property, plant & equipment, net | | 1,833 | 1,810 | 1,869 | 1,779 | 1,753 |
Operating leases right-of-use assets | | 133 | 137 | 141 | 137 | 150 |
Goodwill | | 1,393 | 1,392 | 1,398 | 1,390 | 1,385 |
Intangible assets, net | | 11 | 14 | 14 | 15 | 17 |
Investments and other non-current assets | | 462 | 457 | 466 | 476 | 486 |
Total assets | | $7,636 | $8,210 | $8,157 | $7,833 | $7,175 |
| | | | | | |
Liabilities and equity | | | | | | |
Short-term debt1) | | $363 | $291 | $302 | $1,026 | $493 |
Accounts payable | | 1,125 | 1,215 | 1,254 | 912 | 616 |
Accrued expenses | | 1,066 | 1,323 | 1,270 | 1,011 | 848 |
Operating lease liabilities - current | | 39 | 38 | 37 | 36 | 37 |
Other current liabilities | | 260 | 321 | 284 | 237 | 159 |
Total current liabilities | | $2,852 | $3,188 | $3,147 | $3,221 | $2,152 |
| | | | | | |
Long-term debt1) | | 1,712 | 2,039 | 2,110 | 2,007 | 2,567 |
Pension liability | | 239 | 239 | 248 | 239 | 236 |
Operating lease liabilities - non-current | | 94 | 100 | 103 | 102 | 114 |
Other non-current liabilities | | 125 | 123 | 126 | 151 | 150 |
Total non-current liabilities | | $2,170 | $2,501 | $2,587 | $2,499 | $3,068 |
| | | | | | |
Total parent shareholders’ equity | | 2,600 | 2,507 | 2,409 | 2,100 | 1,942 |
Non-controlling interest | | 15 | 14 | 14 | 14 | 14 |
Total equity | | $2,615 | $2,521 | $2,423 | $2,113 | $1,955 |
| | | | | | |
Total liabilities and equity | | $7,636 | $8,210 | $8,157 | $7,833 | $7,175 |
1) As of September 30, 2020, $600 million of the revolving credit facility loan was classified as short-term debt since it was repaid on October 2, 2020. |
15
|
Financial Report April – June 2021 |
Consolidated Statements of Cash Flow
| | | | | | |
| Second quarter | First 6 months | Latest 12 | Full Year |
(Dollars in millions, unaudited) | 2021 | 2020 | 2021 | 2020 | months | 2020 |
Net income (loss) | $105 | $(174) | $262 | $(99) | $550 | $188 |
Depreciation and amortization | 100 | 87 | 199 | 175 | 394 | 371 |
Other, net | (16) | (85) | 2 | (74) | 89 | 13 |
Changes in operating working capital, net | (125) | 44 | (214) | 25 | 37 | 277 |
Net cash provided by operating activities | $63 | $(128) | $249 | $28 | $1,070 | $849 |
| | | | | | |
Expenditures for property, plant and equipment | (97) | (65) | (191) | (154) | (380) | (344) |
Proceeds from sale of property, plant and equipment | 1 | 1 | 1 | 2 | 4 | 4 |
Net cash used in investing activities | $(96) | $(64) | $(189) | $(152) | $(377) | $(340) |
| | | | | | |
Net cash before financing1) | $(33) | $(192) | $60 | $(124) | $693 | $509 |
| | | | | | |
Decrease in short term debt | (338) | (115) | (291) | (142) | (389) | (240) |
Repayment of long-term debt | – | – | – | – | (723) | (723) |
Increase long-term debt | 39 | 591 | 14 | 1,091 | 100 | 1,177 |
Dividends paid | (54) | – | (54) | (54) | (54) | (54) |
Common stock options exercised | 2 | 0 | 2 | 0 | 3 | 1 |
Dividend paid to non-controlling interests | – | – | – | – | (1) | (1) |
Net cash (used in) provided by financing activities | $(352) | $476 | $(329) | $895 | $(1,064) | $160 |
| | | | | | |
Effect of exchange rate changes on cash | 23 | 32 | (16) | 8 | 40 | 64 |
Increase in cash and cash equivalents | $(361) | $316 | $(285) | $779 | $(330) | $733 |
Cash and cash equivalents at period-start | 1,254 | 907 | 1,178 | 445 | 1,223 | 445 |
Cash and cash equivalents at period-end | $893 | $1,223 | $893 | $1,223 | $893 | $1,178 |
1) Non-U.S. GAAP measure comprised of "Net cash provided by operating activities" and "Net cash used in investing activities". See reconciliation table. |
16
|
Financial Report April – June 2021 |
RECONCILIATION OF U.S. GAAP TO NON-U.S. GAAP MEASURES
In this report we sometimes refer to non-U.S. GAAP measures that we and securities analysts use in measuring Autoliv's performance. We believe that these measures assist investors and management in analyzing trends in the Company's business for the reasons given below. Investors should not consider these non-U.S. GAAP measures as substitutes, but rather as additions, to financial reporting measures prepared in accordance with U.S. GAAP. It should be noted that these measures, as defined, may not be comparable to similarly titled measures used by other companies.
Components in Sales Increase/Decrease
Since the Company historically generates approximately 75% of sales in currencies other than in the reporting currency (i.e. U.S. dollars) and currency rates have been volatile, we analyze the Company's sales trends and performance as changes in organic sales growth. This presents the increase or decrease in the overall U.S. dollar net sales on a comparable basis, allowing separate discussions of the impact of acquisitions/divestitures and exchange rates. The table on page 6 present changes in organic sales growth as reconciled to the change in the total U.S. GAAP net sales.
Trade Working Capital
Due to the need to optimize cash generation to create value for shareholders, management focuses on operationally derived trade working capital as defined in the table below. The reconciling items used to derive this measure are, by contrast, managed as part of our overall management of cash and debt, but they are not part of the responsibilities of day-to-day operations' management.
| Jun 30 | Mar 31 | Dec 31 | Sep 30 | Jun 30 |
(Dollars in millions) | 2021 | 2021 | 2020 | 2020 | 2020 |
Receivables, net | $1,719 | $1,846 | $1,822 | $1,616 | $1,180 |
Inventories, net | $901 | $856 | $798 | $714 | $758 |
Accounts payable | $(1,125) | $(1,215) | $(1,254) | $(912) | $(616) |
Trade Working capital | $1,495 | $1,487 | $1,366 | $1,418 | $1,322 |
17
|
Financial Report April – June 2021 |
Net Debt
Autoliv from time to time enters into “debt-related derivatives” (DRD) as a part of our debt management, as part of efficiently managing the Company’s overall cost of funds. Creditors and credit rating agencies use net debt adjusted for DRD in their analyses of the Company’s debt and therefore we provide this non-U.S. GAAP measure. DRD are fair value adjustments to the carrying value of the underlying debt. Also included in the DRD is the unamortized fair value adjustment related to a discontinued fair value hedge which will be amortized over the remaining life of the debt. By adjusting for DRD, the total financial liability of net debt is disclosed without grossing debt up with currency or interest fair values.
| Jun 30 | Mar 31 | Dec 31 | Sep 30 | Jun 30 |
(Dollars in millions) | 2021 | 2021 | 2020 | 2020 | 2020 |
Short-term debt | $363 | $291 | $302 | $1,026 | $493 |
Long-term debt | 1,712 | 2,039 | 2,110 | 2,007 | 2,567 |
Total debt | $2,075 | $2,330 | $2,411 | $3,033 | $3,060 |
Cash & cash equivalents | (893) | (1,254) | (1,178) | (1,477) | (1,223) |
Debt issuance cost/Debt-related derivatives, net | 18 | 39 | (19) | 17 | 1 |
Net debt | $1,200 | $1,115 | $1,214 | $1,573 | $1,838 |
| | Dec 31 | Dec 31 | Dec 31 | Dec 31 |
(Dollars in millions) | | 2019 | 2018 | 2017 | 2016 |
Short-term debt | | $368 | $621 | $20 | $216 |
Long-term debt | | 1,726 | 1,609 | 1,311 | 1,313 |
Total debt | | $2,094 | $2,230 | $1,330 | $1,529 |
Cash & cash equivalents | | (445) | (616) | (960) | (1,227) |
Debt issuance cost/Debt-related derivatives, net | | 0 | 5 | (3) | (3) |
Net debt | | $1,650 | $1,619 | $368 | $299 |
18
|
Financial Report April – June 2021 |
Leverage ratio
The non-U.S. GAAP measure net debt is also used in the non-U.S. GAAP measure “Leverage ratio”. Management uses this measure to analyze the amount of debt the Company can incur under its debt policy. Management believes that this policy also provides guidance to credit and equity investors regarding the extent to which the Company would be prepared to leverage its operations. In 2021, EBITDA calculation was redefined to exclude other non-operating items and income from equity method investments. Historic EBITDA and leverage ratio has been recalculated resulting in minor adjustments. Autoliv’s policy is to maintain a leverage ratio commensurate with a strong investment grade credit rating. The Company measures its leverage ratio as net debt* adjusted for pension liabilities in relation to adjusted EBITDA*. The long-term target is to maintain a leverage ratio of around 1.0x within a range of 0.5x to 1.5x.
| Jun 30 | Dec 31 | Jun 30 |
(Dollars in millions) | 2021 | 2020 | 2020 |
Net debt1) | $1,200 | $1,214 | $1,838 |
Pension liabilities | 239 | 248 | 236 |
Debt per the Policy | $1,438 | $1,462 | $2,074 |
Net income2) | $550 | $188 | $142 |
Income taxes2) | 247 | 103 | 66 |
Interest expense, net2, 3) | 69 | 68 | 62 |
Other non-operating items, net2) | 22 | 25 | 14 |
Income from equity method investments2) | (4) | (2) | (1) |
Depreciation and amortization of intangibles2) | 394 | 371 | 350 |
Capacity alignments and separation costs2, 4) | 37 | 99 | 105 |
EBITDA per the Policy (Adjusted EBITDA) | $1,313 | $852 | $739 |
Leverage ratio | 1.1 | 1.7 | 2.8 |
1) Short- and long-term debt less cash and cash equivalents and debt-related derivatives. 2) Latest 12 months. 3) Interest expense including cost for extinguishment of debt, if any, less interest income. 4) No separation costs LTM Jun 30, 2021 and Dec 31, 2020. In LTM Jun 30, 2020, separation costs amounted to $1 million. |
19
|
Financial Report April – June 2021 |
Free Cash Flow, Net Cash Before Financing and Cash Conversion
Management uses the non-U.S. GAAP measure free cash flow to analyze the amount of cash flow being generated by the Company’s operations after capital expenditure, net. This measure indicates the Company’s cash flow generation level that enables strategic value creation options such as dividends or acquisitions. For details on free cash flow see the reconciliation table below. Management uses the non-U.S. GAAP measure net cash before financing to analyze and disclose the cash flow generation available for servicing external stakeholders such as shareholders and debt stakeholders. For details on net cash before financing, see the reconciliation table below. Management uses the non-U.S. GAAP measure cash conversion to analyze the proportion of net income that is converted into free cash flow. The measure is a tool to evaluate how efficient the Company utilizes its resources. For details on cash conversion, see the reconciliation table below.
| | | | | | |
| Second quarter | First 6 months | Latest 12 | Full Year |
(Dollars in millions) | 2021 | 2020 | 2021 | 2020 | months | 2020 |
Net income (loss) | $105 | $(174) | $262 | $(99) | $550 | $188 |
Changes in operating working capital | (125) | 44 | (214) | 25 | 37 | 277 |
Depreciation and amortization | 100 | 87 | 199 | 175 | 394 | 371 |
Other, net | (16) | (85) | 2 | (74) | 89 | 13 |
Operating cash flow | $63 | $(128) | $249 | $28 | $1,070 | $849 |
Capital expenditure, net | (96) | (64) | (189) | (152) | (377) | (340) |
Free cash flow1) | $(33) | $(192) | $60 | $(124) | $693 | $509 |
Net cash before financing | $(33) | $(192) | $60 | $(124) | $693 | $509 |
Cash conversion2) | n/a | n/a | 22.8% | n/a | 126% | 270% |
1) Operating cash flow less Capital expenditures, net. 2) Free cash flow relative to Net income. |
| Full year | Full year | | Full year | Full year |
(Dollars in millions) | 2019 | 20181) | | 20171) | 20161) |
Net income | $463 | $184 | | $303 | $562 |
Changes in operating assets and liabilities | 47 | (229) | | (0) | (78) |
Depreciation and amortization | 351 | 397 | | 426 | 383 |
Goodwill impairment charges | – | – | | 234 | – |
Other, net4) | (220) | 239 | | (27) | 2 |
Operating cash flow | $641 | $591 | | $936 | $868 |
EC antitrust payment | (203) | – | | – | – |
Operating cash flow excl antitrust | $844 | $591 | | $936 | $868 |
Capital expenditure, net | (476) | (555) | | (570) | (499) |
Free cash flow2) | $165 | $36 | | $366 | $370 |
Free cash flow excl antitrust payment5) | $368 | $36 | | $366 | $370 |
Acquisitions of businesses and other, net | – | (73) | | (128) | (227) |
Net cash before financing | $165 | $(37) | | $239 | $142 |
Cash conversion3) | 35.6% | 19.5% | | 121% | 65.8% |
Cash conversion excl antitrust6) | 79.4% | 19.5% | | 121% | 65.8% |
1) Including Discontinued Operations. 2) Operating cash flow less Capital expenditures, net. 3) Free cash flow relative to Net income. 4) Including EC antitrust non-cash provision 2018 and EC antitrust payment 2019. 5) For 2019, Operating cash flow excluding EC antitrust payment less Capital expenditures, net. 6) For 2019, Free cash flow excluding EC antitrust payment relative to Net income. |
20
|
Financial Report April – June 2021 |
Items Affecting Comparability
We believe that comparability between periods is improved through the exclusion of certain items. To assist investors in understanding the operating performance of Autoliv's business, it is useful to consider certain U.S. GAAP measures exclusive of these items. Accordingly, the tables below reconcile from U.S. GAAP to the equivalent non-U.S. GAAP measure.
| | | | | | |
| Second quarter 2021 | Second quarter 2020 |
(Dollars in millions, except per share data) | Reported
U.S. GAAP | Adjust-ments1) | Non-U.S.
GAAP | Reported
U.S. GAAP | Adjust-ments1) | Non-U.S.
GAAP |
Operating income (loss) | $164 | $1 | $166 | $(234) | $62 | $(172) |
Operating margin, % | 8.1 | 0.1 | 8.2 | (22.3) | 5.9 | (16.4) |
Income (loss) before taxes | $152 | $1 | $154 | $(247) | $62 | $(185) |
Net income (loss) attributable to controlling interest | $104 | $1 | $105 | $(175) | $52 | $(123) |
Return on capital employed, %2) | 17.7 | 0.1 | 17.8 | (25.0) | 6.8 | (18.2) |
Return on total equity, %3) | 16.3 | 0.2 | 16.5 | (34.9) | 10.8 | (24.1) |
Earnings (loss) per share4, 5) | $1.19 | $0.01 | $1.20 | $(2.00) | $0.60 | $(1.40) |
1) Costs for capacity alignment. 2) Annualized operating income and income from equity method investments, relative to average capital employed. 3) Annualized income relative to average total equity. 4) Assuming dilution and net of treasury shares. 5) Participating share awards with right to receive dividend equivalents are (under the two-class method) excluded from the EPS calculation. |
| | | | | | |
| First 6 months 2021 | First 6 months 2020 |
| Reported
U.S. GAAP | Adjust-ments1) | Non-U.S.
GAAP | Reported
U.S. GAAP | Adjust-ments1) | Non-U.S.
GAAP |
Operating income (loss) | $401 | $1 | $403 | $(99) | $64 | $(36) |
Operating margin, % | 9.4 | 0.0 | 9.4 | (3.4) | 2.2 | (1.2) |
Income (loss) before taxes | $370 | $1 | $371 | $(135) | $64 | $(71) |
Net income (loss) attributable to controlling interest | $261 | $1 | $262 | $(100) | $54 | $(46) |
Capital employed | $3,815 | $1 | $3,816 | $3,793 | $54 | $3,847 |
Return on capital employed, %2) | 21.8 | 0.1 | 21.9 | (5.3) | 3.4 | (1.9) |
Return on total equity, %3) | 20.8 | 0.1 | 20.9 | (9.7) | 5.3 | (4.4) |
Earnings (loss) per share4, 5) | $2.98 | $0.01 | $2.99 | $(1.14) | $0.61 | $(0.53) |
Total parent shareholders' equity per share | $29.72 | $0.01 | $29.73 | $22.24 | $0.61 | $22.85 |
1) Costs for capacity alignment. 2) Annualized operating income and income from equity method investments, relative to average capital employed. 3) Annualized income relative to average total equity. 4) Assuming dilution when applicable and net of treasury shares. 5) Participating share awards with right to receive dividend equivalents are (under the two-class method) excluded from the EPS calculation. |
| Latest 12 months | | Full year 2020 |
(Dollars in millions) | Reported
U.S. GAAP | Adjust-ments1) | Non-U.S.
GAAP | | Reported
U.S. GAAP | Adjust-ments1) | Non-U.S.
GAAP |
Operating income | $883 | $37 | $919 | | $382 | $99 | $481 |
Operating margin, % | 10.0 | 0.4 | 10.4 | | 5.1 | 1.4 | 6.5 |
1) Costs for capacity alignment. |
| Full year 2019 | | Full year 2018 |
(Dollars in millions) | Reported
U.S. GAAP | Adjust-ments1) | Non-U.S.
GAAP | | Reported
U.S. GAAP | Adjust-ments1) | Non-U.S.
GAAP |
Operating income | $726 | $49 | $774 | | $686 | $222 | $908 |
Operating margin, % | 8.5 | 0.6 | 9.1 | | 7.9 | 2.6 | 10.5 |
1) Costs for capacity alignment, antitrust related matters and separation of our business segments. |
21
|
Financial Report April – June 2021 |
| Full year 2017 | | Full year 2016 |
(Dollars in millions) | Reported
U.S. GAAP | Adjust-ments1) | Non-U.S.
GAAP | | Reported
U.S. GAAP | Adjust-ments1) | Non-U.S.
GAAP |
Operating income | $860 | $40 | $899 | | $831 | $35 | $866 |
Operating margin, % | 10.6 | 0.5 | 11.1 | | 10.5 | 0.4 | 10.9 |
1) Costs for capacity alignment and antitrust related matters. |
| | | | |
Items included in Non-U.S. GAAP adjustments | Second quarter 2021 | Second quarter 2020 |
| Adjustment
Millions | Adjustment
Per share | Adjustment
Millions | Adjustment
Per share |
Capacity alignment | $1 | $0.02 | $62 | $0.71 |
Total adjustments to operating income | $1 | $0.02 | $62 | $0.71 |
Tax on non-U.S. GAAP adjustments1) | $0 | $0.00 | $(10) | $(0.11) |
Total adjustments to net income | $1 | $0.01 | $52 | $0.60 |
Average number of shares outstanding - diluted2) | | 87.6 | | 87.4 |
| | | | |
Annualized adjustment on return on capital employed | $6 | | $248 | |
Adjustment return on capital employed, % | 0.1 | | 6.8 | |
| | | | |
Annualized adjustment on return on total equity | $6 | | $209 | |
Adjustment return on total equity, % | 0.2 | | 10.8 | |
1) The tax is calculated based on the tax laws in the respective jurisdiction(s) of the adjustment(s). 2) Annualized average number of outstanding shares |
| | | | |
| | | | |
| | | | |
Items included in Non-GAAP adjustments | First 6 months 2021 | First 6 months 2020 |
| Adjustment
Millions | Adjustment
Per share | Adjustment
Millions | Adjustment
Per share |
Capacity alignment | $1 | $0.02 | $64 | $0.73 |
Total adjustments to operating income | $1 | $0.02 | $64 | $0.73 |
Tax on non-U.S. GAAP adjustments1) | $0 | $0.00 | $(10) | $(0.12) |
Total adjustments to net income | $1 | $0.01 | $54 | $0.61 |
Average number of shares outstanding - diluted2) | | 87.6 | | 87.4 |
| | | | |
Annualized adjustment on Return on capital employed | $3 | | $128 | |
Adjustment Return on capital employed, % | 0.1 | | 3.4 | |
| | | | |
Annualized adjustment on Return on total equity | $3 | | $108 | |
Adjustment return on total equity, % | 0.1 | | 5.3 | |
1) The tax is calculated based on the tax laws in the respective jurisdiction(s) of the adjustment(s). 2) Annualized average number of outstanding shares |
22
|
Financial Report April – June 2021 |
Multi-year Summary
Continuing Operations unless noted
| | | | | |
(Dollars in millions, unaudited) | 2020 | 2019 | 2018 | 2017 | 2016 |
Sales and Income | | | | | |
Net sales | $7,447 | $8,548 | $8,678 | $8,137 | $7,922 |
Airbag sales1) | 4,824 | 5,676 | 5,699 | 5,342 | 5,256 |
Seatbelt sales | 2,623 | 2,871 | 2,980 | 2,794 | 2,665 |
Operating income | 382 | 726 | 686 | 860 | 831 |
Net income attributable to controlling interest | 187 | 462 | 376 | 586 | 558 |
Earnings per share (US$) – basic2) | 2.14 | 5.29 | 4.32 | 6.70 | 6.33 |
Earnings per share (US$) – assuming dilution2, 3) | 2.14 | 5.29 | 4.31 | 6.68 | 6.32 |
Gross margin, %4) | 16.7 | 18.5 | 19.7 | 20.6 | 20.6 |
R,D&E net in relation to sales, % | (5.0) | (4.7) | (4.8) | (4.6) | (4.5) |
S,G &A net in relation to sales, % | (5.2) | (4.7) | (4.5) | (5.0) | (5.0) |
Operating margin, %5) | 5.1 | 8.5 | 7.9 | 10.6 | 10.5 |
Adjusted operating margin, %6, 7) | 6.5 | 9.1 | 10.5 | 11.1 | 10.9 |
Balance Sheet | | | | | |
Trade working capital | 1,366 | 1,417 | 1,396 | 1,444 | 1,245 |
Trade working capital in relation to sales, %8) | 13.6 | 16.2 | 15.9 | 16.7 | 15.7 |
Receivables outstanding in relation to sales, %8) | 18.1 | 18.6 | 19.0 | 19.6 | 19.1 |
Inventory outstanding in relation to sales, %8) | 7.9 | 8.5 | 8.6 | 8.2 | 7.7 |
Payables outstanding in relation to sales, %8) | 12.5 | 10.8 | 11.7 | 11.1 | 11.1 |
Total equity | 2,423 | 2,122 | 1,897 | 4,169 | 3,926 |
Total parent shareholders’ equity per share (US$) | 27.56 | 24.19 | 21.63 | 46.38 | 41.69 |
Current assets excluding cash | 3,091 | 2,557 | 2,670 | 2,598 | 2,269 |
Property, plant and equipment, net | 1,869 | 1,816 | 1,690 | 1,609 | 1,329 |
Intangible assets (primarily goodwill) | 1,412 | 1,410 | 1,423 | 1,440 | 1,430 |
Capital employed | 3,637 | 3,772 | 3,516 | 4,538 | 4,225 |
Net debt7) | 1,214 | 1,650 | 1,619 | 368 | 299 |
Total assets | 8,157 | 6,771 | 6,722 | 6,947 | 6,565 |
Long-term debt | 2,110 | 1,726 | 1,609 | 1,311 | 1,313 |
Return on capital employed, %9, 10) | 10 | 20 | 17 | n/a | n/a |
Return on total equity, %10, 11) | 9 | 23 | 13 | n/a | n/a |
Total equity ratio, % | 30 | 31 | 28 | 49 | 48 |
Cash flow and other data | | | | | |
Operating Cash flow12) | 849 | 641 | 591 | 936 | 868 |
Depreciation and amortization12) | 371 | 351 | 397 | 426 | 383 |
Capital expenditures, net12) | 340 | 476 | 555 | 570 | 499 |
Capital expenditures, net in relation to sales, %12) | 4.6 | 5.6 | 5.7 | 5.5 | 4.9 |
Free Cash flow7, 12, 13) | 509 | 165 | 36 | 366 | 369 |
Cash conversion, %7, 12, 14) | 270 | 35.6 | 19.5 | 121 | 65.7 |
Direct shareholder return12, 15) | 54 | 217 | 214 | 366 | 203 |
Cash dividends paid per share (US$) | 0.62 | 2.48 | 2.46 | 2.38 | 2.30 |
Number of shares outstanding (millions)16) | 87.4 | 87.2 | 87.1 | 87.0 | 88.2 |
Number of employees, December 31 | 61,000 | 58,900 | 57,700 | 56,700 | 55,800 |
1) Including steering wheels, inflators and initiators. 2) Participating share awards with right to receive dividend equivalents are (under the two-class method) excluded from the EPS calculation. 3) Assuming dilution and net of treasury shares. 4) Gross profit relative to sales. 5) Operating income relative to sales. 6) Excluding costs for capacity alignment, antitrust related matters and separation of our business segments. 7) Non-US GAAP measure, for reconciliation see tables above. 8) Relative to annualized fourth quarter sales. 9) Operating income and income from equity method investments, relative to average capital employed. 10) The Company has decided not to recalculate prior periods since the distribution of Veoneer had a significant impact on total equity and capital employed making the comparison less meaningful. 11) Income relative to average total equity. 12) Including Discontinued Operations. 13) Operating cash flow less Capital expenditures, net. 14) Free cash flow relative to Net income. 15) Dividends paid and Shares repurchased. 16) At year end, excluding dilution and net of treasury shares. |
23