Exhibit 99.1

Saving More Lives Financial Report July – September 2021 Stockholm, Sweden, October 22, 2021 (NYSE: ALV and SSE: ALIV.sdb)
Financial Report July – September 2021 |
Q3 2021: Accelerating global supply chain disruptions
Financial highlights Q3 2021 $1,847m net sales 12% organic sales decline* 5.4% operating margin 5.6% adjusted operating margin* $0.68 EPS - a decrease of $0.44 $0.73 adjusted EPS* - a decrease of $0.75 | | Full year 2021 indications Around 11% net sales growth Around 8% organic sales growth Around 8% adjusted operating margin |
Key business developments in the third quarter of 2021
| • | Significant organic sales decline* as global LVP declined by 20% vs. Q3 last year (according to IHS Markit Oct 2021). Sales decreased organically by 12%, yet outperformed global LVP by almost 8pp, mainly due to product launches and positive vehicle mix effects and despite negative geographical mix effects. All regions outperformed LVP by 6-16pp. |
| • | Profitability declined due to the lower sales and higher raw material costs. Adjusted operating margin* declined by 4.5pp to 5.6%. Return on capital employed declined to 10.5% and return on equity declined to 9.3%. |
| • | Strong balance sheet and leverage ratio well within target range. Operating cash flow of $188 million and free cash flow* of $77 million support continued balance sheet improvement. A dividend of $0.62 per share was declared and paid in the quarter. Net debt* declined, resulting in a leverage ratio* of 1.1x. |
*For non-U.S. GAAP measures see enclosed reconciliation tables. All change figures in this release compare to the same period of previous year except when stated otherwise.
Key Figures
| (Dollars in millions, except per share data) | Q3 2021 | Q3 2020 | Change | 9 M 2021 | 9 M 2020 | Change |
| Net sales | $1,847 | $2,037 | (9.3)% | $6,111 | $4,931 | 23.9% |
| Operating income | $99 | $175 | (43.2)% | $500 | $75 | 564% |
| Adjusted operating income1) | $103 | $206 | (49.7)% | $506 | $170 | 197% |
| Operating margin | 5.4% | 8.6% | (3.2)pp | 8.2% | 1.5% | 6.7pp |
| Adjusted operating margin1) | 5.6% | 10.1% | (4.5)pp | 8.3% | 3.5% | 4.8pp |
| Earnings (loss) per share, diluted2, 3) | $0.68 | $1.12 | (39.4)% | $3.65 | $(0.02) | n/a |
| Adjusted earnings per share, diluted1, 2, 3) | $0.73 | $1.48 | (50.7)% | $3.72 | $0.95 | 291% |
| Operating cash flow | $188 | $352 | (46.6)% | $437 | $380 | 15.0% |
| Return on capital employed4) | 10.5% | 18.7% | (8.2)pp | 18.1% | 2.7% | 15.4pp |
| Adjusted return on capital employed 1,5) | 10.9% | 21.7% | (10.8)pp | 18.3% | 6.1% | 12.2pp |
| 1) Excluding costs for capacity alignment and in 2020 antitrust related matters. 2) Assuming dilution when applicable and net of treasury shares. 3) Participating share awards with right to receive dividend equivalents are (under the two-class method) excluded from the EPS calculation. 4) Annualized operating income and income from equity method investments, relative to average capital employed. 5) Annualized operating income and income from equity method investments, relative to average capital employed. Non-U.S. GAAP measure, see reconciliation table. |
Comments from Mikael Bratt, President & CEO | | Despite the challenging environment, our leverage ratio* remains well within our target range and we declared and paid a dividend of $0.62 per share in the quarter. Through successful mitigation efforts, the raw materials headwind in the third quarter was slightly lower than expected. However, we see new raw material headwinds, including higher magnesium and resin costs, which means we still expect a full year operating margin headwind from raw materials of around 130 basis points. We expect supply disruptions to continue to impact LVP negatively in the fourth quarter, and although there are some indications of moderate improvement in semiconductor availability in Asia and North America, visibility remains poor. We are planning and implementing stricter measures to mitigate the current adverse business headwinds, including capacity alignments in Europe and the US. However, as a result of the significantly reduced LVP outlook for the year, we are adjusting our full year indication. Based on an assumption of around 0% global LVP growth for the full year 2021, we expect an organic sales growth of around 8%, and an adjusted operating margin of around 8%. With our relentless focus on quality and execution as well as mitigating near term headwinds, we continue to drive forward towards our medium term targets. This and more will be explored at our virtual CMD on November 16, 2021. |

| The adverse business trends from earlier in the year accelerated in the third quarter. Supply shortages of semiconductors and other components led to a third quarter global LVP decline of 20% vs. a year earlier, which was 17pp lower than what was expected at the beginning of the quarter (according to IHS Markit, October 2021). | |
The decline in LVP, unpredictable changes in customer call-offs and higher raw material costs resulted in reduced profitability despite significant cost control measures, including headcount reductions. I am pleased that we outperformed the global LVP by almost 8pp, significantly reducing the impact of the 20% drop in LVP. We had a record number of new launches in the quarter and expect a full year record as well. This includes products to a large number of electrified vehicles, a market that amounted to around 10% of our total sales last year. We expect an almost doubling of sales to this market in 2021. I am also pleased with our order intake for the first nine months of the year and that we continue to implement the projects and actions needed to support our growth opportunities and our journey to reach the next level of profitability as expressed by our medium term targets. | |
2
Financial Report July – September 2021 |
Full year 2021 indications
Our outlook indications for 2021 reflect continuing uncertainty in the automotive markets and are mainly based on our customer call-offs and global LVP outlook according to IHS Markit, indicating a full year 2021 global LVP growth of around 0%.
| | Full Year Indication | | Full Year Indication |
| Net sales growth | Around 11% | Tax rate2) | Around 30% |
| Organic sales growth | Around 8% | Operating cash flow3) | Around USD 700m |
| Adjusted operating margin1) | Around 8% | Capex, net % of sales | Below 6% |
| R,D&E, net % of sales | Around 5% | Organic growth vs LVP growth | Around +8pp |
1) Excluding costs for capacity alignments and antitrust related matters. 2) Excluding unusual tax items. 3) Excluding unusual items.
The forward-looking non-U.S. GAAP financial measures above are provided on a non-U.S. GAAP basis. Autoliv has not provided a U.S. GAAP reconciliation of these measures because items that impact these measures, such as costs related to capacity alignments and antitrust matters, cannot be reasonably predicted or determined. As a result, such reconciliation is not available without unreasonable efforts and Autoliv is unable to determine the probable significance of the unavailable information.
Conference call and webcast
An earnings conference call will be held at 2:00 p.m. CET today, October 22, 2021. Information regarding how to participate is available on www.autoliv.com. The presentation slides for the conference call will be available on our website shortly after the publication of this financial report.
Business update relating to COVID-19 pandemic and other matters
The COVID-19 pandemic continued to impact our business in the third quarter 2021 indirectly through limited LVP by our customers caused by global semiconductor shortage and other industry supply chain disruptions. Third quarter 2021 global LVP was around 17% lower than expected at the beginning of the quarter (according to IHS Markit October 2021). The lower than anticipated LVP negatively impacted our sales and profitability. Supply chain disruptions leading to low customer demand visibility and material changes to call-offs with short notice also negatively impacted our production efficiency and profitability in the quarter.
Direct COVID-19 related costs, such as personal protective equipment, quarantine costs, premium freight and other items, were around $3 million in Q3 2021 and around $11 million for the first nine months of 2021. Governmental support in connection with furloughing, short-term work weeks, and other similar activities was not material to our financial results in Q3 2021 or in the first nine months of 2021.
We expect the current industry-wide semiconductor supply shortage will continue to negatively impact LVP, and hence our sales and profitability, in the fourth quarter of 2021. A stabilization of such supply may not emerge until in 2022. We also expect adverse cost development from rising raw material prices through the remainder of 2021 and into 2022.
Volvo Cars has recalled a large number of vehicles globally, relating to the malfunction of inflators produced by ZF. The recalled ZF inflators were included in airbag modules supplied by Autoliv to Volvo Cars. The ZF inflator in question uses a different formula of gas generant than the formula that Autoliv uses in its inflators. No liability accrual has been made. Autoliv anticipates that any losses net of insurance claims and claims against ZF will be immaterial.
In response to ongoing challenging market conditions, Autoliv management continued to implement strict cost control measures in the third quarter 2021, including the capacity alignments of certain production operations in Europe and the US. The situation is monitored closely, and further actions are being evaluated.
This report includes content supplied by IHS Markit Automotive; Copyright © Light Vehicle Production Forecast, October, 2021. All rights reserved.
3
Financial Report July – September 2021 |
Key Performance Trends
Sales Development by region | | Adj. operating income and margin* |
| | |
| | 
|
| | |
Capex and D&A | | Operating Cash Flow excl EC antitrust payment* |
| | |
| | 
|
| | |
Return on Capital Employed | | Cash Conversion* |
| | |

| | 
|
Key definitions ---------------------------------------------------------------------------------------------------------
Capex: Capital Expenditures, net.
D&A: Depreciation and Amortization.
Adj. operating income and margin*: Operating income adjusted for capacity alignments, antitrust related matters and separation of our business segments. Capacity alignments include non-recurring costs related to our structural efficiency and business cycle management programs.
Operating cash flow excluding EC antitrust payment*: Management estimate for Continuing Operations derived from cash flow including Discontinued Operations 2017-2018. Adjusted for EC antitrust payment of $203 million in 2019.
Cash conversion*: Free cash flow* in relation to net income adjusted for EC antitrust accrual in 2018 and payment in 2019. Free cash flow defined as operating cash flow less capital expenditure, net.
4
Financial Report July – September 2021 |
Consolidated sales development
Third quarter 2021
| Consolidated sales | | Third quarter | Reported
(U.S. GAAP) | Currency
effects1) | Organic
change* |
| (Dollars in millions) | | 2021 | 2020 |
| Airbag Products and Other2) | | $1,199 | $1,332 | (9.9)% | 2.2% | (12.1)% |
| Seatbelt Products2) | | $647 | $706 | (8.3)% | 3.3% | (11.6)% |
| Total | | $1,847 | $2,037 | (9.3)% | 2.6% | (11.9)% |
| | | | | | | |
| Asia | | $778 | $806 | (3.5)% | 3.3% | (6.9)% |
| Whereof: | China | $414 | $425 | (2.5)% | 7.4% | (10.0)% |
| | Japan | $160 | $180 | (11.4)% | (3.2)% | (8.3)% |
| | RoA | $204 | $201 | 1.4% | 0.5% | 0.9% |
| Americas | | $596 | $693 | (14.1)% | 2.2% | (16.3)% |
| Europe | | $473 | $538 | (12.0)% | 1.9% | (13.9)% |
| Total | | $1,847 | $2,037 | (9.3)% | 2.6% | (11.9)% |
| 1) Effects from currency translations. 2) Including Corporate and other sales. |
| Sales by product - Airbags All major product categories within Airbags declined organically* in the quarter except knee airbags and front center airbags. The largest contributor to the decline was inflatable curtains and side airbags followed by steering wheels. | | Sales by product - Seatbelts The main contributor to Seatbelt products organic decline* was Europe and Americas. Seatbelt products declined organically in all regions except South America and India. |
| | | |
| | | |
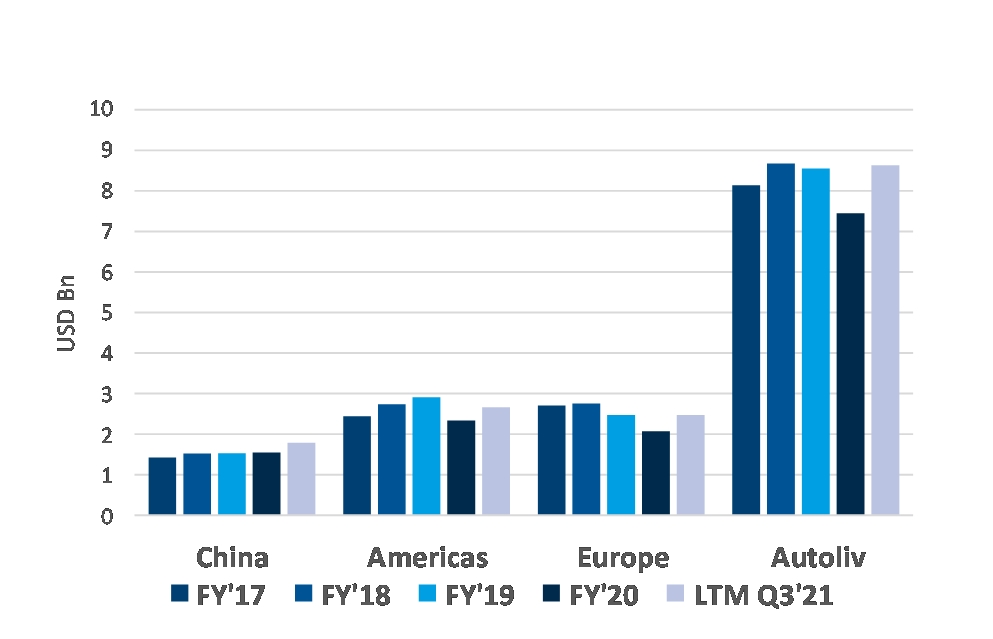
| Sales by region Our global organic sales* declined by 12% compared to the LVP decline of 20% (according to IHS Markit October 2021). The almost 8pp outperformance was largely due to product launches, partly offset by negative geographical mix | | effects as LVP in higher content per vehicle markets such as Europe and North America declined more than lower CPV markets such as China and Rest of Asia. All regions outperformed LVP by 6-16pp. LVP in all major regions declined by between 13 and 30%. |
| Q3 2021 organic growth* | Americas | Europe | China | Japan | Rest of Asia | Global |
| Autoliv | (16)% | (14)% | (10)% | (8)% | 0.9% | (12)% |
| Main growth drivers | Toyota, Ford | Hyundai/Kia | XPeng, Ford, Chery | Mitsubishi, Nissan | Mitsubishi, Toyota, Tata | Mitsubishi, Tata, Mahindra |
| Main decline drivers | Honda, Nissan, GM | Stellantis, VW, Renault | VW, Great Wall, Honda | Honda, Toyota, Mazda | Hyundai/Kia, SsangYong, GM | Honda, VW, Stellantis |
Light vehicle production development
Change vs same period last year according to IHS Markit
| Q3 2021 | Americas | Europe | China | Japan | Rest of Asia | Global |
| LVP (Oct 2021) | (23)% | (30)% | (16)% | (24)% | (4.8)% | (20)% |
| LVP (Jul 2021) | (3.6)% | (5.9)% | (4.7)% | 1.2% | 2.6% | (2.7)% |
5
Financial Report July – September 2021 |
Consolidated sales development
First nine months 2021
| Consolidated sales | | First 9 months | Reported
(U.S. GAAP) | Currency
effects1) | Organic
change* |
| (Dollars in millions) | | 2021 | 2020 |
| Airbag Products and Other2) | | $3,973 | $3,188 | 24.6% | 3.6% | 21.1% |
| Seatbelt Products2) | | $2,139 | $1,743 | 22.7% | 5.1% | 17.6% |
| Total | | $6,111 | $4,931 | 23.9% | 4.1% | 19.8% |
| | | | | | | |
| Asia | | $2,449 | $1,991 | 23.0% | 4.7% | 18.3% |
| Whereof: | China | $1,228 | $989 | 24.2% | 8.2% | 16.0% |
| | Japan | $546 | $488 | 11.9% | (0.8)% | 12.7% |
| | RoA | $675 | $514 | 31.2% | 3.3% | 27.9% |
| Americas | | $1,903 | $1,579 | 20.5% | 1.6% | 18.9% |
| Europe | | $1,760 | $1,361 | 29.4% | 6.1% | 23.2% |
| Total | | $6,111 | $4,931 | 23.9% | 4.1% | 19.8% |
| 1) Effects from currency translations. 2) Including Corporate and other sales. |
| First nine months 2021 development Sales by product - Airbags All major product categories within Airbags grew strongly organically* in the first nine months with exception of inflators. The largest contributor to growth was steering wheels and inflatable curtains, followed by passenger airbags, driver airbags and side airbags. | | Sales by product - Seatbelts Seatbelts showed strong organic* growth with largest contributing markets being Europe, the Americas and China. The only area with a negative growth was Japan. |
| | | |
| | | |
| Sales by region The global organic sales growth* of 20% was 10pp better than LVP (according to IHS Markit October 2021). Sales increased organically in all regions. The largest organic sales increase drivers were | | Europe and Americas, followed by China, Rest of Asia and Japan. Our organic sales development outperformed LVP in all regions - by 18pp in Europe, by 11pp in Japan, by 9pp in Americas, by 7pp in China and by 3pp in Rest of Asia. |
| First nine months 2021 organic growth* | Americas | Europe | China | Japan | Rest of Asia | Global |
| Autoliv | 19% | 23% | 16% | 13% | 28% | 20% |
| Main growth drivers | Toyota, Stellantis, Ford | VW, Stellantis, Daimler | GM, Great Wall, XPeng | Mitsubishi, Toyota, Nissan | Mitsubishi, Suzuki, Tata | Toyota, Stellantis, GM |
| Main decline drivers | Subaru | n/a | VW, Hyundai/Kia, BYD | Honda | SsangYong, | BYD, SsangYong |
Light vehicle production development
Change vs same period last year
| First nine months 2021 | Americas | Europe | China | Japan | Rest of Asia | Global |
| IHS LVP (October 2021) | 9.6% | 5.5% | 8.7% | 1.2% | 25% | 9.7% |
| IHS LVP (Jan 2021) | 37% | 24% | 13% | 14% | 25% | 22% |
6
Financial Report July – September 2021 |
Key launches in the third quarter 2021
| | | | |
Jeep Grand Wagoneer | | Kia Sportage | | Toyota Corolla Cross |

| | 
| | 
|

| | 
| | 
|
| | | | |
VW Taigo | | Fiat Pulse | | Rivian R1T |
| | | | |

| | 
| | 
|

| | 
| | 
|
| | | | |
Nissan Frontier | | Wey Latte | | Toyota Aqua |

| | 
| | 
|

| | 
| | 
|
| | | | |

| Driver/Passenger Airbags | | 
| Seatbelts | | 
| Side Airbags |
| | | | |

| Head/Inflatable Curtain Airbags | | 
| Steering Wheel | | 
| Knee Airbag |
| | | | |

| Front Center Airbag | | 
| Bag-in-Belt | | 
| Pyrotechnical Safety Switch |
| | | | |

| Pedestrian Airbag | | 
| Hood Lifter | | 
| Available as EV/PHEV |
| | | | | | | |
7
Financial Report July – September 2021 |
Financial development
Selected income statement items
| | | | | | | |
Condensed income statement | Third quarter | | First 9 months |
(Dollars in millions, except per share data) | 2021 | 2020 | Change | | 2021 | 2020 | Change |
Net sales | $1,847 | $2,037 | (9.3)% | | $6,111 | $4,931 | 23.9% |
Cost of sales | $(1,546) | $(1,638) | (5.6)% | | $(4,968) | $(4,186) | 18.7% |
Gross profit | $301 | $400 | (24.8)% | | $1,143 | $745 | 53.4% |
S,G&A | $(101) | $(92) | 9.9% | | $(319) | $(284) | 12.6% |
R,D&E, net | $(98) | $(102) | (4.0)% | | $(311) | $(292) | 6.4% |
Amortization of intangibles | $(2) | $(2) | (0.6)% | | $(8) | $(8) | 0.0% |
Other income (expense), net | $(1) | $(29) | (98.2)% | | $(5) | $(86) | (94.5)% |
Operating income | $99 | $175 | (43.2)% | | $500 | $75 | 564% |
Adjusted operating income1) | $103 | $206 | (49.7)% | | $506 | $170 | 197% |
Financial and non-operating items, net | $(12) | $(26) | (52.5)% | | $(44) | $(62) | (29.1)% |
Income before taxes | $87 | $149 | (41.5)% | | $456 | $13 | n/a |
Tax rate | 30.9% | 33.5% | (2.6)pp | | 29.5% | 104.4% | (74.9)pp |
Net income (loss) | $60 | $99 | (39.3)% | | $322 | $(1) | n/a |
Earnings (loss) per share2, 3) | $0.68 | $1.12 | (39.4)% | | $3.65 | $(0.02) | n/a |
Adjusted earnings per share1, 2, 3) | $0.73 | $1.48 | (50.7)% | | $3.72 | $0.95 | 291% |
| | | | | | | |
Gross margin | 16.3% | 19.6% | (3.3)pp | | 18.7% | 15.1% | 3.6pp |
S,G&A, in relation to sales | (5.5)% | (4.5)% | (1.0)pp | | (5.2)% | (5.8)% | 0.6pp |
R,D&E, net in relation to sales | (5.3)% | (5.0)% | (0.3)pp | | (5.1)% | (5.9)% | 0.8pp |
Operating margin | 5.4% | 8.6% | (3.2)pp | | 8.2% | 1.5% | 6.7pp |
Adjusted operating margin1) | 5.6% | 10.1% | (4.5)pp | | 8.3% | 3.5% | 4.8pp |
| | | | | | | |
Other data | | | | | | | |
No. of shares at period-end in millions4) | 87.5 | 87.3 | 0.2% | | 87.5 | 87.3 | 0.2% |
Weighted average no. of shares in millions5) | 87.4 | 87.3 | 0.1% | | 87.4 | 87.3 | 0.1% |
Weighted average no. of shares in millions, diluted5) | 87.7 | 87.5 | 0.2% | | 87.7 | 87.3 | 0.5% |
1) Non-U.S. GAAP measure, excluding costs for capacity alignment and in 2020 antitrust related matters. See reconciliation table. 2) Assuming dilution when applicable and net of treasury shares. 3) Participating share awards with right to receive dividend equivalents are (under the two-class method) excluded from the EPS calculation. 4) Excluding dilution and net of treasury shares. 5) Net of treasury shares. |
Third quarter 2021 development
Gross profit decreased by $99 million and the gross margin decreased by 3.3pp compared to the same quarter 2020. The gross margin decrease was primarily driven by the lower sales and higher raw material costs, partly offset by positive FX effects.
S,G&A costs increased by $9 million compared to the prior year, mainly relating to IT and improvement projects.
R,D&E, net costs decreased by $4 million compared to the prior year, mainly relating to currency translation effects. In relation to sales, R,D&E costs increased from 5.0% to 5.3%.
Other income (expense), net improved by $28 million compared to prior year, mainly due to lower capacity alignment accruals.
Operating income decreased by $76 million compared to the same period in 2020, mainly as a consequence of the lower gross profit partly offset by lower capacity alignment accruals.
Adjusted operating income* decreased by $103 million compared to the prior year, mainly due to lower gross profit.
Financial and non-operating items, net, improved by $14 million, mainly due to lower interest expense, net, but also due to positive effects from currency translations and other financial items.
Income before taxes decreased by $62 million compared to the prior year, mainly due to the lower operating income partly offset by improved financial and non-operating items, net.
Tax rate was 30.9%, compared to 33.5% in the same period last year, where last year was impacted by unfavorable country mix.
Earnings per share, diluted decreased by $0.44 compared to a year earlier, where the main drivers were $1.17 from lower adjusted operating income* partly mitigated by $0.31 from lower costs for capacity alignment and antitrust related matters, $0.26 from lower tax and $0.16 from financial items.
8
Financial Report July – September 2021 |
First nine months 2021 development
Gross profit increased by $398 million and the gross margin increased by 3.6pp compared to the same period 2020. The gross margin increase was primarily driven by higher sales and direct material and labor productivity.
S,G&A increased by $35 million, mainly relating to higher personnel costs due to extensive furloughing the prior year, adverse FX effects and increased IT and project costs.
R,D&E, net increased by $19 million mainly due to higher personnel costs due to extensive furloughing the prior year and adverse FX effects. In relation to sales, R,D&E costs declined from 5.9% to 5.1%.
Other income (expense), net improved by $81 million compared to a year earlier, mainly due to $94 million in lower capacity alignment accruals, partly offset by adverse effects from FX effects and lower government income.
Operating income improved by $425 million, mainly as a consequence of the improvement of gross profit and other income (expense), net, partly offset by higher costs for S,G&A and R,D&E, net.
Adjusted operating income* improved by $336 million, mainly due to the higher gross profit, partly offset by higher costs for S,G&A and R,D&E, net.
Financial and non-operating items, net improved by around $18 million, mainly due to lower interest expense, net, but also due to positive effects from currency translations and other financial items.
Income before taxes improved by $443 million, mainly as a consequence of higher operating income.
Tax rate was 29.5%, compared to 104.4% the prior year when last year was impacted by unfavorable country mix.
Earnings (loss) per share, diluted increased by $3.67 where the main drivers were $3.85 from higher adjusted operating income*, $1.02 from lower costs for capacity alignment and antitrust related matters and $0.19 from financial items, partly offset by $1.38 from higher tax.
9
Financial Report July – September 2021 |
Selected Balance Sheet and Cash Flow items
| | | |
Selected Balance Sheet items | Third quarter |
(Dollars in millions) | 2021 | 2020 | Change |
Trade working capital1) | $1,421 | $1,418 | 0.2% |
Trade working capital in relation to sales2) | 19.2% | 17.4% | 1.8pp |
Receivables outstanding in relation to sales3) | 21.3% | 19.8% | 1.5pp |
Inventory outstanding in relation to sales4) | 12.5% | 8.8% | 3.7pp |
Payables outstanding in relation to sales5) | 14.6% | 11.2% | 3.4pp |
Cash & cash equivalents | $903 | $1,477 | (38.8)% |
Gross Debt6) | $2,051 | $3,033 | (32.4)% |
Net Debt7) | $1,165 | $1,573 | (25.9)% |
Capital employed8) | $3,738 | $3,686 | 1.4% |
Return on capital employed9) | 10.5% | 18.7% | (8.2)pp |
Total equity | $2,573 | $2,113 | 21.7% |
Return on total equity10) | 9.3% | 19.4% | (10.1)pp |
Leverage ratio11) | 1.1 | 2.4 | (51.2)% |
1) Outstanding receivables and outstanding inventory less outstanding payables. 2) Outstanding receivables and outstanding inventory less outstanding payables relative to annualized quarterly sales. 3) Outstanding receivables relative to annualized quarterly sales. 4) Outstanding inventory relative to annualized quarterly sales. 5) Outstanding payables relative to annualized quarterly sales. 6) Short- and long-term interest-bearing debt. 7) Short- and long-term debt less cash and cash equivalents and debt-related derivatives. Non U.S. GAAP measure. See reconciliation table. 8) Total equity and net debt. 9) Annualized operating income and income from equity method investments, relative to average capital employed. 10) Annualized net income relative to average total equity. 11) Net debt adjusted for pension liabilities in relation to EBITDA. Non U.S. GAAP measure. See reconciliation table. |
| | | | | | | |
Selected Cash Flow items | Third quarter | | First 9 months |
(Dollars in millions) | 2021 | 2020 | Change | | 2021 | 2020 | Change |
Net income (loss) | $60 | $99 | (39.3)% | | $322 | $(1) | n/a |
Changes in operating working capital | $35 | $138 | (74.6)% | | $(179) | $163 | (209)% |
Depreciation and amortization | $98 | $93 | 6.0% | | $297 | $268 | 10.7% |
Other, net | $(5) | $23 | (123)% | | $(3) | $(51) | (94.3)% |
Operating cash flow | $188 | $352 | (46.6)% | | $437 | $380 | 15.0% |
Capital expenditure, net | $(112) | $(76) | 46.1% | | $(301) | $(229) | 31.7% |
Free cash flow1) | $77 | $276 | (72.2)% | | $136 | $152 | (10.1)% |
Cash conversion2) | 128% | 279% | (151)pp | | 42.3% | n/a | n/a |
Dividends paid | $(54) | – | n/a | | $(109) | $(54) | 101% |
Cash dividend paid per share | $(0.62) | – | n/a | | $(1.24) | $(0.62) | 100% |
Capital expenditures, net in relation to sales | 6.0% | 3.8% | 2.3pp | | 4.9% | 4.6% | 0.3pp |
1) Operating cash flow less Capital expenditures, net. Non U.S. GAAP measure. See enclosed reconciliation table. 2) Free cash flow relative to Net income. Non U.S. GAAP measure. See reconciliation table. |
Third quarter 2021 development
Trade working capital* was almost unchanged compared to the same period last year, where the main drivers were mainly related to $208 million in increased inventories as a consequence of the low demand visibility and supply chain challenges, offset by $41 million reduction of receivables and $164 million in increased accounts payables.
Operating cash flow decreased by $164 million to $188 million compared to the same period last year, mainly due to lower net income and less positive effects from changes in operating working capital.
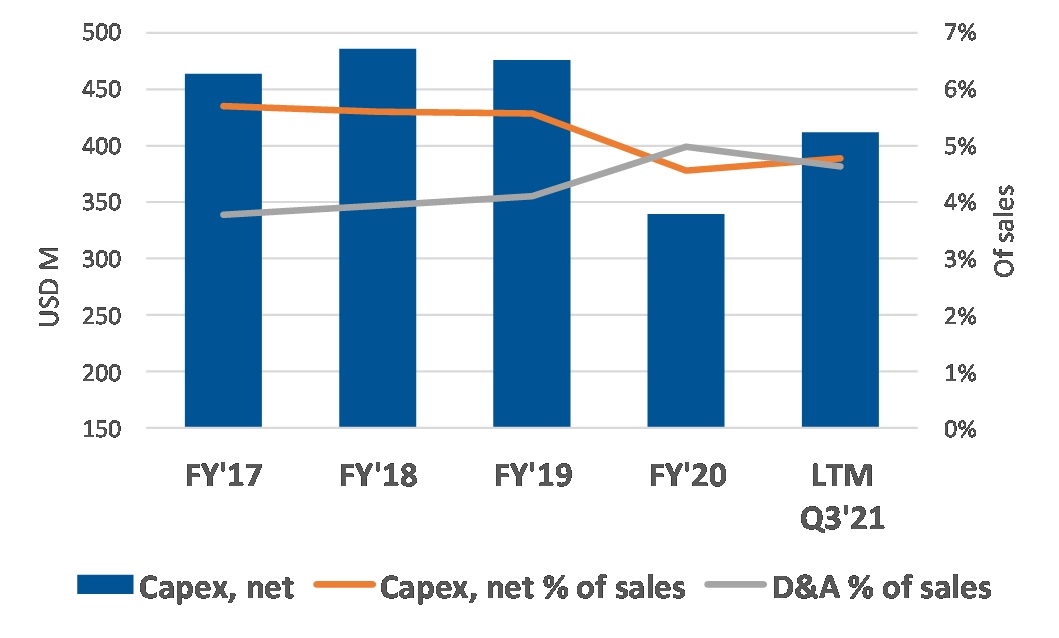
Capital expenditure, net increased by 46%, which mainly reflects that the level in the prior year was still low due to the pandemic. Capital expenditure, net in relation to sales was 6.0% vs. 3.8% a year earlier.
Free cash flow* was $77 million, compared to $276 million a year earlier. The decline was due to the lower operating cash flow and higher capital expenditure, net.
Cash conversion* defined as free cash flow* in relation to net income, was 128%.
Net debt* was $1,165 million as of September 30, 2021, which was $408 million lower than a year earlier and $35 million lower compared to June 30, 2021.
Financial Report July – September 2021 |
Liquidity position. At September 30, 2021, our cash balance was $0.9 billion, and including committed,
10
Financial Report July – September 2021 |
unused loan facilities, our liquidity position was $2.0 billion.
Leverage ratio*. As of September 30, 2021, the Company had a leverage ratio of 1.1x, compared to 2.4x at September 30, 2020 as the net debt decreased substantially and the 12 months trailing adjusted EBITDA* increased substantially.
Total equity increased by $460 million compared to September 30, 2020 mainly due to $511 million from net income and $40 million from currency translation effects partially offset by dividend payments of $110 million.
First nine months 2021 development
Operating cash flow was $437 million compared to $380 million a year earlier. The increase of $57 million was primarily due to positive effects from the higher net income, partly offset by negative effects from changes in operating working capital.
Capital expenditure, net of $301 million was 32% higher than a year earlier, which mainly reflects that the level in the prior year was still low due to the pandemic. Capital expenditure, net in relation to sales was 4.9% compared to 4.6% in the same period 2020.
Free cash flow* amounted to $136 million compared to $152 million a year earlier, driven by a higher capital expenditure, net partly offset by the improvement in operating cash flow.
Cash conversion* defined as free cash flow in relation to net income, was 42%.
Headcount
| | Sep 30 | Jun 30 | Sep 30 |
| | 2021 | 2021 | 2020 |
| Headcount | 62,000 | 64,500 | 65,300 |
| Whereof: Direct employees in manufacturing | 44,200 | 46,400 | 47,300 |
| Indirect employees | 17,900 | 18,000 | 18,000 |
| Temporary personnel | 7.7% | 9.1% | 8.8% |
By September 30, 2021, total headcount decreased by 3,300 compared to a year earlier, reflecting a lower production. The indirect workforce decreased by around 0.6% while the direct workforce decreased by around 6.6%. Compared to June 30, 2021, total headcount decreased by around 3.9%. This was driven by a decrease of around 4.7% of the direct workforce reflecting a lower LVP, while the indirect workforce decreased by 0.6%.
11
Financial Report July – September 2021 |
Other Items
| • | On August 19, 2021, Autoliv announced that its Board of Directors declared a quarterly dividend of $0.62 per share for the third quarter of 2021, which was paid on September 24, 2021. |
| • | On September 22, 2021, Autoliv announced that it strengthened its insights in automotive safety and the wider mobility safety arena, as Bryan Reimer and Hasse Johansson joined the Autoliv Research Advisory Board. Bryan Reimer, Ph.D., is a Research Scientist in the MIT Center for Transportation and Logistics, a researcher in the AgeLab, and the Associate Director of The New England University Transportation Center at MIT. Bryan’s research seeks to develop theoretical and applied insights into driver behavior, an area that is highly important for Autoliv. Hasse Johansson is a member of the Audit and Risk Committee at Autoliv and a member of the Board of Directors at the company since 2018. He has a background as EVP Research & Development at Scania and experience of transformational innovation relating to automation, electrification, and connectivity, which are all vital areas for Autoliv. |
Next Report
Autoliv intends to publish the quarterly earnings report for the fourth quarter of 2021 on Friday, January 28, 2022.
Inquiries: Investors and Analysts
Anders Trapp
Vice President Investor Relations
Tel +46 (0)8 5872 0671
Henrik Kaar
Director Investor Relations
Tel +46 (0)8 5872 0614
Inquiries: Media
Gabriella Ekelund
Senior Vice President Communications
Tel +46 (0)70 612 6424
Autoliv, Inc. is obliged to make this information public pursuant to the EU Market Abuse Regulation. The information was submitted for publication, through the agency of the VP of Investor Relations set out above, at 12.00 CET on October 22, 2021.
Footnotes
*Non-U.S. GAAP measure, see enclosed reconciliation tables.
Definitions and SEC Filings
Please refer to www.autoliv.com or to our Annual Report for definitions of terms used in this report. Autoliv’s annual report to stockholders, annual report on Form 10-K, quarterly reports on Form 10‑Q, proxy statements, management certifications, press releases, current reports on Form 8-K and other documents filed with the SEC can be obtained free of charge from Autoliv at the Company’s address. These documents are also available at the SEC’s website www.sec.gov and at Autoliv’s corporate website www.autoliv.com.
This report includes content supplied by IHS Markit Automotive; Copyright © Light Vehicle Production Forecast, October 2021. All rights reserved. IHS Markit is a global supplier of independent industry information. The permission to use IHS Markit copyrighted reports, data and information does not constitute an endorsement or approval by IHS Markit of the manner, format, context, content, conclusion, opinion or viewpoint in which IHS Markit reports, data and information or its derivations are used or referenced herein.
12
Financial Report July – September 2021 |
This report contains statements that are not historical facts but rather forward-looking statements within the meaning of the Private Securities Litigation Reform Act of 1995. Such forward-looking statements include those that address activities, events or developments that Autoliv, Inc. or its management believes or anticipates may occur in the future. All forward-looking statements are based upon our current expectations, various assumptions and/or data available from third parties. Our expectations and assumptions are expressed in good faith and we believe there is a reasonable basis for them. However, there can be no assurance that such forward-looking statements will materialize or prove to be correct as forward-looking statements are inherently subject to known and unknown risks, uncertainties and other factors which may cause actual future results, performance or achievements to differ materially from the future results, performance or achievements expressed in or implied by such forward-looking statements. In some cases, you can identify these statements by forward-looking words such as “estimates”, “expects”, “anticipates”, “projects”, “plans”, “intends”, “believes”, “may”, “likely”, “might”, “would”, “should”, “could”, or the negative of these terms and other comparable terminology, although not all forward-looking statements contain such words. Because these forward-looking statements involve risks and uncertainties, the outcome could differ materially from those set out in the forward-looking statements for a variety of reasons, including without limitation, general economic conditions; the impacts of the coronavirus (COVID-19) pandemic on the Company’s financial condition, business operations, operating costs, liquidity and competition and on the global economy; changes in light vehicle production; fluctuation in vehicle production schedules for which the Company is a supplier; supply chain disruptions and component shortages impacting the Company or the automotive industry; changes in general industry and market conditions or regional growth or decline; changes in and the successful execution of our capacity alignment, restructuring, cost reduction and efficiency initiatives and the market reaction thereto; loss of business from increased competition; higher raw material, fuel and energy costs; changes in consumer and customer preferences for end products; customer losses; changes in regulatory conditions; customer bankruptcies, consolidations, or restructuring or divestiture of customer brands; unfavorable fluctuations in currencies or interest rates among the various jurisdictions in which we operate; market acceptance of our new products; costs or difficulties related to the integration of any new or acquired businesses and technologies; continued uncertainty in pricing negotiations with customers; successful integration of acquisitions and operations of joint ventures; successful implementation of strategic partnerships and collaborations; our ability to be awarded new business; product liability, warranty and recall claims and investigations and other litigation and customer reactions thereto; higher expenses for our pension and other postretirement benefits, including higher funding needs for our pension plans; work stoppages or other labor issues; possible adverse results of pending or future litigation or infringement claims; our ability to protect our intellectual property rights; negative impacts of antitrust investigations or other governmental investigations and associated litigation relating to the conduct of our business; tax assessments by governmental authorities and changes in our effective tax rate; dependence on key personnel; legislative or regulatory changes impacting or limiting our business; political conditions; dependence on and relationships with customers and suppliers; and other risks and uncertainties identified under the headings “Risk Factors” and “Management’s Discussion and Analysis of Financial Condition and Results of Operations” in our Annual Reports and Quarterly Reports on Forms 10-K and 10-Q and any amendments thereto. For any forward-looking statements contained in this or any other document, we claim the protection of the safe harbor for forward-looking statements contained in the Private Securities Litigation Reform Act of 1995, and we assume no obligation to update publicly or revise any forward-looking statements in light of new information or future events, except as required by law.
13
Financial Report July – September 2021 |
Consolidated Statements of Net Income
| | | | | | | |
(Dollars in millions, except per share data) | Third quarter | | First 9 months | Latest 12 | Full Year |
(Unaudited) | 2021 | 2020 | | 2021 | 2020 | months | 2020 |
Airbag and Other products1) | $1,199 | $1,332 | | $3,973 | $3,188 | $5,609 | $4,824 |
Seatbelt products1) | 647 | 706 | | 2,139 | 1,743 | 3,019 | 2,623 |
Total net sales | $1,847 | $2,037 | | $6,111 | $4,931 | $8,628 | $7,447 |
Cost of sales | (1,546) | (1,638) | | (4,968) | (4,186) | (6,983) | (6,201) |
Gross profit | $301 | $400 | | $1,143 | $745 | $1,645 | $1,247 |
Selling, general & administrative expenses | (101) | (92) | | (319) | (284) | (425) | (389) |
Research, development & engineering expenses, net | (98) | (102) | | (311) | (292) | (394) | (376) |
Amortization of intangibles | (2) | (2) | | (8) | (8) | (10) | (10) |
Other income (expense), net | (1) | (29) | | (5) | (86) | (9) | (90) |
Operating income | $99 | $175 | | $500 | $75 | $807 | $382 |
Income from equity method investments | (0) | 1 | | 2 | 1 | 3 | 2 |
Interest income | 1 | 1 | | 3 | 4 | 4 | 5 |
Interest expense | (14) | (21) | | (46) | (53) | (66) | (73) |
Other non-operating items, net | 1 | (7) | | (3) | (13) | (14) | (25) |
Income before income taxes | $87 | $149 | | $456 | $13 | $734 | $291 |
Income taxes | (27) | (50) | | (135) | (14) | (224) | (103) |
Net income (loss) | $60 | $99 | | $322 | $(1) | $511 | $188 |
Less: Net income attributable to non-controlling interest | 0 | 1 | | 1 | 1 | 2 | 1 |
Net income (loss) attributable to controlling interest | $60 | $98 | | $320 | $(2) | $509 | $187 |
Earnings (loss) per share2, 3) | $0.68 | $1.12 | | $3.65 | $(0.02) | 5.81 | $2.14 |
1) Including Corporate and other sales. 2) Assuming dilution when applicable and net of treasury shares. 3) Participating share awards with right to receive dividend equivalents are (under the two-class method) excluded from EPS calculation. |
14
Financial Report July – September 2021 |
Consolidated Balance Sheets
| | | | | | |
| | Sep 30 | Jun 30 | Mar 31 | Dec 31 | Sep 30 |
(Dollars in millions, unaudited) | | 2021 | 2021 | 2021 | 2020 | 2020 |
Assets | | | | | | |
Cash & cash equivalents | | $903 | $893 | $1,254 | $1,178 | $1,477 |
Receivables, net | | 1,575 | 1,719 | 1,846 | 1,822 | 1,616 |
Inventories, net | | 922 | 901 | 856 | 798 | 714 |
Prepaid expenses | | 242 | 230 | 183 | 164 | 179 |
Other current assets | | 68 | 60 | 260 | 307 | 52 |
Total current assets | | $3,710 | $3,804 | $4,399 | $4,269 | $4,037 |
Property, plant & equipment, net | | 1,813 | 1,833 | 1,810 | 1,869 | 1,779 |
Operating leases right-of-use assets | | 123 | 133 | 137 | 141 | 137 |
Goodwill | | 1,389 | 1,393 | 1,392 | 1,398 | 1,390 |
Intangible assets, net | | 9 | 11 | 14 | 14 | 15 |
Investments and other non-current assets | | 467 | 462 | 457 | 466 | 476 |
Total assets | | $7,511 | $7,636 | $8,210 | $8,157 | $7,833 |
Liabilities and equity | | | | | | |
Short-term debt1) | | $364 | $363 | $291 | $302 | $1,026 |
Accounts payable | | 1,076 | 1,125 | 1,215 | 1,254 | 912 |
Accrued expenses | | 1,096 | 1,066 | 1,323 | 1,270 | 1,011 |
Operating lease liabilities - current | | 38 | 39 | 38 | 37 | 36 |
Other current liabilities | | 237 | 260 | 321 | 284 | 237 |
Total current liabilities | | $2,811 | $2,852 | $3,188 | $3,147 | $3,221 |
Long-term debt1) | | 1,687 | 1,712 | 2,039 | 2,110 | 2,007 |
Pension liability | | 231 | 239 | 239 | 248 | 239 |
Operating lease liabilities - non-current | | 85 | 94 | 100 | 103 | 102 |
Other non-current liabilities | | 125 | 125 | 123 | 126 | 151 |
Total non-current liabilities | | $2,127 | $2,170 | $2,501 | $2,587 | $2,499 |
Total parent shareholders’ equity | | 2,558 | 2,600 | 2,507 | 2,409 | 2,100 |
Non-controlling interest | | 15 | 15 | 14 | 14 | 14 |
Total equity | | $2,573 | $2,615 | $2,521 | $2,423 | $2,113 |
Total liabilities and equity | | $7,511 | $7,636 | $8,210 | $8,157 | $7,833 |
1) As of September 30, 2020, $600 million of the revolving credit facility loan was classified as short-term debt since it was repaid on October 2, 2020. |
15
Financial Report July – September 2021 |
Consolidated Statements of Cash Flow
| | | | | | | |
| Third quarter | | First 9 months | Latest 12 | Full Year |
(Dollars in millions, unaudited) | 2021 | 2020 | | 2021 | 2020 | months | 2020 |
Net income (loss) | $60 | $99 | | $322 | $(1) | $511 | $188 |
Depreciation and amortization | 98 | 93 | | 297 | 268 | 400 | 371 |
Other, net | (5) | 23 | | (3) | (51) | 61 | 13 |
Changes in operating working capital, net | 35 | 138 | | (179) | 163 | (65) | 277 |
Net cash provided by operating activities | $188 | $352 | | $437 | $380 | $906 | $849 |
Expenditures for property, plant and equipment | (113) | (78) | | (303) | (232) | (415) | (344) |
Proceeds from sale of property, plant and equipment | 1 | 1 | | 3 | 3 | 3 | 4 |
Net cash used in investing activities | $(112) | $(76) | | $(301) | $(229) | $(412) | $(340) |
Net cash before financing1) | $77 | $276 | | $136 | $152 | $494 | $509 |
Increase (decrease) in short term debt | 14 | (56) | | (278) | (198) | (320) | (240) |
Repayment of long-term debt | – | – | | – | – | (723) | (723) |
Increase (decrease) long-term debt | (14) | 0 | | (1) | 1,091 | 86 | 1,177 |
Dividends paid | (54) | – | | (109) | (54) | (109) | (54) |
Common stock options exercised | 0 | 0 | | 2 | 0 | 3 | 1 |
Dividend paid to non-controlling interests | (1) | (1) | | (1) | (1) | (2) | (1) |
Net cash (used in) provided by financing activities | $(56) | $(57) | | $(386) | $838 | $(1,063) | $160 |
Effect of exchange rate changes on cash | (10) | 34 | | (25) | 42 | (4) | 64 |
Increase in cash and cash equivalents | $11 | $253 | | $(275) | $1,032 | $(573) | $733 |
Cash and cash equivalents at period-start | 893 | 1,223 | | 1,178 | 445 | 1,477 | 445 |
Cash and cash equivalents at period-end | $903 | $1,477 | | $903 | $1,477 | $903 | $1,178 |
1) Non-U.S. GAAP measure comprised of "Net cash provided by operating activities" and "Net cash used in investing activities". See reconciliation table. |
16
Financial Report July – September 2021 |
RECONCILIATION OF U.S. GAAP TO NON-U.S. GAAP MEASURES
In this report we sometimes refer to non-U.S. GAAP measures that we and securities analysts use in measuring Autoliv's performance. We believe that these measures assist investors and management in analyzing trends in the Company's business for the reasons given below. Investors should not consider these non-U.S. GAAP measures as substitutes, but rather as additions, to financial reporting measures prepared in accordance with U.S. GAAP. It should be noted that these measures, as defined, may not be comparable to similarly titled measures used by other companies.
Components in Sales Increase/Decrease
Since the Company historically generates approximately 75% of sales in currencies other than in the reporting currency (i.e. U.S. dollars) and currency rates have been volatile, we analyze the Company's sales trends and performance as changes in organic sales growth. This presents the increase or decrease in the overall U.S. dollar net sales on a comparable basis, allowing separate discussions of the impact of acquisitions/divestitures and exchange rates. The tables on pages 5 and 6 present changes in organic sales growth as reconciled to the change in the total U.S. GAAP net sales.
Trade Working Capital
Due to the need to optimize cash generation to create value for shareholders, management focuses on operationally derived trade working capital as defined in the table below. The reconciling items used to derive this measure are, by contrast, managed as part of our overall management of cash and debt, but they are not part of the responsibilities of day-to-day operations' management.
| | | | | |
| Sep 30 | Jun 30 | Mar 31 | Dec 31 | Sep 30 |
(Dollars in millions) | 2021 | 2021 | 2021 | 2020 | 2020 |
Receivables, net | $1,575 | $1,719 | $1,846 | $1,822 | $1,616 |
Inventories, net | $922 | $901 | $856 | $798 | $714 |
Accounts payable | $(1,076) | $(1,125) | $(1,215) | $(1,254) | $(912) |
Trade Working capital | $1,421 | $1,495 | $1,487 | $1,366 | $1,418 |
17
Financial Report July – September 2021 |
Net Debt
Autoliv from time to time enters into “debt-related derivatives” (DRD) as a part of its debt management and as part of efficiently managing the Company’s overall cost of funds. Creditors and credit rating agencies use net debt adjusted for DRDs in their analyses of the Company’s debt, therefore we provide this non-U.S. GAAP measure. DRDs are fair value adjustments to the carrying value of the underlying debt. Also included in the DRDs is the unamortized fair value adjustment related to a discontinued fair value hedge that will be amortized over the remaining life of the debt. By adjusting for DRDs, the total financial liability of net debt is disclosed without grossing debt up with currency or interest fair values.
| | | | | |
| Sep 30 | Jun 30 | Mar 31 | Dec 31 | Sep 30 |
(Dollars in millions) | 2021 | 2021 | 2021 | 2020 | 2020 |
Short-term debt | $364 | $363 | $291 | $302 | $1,026 |
Long-term debt | 1,687 | 1,712 | 2,039 | 2,110 | 2,007 |
Total debt | $2,051 | $2,075 | $2,330 | $2,411 | $3,033 |
Cash & cash equivalents | (903) | (893) | (1,254) | (1,178) | (1,477) |
Debt issuance cost/Debt-related derivatives, net | 18 | 18 | 39 | (19) | 17 |
Net debt | $1,165 | $1,200 | $1,115 | $1,214 | $1,573 |
| | | | | |
| | Dec 31 | Dec 31 | Dec 31 | Dec 31 |
(Dollars in millions) | | 2019 | 2018 | 2017 | 2016 |
Short-term debt | | $368 | $621 | $20 | $216 |
Long-term debt | | 1,726 | 1,609 | 1,311 | 1,313 |
Total debt | | $2,094 | $2,230 | $1,330 | $1,529 |
Cash & cash equivalents | | (445) | (616) | (960) | (1,227) |
Debt issuance cost/Debt-related derivatives, net | | 0 | 5 | (3) | (3) |
Net debt | | $1,650 | $1,619 | $368 | $299 |
18
Financial Report July – September 2021 |
Leverage ratio
The non-U.S. GAAP measure “net debt” is also used in the non-U.S. GAAP measure “Leverage ratio”. Management uses this measure to analyze the amount of debt the Company can incur under its debt policy. Management believes that this policy also provides guidance to credit and equity investors regarding the extent to which the Company would be prepared to leverage its operations. In 2021, EBITDA calculation was redefined to exclude other non-operating items and income from equity method investments. Historic EBITDA and leverage ratio have been recalculated resulting in minor adjustments. Autoliv’s policy is to maintain a leverage ratio commensurate with a strong investment grade credit rating. The Company measures its leverage ratio as net debt* adjusted for pension liabilities in relation to adjusted EBITDA*. The long-term target is to maintain a leverage ratio of around 1.0x within a range of 0.5x to 1.5x.
| | | |
| Sep 30 | Dec 31 | Sep 30 |
(Dollars in millions) | 2021 | 2020 | 2020 |
Net debt1) | $1,165 | $1,214 | $1,573 |
Pension liabilities | 231 | 248 | 239 |
Debt per the Policy | $1,396 | $1,462 | $1,812 |
Net income2) | $511 | $188 | $155 |
Income taxes2) | 224 | 103 | 68 |
Interest expense, net2, 3) | 62 | 68 | 66 |
Other non-operating items, net2) | 14 | 25 | 17 |
Income from equity method investments2) | (3) | (2) | (1) |
Depreciation and amortization of intangibles2) | 400 | 371 | 359 |
Costs for capacity alignments and antitrust related matters2) | 10 | 99 | 108 |
EBITDA per the Policy (Adjusted EBITDA) | $1,217 | $852 | $771 |
Leverage ratio | 1.1 | 1.7 | 2.4 |
1) Short- and long-term debt less cash and cash equivalents and debt-related derivatives. 2) Latest 12 months. 3) Interest expense including cost for extinguishment of debt, if any, less interest income. |
19
Financial Report July – September 2021 |
Free Cash Flow, Net Cash Before Financing and Cash Conversion
Management uses the non-U.S. GAAP measure “free cash flow” to analyze the amount of cash flow being generated by the Company’s operations after capital expenditure, net. This measure indicates the Company’s cash flow generation level that enables strategic value creation options such as dividends or acquisitions. For details on free cash flow, see the reconciliation table below. Management uses the non-U.S. GAAP measure “net cash before financing” to analyze and disclose the cash flow generation available for servicing external stakeholders such as shareholders and debt stakeholders. For details on net cash before financing, see the reconciliation table below. Management uses the non-U.S. GAAP measure “cash conversion” to analyze the proportion of net income that is converted into free cash flow. The measure is a tool to evaluate how efficient the Company utilizes its resources. For details on cash conversion, see the reconciliation table below.
| | | | | | | |
| Third quarter | | First 9 months | Latest 12 | Full Year |
(Dollars in millions) | 2021 | 2020 | | 2021 | 2020 | months | 2020 |
Net income (loss) | $60 | $99 | | $322 | $(1) | $511 | $188 |
Changes in operating working capital | 35 | 138 | | (179) | 163 | (65) | 277 |
Depreciation and amortization | 98 | 93 | | 297 | 268 | 400 | 371 |
Other, net | (5) | 23 | | (3) | (51) | 61 | 13 |
Operating cash flow | $188 | $352 | | $437 | $380 | $906 | $849 |
Capital expenditure, net | (112) | (76) | | (301) | (229) | (412) | (340) |
Free cash flow1) | $77 | $276 | | $136 | $152 | $494 | $509 |
Net cash before financing | $77 | $276 | | $136 | $152 | $494 | $509 |
Cash conversion2) | 128% | 279% | | 42.3% | n/a | 96.7% | 270% |
1) Operating cash flow less Capital expenditures, net. 2) Free cash flow relative to Net income. |
| | | | | |
| Full year | Full year | | Full year | Full year |
(Dollars in millions) | 2019 | 20181) | | 20171) | 20161) |
Net income | $463 | $184 | | $303 | $562 |
Changes in operating assets and liabilities | 47 | (229) | | (0) | (78) |
Depreciation and amortization | 351 | 397 | | 426 | 383 |
Goodwill impairment charges | – | – | | 234 | – |
Other, net4) | (220) | 239 | | (27) | 2 |
Operating cash flow | $641 | $591 | | $936 | $868 |
EC antitrust payment | (203) | – | | – | – |
Operating cash flow excl antitrust | $844 | $591 | | $936 | $868 |
Capital expenditure, net | (476) | (555) | | (570) | (499) |
Free cash flow2) | $165 | $36 | | $366 | $370 |
Free cash flow excl antitrust payment5) | $368 | $36 | | $366 | $370 |
Acquisitions of businesses and other, net | - | (73) | | (128) | (227) |
Net cash before financing | $165 | $(37) | | $239 | $142 |
Cash conversion3) | 35.6% | 19.5% | | 121% | 65.8% |
Cash conversion excl antitrust6) | 79.4% | 19.5% | | 121% | 65.8% |
1) Including Discontinued Operations. 2) Operating cash flow less Capital expenditures, net. 3) Free cash flow relative to Net income. 4) Including EC antitrust non-cash provision 2018 and EC antitrust payment 2019. 5) For 2019, Operating cashflow excluding EC antitrust payment less Capital expenditures, net. 6) For 2019, Free cash flow excluding EC antitrust payment relative to Net income. |
20
Financial Report July – September 2021 |
Items Affecting Comparability
We believe that comparability between periods is improved through the exclusion of certain items. To assist investors in understanding the operating performance of Autoliv's business, it is useful to consider certain U.S. GAAP measures exclusive of these items. Accordingly, the tables below reconcile from U.S. GAAP to the equivalent non-U.S. GAAP measure.
| | | | | | | |
| Third quarter 2021 | | Third quarter 2020 |
(Dollars in millions, except per share data) | Reported
U.S. GAAP | Adjust-ments1) | Non-U.S.
GAAP | | Reported
U.S. GAAP | Adjust-ments1) | Non-U.S.
GAAP |
Operating income | $99 | $4 | $103 | | $175 | $31 | $206 |
Operating margin | 5.4% | 0.2% | 5.6% | | 8.6% | 1.5% | 10.1% |
Income before taxes | $87 | $4 | $91 | | $149 | $31 | $180 |
Net income attributable to controlling interest | $60 | $4 | $64 | | $98 | $31 | $129 |
Return on capital employed2) | 10.5% | 0.4% | 10.9% | | 18.7% | 3.0% | 21.7% |
Return on total equity3) | 9.3% | 0.6% | 9.9% | | 19.4% | 5.3% | 24.7% |
Earnings per share4, 5) | $0.68 | $0.05 | $0.73 | | $1.12 | $0.36 | $1.48 |
1) Costs for capacity alignment and in 2020 antitrust related matters. 2) Annualized operating income and income from equity method investments, relative to average capital employed. 3) Annualized income relative to average total equity. 4) Assuming dilution and net of treasury shares. 5) Participating share awards with right to receive dividend equivalents are (under the two-class method) excluded from the EPS calculation. |
| | | | | | | |
| First 9 months 2021 | | First 9 months 2020 |
| Reported
U.S. GAAP | Adjust-ments1) | Non-U.S.
GAAP | | Reported
U.S. GAAP | Adjust-ments1) | Non-U.S.
GAAP |
Operating income | $500 | $6 | $506 | | $75 | $95 | $170 |
Operating margin | 8.2% | 0.1% | 8.3% | | 1.5% | 2.0% | 3.5% |
Income before taxes | $456 | $6 | $462 | | $13 | $95 | $108 |
Net income (loss) attributable to controlling interest | $320 | $6 | $326 | | $(2) | $85 | $83 |
Capital employed | $3,738 | $6 | $3,744 | | $3,686 | $85 | $3,771 |
Return on capital employed2) | 18.1% | 0.2% | 18.3% | | 2.7% | 3.4% | 6.1% |
Return on total equity3) | 16.9% | 0.3% | 17.2% | | 0.0% | 5.4% | 5.4% |
Earnings (loss) per share4, 5) | $3.65 | $0.06 | $3.72 | | $(0.02) | $0.97 | $0.95 |
Total parent shareholders' equity per share | $29.25 | $0.06 | $29.31 | | $24.05 | $0.97 | $25.02 |
1) Costs for capacity alignment and in 2020 antitrust related matters. 2) Annualized operating income and income from equity method investments, relative to average capital employed. 3) Annualized income relative to average total equity. 4) Assuming dilution when applicable and net of treasury shares. 5) Participating share awards with right to receive dividend equivalents are (under the two-class method) excluded from the EPS calculation. |
| | | | | | | |
| Latest 12 months | | Full year 2020 |
| Reported
U.S. GAAP | Adjust-ments1) | Non-U.S.
GAAP | | Reported
U.S. GAAP | Adjust-ments1) | Non-U.S.
GAAP |
Operating income | $807 | $10 | $818 | | $382 | $99 | $482 |
Operating margin | 9.4% | 0.1% | 9.5% | | 5.1% | 1.4% | 6.5% |
1) Costs for capacity alignment and in 2020 antitrust related matters. |
| | | | | | | |
| Full year 2019 | | Full year 2018 |
| Reported
U.S. GAAP | Adjust-ments1) | Non-U.S.
GAAP | | Reported
U.S. GAAP | Adjust-ments1) | Non-U.S.
GAAP |
Operating income | $726 | $49 | $774 | | $686 | $222 | $908 |
Operating margin | 8.5% | 0.6% | 9.1% | | 7.9% | 2.6% | 10.5% |
1) Costs for capacity alignment and antitrust related matters and separation of our business segments. |
21
Financial Report July – September 2021 |
| | | | | | | |
| Full year 2017 | | Full year 2016 |
| Reported
U.S. GAAP | Adjust-ments1) | Non-U.S.
GAAP | | Reported
U.S. GAAP | Adjust-ments1) | Non-U.S.
GAAP |
Operating income | $860 | $40 | $899 | | $831 | $35 | $866 |
Operating margin | 10.6% | 0.5% | 11.1% | | 10.5% | 0.4% | 10.9% |
1) Costs for capacity alignment and antitrust related matters. |
| | | | | |
Items included in Non-U.S. GAAP adjustments | Third quarter 2021 | | Third quarter 2020 |
| Adjustment
Million | Adjustment
Per share | | Adjustment
Million | Adjustment
Per share |
Capacity alignment | $4 | $0.05 | | $31 | $0.36 |
Antitrust related matters | - | - | | $0 | $0.00 |
Total adjustments to operating income | $4 | $0.05 | | $31 | $0.36 |
Tax on non-U.S. GAAP adjustments1) | $0 | $0.00 | | $(0) | $(0.00) |
Total adjustments to net income | $4 | $0.05 | | $31 | $0.36 |
Average number of shares outstanding - diluted2) | | 87.6 | | | 87.4 |
Annualized adjustment on return on capital employed | $17 | | | $124 | |
Adjustment return on capital employed | 0.4% | | | 3.0% | |
Annualized adjustment on return on total equity | $18 | | | $124 | |
Adjustment return on total equity | 0.6% | | | 5.3% | |
1) The tax is calculated based on the tax laws in the respective jurisdiction(s) of the adjustment(s). 2) Annualized average number of outstanding shares |
| | | | | |
Items included in Non-GAAP adjustments | First 9 months 2021 | | First 9 months 2020 |
| Adjustment
Million | Adjustment
Per share | | Adjustment
Million | Adjustment
Per share |
Capacity alignment | $6 | $0.06 | | $94 | $1.08 |
Antitrust related matters | - | - | | $0 | $0.01 |
Total adjustments to operating income | $6 | $0.06 | | $95 | $1.09 |
Tax on non-U.S. GAAP adjustments1) | $(0) | $(0.00) | | $(10) | $(0.12) |
Total adjustments to net income | $6 | $0.06 | | $85 | $0.97 |
Average number of shares outstanding - diluted2) | | 87.6 | | | 87.4 |
Annualized adjustment on Return on capital employed | $8 | | | $126 | |
Adjustment Return on capital employed | 0.2% | | | 3.4% | |
Annualized adjustment on Return on total equity | $7 | | | $113 | |
Adjustment return on total equity | 0.3% | | | 5.4% | |
1) The tax is calculated based on the tax laws in the respective jurisdiction(s) of the adjustment(s). 2) Annualized average number of outstanding shares |
22
Financial Report July – September 2021 |
Multi-year Summary
Continuing Operations unless noted
| | | | | |
(Dollars in millions, unaudited) | 2020 | 2019 | 2018 | 2017 | 2016 |
Sales and Income | | | | | |
Net sales | $7,447 | $8,548 | $8,678 | $8,137 | $7,922 |
Airbag sales1) | 4,824 | 5,676 | 5,699 | 5,342 | 5,256 |
Seatbelt sales | 2,623 | 2,871 | 2,980 | 2,794 | 2,665 |
Operating income | 382 | 726 | 686 | 860 | 831 |
Net income attributable to controlling interest | 187 | 462 | 376 | 586 | 558 |
Earnings per share (US$) – basic2) | 2.14 | 5.29 | 4.32 | 6.70 | 6.33 |
Earnings per share (US$) – assuming dilution2, 3) | 2.14 | 5.29 | 4.31 | 6.68 | 6.32 |
Gross margin4) | 16.7% | 18.5% | 19.7% | 20.6% | 20.6% |
R,D&E net in relation to sales | (5.0)% | (4.7)% | (4.8)% | (4.6)% | (4.5)% |
S,G &A net in relation to sales | (5.2)% | (4.7)% | (4.5)% | (5.0)% | (5.0)% |
Operating margin5) | 5.1% | 8.5% | 7.9% | 10.6% | 10.5% |
Adjusted operating margin6, 7) | 6.5% | 9.1% | 10.5% | 11.1% | 10.9% |
Balance Sheet | | | | | |
Trade working capital8) | 1,366 | 1,417 | 1,396 | 1,444 | 1,245 |
Trade working capital in relation to sales9) | 13.6% | 16.2% | 15.9% | 16.7% | 15.7% |
Receivables outstanding in relation to sales10) | 18.1% | 18.6% | 19.0% | 19.6% | 19.1% |
Inventory outstanding in relation to sales11) | 7.9% | 8.5% | 8.6% | 8.2% | 7.7% |
Payables outstanding in relation to sales12) | 12.5% | 10.8% | 11.7% | 11.1% | 11.1% |
Total equity | 2,423 | 2,122 | 1,897 | 4,169 | 3,926 |
Total parent shareholders’ equity per share (US$) | 27.56 | 24.19 | 21.63 | 46.38 | 41.69 |
Current assets excluding cash | 3,091 | 2,557 | 2,670 | 2,598 | 2,269 |
Property, plant and equipment, net | 1,869 | 1,816 | 1,690 | 1,609 | 1,329 |
Intangible assets (primarily goodwill) | 1,412 | 1,410 | 1,423 | 1,440 | 1,430 |
Capital employed | 3,637 | 3,772 | 3,516 | 4,538 | 4,225 |
Net debt7) | 1,214 | 1,650 | 1,619 | 368 | 299 |
Total assets | 8,157 | 6,771 | 6,722 | 6,947 | 6,565 |
Long-term debt | 2,110 | 1,726 | 1,609 | 1,311 | 1,313 |
Return on capital employed13, 14) | 10% | 20% | 17% | n/a | n/a |
Return on total equity14, 15) | 9% | 23% | 13% | n/a | n/a |
Total equity ratio | 30% | 31% | 28% | 49% | 48% |
Cash flow and other data | | | | | |
Operating Cash flow16) | 849 | 641 | 591 | 936 | 868 |
Depreciation and amortization16) | 371 | 351 | 397 | 426 | 383 |
Capital expenditures, net16) | 340 | 476 | 555 | 570 | 499 |
Capital expenditures, net in relation to sales16) | 4.6% | 5.6% | 5.7% | 5.5% | 4.9% |
Free Cash flow7, 16, 17) | 509 | 165 | 36 | 366 | 369 |
Cash conversion7, 16, 18) | 270% | 35.6% | 19.5% | 121% | 65.7% |
Direct shareholder return16, 19) | 54 | 217 | 214 | 366 | 203 |
Cash dividends paid per share (US$) | 0.62 | 2.48 | 2.46 | 2.38 | 2.30 |
Number of shares outstanding (millions)20) | 87.4 | 87.2 | 87.1 | 87.0 | 88.2 |
Number of employees, December 31 | 61,000 | 58,900 | 57,700 | 56,700 | 55,800 |
1) Including steering wheels, inflators and initiators. 2) Participating share awards with right to receive dividend equivalents are (under the two-class method) excluded from the EPS calculation. 3) Assuming dilution and net of treasury shares. 4) Gross profit relative to sales. 5) Operating income relative to sales. 6) Excluding costs for capacity alignment, antitrust related matters and separation of our business segments. 7) Non-US GAAP measure, for reconciliation see tables above. 8) Outstanding receivables and outstanding inventory less outstanding payables. 9) Outstanding receivables and outstanding inventory less outstanding payables relative to annualized fourth quarter sales. 10) Outstanding receivables relative to annualized fourth quarter sales. 11) Outstanding inventory relative to annualized fourth quarter sales. 12) Outstanding payables relative to annualized fourth quarter sales. 13) Operating income and income from equity method investments, relative to average capital employed. 14) The Company has decided not to recalculate prior periods since the distribution of Veoneer had a significant impact on total equity and capital employed making the comparison less meaningful. 15) Income relative to average total equity. 16) Including Discontinued Operations. 17) Operating cash flow less Capital expenditures, net. 18) Free cash flow relative to Net income. 19) Dividends paid and Shares repurchased. 20) At year end, excluding dilution and net of treasury shares. |
23