Exhibit 99.1

Q4 2021: Solid profitability and cash flow
Financial highlights Q4 2021 $2,119m net sales 16% organic sales decline* 8.2% operating margin 8.3% adjusted operating margin* $1.31 EPS - a decrease of $0.84 $1.30 adjusted EPS* - a decrease of $0.89 | | Full year 2022 indications Around 20% organic sales growth Around 3% negative FX effect on net sales Around 9.5% adjusted operating margin Around $950m operating cash flow |
Key business developments in the fourth quarter of 2021
| • | Significant organic sales decline* as global LVP declined by 13% vs. Q4 last year (IHS Markit Jan 2022). Sales decreased organically by 15.6%, underperforming global LVP by 2.6pp, mainly due to negative geographical mix effects as LVP in high safety content per vehicle markets declined significantly more than LVP in low content markets. |
| • | Profitability declined due to lower sales and almost 3pp operating margin headwind from higher raw material costs. Adjusted operating margin* declined by 4.0pp to 8.3%. Adjusted return on capital employed* was 19.1%. |
| • | Strong balance sheet and leverage ratio* well within target range. Operating cash flow of $317 million and free cash flow* of $164 million support continued balance sheet improvement. A dividend of $0.64 per share was previously declared and paid in the quarter. Net debt* declined, resulting in a leverage ratio of 1.2x. |
*For non-U.S. GAAP measures see enclosed reconciliation tables. All change figures in this release compare to the same period of previous year except when stated otherwise.
Key Figures
| | | | | | |
(Dollars in millions, except per share data) | Q4 2021 | Q4 2020 | Change | FY 2021 | FY 2020 | Change |
Net sales | $2,119 | $2,517 | (15.8)% | $8,230 | $7,447 | 10.5% |
Operating income | $174 | $307 | (43.2)% | $675 | $382 | 76.6% |
Adjusted operating income1) | $177 | $311 | (43.2)% | $683 | $482 | 41.8% |
Operating margin | 8.2% | 12.2% | (4.0)pp | 8.2% | 5.1% | 3.1pp |
Adjusted operating margin1) | 8.3% | 12.4% | (4.0)pp | 8.3% | 6.5% | 1.8pp |
Earnings per share2, 3) | $1.31 | $2.15 | (38.9)% | $4.96 | $2.14 | 132% |
Adjusted earnings per share1, 2, 3) | $1.30 | $2.19 | (40.5)% | $5.02 | $3.15 | 59.4% |
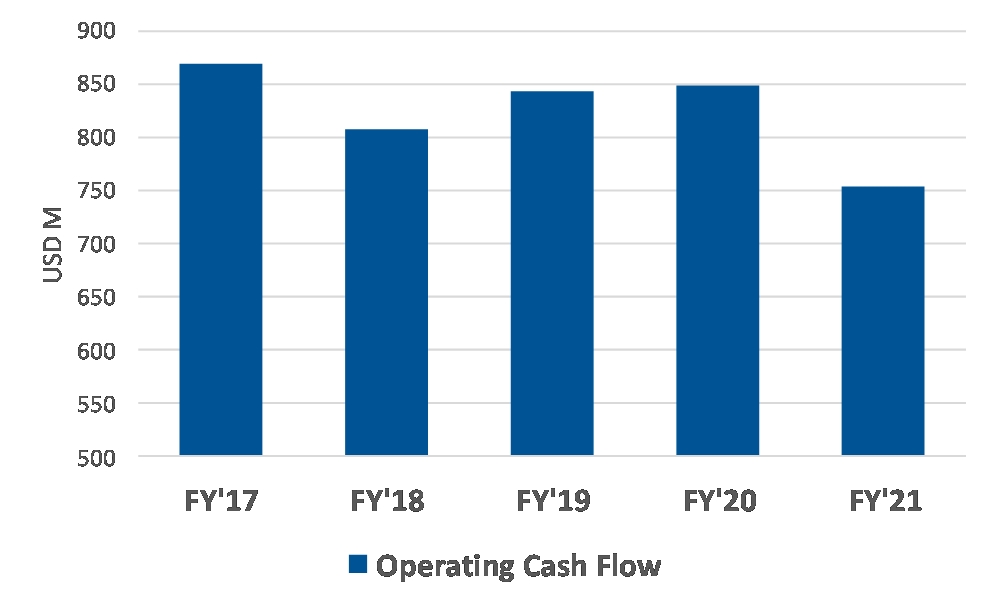
Operating cash flow | $317 | $469 | (32.5)% | $754 | $849 | (11.2)% |
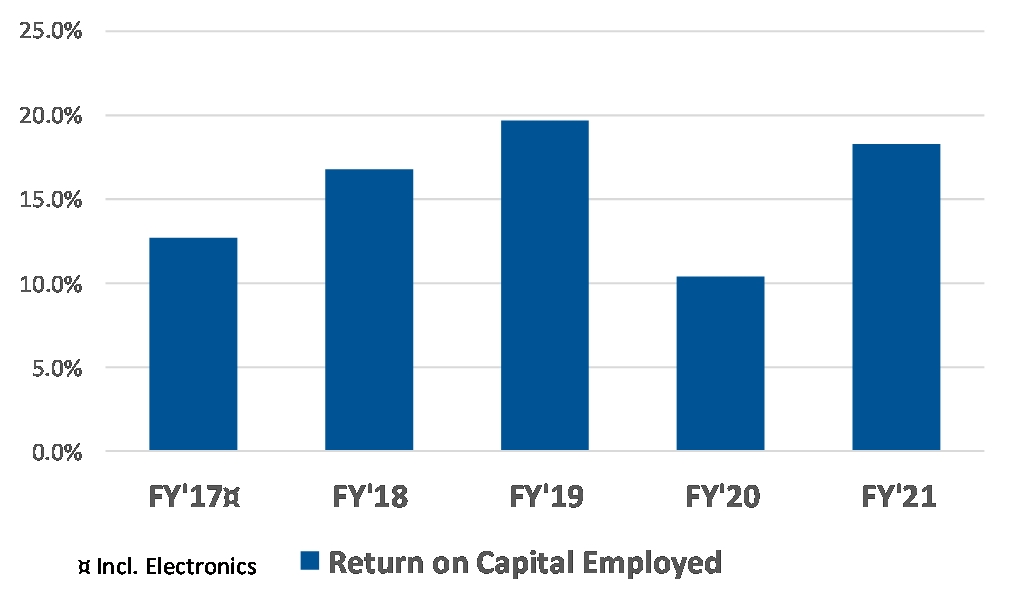
Return on capital employed4) | 18.9% | 33.7% | (14.8)pp | 18.3% | 10.4% | 7.9pp |
Adjusted return on capital employed 1, 5) | 19.1% | 33.4% | (14.3)pp | 18.5% | 12.9% | 5.6pp |
1) Excluding costs for capacity alignment and in 2020 antitrust related matters. 2) Assuming dilution when applicable and net of treasury shares. 3) Participating share awards with right to receive dividend equivalents are (under the two-class method) excluded from the EPS calculation. 4) Annualized operating income and income from equity method investments, relative to average capital employed. 5) Annualized operating income and income from equity method investments, relative to average capital employed. Non-U.S. GAAP measure, see reconciliation table. |
| | | | |
Comments from Mikael Bratt, President & CEO | | |

| The fourth quarter of 2021 remained challenging with indirect effects from COVID-19 continuing to impact our business. LVP continued to be limited by lack of semiconductors, although the situation improved in the latter part of the quarter with improved call-off stability bringing some cause for cautious optimism for LVP growth in 2022. | | quarter. We therefore believe that there was an element of pull forward of our sales from the fourth to third quarter of 2021, contributing to a temporary lower than expected outperformance. Cost increases for raw materials generated a headwind of almost 3pp to our operating margin in the quarter. We expect rising raw material costs to amount to around 3pp in operating margin headwind for full year 2022, with around 5pp y-o-y impact in the first half year and around 1-2 pp in the second half. We expect customer recoveries to offset some of the expected raw material cost increases, mainly in the second half of the year. Combined, this means that the first half year will be quite challenging. In 2021, we reduced headcount by 11%, and we will continue a strict cost control in 2022 including executing on capacity alignments, footprint optimization, and strategic initiatives. A record number of new product launches in 2021 supports a strong outperformance in 2022. In 2021, we estimate that we booked around 50% of all available orders globally. Based on an assumption of LVP growth of around 9%, supported by a positive regional mix and high number of product launches, we expect to grow organically by around 20%, generating an adjusted operating margin of around 9.5% for the full year 2022. |
I am pleased that our operating income was solid, despite headwinds from lower sales, raw material costs and currency exchange rates. I am also pleased that our cash flow and balance sheet remained strong, that we raised the quarterly dividend to $0.64 and that our leverage ratio* remained well within our target range. We met our guidance for 2021 with organic sales growth* of around 8%, adjusted operating margin* of 8.3% and operating cash flow of $754 million. The fourth quarter saw significant outperformance of low safety content markets vs. high safety content markets, generating a significant negative regional mix for the quarter and the full year. This contributed to our organic* sales outperformance of 5.2 pp in full year 2021 being below the around 8pp we had expected. Our sales were lower than expected in all regions except China, which is in contrast to the changes in LVP reported by IHS Markit during the | |
2
Full year 2022 indications
Our outlook indications for 2022 reflect continuing uncertainty in the automotive markets and are mainly based on our customer call-offs and global LVP outlook according to IHS Markit, indicating a full year 2022 global LVP growth of around 9%.
| | | |
| Full Year Indication | | Full Year Indication |
Organic sales growth | Around 20% | Tax rate2) | Around 30% |
FX impact on net sales | Around 3% negative | Operating cash flow3) | Around $950m |
Adjusted operating margin1) | Around 9.5% | Capex, net, of sales | Around 5.5% |
1) Excluding costs for capacity alignments, antitrust related matters and other discrete items. 2) Excluding unusual tax items. 3) Excluding unusual items.
The forward-looking non-U.S. GAAP financial measures above are provided on a non-U.S. GAAP basis. Autoliv has not provided a U.S. GAAP reconciliation of these measures because items that impact these measures, such as costs related to capacity alignments and antitrust matters, cannot be reasonably predicted or determined. As a result, such reconciliation is not available without unreasonable efforts and Autoliv is unable to determine the probable significance of the unavailable information.
Conference call and webcast
An earnings conference call will be held at 2:00 p.m. CET today, January 28, 2022. Information regarding how to participate is available on www.autoliv.com. The presentation slides for the conference call will be available on our website shortly after the publication of this financial report.
3
Business update relating to COVID-19 pandemic and other matters
COVID-19
The COVID-19 pandemic continued to impact our business in the fourth quarter 2021 indirectly through limited LVP by our customers caused by global semiconductor shortage and other industry supply chain disruptions. Fourth quarter 2021 global LVP declined year over year by around 13% (according to IHS Markit January 2022). The lower LVP negatively impacted our sales and profitability. Supply chain disruptions leading to lower customer demand visibility and material changes to call-offs with short notice also negatively impacted our production efficiency and profitability in the quarter, although the situation stabilized somewhat in the latter part of the quarter. Rising raw material costs amounted to almost 3pp in operating margin headwind in the fourth quarter, of which a small part was offset by commercial customer recoveries.
Direct COVID-19 related costs, such as personal protective equipment, quarantine costs, premium freight and other items, were around $2 million in the fourth quarter 2021 and around $14 million for the full year 2021. Governmental support in connection with furloughing, short-term work weeks, and other similar activities was around $2 million in the fourth quarter 2021 and in the full year 2021.
We expect the current industry-wide semiconductor supply shortage to be a limiting factor for the LVP recovery in 2022. We expect rising raw material costs to amount to around 3pp in operating margin headwind in full year 2022, with around 5pp year over year impact in the first half and around 1-2pp in the second half. We expect customer recoveries to offset some of these expected raw material cost increases, mainly in the second half of the year.
In response to the ongoing challenging market conditions, Autoliv management continued to implement strict cost control measures in the fourth quarter 2021, including a headcount reduction of 2.3% during the quarter and planned capacity alignments of certain production operations in Japan. The situation is monitored closely, and further actions are being evaluated.
Other matters
On December 31, 2021, a U.S. federal court in the state of Georgia returned a verdict against Autoliv in a wrongful death products liability lawsuit stemming from a fatal car accident in 2013. The court found for the plaintiff and entered an order requiring Autoliv to pay approximately $113.5 million—approximately $13.5 million in actual compensatory damages and $100 million in punitive damages—because Autoliv manufactured the seatbelt that was involved in the accident. The Company, supported by its legal counsel, believes that the Court’s verdict was in error, including the grossly high punitive damages award, and plans to seek reconsideration and, if necessary, appeal the decision.
The Company has determined that a loss with respect to this litigation is probable and has accrued an amount of $13.5 million, which is reflected in the total product liability accrual in the fourth quarter of 2021. This amount reflects the Company’s best estimate of a probable loss based on currently available information and does not include any amount for the punitive damages. It is reasonably possible that the Company may have to pay the entire amount of damages awarded by the court. The Company has product liability insurance and the amount by which the product liability accrual exceeds the product liability insurance receivable with respect to the litigation matter is immaterial and includes self-insurance retention costs and deductibles. The Company believes that its insurance should cover all of the types of damages awarded by the Court. However, the extent of our insurance coverage for punitive damages in this matter is uncertain and may be less than all of such punitive damages ultimately awarded. In the event all or a portion of the punitive damages award survives our post-judgment actions, we will continue to engage with our insurance carriers and aggressively pursue all potential recoveries. Given the recent timing of the verdict, the Company is still in the midst of analyzing all of its options relating to the verdict. The ultimate loss to the Company of the litigation matter could be materially different from the amount the Company has accrued. The Company cannot predict or estimate the duration or ultimate outcome of this matter but believes that the ultimate resolution of this lawsuit will not materially impact Autoliv’s liquidity or its ability to conduct its daily operations.
This report includes content supplied by IHS Markit Automotive; Copyright © Light Vehicle Production Forecast, January, 2022. All rights reserved.
4
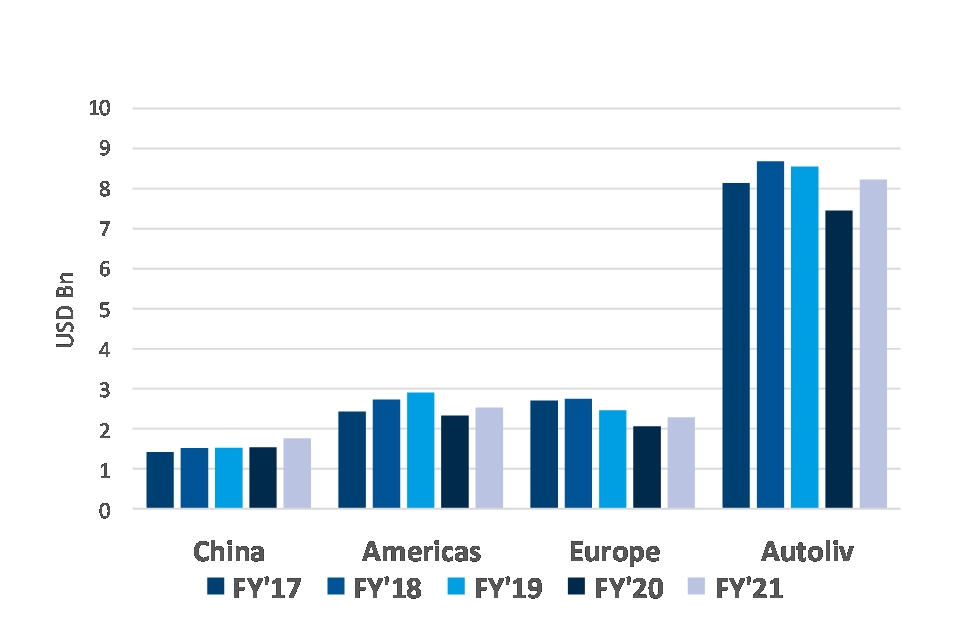
Key Performance Trends | | |
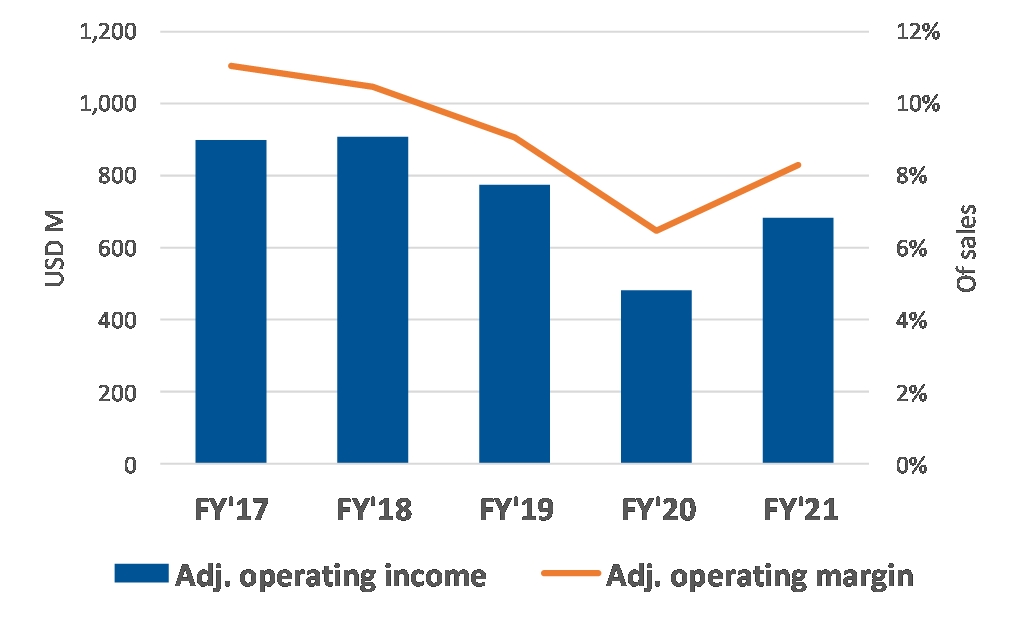
Sales Development by region | | Adj. operating income and margin* |
| | |
| | 
|
| | |
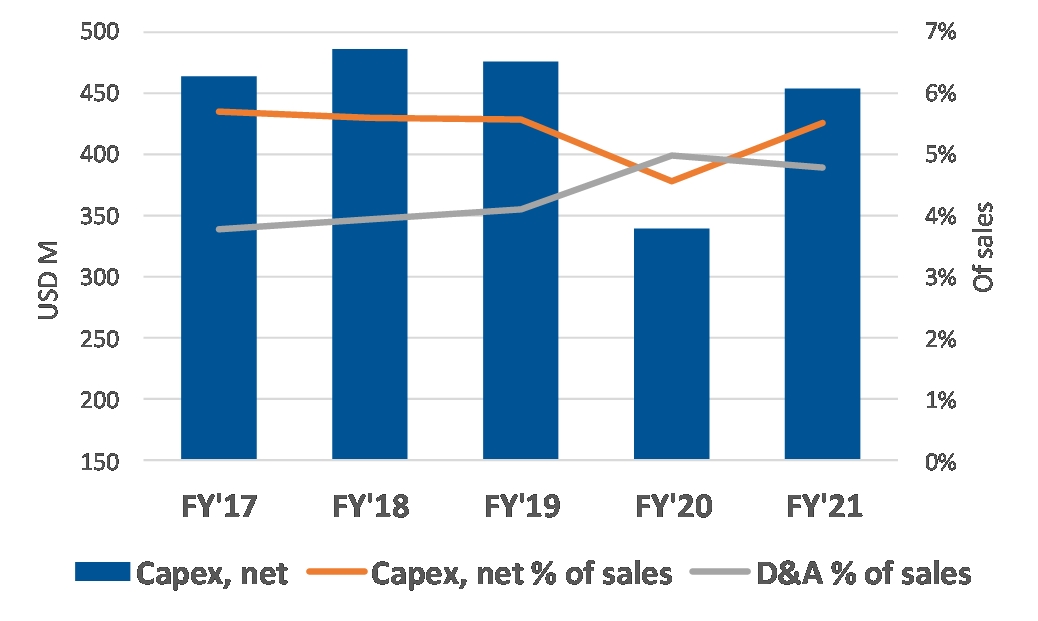
Capex and D&A | | Operating Cash Flow excl EC antitrust payment* |
| | |
| | 
|
| | |
Return on Capital Employed | | Cash Conversion* |
| | |
| | 
|
Key definitions
Capex: Capital Expenditure, net.
D&A: Depreciation and Amortization.
Adj. operating income and margin*: Operating income adjusted for capacity alignments, antitrust related matters and separation of our business segments in 2018. Capacity alignments include non-recurring costs related to our structural efficiency and business cycle management programs.
Operating cash flow excluding EC antitrust payment*: Management estimate for Continuing Operations derived from cash flow including Discontinued Operations 2017-2018. Adjusted for EC antitrust payment of $203 million in 2019.
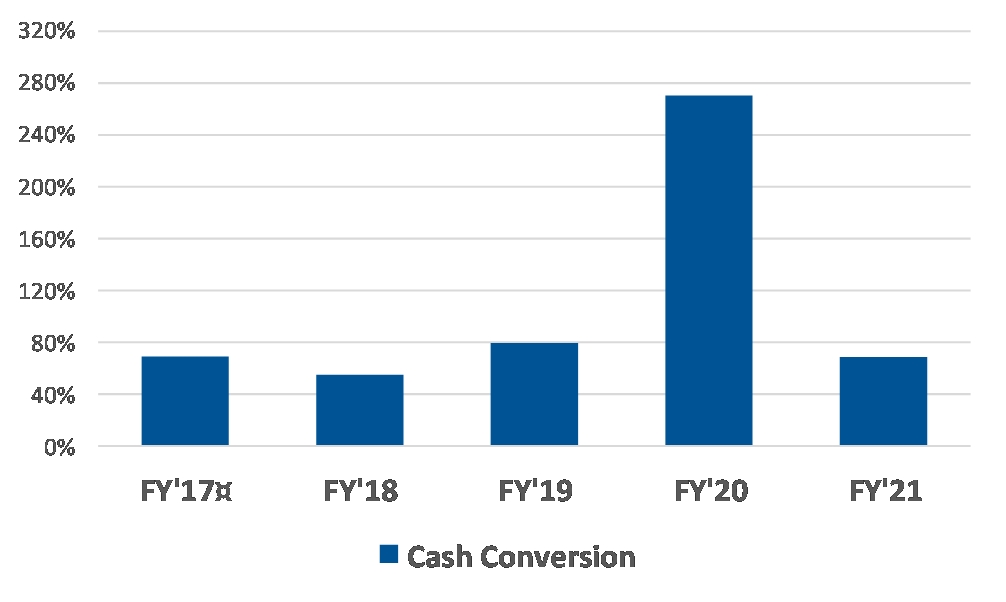
Cash conversion*: Free cash flow* in relation to net income adjusted for EC antitrust accrual in 2018 and payment in 2019. Free cash flow defined as operating cash flow less capital expenditure, net.
5
Consolidated sales development
Fourth quarter 2021
| | | | | | |
Consolidated sales | | Fourth quarter | Reported
(U.S. GAAP) | Currency
effects1) | Organic
change* |
(Dollars in millions) | | 2021 | 2020 |
Airbag Products and Other2) | | $1,408 | $1,637 | (14.0)% | (0.4)% | (13.6)% |
Seatbelt Products2) | | $711 | $880 | (19.2)% | 0.2% | (19.3)% |
Total | | $2,119 | $2,517 | (15.8)% | (0.2)% | (15.6)% |
| | | | | | |
Asia | | $958 | $1,052 | (8.9)% | 0.4% | (9.3)% |
Whereof: | China | $538 | $552 | (2.5)% | 5.2% | (7.7)% |
| Japan | $187 | $245 | (23.6)% | (6.3)% | (17.3)% |
| RoA | $233 | $255 | (8.6)% | (3.6)% | (5.0)% |
Americas | | $632 | $758 | (16.7)% | 0.1% | (16.8)% |
Europe | | $529 | $707 | (25.2)% | (1.5)% | (23.6)% |
Total | | $2,119 | $2,517 | (15.8)% | (0.2)% | (15.6)% |
1) Effects from currency translations. 2) Including Corporate and other sales. |
Sales by product – Airbags and Other
All major product categories within Airbags declined organically* in the quarter except front center airbags. The largest contributor to the decline was inflatable curtains and side airbags followed by steering wheels, driver airbags and passenger airbags.
Sales by product - Seatbelts
The main contributor to Seatbelt products organic decline* was Europe and North America. Seatbelt products declined organically in all regions except South America and Other Asia.
Sales by region
Our global organic sales* declined by around 16% compared to the LVP decline of 13% (according to IHS Markit January 2022). The 2.6pp underperformance was largely due to negative geographical mix effects as LVP in higher content per vehicle markets such as Europe and North America declined more than lower CPV markets
such as China, South America and Rest of Asia. Autoliv outperformed LVP in Europe, South America, Japan and Rest of Asia but underperformed in North America and China. LVP declined in all major regions except in the low content per vehicle markets ASEAN and domestic OEM China.
| | | | | | |
Q4 2021 organic growth* | Americas | Europe | China | Japan | Rest of Asia | Global |
Autoliv | (17)% | (24)% | (7.7)% | (17)% | (5.0)% | (16)% |
Main growth drivers | Rivian | Mitsubishi | Geely, Daimler, Wuling | Mitsubishi | Mitsubishi, Toyota, Tata | Mitsubishi, Geely, Wuling |
Main decline drivers | Honda, GM, Nissan | VW, Stellantis, Renault | Great Wall, VW, Honda | Toyota, Nissan, Subaru | Hyundai/Kia, Nissan, Suzuki | Honda, VW, Nissan |
Light vehicle production development
Change vs same period last year according to IHS Markit
| | | | | | |
Q4 2021 | Americas | Europe | China | Japan | Rest of Asia | Global |
LVP (Jan 2022) | (13)% | (26)% | (4.6)% | (18)% | (8.6)% | (13)% |
LVP (Oct 2021) | (17)% | (23)% | (19)% | (21)% | (21)% | (20)% |
6
Consolidated sales development
Full year 2021
| | | | | | | | | |
Consolidated sales | | Full year | Reported
(U.S. GAAP) | Currency
effects1) | Organic
change* |
(Dollars in millions) | | 2021 | 2020 |
Airbag Products and Other2) | | $5,380 | $4,824 | 11.5% | 2.2% | 9.3% |
Seatbelt Products2) | | $2,850 | $2,623 | 8.6% | 3.4% | 5.2% |
Total | | $8,230 | $7,447 | 10.5% | 2.6% | 7.9% |
| | | | | | |
Asia | | $3,407 | $3,043 | 12.0% | 3.2% | 8.7% |
Whereof: | China | $1,766 | $1,541 | 14.6% | 7.1% | 7.5% |
| Japan | $733 | $733 | (0.0)% | (2.7)% | 2.7% |
| RoA | $908 | $769 | 18.0% | 1.0% | 17.0% |
Americas | | $2,535 | $2,337 | 8.5% | 1.1% | 7.3% |
Europe | | $2,289 | $2,067 | 10.7% | 3.5% | 7.2% |
Total | | $8,230 | $7,447 | 10.5% | 2.6% | 7.9% |
1) Effects from currency translations. 2) Including Corporate and other sales. |
Sales by product – Airbags and Other
All major product categories within Airbags grew strongly organically* in the full year 2021 with exception of inflators. The largest contributor to growth was steering wheels and inflatable curtains, followed by passenger airbags, driver airbags and knee airbags.
Sales by product - Seatbelts
Seatbelts showed strong organic* growth with largest contributing markets being China, South America and India, partly offset by declines in South Korea and Japan.
Sales by region
The global organic sales growth* of 7.9% was 5.2pp better than LVP (according to IHS Markit January 2022). Sales increased organically in all regions. The largest organic sales increase drivers were Americas and Europe, followed by Rest of Asia, China and Japan. Our organic sales development outperformed LVP in all regions - by 12pp in Europe, by 7pp in Japan, by 5pp in Americas, by 3pp in China and by 2pp in Rest of Asia.
| | | | | | |
Full year 2021 organic growth* | Americas | Europe | China | Japan | Rest of Asia | Global |
Autoliv | 7.3% | 7.2% | 7.5% | 2.7% | 17% | 7.9% |
Main growth drivers | Toyota, Stellantis, Ford | Daimler, VW, BMW | Geely, GM, Wuling | Mitsubishi, Toyota, Nissan | Mitsubishi, Toyota, Tata | Toyota, Stellantis, Mitsubishi |
Main decline drivers | Honda, Subaru, Mazda | Renault, Ford, Nissan | VW, Hyundai/Kia, Great Wall | Honda, Mazda | Hyundai/Kia, SsangYong | Honda, Great Wall, BYD |
Light vehicle production development
Change vs same period last year according to IHS Markit
| | | | | | |
Full year 2021 | Americas | Europe | China | Japan | Rest of Asia | Global |
LVP (Jan 2022) | 2.3% | (5.1)% | 4.9% | (4.4)% | 15% | 2.6% |
LVP (Jan 2021) | 27% | 14% | 6.7% | 7.6% | 16% | 14% |
7
Key launches in the fourth quarter 2021
| | | | |
Honda BR-V | | Nissan Ariya | | Dacia Jogger |

| | 
| | 
|
| | | | |
Infinity QX60 | | Geely EX11 | | Rivian RPV |

| | 
| | 
|
| | | | |
Range Rover | | Volvo C40 Recharge | | Toyota Tundra |

| | 
| | 
|
| | | | |

| Driver/Passenger Airbags | 
| Seatbelts | 
| Side Airbags |
| | | | | |

| Head/Inflatable Curtain Airbags | 
| Steering Wheel | 
| Knee Airbag |
| | | | | |

| Front Center Airbag | 
| Bag-in-Belt | 
| Pyrotechnical Safety Switch |
| | | | | |

| Pedestrian Airbag | 
| Hood Lifter | 
| Available as EV/PHEV |
| | | | | |
8
Financial development
Selected income statement items
| | | | | | | |
Condensed income statement | Fourth quarter | | Full year |
(Dollars in millions, except per share data) | 2021 | 2020 | Change | | 2021 | 2020 | Change |
Net sales | $2,119 | $2,517 | (15.8)% | | $8,230 | $7,447 | 10.5% |
Cost of sales | $(1,751) | $(2,015) | (13.1)% | | $(6,719) | $(6,201) | 8.3% |
Gross profit | $368 | $502 | (26.7)% | | $1,511 | $1,247 | 21.2% |
S,G&A | $(113) | $(106) | 6.9% | | $(432) | $(389) | 11.1% |
R,D&E, net | $(80) | $(83) | (4.2)% | | $(391) | $(376) | 3.8% |
Amortization of intangibles | $(3) | $(3) | (2.1)% | | $(10) | $(10) | 0.5% |
Other income (expense), net | $1 | $(4) | 137% | | $(3) | $(90) | (96.3)% |
Operating income | $174 | $307 | (43.2)% | | $675 | $382 | 76.6% |
Adjusted operating income1) | $177 | $311 | (43.2)% | | $683 | $482 | 41.8% |
Financial and non-operating items, net | $(17) | $(29) | (42.4)% | | $(61) | $(91) | (33.3)% |
Income before taxes | $158 | $278 | (43.3)% | | $614 | $291 | 111% |
Tax rate | 26.9% | 32.0% | (5.1)pp | | 28.9% | 35.3% | (6.4)pp |
Net income | $115 | $189 | (39.1)% | | $437 | $188 | 132% |
Earnings per share2, 3) | $1.31 | $2.15 | (38.9)% | | $4.96 | $2.14 | 132% |
Adjusted earnings per share1, 2, 3) | $1.30 | $2.19 | (40.5)% | | $5.02 | $3.15 | 59.4% |
| | | | | | | |
Gross margin | 17.4% | 19.9% | (2.6)pp | | 18.4% | 16.7% | 1.6pp |
S,G&A, in relation to sales | (5.3)% | (4.2)% | (1.1)pp | | (5.3)% | (5.2)% | (0.0)pp |
R,D&E, net in relation to sales | (3.8)% | (3.3)% | (0.5)pp | | (4.7)% | (5.0)% | 0.3pp |
Operating margin | 8.2% | 12.2% | (4.0)pp | | 8.2% | 5.1% | 3.1pp |
Adjusted operating margin1) | 8.3% | 12.4% | (4.0)pp | | 8.3% | 6.5% | 1.8pp |
| | | | | | | |
Other data | | | | | | | |
No. of shares at period-end in millions4) | 87.5 | 87.4 | 0.1% | | 87.5 | 87.4 | 0.1% |
Weighted average no. of shares in millions5) | 87.4 | 87.3 | 0.1% | | 87.5 | 87.3 | 0.2% |
Weighted average no. of shares in millions, diluted5) | 87.7 | 87.6 | 0.1% | | 87.7 | 87.5 | 0.2% |
1) Non-U.S. GAAP measure, excluding costs for capacity alignment and in 2020 antitrust related matters. See reconciliation table. 2) Assuming dilution when applicable and net of treasury shares. 3) Participating share awards with right to receive dividend equivalents are (under the two-class method) excluded from the EPS calculation. 4) Excluding dilution and net of treasury shares. 5) Net of treasury shares. |
Fourth quarter 2021 development
Gross profit decreased by $134 million and the gross margin decreased by 2.6pp compared to the same quarter 2020. The gross profit decrease was primarily driven by the lower sales and higher raw material costs, but also due to adverse FX effects.
S,G&A costs increased by $7 million compared to the prior year, mainly relating to investments in personnel and IT and improvement projects.
R,D&E, net costs decreased by $3 million compared to the prior year, mainly relating to currency translation effects and lower personnel costs. In relation to sales, R,D&E costs increased from 3.3% to 3.8%.
Other income (expense), net improved by $5 million compared to prior year, mainly due to higher government income and positive FX effects.
Operating income decreased by $133 million compared to the same period in 2020, mainly as a consequence of the lower gross profit.
Adjusted operating income* decreased by $134 million vs. the prior year, mainly due to lower gross profit.
Financial and non-operating items, net, improved by $12 million, mainly due to lower interest expense, net, and positive effects from currency translations.
Income before taxes decreased by $120 million compared to the prior year, mainly due to the lower operating income partly offset by improved financial and non-operating items, net.
Tax rate was 26.9%, compared to 32.0% in the same period last year, where last year was impacted by unfavorable country mix.
Earnings per share, diluted decreased by $0.84 compared to a year earlier, where the main drivers were $1.04 from lower adjusted operating income* partly mitigated by $0.10 from financial items, $0.06 from lower tax and $0.05 from lower capacity alignment.
9
Full year 2021 development
Gross profit increased by $264 million and the gross margin increased by 1.6pp compared to the same period 2020. The gross profit increase was primarily driven by higher sales and direct material and labor productivity.
S,G&A increased by $43 million, mainly relating to higher personnel costs due to extensive furloughing the prior year, increased IT and project costs and adverse FX effects.
R,D&E, net increased by $15 million mainly due to higher personnel costs due to extensive furloughing the prior year and adverse FX effects partly offset by higher engineering income. In relation to sales, R,D&E costs declined from 5.0% to 4.7%.
Other income (expense), net improved by $87 million compared to a year earlier, mainly due to $90 million in lower capacity alignment costs, partly offset by adverse effects from FX effects and lower government income.
Operating income improved by $293 million, mainly as a consequence of the improvement of gross profit and other income (expense), net, partly offset by higher costs for S,G&A and R,D&E, net.
Adjusted operating income* improved by $201 million, mainly due to the higher gross profit, partly offset by higher costs for S,G&A and R,D&E, net.
Financial and non-operating items, net improved by around $30 million, mainly due to lower interest expense, net, but also due to positive effects from currency translations and other financial items.
Income before taxes improved by $323 million, mainly as a consequence of higher operating income and improved financial and non-operating items, net.
Tax rate was 28.9%, compared to 35.3% the prior year when last year was impacted by unfavorable country mix.
Earnings per share, diluted increased by $2.83 where the main drivers were $1.29 from higher adjusted operating income*, $0.95 from lower costs for capacity alignment and antitrust related matters, $0.40 from lower tax and $0.19 from financial items.
10

Selected Balance Sheet and Cash Flow items
| | | |
Selected Balance Sheet items | Fourth quarter |
(Dollars in millions) | 2021 | 2020 | Change |
Trade working capital 1) | $1,332 | $1,366 | (2.5)% |
Trade working capital in relation to sales 2) | 15.7% | 13.6% | 2.1pp |
Receivables outstanding in relation to sales 3) | 20.0% | 18.1% | 2.0pp |
Inventory in relation to sales 4) | 9.2% | 7.9% | 1.2pp |
Payables outstanding in relation to sales 5) | 13.5% | 12.5% | 1.0pp |
Cash & cash equivalents | $969 | $1,178 | (17.7)% |
Gross Debt 6) | $2,008 | $2,411 | (16.7)% |
Net Debt 7) | $1,052 | $1,214 | (13.4)% |
Capital employed 8) | $3,700 | $3,637 | 1.7% |
Return on capital employed 9) | 18.9% | 33.7% | (14.8)pp |
Total equity | $2,648 | $2,423 | 9.3% |
Return on total equity 10) | 17.6% | 33.3% | (15.7)pp |
Leverage ratio 11) | 1.2 | 1.7 | (32.5)% |
1) Outstanding receivables and outstanding inventory less outstanding payables. 2) Outstanding receivables and outstanding inventory less outstanding payables relative to annualized quarterly sales. 3) Outstanding receivables relative to annualized quarterly sales. 4) Outstanding inventory relative to annualized quarterly sales. 5) Outstanding payables relative to annualized quarterly sales. 6) Short- and long-term interest-bearing debt. 7) Short- and long-term debt less cash and cash equivalents and debt-related derivatives. Non U.S. GAAP measure. See reconciliation table. 8) Total equity and net debt. 9) Annualized operating income and income from equity method investments, relative to average capital employed. 10) Annualized net income relative to average total equity. 11) Net debt adjusted for pension liabilities in relation to EBITDA. Non U.S. GAAP measure. See reconciliation table. |
| | | | | | | |
Selected Cash Flow items | Fourth quarter | | Full year |
(Dollars in millions) | 2021 | 2020 | Change | | 2021 | 2020 | Change |
Net income | $115 | $189 | (39.1)% | | $437 | $188 | 132% |
Changes in operating working capital | $116 | $113 | 2.5% | | $(63) | $277 | (123)% |
Depreciation and amortization | $97 | $103 | (5.5)% | | $394 | $371 | 6.2% |
Other, net | $(12) | $64 | (118)% | | $(15) | $13 | (211)% |
Operating cash flow | $317 | $469 | (32.5)% | | $754 | $849 | (11.2)% |
Capital expenditure, net | $(153) | $(111) | 37.8% | | $(454) | $(340) | 33.7% |
Free cash flow1) | $164 | $358 | (54.3)% | | $300 | $509 | (41.2)% |
Cash conversion2) | 142% | 189% | (47.3)pp | | 68.6% | 270% | (202)pp |
Dividends paid | $(56) | – | n/a | | $(165) | $(54) | 204% |
Cash dividend paid per share | $(0.64) | – | n/a | | $(1.88) | $(0.62) | 203% |
Capital expenditures, net in relation to sales | 7.2% | 4.4% | 2.8pp | | 5.5% | 4.6% | 1.0pp |
1) Operating cash flow less Capital expenditure, net. Non U.S. GAAP measure. See enclosed reconciliation table. 2) Free cash flow relative to Net income. Non U.S. GAAP measure. See reconciliation table. |
Fourth quarter 2021 development
Trade working capital* was reduced by $34 million compared to the same period last year, where the main drivers were related to $122 million in lower receivables, net, and $21 million in reduced inventories, net, partly offset by $110 million reduction in accounts payables.
Operating cash flow decreased by $152 million to $317 million compared to the same period last year, mainly due to lower net income and less positive effects from deferred income taxes.
Capital expenditure, net increased by $42 million, which mainly reflects that the level in the prior year was still low due to the pandemic. Capital expenditure, net in relation to sales was 7.2% vs. 4.4% a year earlier.
Free cash flow* was $164 million, compared to $358 million a year earlier. The decline was due to the lower operating cash flow and higher capital expenditure, net.
11
Cash conversion* defined as free cash flow* in relation to net income, was 142% compared to 189% a year earlier reflecting that free cash flow declined more than net income declined.
Net debt* was $1,052 million as of December 31, 2021, which was $162 million lower than a year earlier and $113 million lower compared to September 30, 2021.
Liquidity position. At December 31, 2021, our cash balance was around $1.0 billion, and including committed, unused loan facilities, our liquidity position was around $2.1 billion.
Leverage ratio*. As of December 31, 2021, the Company had a leverage ratio of 1.2x, compared to 1.7x at December 31, 2020 as the net debt* decreased and the 12 months trailing adjusted EBITDA* increased.
Total equity increased by $225 million compared to December 31, 2020 mainly due to $437 million from net income, partially offset by dividends of $166 million and $86 million from currency translation effects.
Full year 2021 development
Operating cash flow was $754 million compared to $849 million a year earlier. The decrease of $95 million was primarily due to negative effects from changes in operating working capital partly offset by positive effects from the higher net income.
Capital expenditure, net of $454 million was $114 million higher than a year earlier, which mainly reflects that the level in the prior year was still low due to the pandemic. Capital expenditure, net in relation to sales was 5.5% compared to 4.6% in 2020.
Free cash flow* amounted to $300 million compared to $509 million a year earlier, driven by a higher capital expenditure, net and the lower operating cash flow.
Cash conversion* defined as free cash flow in relation to net income, was 69% compared to 270% a year earlier reflecting that free cash flow declined and net income increased.
Headcount
| | | |
| Dec 31 | Sep 30 | Dec 31 |
| 2021 | 2021 | 2020 |
Headcount | 60,600 | 62,000 | 68,200 |
Whereof: Direct headcount in manufacturing | 43,000 | 44,200 | 50,300 |
Indirect headcount | 17,600 | 17,900 | 17,900 |
Temporary personnel | 7.8% | 7.7% | 10.5% |
By December 31, 2021, total headcount decreased by 7,600 compared to a year earlier, mainly reflecting lower production. The indirect workforce decreased by around 1.7% while the direct workforce decreased by around 14.5%. Compared to September 30, 2021, total headcount
decreased by around 2.3%. This was driven by a decrease of around 2.7% of the direct workforce reflecting a lower LVP, while the indirect workforce decreased by 1.7%.
12

Other Items
| • | On November 4, 2021, Autoliv announced that it is collaborating with the Piaggio Group to develop an airbag for powered two-wheelers to provide greater protection for two-wheeler riders. |
| • | On November 10, 2021, Autoliv announced that its Board of Directors declared a quarterly dividend of $0.64 per share for the fourth quarter of 2021, which was paid on December 13, 2021. |
| • | On November 12, 2021, Autoliv announced an investment in Japan to optimize its footprint for future growth. The Japan footprint optimization plan includes the establishment of a new state of the art production facility in central Japan and a phasing out of two existing plants. The investment demonstrates Autoliv's commitment to its customers and to the Japanese market. |
| • | On November 15, 2021, Autoliv announced its collaboration with SSAB to produce the world’s first fossil-free steel components in automotive safety products. The collaboration enables Autoliv to be in the forefront in producing automotive safety products with fossil-free steel from SSAB. |
| • | On November 16, 2021, Autoliv held its virtual Capital Markets Day, where it outlined the company's strategy, growth opportunities, financial plans and targets, its contribution to sustainable mobility, and the basis for a new stock repurchase program of up to $1.5 billion over the next three years. |
| • | On November 16, 2021, Autoliv published its Sustainable Financing Framework. This Framework has been developed in alignment with the ICMA Green Bond Principles, 2021 and Social Bond Principles, 2021. |
| • | On December 16, 2021, Autoliv announced the appointment of Sng Yih as new President of Autoliv China and member of the Autoliv executive management team. Sng Yih will join Autoliv at the end of January 2022 and succeed Jennifer Cheng who retired in November. Ms. Cheng continues as Senior Advisor to the CEO and will assist with the transition. Mr. Sng Yih’s most recent background is in leading roles at Lear Corporation and Tenneco, both Tier 1 suppliers in the automotive industry. |
| • | The Company set May 10, 2022 as the date for its 2022 annual meeting of stockholders. The meeting will be a hybrid meeting, conducted virtually and in-person in the Detroit metropolitan area. Only the stockholders of record at the close of business on March 15, 2022 will be entitled to be present and vote at the meeting. |
Next Report
Autoliv intends to publish the quarterly earnings report for the first quarter of 2022 on Friday, April 22, 2022.
Inquiries: Investors and Analysts
Anders Trapp
Vice President Investor Relations
Tel +46 (0)8 5872 0671
Henrik Kaar
Director Investor Relations
Tel +46 (0)8 5872 0614
Inquiries: Media
Gabriella Ekelund
Senior Vice President Communications
Tel +46 (0)70 612 6424
Autoliv, Inc. is obliged to make this information public pursuant to the EU Market Abuse Regulation. The information was submitted for publication, through the agency of the VP of Investor Relations set out above, at 12.00 CET on January 28, 2022.
Footnotes
*Non-U.S. GAAP measure, see enclosed reconciliation tables.
Definitions and SEC Filings
Please refer to www.autoliv.com or to our Annual Report for definitions of terms used in this report. Autoliv’s annual report to stockholders, annual report on Form 10-K, quarterly reports on Form 10‑Q, proxy statements, management certifications, press releases, current reports on Form 8-K and other documents filed with the SEC can be obtained free of charge from Autoliv at the Company’s address. These documents are also available at the SEC’s website www.sec.gov and at Autoliv’s corporate website www.autoliv.com.
This report includes content supplied by IHS Markit Automotive; Copyright © Light Vehicle Production Forecast, January 2022. All rights reserved. IHS Markit is a global supplier of independent industry information. The permission to use IHS Markit copyrighted reports, data and information does not constitute an endorsement or approval by IHS Markit of the manner, format, context, content, conclusion, opinion or viewpoint in which IHS Markit reports, data and information or its derivations are used or referenced herein.
13
“Safe Harbor Statement”
This report contains statements that are not historical facts but rather forward-looking statements within the meaning of the Private Securities Litigation Reform Act of 1995. Such forward-looking statements include those that address activities, events or developments that Autoliv, Inc. or its management believes or anticipates may occur in the future. All forward-looking statements are based upon our current expectations, various assumptions and/or data available from third parties. Our expectations and assumptions are expressed in good faith and we believe there is a reasonable basis for them. However, there can be no assurance that such forward-looking statements will materialize or prove to be correct as forward-looking statements are inherently subject to known and unknown risks, uncertainties and other factors which may cause actual future results, performance or achievements to differ materially from the future results, performance or achievements expressed in or implied by such forward-looking statements. In some cases, you can identify these statements by forward-looking words such as “estimates”, “expects”, “anticipates”, “projects”, “plans”, “intends”, “believes”, “may”, “likely”, “might”, “would”, “should”, “could”, or the negative of these terms and other comparable terminology, although not all forward-looking statements contain such words. Because these forward-looking statements involve risks and uncertainties, the outcome could differ materially from those set out in the forward-looking statements for a variety of reasons, including without limitation, general economic conditions; the impacts of the coronavirus (COVID-19) pandemic on the Company’s financial condition, business operations, operating costs, liquidity and competition and on the global economy; changes in light vehicle production; fluctuation in vehicle production schedules for which the Company is a supplier; global supply chain disruptions including port, transportation and distribution delays or interruptions; supply chain disruptions and component shortages specific to the automotive industry or the Company; changes in general industry and market conditions or regional growth or decline; changes in and the successful execution of our capacity alignment, restructuring, cost reduction and efficiency
initiatives and the market reaction thereto; loss of business from increased competition; higher raw material, fuel and energy costs; changes in consumer and customer preferences for end products; customer losses; changes in regulatory conditions; customer bankruptcies, consolidations, or restructuring or divestiture of customer brands; unfavorable fluctuations in currencies or interest rates among the various jurisdictions in which we operate; market acceptance of our new products; costs or difficulties related to the integration of any new or acquired businesses and technologies; continued uncertainty in pricing negotiations with customers; successful integration of acquisitions and operations of joint ventures; successful implementation of strategic partnerships and collaborations; our ability to be awarded new business; product liability, warranty and recall claims and investigations and other litigation and customer reactions thereto; higher expenses for our pension and other postretirement benefits, including higher funding needs for our pension plans; work stoppages or other labor issues; possible adverse results of pending or future litigation or infringement claims and the availability of insurance with respect to such matters; our ability to protect our intellectual property rights; negative impacts of antitrust investigations or other governmental investigations and associated litigation relating to the conduct of our business; tax assessments by governmental authorities and changes in our effective tax rate; dependence on key personnel; legislative or regulatory changes impacting or limiting our business; political conditions; our ability to meet our sustainability targets, goals and commitments; dependence on and relationships with customers and suppliers; and other risks and uncertainties identified under the headings “Risk Factors” and “Management’s Discussion and Analysis of Financial Condition and Results of Operations” in our Annual Reports and Quarterly Reports on Forms 10-K and 10-Q and any amendments thereto. For any forward-looking statements contained in this or any other document, we claim the protection of the safe harbor for forward-looking statements contained in the Private Securities Litigation Reform Act of 1995, and we assume no obligation to update publicly or revise any forward-looking statements in light of new information or future events, except as required by law.
14

Consolidated Statements of Net Income
| | | | | |
(Dollars in millions, except per share data, unaudited) | Fourth quarter | | Full year |
| 2021 | 2020 | | 2021 | 2020 |
Airbag products and Other1) | $1,408 | $1,637 | | $5,380 | $4,824 |
Seatbelt products1) | 711 | 880 | | 2,850 | 2,623 |
Total net sales | $2,119 | $2,517 | | $8,230 | $7,447 |
| | | | | |
Cost of sales | (1,751) | (2,015) | | (6,719) | (6,201) |
Gross profit | $368 | $502 | | $1,511 | $1,247 |
| | | | | |
Selling, general & administrative expenses | (113) | (106) | | (432) | (389) |
Research, development & engineering expenses, net | (80) | (83) | | (391) | (376) |
Amortization of intangibles | (3) | (3) | | (10) | (10) |
Other income (expense), net | 1 | (4) | | (3) | (90) |
Operating income | $174 | $307 | | $675 | $382 |
| | | | | |
Income from equity method investments | 1 | 1 | | 3 | 2 |
Interest income | 1 | 1 | | 4 | 5 |
Interest expense | (14) | (20) | | (60) | (73) |
Other non-operating items, net | (4) | (11) | | (7) | (25) |
Income before income taxes | $158 | $278 | | $614 | $291 |
| | | | | |
Income taxes | (42) | (89) | | (177) | (103) |
Net income | $115 | $189 | | $437 | $188 |
| | | | | |
Less: Net income attributable to non-controlling interest | 0 | 0 | | 2 | 1 |
Net income attributable to controlling interest | $115 | $189 | | $435 | $187 |
| | | | | |
Earnings per share2, 3) | $1.31 | $2.15 | | $4.96 | $2.14 |
1) Including Corporate and other sales. 2) Assuming dilution when applicable and net of treasury shares. 3) Participating share awards with right to receive dividend equivalents are (under the two-class method) excluded from EPS calculation. |
15
Consolidated Balance Sheets
| | | | | | |
| | Dec 31 | Sep 30 | Jun 30 | Mar 31 | Dec 31 |
(Dollars in millions, unaudited) | | 2021 | 2021 | 2021 | 2021 | 2020 |
Assets | | | | | | |
Cash & cash equivalents | | $969 | $903 | $893 | $1,254 | $1,178 |
Receivables, net | | 1,699 | 1,575 | 1,719 | 1,846 | 1,822 |
Inventories, net | | 777 | 922 | 901 | 856 | 798 |
Prepaid expenses | | 164 | 242 | 230 | 183 | 164 |
Other current assets | | 65 | 68 | 60 | 260 | 307 |
Total current assets | | $3,675 | $3,710 | $3,804 | $4,399 | $4,269 |
| | | | | | |
Property, plant & equipment, net | | 1,855 | 1,813 | 1,833 | 1,810 | 1,869 |
Operating leases right-of-use assets | | 132 | 123 | 133 | 137 | 141 |
Goodwill | | 1,387 | 1,389 | 1,393 | 1,392 | 1,398 |
Intangible assets, net | | 8 | 9 | 11 | 14 | 14 |
Investments and other non-current assets | | 481 | 467 | 462 | 457 | 466 |
Total assets | | $7,537 | $7,511 | $7,636 | $8,210 | $8,157 |
| | | | | | |
Liabilities and equity | | | | | | |
Short-term debt | | $346 | $364 | $363 | $291 | $302 |
Accounts payable | | 1,144 | 1,076 | 1,125 | 1,215 | 1,254 |
Accrued expenses | | 996 | 1,096 | 1,066 | 1,323 | 1,270 |
Operating lease liabilities - current | | 38 | 38 | 39 | 38 | 37 |
Other current liabilities | | 297 | 237 | 260 | 321 | 284 |
Total current liabilities | | $2,821 | $2,811 | $2,852 | $3,188 | $3,147 |
| | | | | | |
Long-term debt | | 1,662 | 1,687 | 1,712 | 2,039 | 2,110 |
Pension liability | | 197 | 231 | 239 | 239 | 248 |
Operating lease liabilities - non-current | | 94 | 85 | 94 | 100 | 103 |
Other non-current liabilities | | 115 | 125 | 125 | 123 | 126 |
Total non-current liabilities | | $2,067 | $2,127 | $2,170 | $2,501 | $2,587 |
| | | | | | |
Total parent shareholders’ equity | | 2,633 | 2,558 | 2,600 | 2,507 | 2,409 |
Non-controlling interest | | 15 | 15 | 15 | 14 | 14 |
Total equity | | $2,648 | $2,573 | $2,615 | $2,521 | $2,423 |
| | | | | | |
Total liabilities and equity | | $7,537 | $7,511 | $7,636 | $8,210 | $8,157 |
|
16
Consolidated Statements of Cash Flow
| | | | | |
| Fourth quarter | | Full year |
(Dollars in millions, unaudited) | 2021 | 2020 | �� | 2021 | 2020 |
Net income | $115 | $189 | | $437 | $188 |
Depreciation and amortization | 97 | 103 | | 394 | 371 |
Other, net | (12) | 64 | | (15) | 13 |
Changes in operating working capital, net | 116 | 113 | | (63) | 277 |
Net cash provided by operating activities | $317 | $469 | | $754 | $849 |
| | | | | |
Expenditures for property, plant and equipment | (154) | (112) | | (458) | (344) |
Proceeds from sale of property, plant and equipment | 1 | 1 | | 4 | 4 |
Net cash used in investing activities | $(153) | $(111) | | $(454) | $(340) |
| | | | | |
Net cash before financing1) | $164 | $358 | | $300 | $509 |
| | | | | |
(Decrease) in short term debt | (9) | (42) | | (286) | (240) |
Repayment of long-term debt | – | (723) | | – | (723) |
Increase (decrease) long-term debt | (19) | 87 | | (20) | 1,177 |
Dividends paid | (56) | – | | (165) | (54) |
Common stock options exercised | 0 | 1 | | 3 | 1 |
Dividend paid to non-controlling interests | (0) | (0) | | (1) | (1) |
Net cash (used in) provided by financing activities | $(84) | $(678) | | $(469) | $160 |
| | | | | |
Effect of exchange rate changes on cash | (14) | 22 | | (39) | 64 |
Increase (decrease) in cash and cash equivalents | $66 | $(298) | | $(209) | $733 |
Cash and cash equivalents at period-start | 904 | 1,477 | | 1,178 | 445 |
Cash and cash equivalents at period-end | $969 | $1,178 | | $969 | $1,178 |
1) Non-U.S. GAAP measure comprised of "Net cash provided by operating activities" and "Net cash used in investing activities". See reconciliation table. |
17
RECONCILIATION OF U.S. GAAP TO NON-U.S. GAAP MEASURES
In this report we sometimes refer to non-U.S. GAAP measures that we and securities analysts use in measuring Autoliv's performance. We believe that these measures assist investors and management in analyzing trends in the Company's business for the reasons given below. Investors should not consider these non-U.S. GAAP measures as substitutes, but rather as additions, to financial reporting measures prepared in accordance with U.S. GAAP. It should be noted that these measures, as defined, may not be comparable to similarly titled measures used by other companies.
Components in Sales Increase/Decrease
Since the Company historically generates approximately 75% of sales in currencies other than in the reporting currency (i.e. U.S. dollars) and currency rates have been volatile, we analyze the Company's sales trends and performance as changes in organic sales growth. This presents the increase or decrease in the overall U.S. dollar net sales on a comparable basis, allowing separate discussions of the impact of acquisitions/divestitures and exchange rates. The tables on pages 6 and 7 present changes in organic sales growth as reconciled to the change in the total U.S. GAAP net sales.
Trade Working Capital
Due to the need to optimize cash generation to create value for shareholders, management focuses on operationally derived trade working capital as defined in the table below. The reconciling items used to derive this measure are, by contrast, managed as part of our overall management of cash and debt, but they are not part of the responsibilities of day-to-day operations' management.
| | | | | |
| Dec 31 | Sep 30 | Jun 30 | Mar 31 | Dec 31 |
(Dollars in millions) | 2021 | 2021 | 2021 | 2021 | 2020 |
Receivables, net | $1,699 | $1,575 | $1,719 | $1,846 | $1,822 |
Inventories, net | $777 | $922 | $901 | $856 | $798 |
Accounts payable | $(1,144) | $(1,076) | $(1,125) | $(1,215) | $(1,254) |
Trade Working capital | $1,332 | $1,421 | $1,495 | $1,487 | $1,366 |
18
Net Debt
Autoliv from time to time enters into “debt-related derivatives” (DRDs) as a part of its debt management and as part of efficiently managing the Company’s overall cost of funds. Creditors and credit rating agencies use net debt adjusted for DRDs in their analyses of the Company’s debt, therefore we provide this non-U.S. GAAP measure. DRDs are fair value adjustments to the carrying value of the underlying debt. Also included in the DRDs is the unamortized fair value adjustment related to a discontinued fair value hedge that will be amortized over the remaining life of the debt. By adjusting for DRDs, the total financial liability of net debt is disclosed without grossing debt up with currency or interest fair values.
| | | | | |
| Dec 31 | Sep 30 | Jun 30 | Mar 31 | Dec 31 |
(Dollars in millions) | 2021 | 2021 | 2021 | 2021 | 2020 |
Short-term debt | $346 | $364 | $363 | $291 | $302 |
Long-term debt | 1,662 | 1,687 | 1,712 | 2,039 | 2,110 |
Total debt | $2,008 | $2,051 | $2,075 | $2,330 | $2,411 |
Cash & cash equivalents | (969) | (903) | (893) | (1,254) | (1,178) |
Debt issuance cost/Debt-related derivatives, net | 13 | 18 | 18 | 39 | (19) |
Net debt | $1,052 | $1,165 | $1,200 | $1,115 | $1,214 |
| | | | | |
| | Dec 31 | Dec 31 | Dec 31 | Dec 31 |
(Dollars in millions) | | 2019 | 2018 | 2017 | 2016 |
Short-term debt | | $368 | $621 | $20 | $216 |
Long-term debt | | 1,726 | 1,609 | 1,311 | 1,313 |
Total debt | | $2,094 | $2,230 | $1,330 | $1,529 |
Cash & cash equivalents | | (445) | (616) | (960) | (1,227) |
Debt issuance cost/Debt-related derivatives, net | | 0 | 5 | (3) | (3) |
Net debt | | $1,650 | $1,619 | $368 | $299 |
19
Leverage ratio
The non-U.S. GAAP measure “net debt” is also used in the non-U.S. GAAP measure “Leverage ratio”. Management uses this measure to analyze the amount of debt the Company can incur under its debt policy. Management believes that this policy also provides guidance to credit and equity investors regarding the extent to which the Company would be prepared to leverage its operations. In 2021, EBITDA calculation was redefined to exclude other non-operating items and income from equity method investments. Historic EBITDA and leverage ratio have been recalculated resulting in minor adjustments. Autoliv’s policy is to maintain a leverage ratio commensurate with a strong investment grade credit rating. The Company measures its leverage ratio as net debt* adjusted for pension liabilities in relation to adjusted EBITDA*. The long-term target is to maintain a leverage ratio of around 1.0x within a range of 0.5x to 1.5x.
| | | |
| Dec 31 | Sep 30 | Dec 31 |
(Dollars in millions) | 2021 | 2021 | 2020 |
Net debt1) | $1,052 | $1,165 | $1,214 |
Pension liabilities | 197 | 231 | 248 |
Debt per the Policy | $1,248 | $1,396 | $1,462 |
| | | |
Net income2) | $437 | $511 | $188 |
Income taxes2) | 177 | 224 | 103 |
Interest expense, net2, 3) | 57 | 62 | 68 |
Other non-operating items, net2) | 7 | 14 | 25 |
Income from equity method investments2) | (3) | (3) | (2) |
Depreciation and amortization of intangibles2) | 394 | 400 | 371 |
Capacity alignments and antitrust related matters2) | 8 | 10 | 99 |
EBITDA per the Policy (Adjusted EBITDA) | $1,077 | $1,217 | $852 |
| | | |
Leverage ratio | 1.2 | 1.1 | 1.7 |
1) Short- and long-term debt less cash and cash equivalents and debt-related derivatives. 2) Latest 12 months. 3) Interest expense including cost for extinguishment of debt, if any, less interest income. |
20
Free Cash Flow, Net Cash Before Financing and Cash Conversion
Management uses the non-U.S. GAAP measure “free cash flow” to analyze the amount of cash flow being generated by the Company’s operations after capital expenditure, net. This measure indicates the Company’s cash flow generation level that enables strategic value creation options such as dividends or acquisitions. For details on free cash flow, see the reconciliation table below. Management uses the non-U.S. GAAP measure “net cash before financing” to analyze and disclose the cash flow generation available for servicing external stakeholders such as shareholders and debt stakeholders. For details on net cash before financing, see the reconciliation table below. Management uses the non-U.S. GAAP measure “cash conversion” to analyze the proportion of net income that is converted into free cash flow. The measure is a tool to evaluate how efficient the Company utilizes its resources. For details on cash conversion, see the reconciliation table below.
| | | | | |
| Fourth quarter | | Full year |
(Dollars in millions) | 2021 | 2020 | | 2021 | 2020 |
Net income | $115 | $189 | | $437 | $188 |
Changes in operating working capital | 116 | 113 | | (63) | 277 |
Depreciation and amortization | 97 | 103 | | 394 | 371 |
Other, net | (12) | 64 | | (15) | 13 |
Operating cash flow | $317 | $469 | | $754 | $849 |
Capital expenditure, net | (153) | (111) | | (454) | (340) |
Free cash flow1) | $164 | $358 | | $300 | $509 |
Net cash before financing | $164 | $358 | | $300 | $509 |
Cash conversion2) | 142% | 189% | | 68.6% | 270% |
1) Operating cash flow less Capital expenditure, net. 2) Free cash flow relative to Net income. |
| | | | | |
| Full year | Full year | | Full year | Full year |
(Dollars in millions) | 2019 | 20181) | | 20171) | 20161) |
Net income | $463 | $184 | | $303 | $562 |
Changes in operating assets and liabilities | 47 | (229) | | (0) | (78) |
Depreciation and amortization | 351 | 397 | | 426 | 383 |
Goodwill impairment charges | – | – | | 234 | – |
Other, net2) | (220) | 239 | | (27) | 2 |
Operating cash flow | $641 | $591 | | $936 | $868 |
EC antitrust payment | (203) | – | | – | – |
Operating cash flow excl antitrust | $844 | $591 | | $936 | $868 |
Capital expenditure, net | (476) | (555) | | (570) | (499) |
Free cash flow3) | $165 | $36 | | $366 | $370 |
Free cash flow excl antitrust payment4) | $368 | $36 | | $366 | $370 |
Acquisitions of businesses and other, net | - | (73) | | (128) | (227) |
Net cash before financing | $165 | $(37) | | $239 | $142 |
Cash conversion5) | 35.6% | 19.5% | | 121% | 65.8% |
Cash conversion excl antitrust6) | 79.4% | 19.5% | | 121% | 65.8% |
1) Including Discontinued Operations. 2) Including EC antitrust non-cash provision 2018 and EC antitrust payment 2019. 3) Operating cash flow less Capital expenditure, net. 4) For 2019, Operating cashflow excluding EC antitrust payment less Capital expenditure, net. 5) Free cash flow relative to Net income. 6) For 2019, Free cash flow excluding EC antitrust payment relative to Net income. |
21
Items Affecting Comparability
We believe that comparability between periods is improved through the exclusion of certain items. To assist investors in understanding the operating performance of Autoliv's business, it is useful to consider certain U.S. GAAP measures exclusive of these items. Accordingly, the tables below reconcile from U.S. GAAP to the equivalent non-U.S. GAAP measure.
| | | | | | | |
| Fourth quarter 2021 | | Fourth quarter 2020 |
(Dollars in millions, except per share data) | Reported
U.S. GAAP | Adjust-ments1) | Non-U.S.
GAAP | | Reported
U.S. GAAP | Adjust-ments1) | Non-U.S.
GAAP |
Operating income | $174 | $3 | $177 | | $307 | $5 | $311 |
Operating margin | 8.2% | 0.1% | 8.3% | | 12.2% | 0.2% | 12.4% |
Income before taxes | $158 | $3 | $160 | | $278 | $5 | $283 |
Net income attributable to controlling interest | $115 | $(1) | $114 | | $189 | $3 | $192 |
Return on capital employed2) | 18.9% | 0.3% | 19.1% | | 33.7% | (0.3)% | 33.4% |
Return on total equity3) | 17.6% | (0.1)% | 17.5% | | 33.3% | (0.6)% | 32.7% |
Earnings per share4, 5) | $1.31 | $(0.01) | $1.30 | | $2.15 | $0.04 | $2.19 |
1) Costs for capacity alignment and in 2020 antitrust related matters. 2) Annualized operating income and income from equity method investments, relative to average capital employed. 3) Annualized income relative to average total equity. 4) Assuming dilution and net of treasury shares. 5) Participating share awards with right to receive dividend equivalents are (under the two-class method) excluded from the EPS calculation. |
| | | | | | | |
| Full year 2021 | | Full year 2020 |
| Reported
U.S. GAAP | Adjust-ments1) | Non-U.S.
GAAP | | Reported
U.S. GAAP | Adjust-ments1) | Non-U.S.
GAAP |
Operating income | $675 | $8 | $683 | | $382 | $99 | $482 |
Operating margin | 8.2% | 0.1% | 8.3% | | 5.1% | 1.4% | 6.5% |
Income before taxes | $614 | $8 | $622 | | $291 | $99 | $391 |
Net income attributable to controlling interest | $435 | $5 | $440 | | $187 | $88 | $275 |
Capital employed | $3,700 | $5 | $3,705 | | $3,637 | $88 | $3,725 |
Return on capital employed2) | 18.3% | 0.2% | 18.5% | | 10.4% | 2.5% | 12.9% |
Return on total equity3) | 17.1% | 0.2% | 17.3% | | 8.8% | 3.9% | 12.7% |
Earnings per share4, 5) | $4.96 | $0.06 | $5.02 | | $2.14 | $1.01 | $3.15 |
Total parent shareholders' equity per share | $30.10 | $0.06 | $30.15 | | $27.56 | $1.01 | $28.57 |
1) Costs for capacity alignment and in 2020 antitrust related matters. 2) Annualized operating income and income from equity method investments, relative to average capital employed. 3) Annualized income relative to average total equity. 4) Assuming dilution when applicable and net of treasury shares. 5) Participating share awards with right to receive dividend equivalents are (under the two-class method) excluded from the EPS calculation. |
| | | | | | | |
| Full year 2019 | | Full year 2018 |
| Reported
U.S. GAAP | Adjust-ments1) | Non-U.S.
GAAP | | Reported
U.S. GAAP | Adjust-ments1) | Non-U.S.
GAAP |
Operating income | $726 | $49 | $774 | | $686 | $222 | $908 |
Operating margin | 8.5% | 0.6% | 9.1% | | 7.9% | 2.6% | 10.5% |
1) Costs for capacity alignment and antitrust related matters and separation of our business segments. |
| | | | | | | |
| Full year 2017 | | Full year 2016 |
| Reported
U.S. GAAP | Adjust-ments1) | Non-U.S.
GAAP | | Reported
U.S. GAAP | Adjust-ments1) | Non-U.S.
GAAP |
Operating income | $860 | $40 | $899 | | $831 | $35 | $866 |
Operating margin | 10.6% | 0.5% | 11.1% | | 10.5% | 0.4% | 10.9% |
1) Costs for capacity alignment and antitrust related matters. |
22
| | | | | |
Items included in Non-U.S. GAAP adjustments | Fourth quarter 2021 | | Fourth quarter 2020 |
| Adjustment
Million | Adjustment
Per share | | Adjustment
Million | Adjustment
Per share |
Capacity alignment | $3 | $0.03 | | $4 | $0.05 |
Antitrust related matters | - | - | | $0 | $0.00 |
Total adjustments to operating income | $3 | $0.03 | | $5 | $0.05 |
Tax on non-U.S. GAAP adjustments1) | $(3) | $(0.04) | | $(1) | $(0.01) |
Total adjustments to net income | $(1) | $(0.01) | | $3 | $0.04 |
| | | | | |
Average number of shares outstanding - diluted2) | | 87.7 | | | 87.5 |
| | | | | |
Annualized adjustment on return on capital employed | $11 | | | $18 | |
Adjustment return on capital employed | 0.3% | | | (0.3)% | |
| | | | | |
Annualized adjustment on return on total equity | $(2) | | | $14 | |
Adjustment return on total equity | (0.1)% | | | (0.6)% | |
1) The tax is calculated based on the tax laws in the respective jurisdiction(s) of the adjustment(s). 2) Annualized average number of outstanding shares |
| | | | | |
Items included in Non-GAAP adjustments | Full year 2021 | | Full year 2020 |
| Adjustment
Million | Adjustment
Per share | | Adjustment
Million | Adjustment
Per share |
Capacity alignment | $8 | $0.10 | | $99 | $1.13 |
Antitrust related matters | - | - | | $1 | $0.01 |
Total adjustments to operating income | $8 | $0.10 | | $99 | $1.14 |
Tax on non-U.S. GAAP adjustments1) | $(3) | $(0.04) | | $(11) | $(0.13) |
Total adjustments to net income | $5 | $0.06 | | $88 | $1.01 |
| | | | | |
Average number of shares outstanding - diluted2) | | 87.7 | | | 87.5 |
| | | | | |
Annualized adjustment on Return on capital employed | $8 | | | $99 | |
Adjustment Return on capital employed | 0.2% | | | 2.5% | |
| | | | | |
Annualized adjustment on Return on total equity | $5 | | | $88 | |
Adjustment return on total equity | 0.2% | | | 3.9% | |
1) The tax is calculated based on the tax laws in the respective jurisdiction(s) of the adjustment(s). 2) Annualized average number of outstanding shares |
23
Multi-year Summary
Continuing Operations unless noted
| | | | | |
(Dollars in millions, unaudited) | 2021 | 2020 | 2019 | 2018 | 2017 |
Sales and Income | | | | | |
Net sales | $8,230 | $7,447 | $8,548 | $8,678 | $8,137 |
Airbag sales1) | 5,380 | 4,824 | 5,676 | 5,699 | 5,342 |
Seatbelt sales | 2,850 | 2,623 | 2,871 | 2,980 | 2,794 |
Operating income | 675 | 382 | 726 | 686 | 860 |
Net income attributable to controlling interest | 435 | 187 | 462 | 376 | 586 |
Earnings per share (US$) – basic2) | 4.97 | 2.14 | 5.29 | 4.32 | 6.70 |
Earnings per share (US$) – assuming dilution2, 3) | 4.96 | 2.14 | 5.29 | 4.31 | 6.68 |
Gross margin4) | 18.4% | 16.7% | 18.5% | 19.7% | 20.6% |
R,D&E net in relation to sales | (4.7)% | (5.0)% | (4.7)% | (4.8)% | (4.6)% |
S,G &A net in relation to sales | (5.3)% | (5.2)% | (4.7)% | (4.5)% | (5.0)% |
Operating margin5) | 8.2% | 5.1% | 8.5% | 7.9% | 10.6% |
Adjusted operating margin6, 7) | 8.3% | 6.5% | 9.1% | 10.5% | 11.1% |
Balance Sheet | | | | | |
Trade working capital8) | 1,332 | 1,366 | 1,417 | 1,396 | 1,444 |
Trade working capital in relation to sales9) | 15.7% | 13.6% | 16.2% | 15.9% | 16.7% |
Receivables outstanding in relation to sales10) | 20.0% | 18.1% | 18.6% | 19.0% | 19.6% |
Inventory outstanding in relation to sales11) | 9.2% | 7.9% | 8.5% | 8.6% | 8.2% |
Payables outstanding in relation to sales12) | 13.5% | 12.5% | 10.8% | 11.7% | 11.1% |
Total equity | 2,648 | 2,423 | 2,122 | 1,897 | 4,169 |
Total parent shareholders’ equity per share (US$) | 30.10 | 27.56 | 24.19 | 21.63 | 46.38 |
Current assets excluding cash | 2,705 | 3,091 | 2,557 | 2,670 | 2,598 |
Property, plant and equipment, net | 1,855 | 1,869 | 1,816 | 1,690 | 1,609 |
Intangible assets (primarily goodwill) | 1,395 | 1,412 | 1,410 | 1,423 | 1,440 |
Capital employed | 3,700 | 3,637 | 3,772 | 3,516 | 4,538 |
Net debt7) | 1,052 | 1,214 | 1,650 | 1,619 | 368 |
Total assets | 7,537 | 8,157 | 6,771 | 6,722 | 6,947 |
Long-term debt | 1,662 | 2,110 | 1,726 | 1,609 | 1,311 |
Return on capital employed13, 14) | 18% | 10% | 20% | 17% | n/a |
Return on total equity14, 15) | 17% | 9% | 23% | 13% | n/a |
Total equity ratio | 35% | 30% | 31% | 28% | 49% |
Cash flow and other data | | | | | |
Operating Cash flow16) | 754 | 849 | 641 | 591 | 936 |
Depreciation and amortization16) | 394 | 371 | 351 | 397 | 426 |
Capital expenditures, net16) | 454 | 340 | 476 | 555 | 570 |
Capital expenditures, net in relation to sales16) | 5.5% | 4.6% | 5.6% | 5.7% | 5.5% |
Free Cash flow7, 16, 17) | 300 | 509 | 165 | 36 | 366 |
Cash conversion7, 16, 18) | 68.6% | 270% | 35.6% | 19.5% | 121% |
Direct shareholder return16, 19) | 165 | 54 | 217 | 214 | 366 |
Cash dividends paid per share (US$) | 1.88 | 0.62 | 2.48 | 2.46 | 2.38 |
Number of shares outstanding (millions)20) | 87.5 | 87.4 | 87.2 | 87.1 | 87.0 |
Number of employees, December 31 | 55,900 | 61,000 | 58,900 | 57,700 | 56,700 |
1) Including steering wheels, inflators and initiators. 2) Participating share awards with right to receive dividend equivalents are (under the two-class method) excluded from the EPS calculation. 3) Assuming dilution and net of treasury shares. 4) Gross profit relative to sales. 5) Operating income relative to sales. 6) Excluding costs for capacity alignment, antitrust related matters and separation of our business segments. 7) Non-US GAAP measure, for reconciliation see tables above. 8) Outstanding receivables and outstanding inventory less outstanding payables. 9) Outstanding receivables and outstanding inventory less outstanding payables relative to annualized fourth quarter sales. 10) Outstanding receivables relative to annualized fourth quarter sales. 11) Outstanding inventory relative to annualized fourth quarter sales. 12) Outstanding payables relative to annualized fourth quarter sales. 13) Operating income and income from equity method investments, relative to average capital employed. 14) The Company has decided not to recalculate prior periods since the distribution of Veoneer had a significant impact on total equity and capital employed making the comparison less meaningful. 15) Income relative to average total equity. 16) Including Discontinued Operations in 2017 and 2018. 17) Operating cash flow less Capital expenditures, net. 18) Free cash flow relative to Net income. 19) Dividends paid and Shares repurchased. 20) At year end, excluding dilution and net of treasury shares. |
24