Business Results First Quarter of Fiscal Year Ending March 31, 2018 MinebeaMitsumi Inc. August 4, 2017 |  |
Summary of Consolidated Business Results for 1Q 1Q net sales, operating income, ordinary income & net income hit record highs (Millions of yen) FY3/17 FY3/18 1Q Change 1Q 4Q YoY QoQ Net sales 120,288 196,418 193,204 +60.6% -1.6% Operating income 6,971 14,300 17,062 X2.4 +19.3% Ordinary income 7,255 13,621 17,372 X2.4 +27.5% Income attributable to owners of the parent 3,176 16,233 14,181 X4.5 -12.6% Net income per share (yen) 8.48 39.65 33.49 X3.9 -15.5% Foreign exchange rates FY3/17 1Q FY3/17 4Q FY3/18 1Q US$ (Y)111.12 (Y)114.29 (Y)111.48 Euro (Y)125.16 (Y)121.14 (Y)121.53 Thai Baht (Y)3.14 (Y)3.24 (Y)3.24 Chinese RMB (Y)17.03 (Y)16.54 (Y)16.18 August 4, 2017 2 | 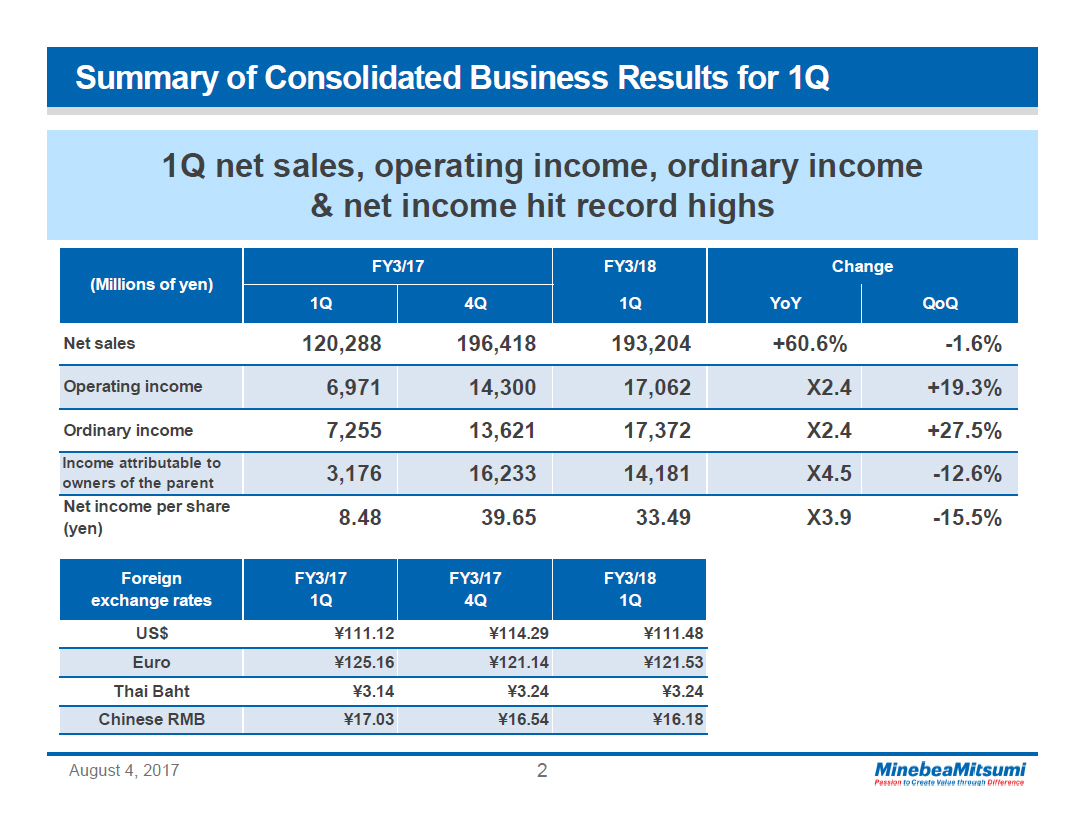 |
Net Sales Quarterly (Billions of yen) 1Q net sales hit record high 127.4 168.2 178.7 135.6 120.3 154.8 167.4 196.4 193.2 1Q 2Q 3Q 4Q 1Q 2Q 3Q 4Q 1Q FY3/16 FY3/17 FY3/18 August 4, 2017 3 | 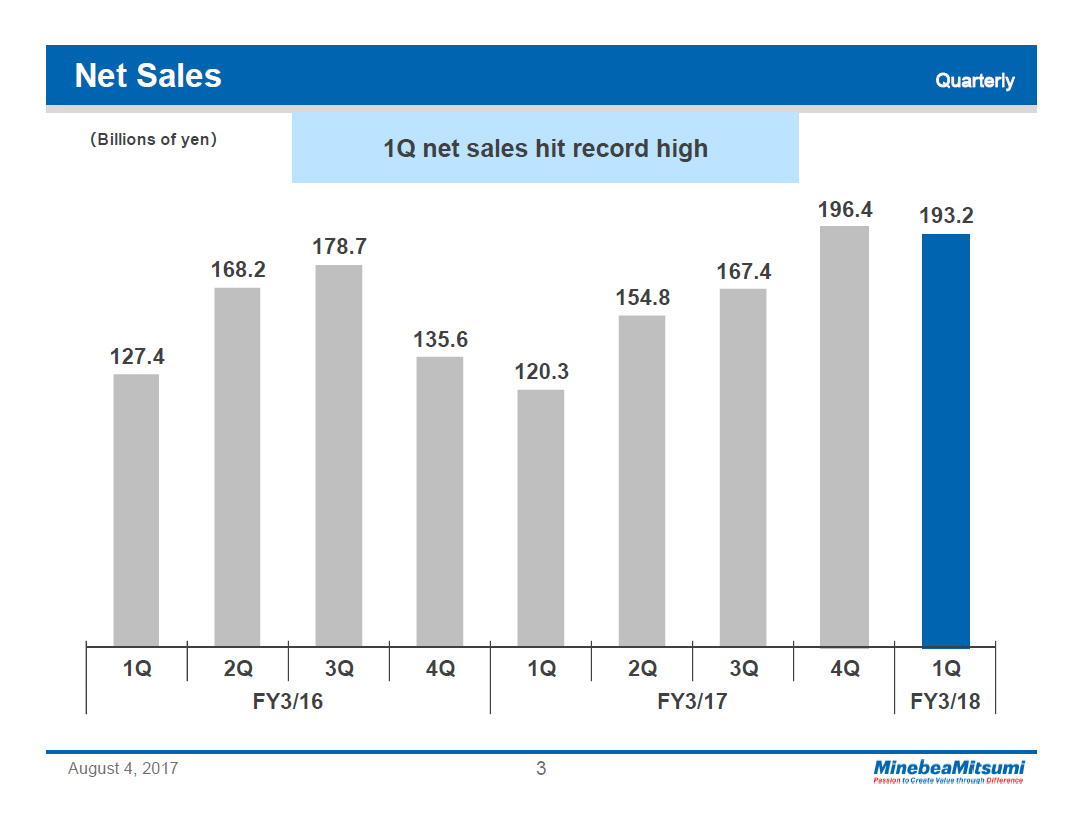 |
Operating Income Quarterly 1Q operating income hit record high (Billions of yen) Operating income Operating margin 12.5 14.9 15.5 8.5 7.0 11.6 16.1 14.3 17.1 9.8% 8.9% 8.7% 6.3% 5.8% 7.5% 9.6% 7.3% 8.8% 1Q 2Q 3Q 4Q 1Q 2Q 3Q 4Q 1Q FY3/16 FY3/17 FY3/18 August 4, 2017 4 | 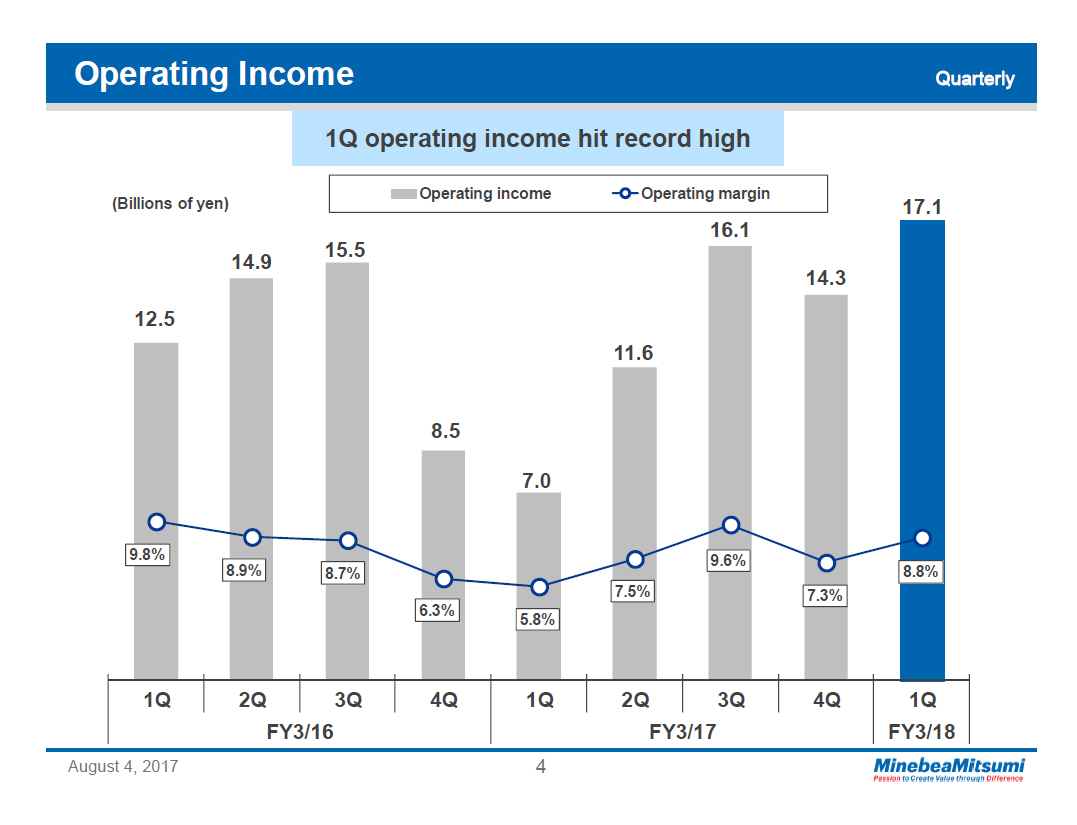 |
Machined Components Quarterly Net sales (Billions of yen) Pivot assemblies Rod-ends/Fasteners Ball bearings 41.0 42.3 40.8 39.8 39.2 37.3 38.5 41.3 40.6 8.3 9.5 8.9 7.6 7.6 7.9 8.7 8.4 7.9 8.1 8.0 7.8 8.2 8.0 7.1 6.8 7.7 7.5 24.6 24.8 24.0 24.0 23.6 22.3 23.1 25.2 25.2 1Q 2Q 3Q 4Q 1Q 2Q 3Q 4Q 1Q FY3/16 FY3/17 FY3/18 Operating income (Billions of yen) Operating income Operating margin 24.3% 24.2% 26.0% 25.3% 26.5% 24.5% 24.7% 24.5% 25.6% 10.0 10.2 10.6 10.1 10.4 9.1 9.5 10.1 10.4 1Q 2Q 3Q 4Q 1Q 2Q 3Q 4Q 1Q FY3/16 FY3/17 FY3/18 August 4, 2017 5 | 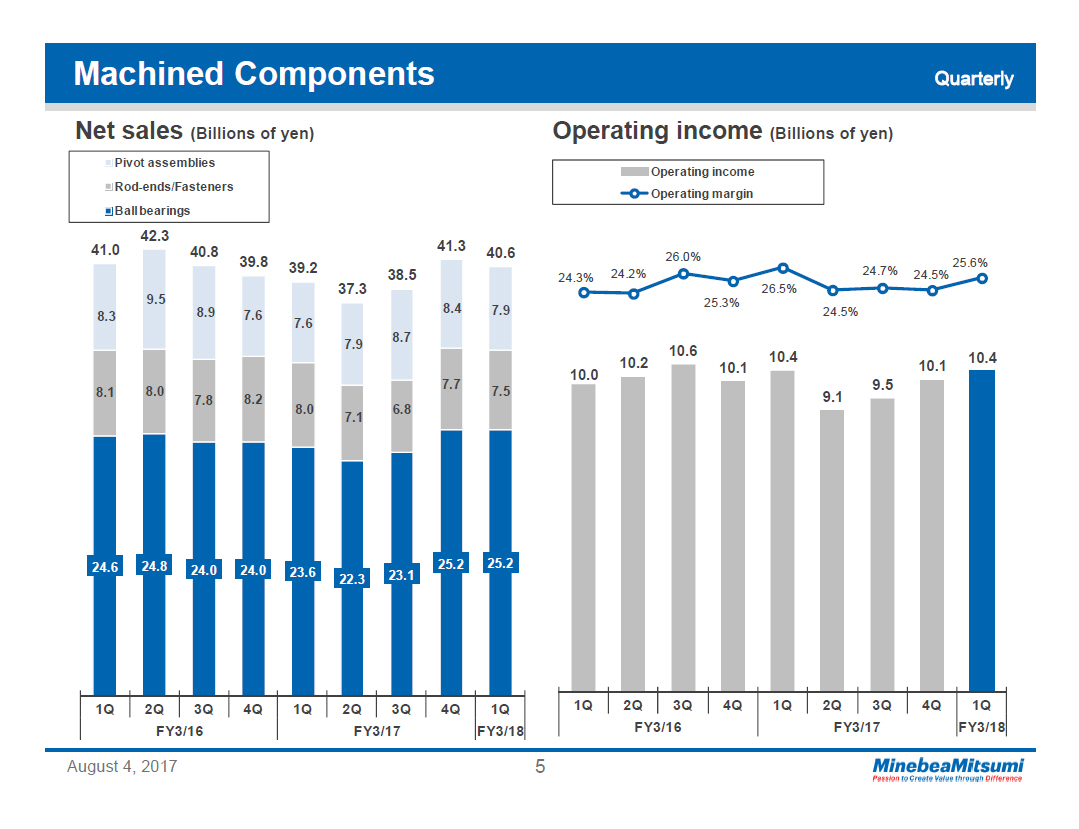 |
Electronic Devices & Components Quarterly Net sales (Billions of yen) Other Sensing devices Electronic devices Motors 0.7 86.3 0.7 125.8 0.7 137.8 1.2 95.7 0.7 80.9 0.9 117.4 1.2 128.7 1.3 114.6 0.7 104.4 8.2 9.7 9.4 8.6 8.6 8.9 8.5 12.3 8.3 37.8 73.3 87.3 46.6 32.2 68.9 80.9 58.9 51.3 39.7 42.0 40.2 39.1 39.4 38.8 38.0 42.1 44.0 1Q 2Q 3Q 4Q 1Q 2Q 3Q 4Q 1Q FY3/16 FY3/17 FY3/18 Operating income (Billions of yen) Operating income Operating margin 6.5% 5.4% 5.5% 2.5% 0.5% 5.5% 7.3% 4.9% 6.6% 5.6 6.7 7.6 2.4 0.4 6.4 9.4 5.6 6.8 1Q 2Q 3Q 4Q 1Q 2Q 3Q 4Q 1Q FY3/16 FY3/17 FY3/18 August 4, 2017 6 | 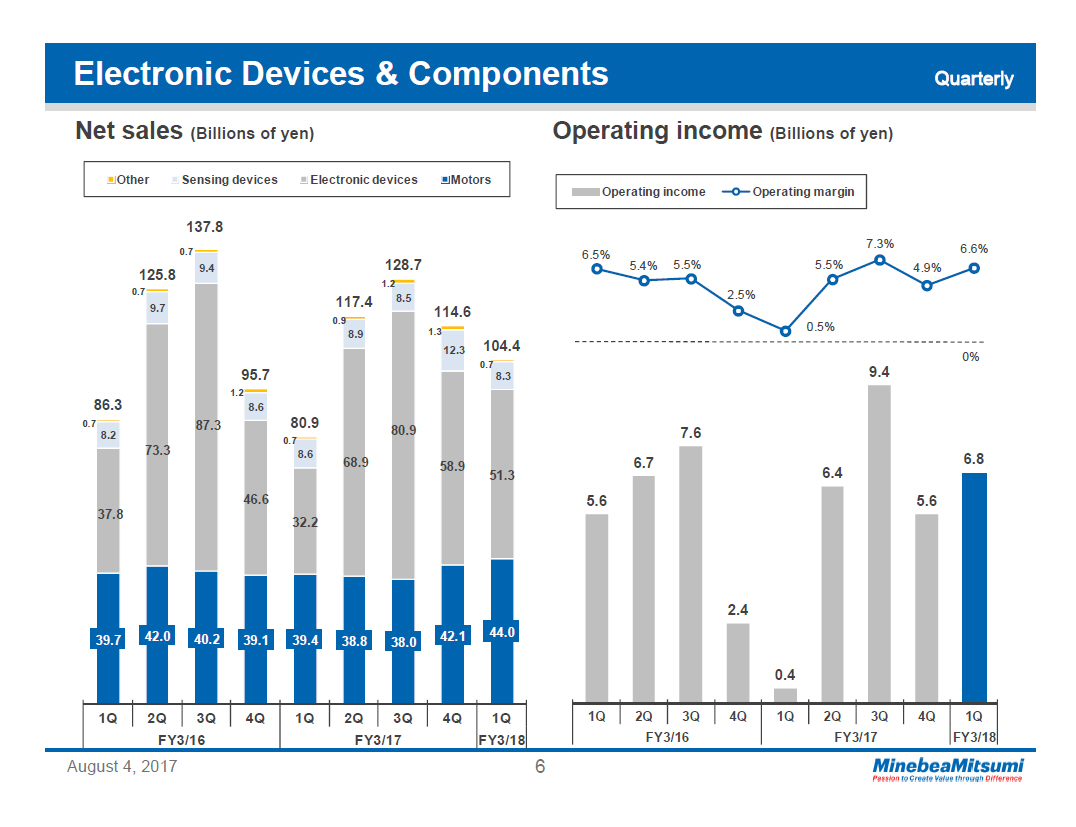 |
Mitsumi Business Both net sales and operating income in and before 3Q FY3/17 are pre-merger results. 4Q FY3/17 results are based on managerial accounting for the three months. Quarterly Net sales (Billions of yen) 34.2 49.5 40.4 39.5 32.6 44.6 47.8 (*1) 52.9 48.1 1Q 2Q 3Q 4Q 1Q 2Q 3Q 4Q 1Q FY3/16 FY3/17 FY3/18 Operating income (Billions of yen) Operating income Operating margin -5.0% 2.3% -5.0% -5.1% -10.7% -3.4% -19.4% 7.1% 7.9% 0% -1.7 1.1 -2.0 -2.0 -3.5 -1.5 -9.3 (*2) 3.0 (*1) 3.7 3.8 *1: Based on managerial accounting for the three months *2: Excluding \12.3bn of inventory write-down in 3Q 1Q 2Q 3Q 4Q 1Q 2Q 3Q 4Q 1Q FY3/16 FY3/17 FY3/18 August 4, 2017 7 | 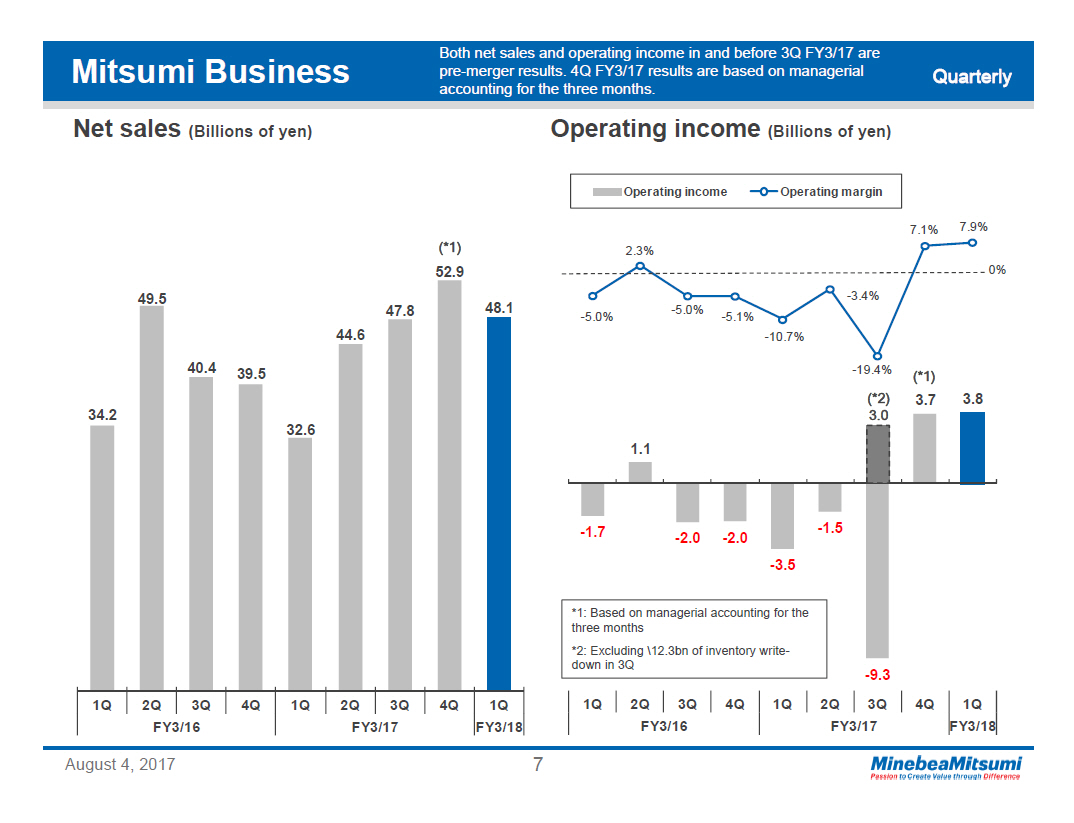 |
Net Income Quarterly (Billions of yen) 1Q net income hit record high Income attributable to owners of the parent Net income per share (yen) 10.1 7.7 11.8 6.8 3.2 9.6 12.2 16.2 14.2 26.9 20.6 31.6 18.2 8.5 25.5 32.4 39.7 33.5 1Q 2Q 3Q 4Q 1Q 2Q 3Q 4Q 1Q FY3/16 FY3/17 FY3/18 August 4, 2017 8 | 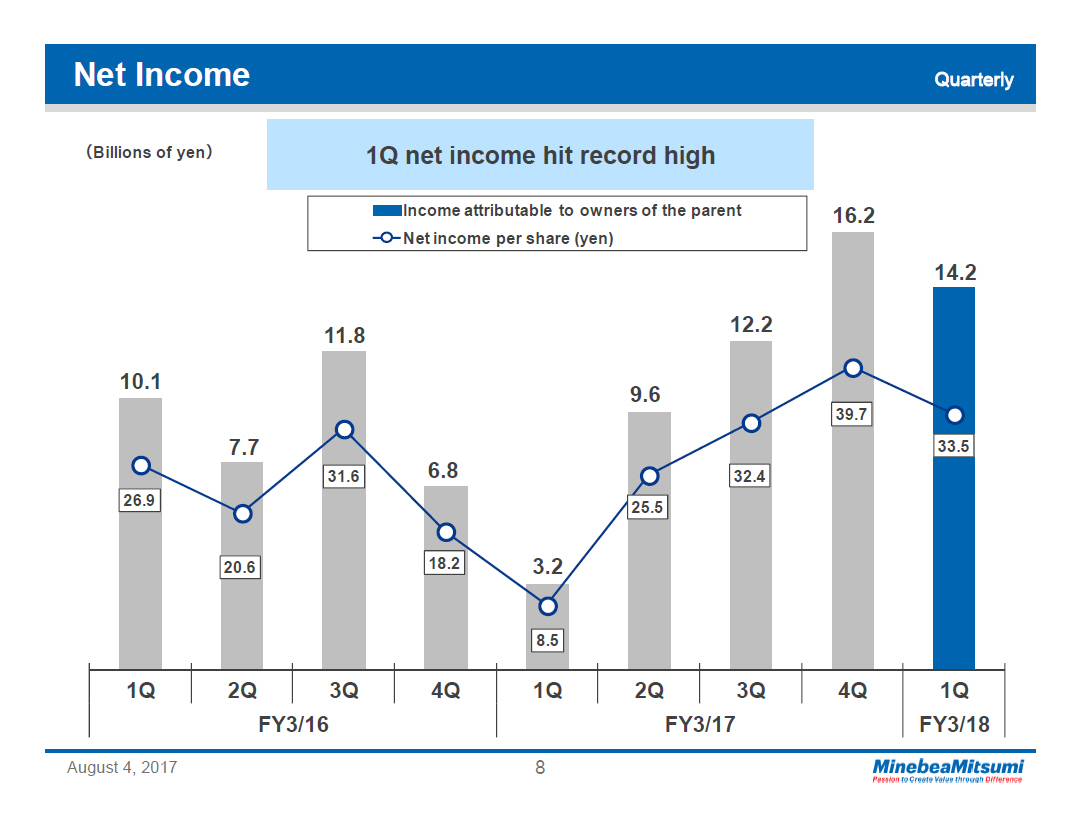 |
S.G. & A. Expenses Quarterly (Billions of yen) S.G. & A. expenses S.G. & A. to sales ratio 17.0 18.3 18.4 18.1 17.4 18.7 17.4 23.3 23.8 13.3% 10.9% 10.3% 13.3% 14.5% 12.1% 10.4% 11.9% 12.3% 1Q 2Q 3Q 4Q 1Q 2Q 3Q 4Q 1Q FY3/16 FY3/17 FY3/18 August 4, 2017 9 | 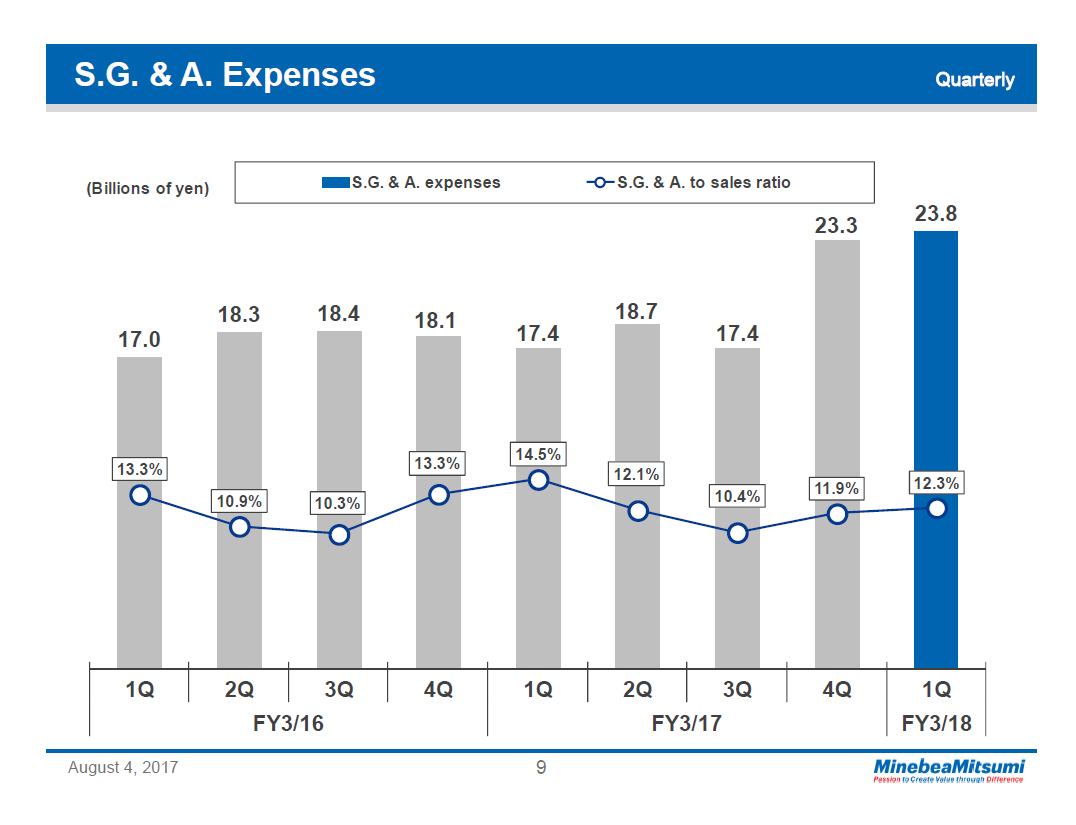 |
Inventories Quarterly (Billions of yen) 94.5 118.1 126.7 103.0 87.0 96.4 96.7 120.4 134.0 1Q 2Q 3Q 4Q 1Q 2Q 3Q 4Q 1Q FY3/16 FY3/17 FY3/18 August 4, 2017 10 | 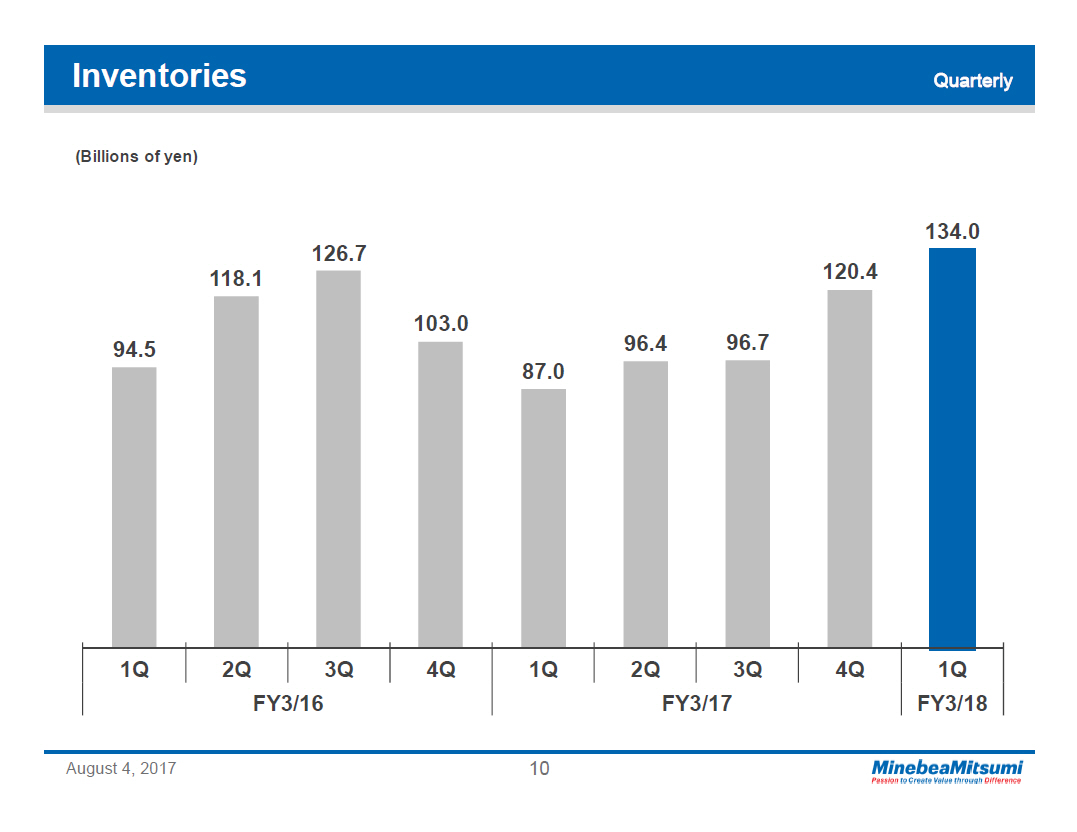 |
Capital Expenditure & Depreciation Yearly (Billions of yen) Capital Expenditure Depreciation & Amortization Expenses 20.7 37.6 43.9 31.8 10.7 44.0 23.7 28.8 34.8 28.2 7.2 33.0 Mar.'14 Mar.'15 Mar.'16 Mar.'17 Mar.'18 1Q Mar.'18 Forecast August 4, 2017 11 | 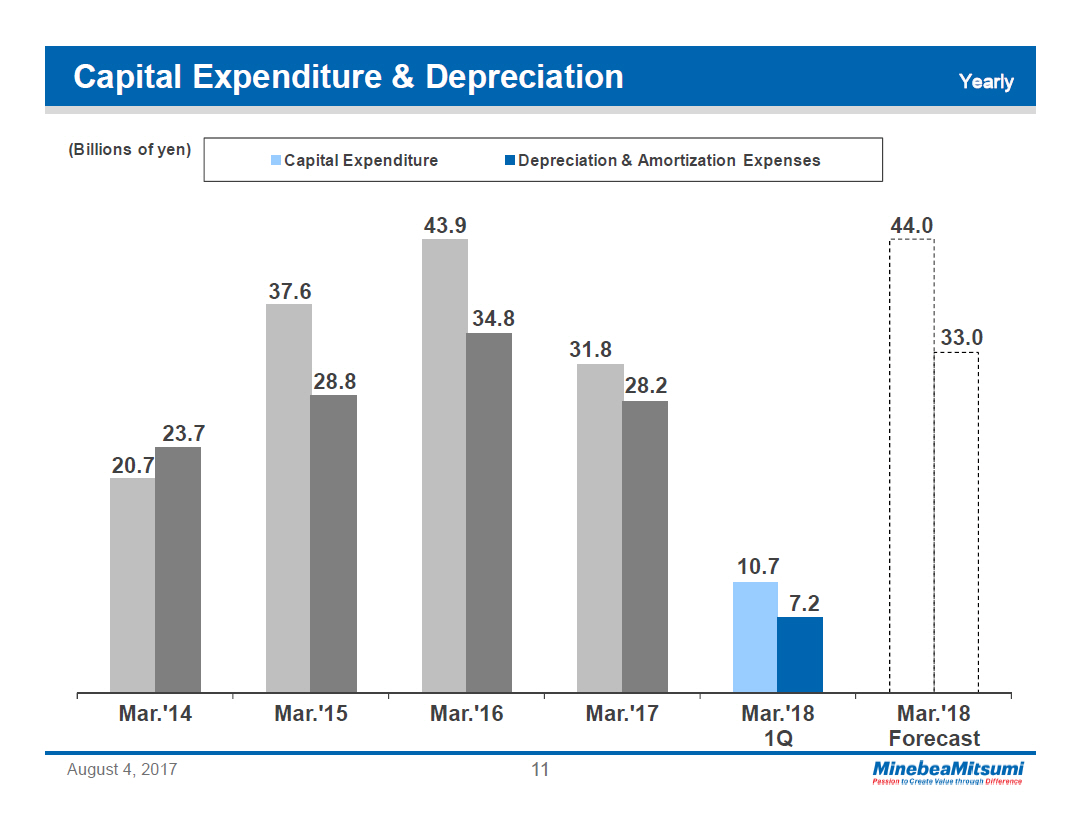 |
Net Interest-Bearing Debt/Free Cash Flow Yearly (Billions of yen) Net interest-bearing debt Free cash flow 109.9 93.1 97.5 70.9 52.5 43.1 24.2 24.5 35.0 -1.1 36.3 19.9 Mar.'14 Mar.'15 Mar.'16 Mar.'17 Mar.'18 1Q Mar.'18 Forecast August 4, 2017 12 | 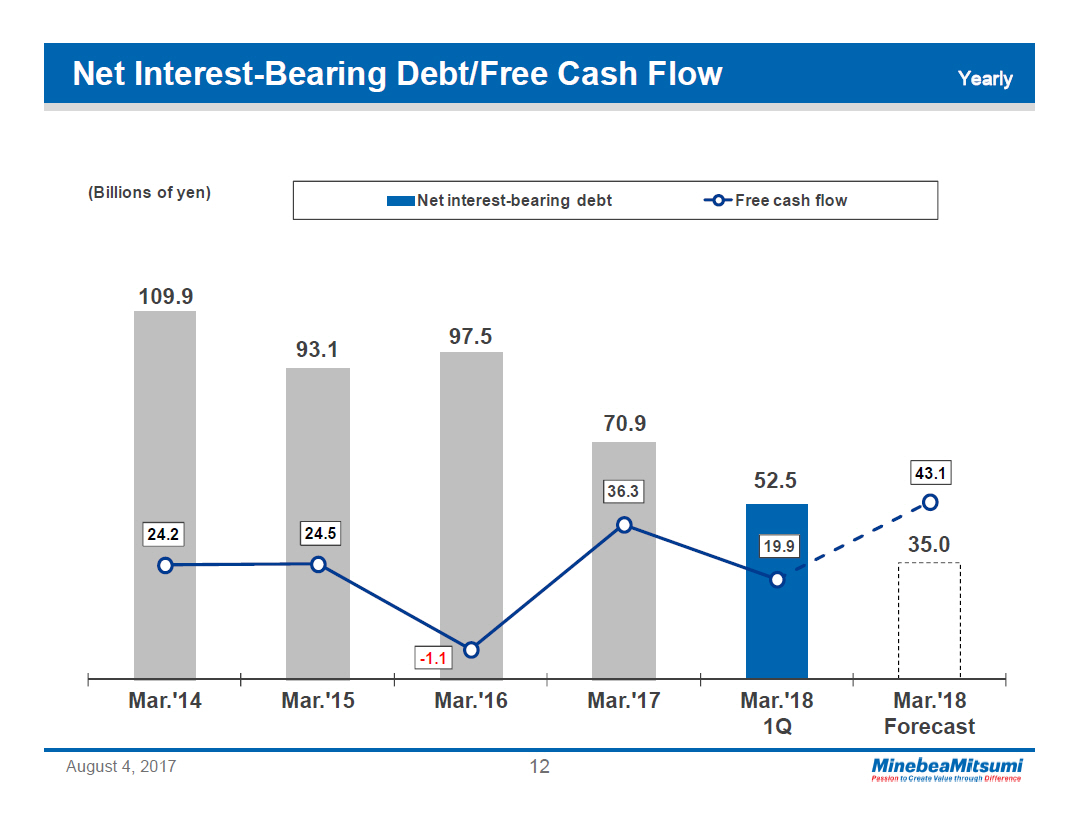 |
Forecast for Fiscal Year Ending March 31, 2018 Expecting net sales, operating income, ordinary income & net income hit record highs (Millions of yen) FY3/17 Full Year FY3/18 1st Half Initial Forecast 1st Half Revised Forecast 2nd Half No Change Full Year Revised Forecast YoY Net sales 638,926 376,400 436,400 373,600 810,000 +26.8% Operating income 49,015 26,300 37,300 29,700 67,000 +36.7% Ordinary income 48,393 25,800 36,800 29,200 66,000 +36.4% Income attributable to owners of the parent 41,146 19,400 28,700 22,100 50,800 +23.5% Net income per share (yen) 107.33 45.83 67.78 52.20 119.97 +11.8% Foreign exchange rates FY3/17 Full Year FY3/18 2Q to 4Q Assumptions US$ (Y)108.76 (Y)105.00 Euro (Y)119.34 (Y)115.00 Thai Baht (Y)3.09 (Y)3.06 Chinese RMB (Y)16.18 (Y)16.00 August 4, 2017 13 | 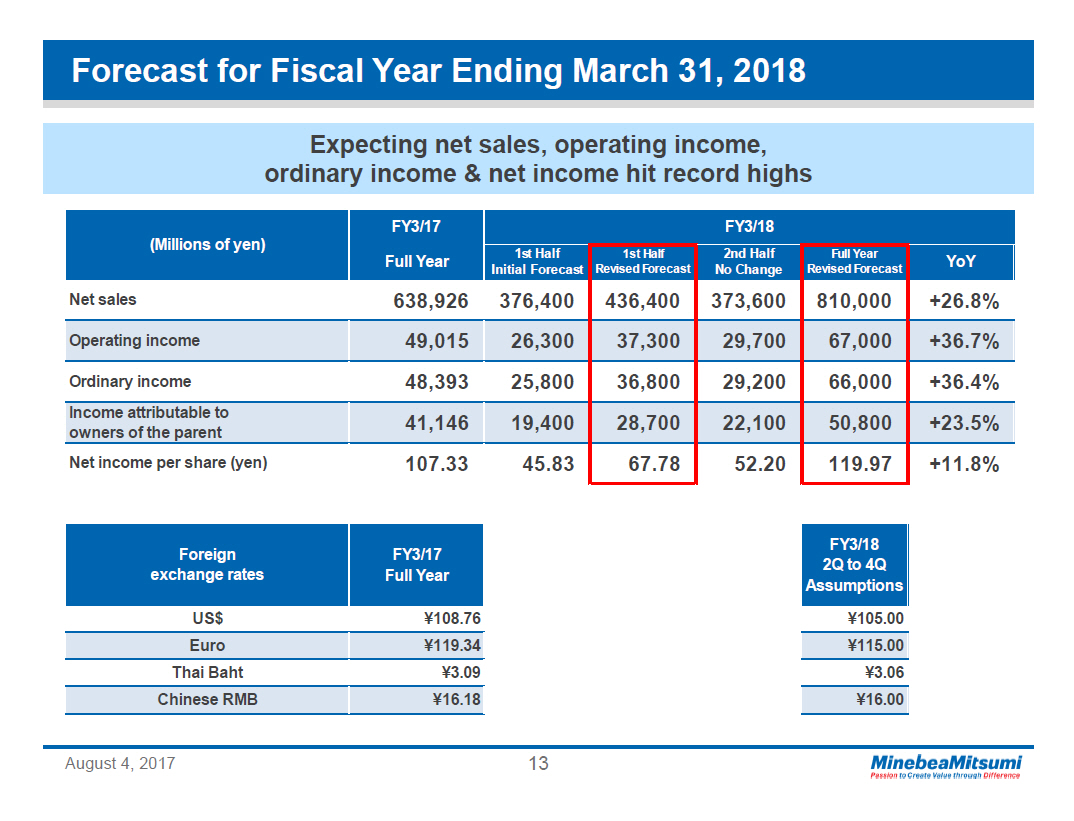 |
Forecast for Business Segment (Millions of yen) FY3/17 FY3/18 Full Year 1st Half Initial Forecast 1st Half Revised Forecast 2nd Half No Change Full Year Revised Forecast YoY Net sales 638,926 376,400 43,640 373,600 810,000 +26.8% Machined components 156,310 80,200 81,900 80,800 162,700 +4.1% Electronic devices and components 441,615 202,500 245,500 194,500 440,000 -0.4% Mitsumi business 40,342 93,300 108,700 97,900 206,600 X5.1 Other 658 400 300 400 700 +6.4% Operating income 49,015 26,300 37,300 29,700 67,000 +36.7% Machined components 39,147 20,100 21,000 20,900 41,900 +7.0% Electronic devices and components 21,898 10,600 15,900 11,400 27,300 +24.7% Mitsumi business 2,315 4,400 9,000 5,600 14,600 X6.3 Other (120) (200) (300) (200) (500) X4.2 Adjustment (14,223) (8,600) (8,300) (8,000) (16,300) +14.6% August 4, 2017 14 | 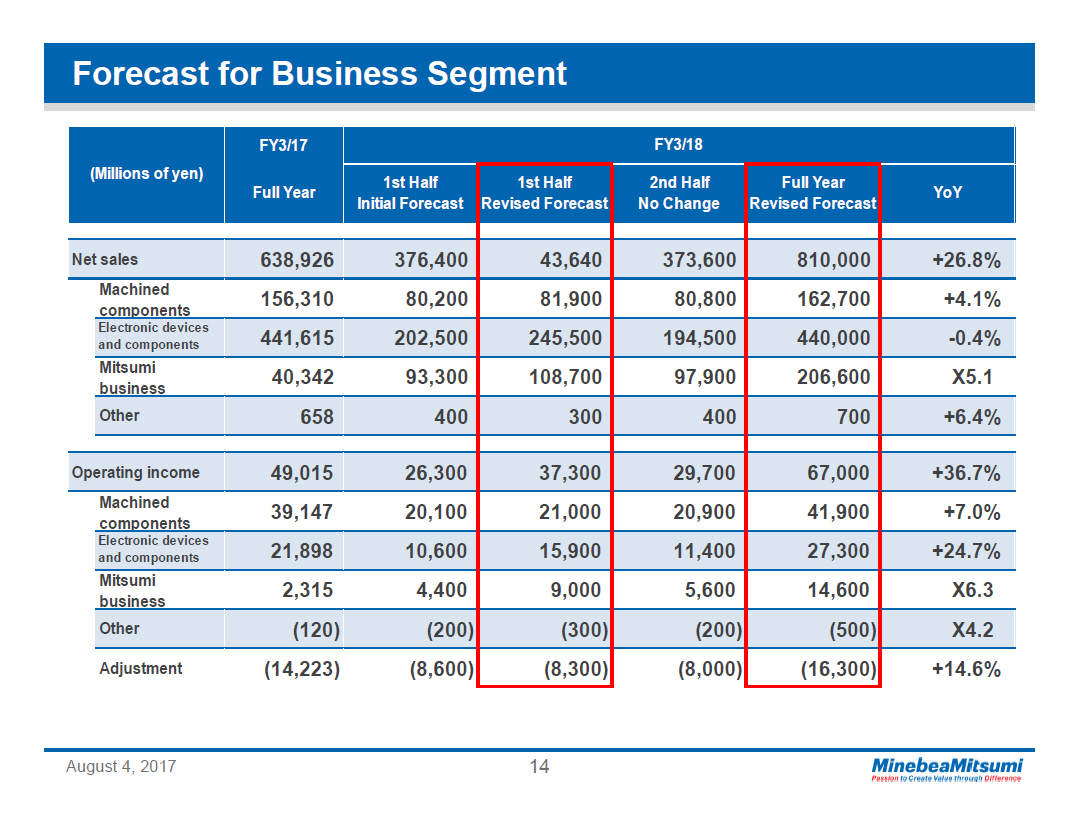 |
Miniature ball bearing demand has been growing External shipment volume up YoY for 19 consecutive quarters! June volume hits new record high of 187 million units Monthly production volume to hit 300 million units by May 2018! Demand shows no signs of letting up 1Q external shipment volume up 11% YoY 3 growth drivers 1. Automobiles 2. High-end home appliances 3. Servers Profitability to improve Production capacity steadily increasing via better productivity (Production hit 267 million units in May and June!) Optimizing inventory to improve profitability Ball Bearing External Shipment (millions/month) Capacity Expansion by Improving the Productivity 155 171 177 178 187 190 +15 175 Mar. '16 Mar. '17 April Result May Result June Result Full Year Forecast Mar. '18 August 4, 2017 15 | 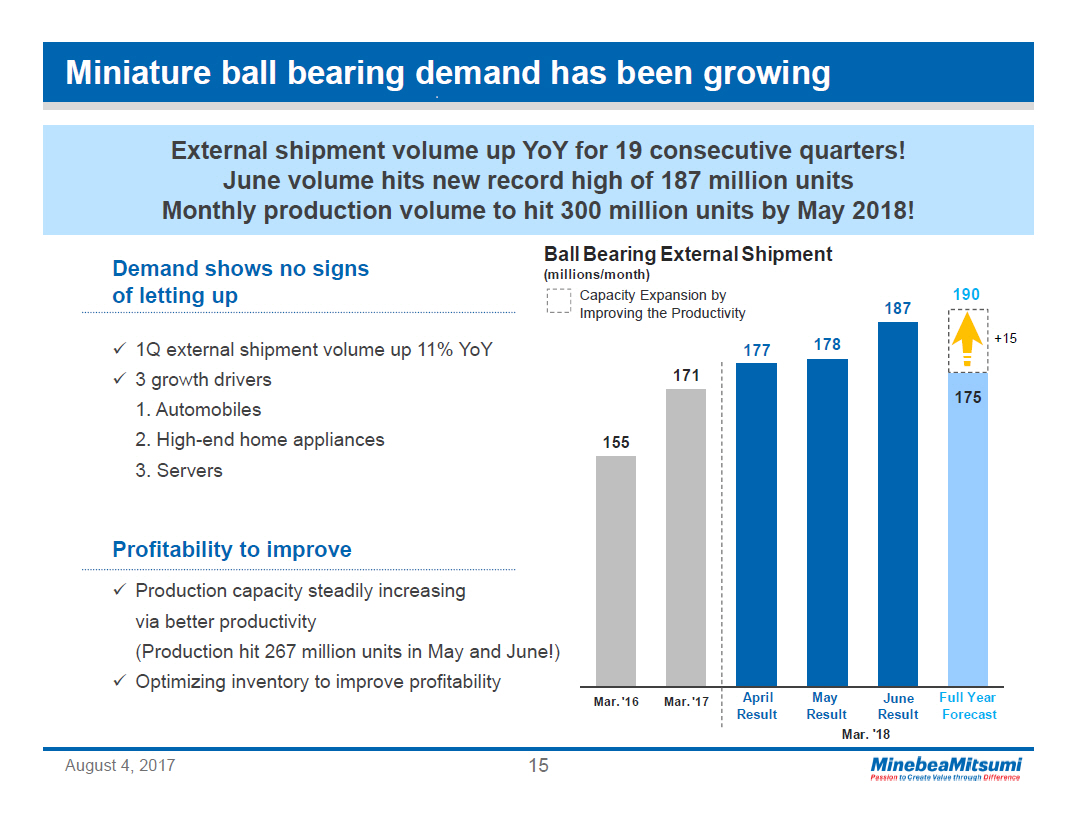 |
LED backlights beat initial forecast 1Q off to a good start with only usual seasonal drop-off in demand From 2Q demand will get into gear Smooth kick off this year New models for the major customers kicked off without a hitch Steady order via high quality and low cost Minimizing risk via accelerated depreciation Expecting shipment for smartphones next year as well Top quality products for luxury cars fuel sales further Continuous development of full screen type LED backlights Net Sales of Electronic Devices (Billions of yen) 170.9 Mar' 15 245.0 Mar' 16 241.0 Mar' 17 220.7 184.3 Initial Forecast Mar' 18 Forecast August 4, 2017 16 | 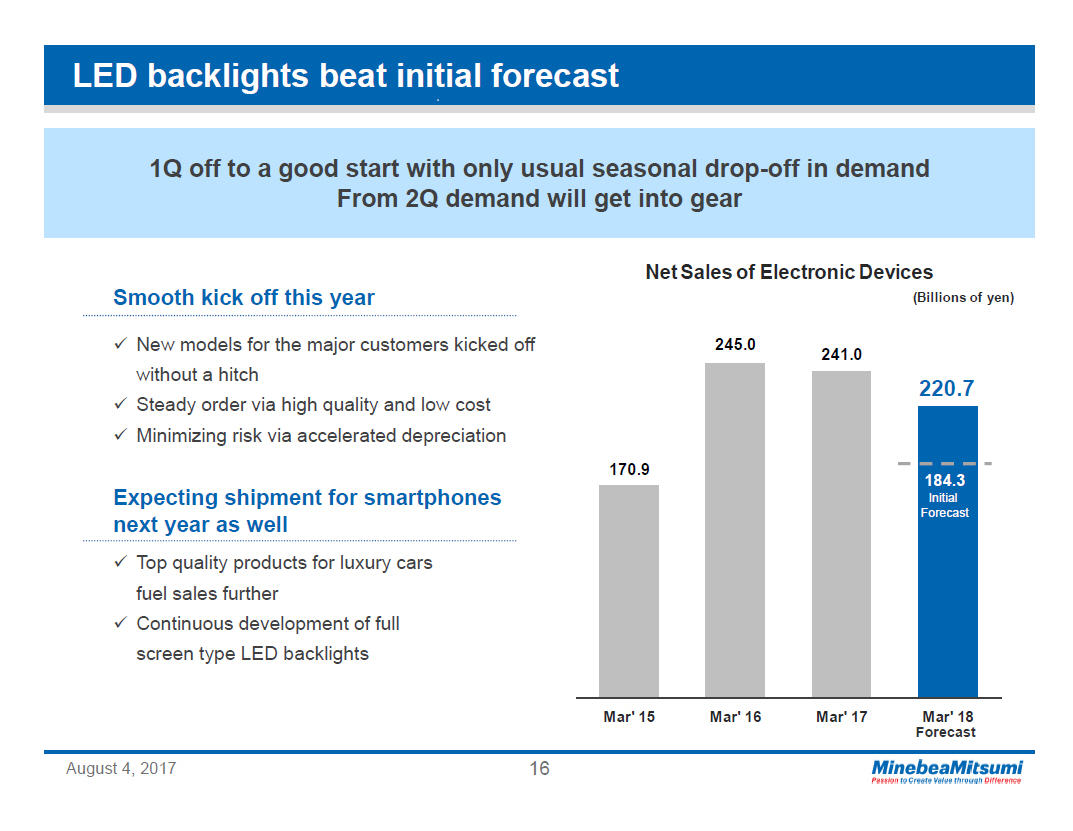 |
Mitsumi business driving profits up Improved performance in products other than smartphones & game consoles contributed to stabilizing Mitsumi profitability Strong tailwind for smartphones and game consoles from 2Q Camera actuator shipment volumes to grow further New game console productions to go into full swing 7 Spears contribute to stabilizing profitability Profits for sensors, connectors/switches, power supplies, wireless products, and analog semiconductors will steadily improve, giving the Mitsumi business a big boost and laying a solid foundation of profitability. MinebeaMitsumi's 7 spears (from Mitsumi's products) Gauge pressure sensors Air pressure sensors Pressure sensors USB Type-C Automobile Connectors (FAKRA) Tactile Switches AC adapters for information equipment Shark fin antennas AC/DC converter ICs August 4, 2017 17 | 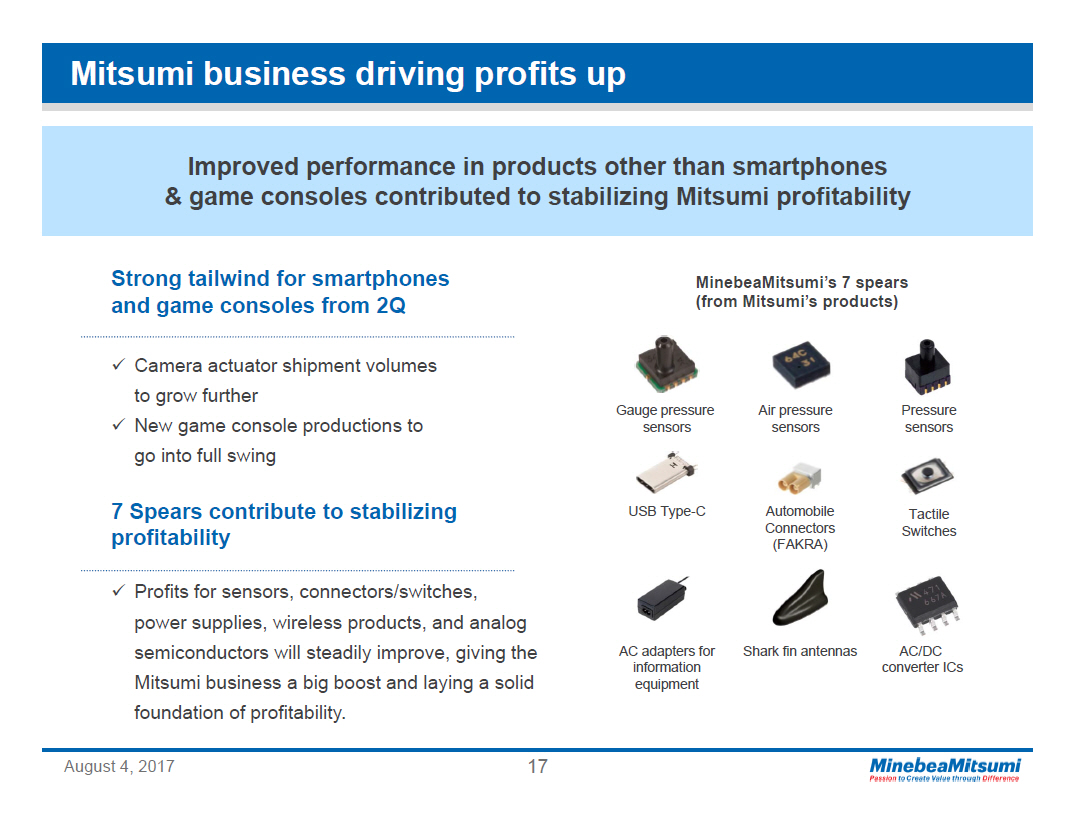 |
Joint business development agreement signed with Ricoh Bed sensor system makes ultimate monitoring dream a reality High precision sensing devices Mitsumi wireless communication technology Systemization technology Outstanding customer support Sales target for FYE 3/2021 3 billion yen (nursing care facilities only) Tap into social infrastructure as a key IoT component PHASE I Establishment of the Basic Platform to watch over elderly persons in the Nursing Care Market Detection of biometric information (weight, body movement, respiration, etc.) Fall and toppling over prevention alert Cooperation with various nursing systems (Nursing care record, nurse call) PHASE II Provisions of Illness Prediction / Prognosis Support using AI in the Nursing and Medical Markets Detection of biometric information (heart rate) Data analysis utilizing AI Analysis of daily activity patterns Provision of the most optimal medical/nursing service for users PHASE III Expansion to an Integrated Information Service Platform in Nursing, Medical, Child-rearing and Other Market Detection of biometric information from various sensors (Blood glucose levels, blood pressure, etc.) Integrated utilization of information such as surveillance cameras, location measuring information, medical related and other services and devices August 4, 2017 18 | 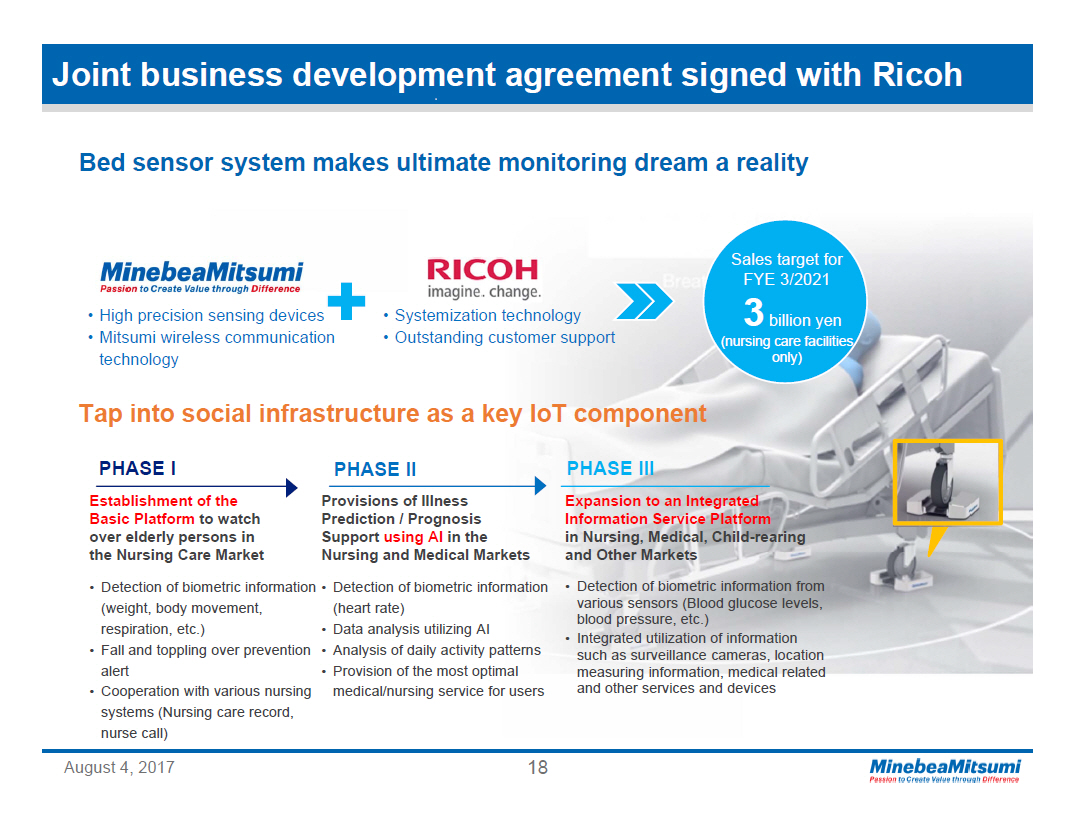 |
Any statements in this presentation which are not historical are future projections based on certain assumptions and executive judgments drawn from currently available information. Please note that actual performance may vary significantly from any particular projection due to various factors. Factors affecting our actual performance include but are not limited to: (i) changes in economic conditions or demand trends related to MinebeaMitsumi's business operations; (ii) fluctuation of foreign exchange rates or interest rates; and (iii) our ability to continue R&D, manufacturing and marketing in a timely manner in the electronics business sector, where technological innovations are rapid and new products are launched continuously. All the information in this document is the property of MinebeaMitsumi Inc. All parties are prohibited, for whatever purpose, to copy, modify, reproduce, transmit, etc. this information regardless of ways and means without prior written permission of MinebeaMitsumi Inc. August 4, 2017 19 |  |