Exhibit 99.01
| European Investor Presentation June 22-23, 2009 |
| Safe Harbor Statement Statements contained in this presentation that state the Company's or management's expectations or predictions of the future are forward-looking statements intended to be covered by the safe harbor provisions of the Securities Act of 1933 and the Securities Exchange Act of 1934. The words "believe," "expect," "should," "estimates," and other similar expressions identify forward-looking statements. It is important to note that actual results could differ materially from those projected in such forward-looking statements. For more information concerning factors that could cause actual results to differ from those expressed or forecasted, see Valero's annual reports on Form 10^K and quarterly reports on Form 10^Q, filed with the Securities and Exchange Commission, and available on Valero's website at www.valero.com. 1 |
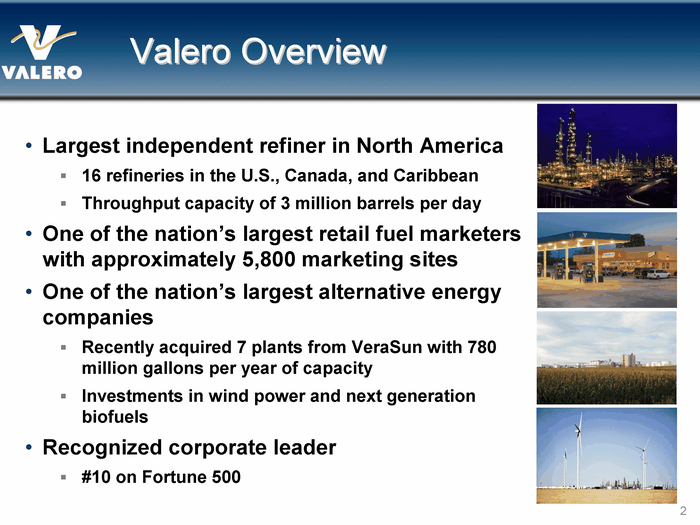
| Valero Overview Largest independent refiner in North America 16 refineries in the U.S., Canada, and Caribbean Throughput capacity of 3 million barrels per day One of the nation's largest retail fuel marketers with approximately 5,800 marketing sites One of the nation's largest alternative energy companies Recently acquired 7 plants from VeraSun with 780 million gallons per year of capacity Investments in wind power and next generation biofuels Recognized corporate leader #10 on Fortune 500 2 |
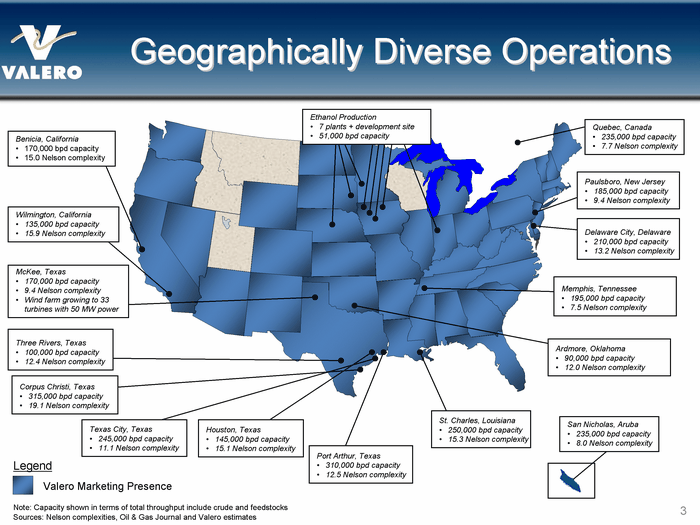
| Geographically Diverse Operations 3 Valero Marketing Presence Three Rivers, Texas 100,000 bpd capacity 12.4 Nelson complexity Corpus Christi, Texas 315,000 bpd capacity 19.1 Nelson complexity Wilmington, California 135,000 bpd capacity 15.9 Nelson complexity Benicia, California 170,000 bpd capacity 15.0 Nelson complexity McKee, Texas 170,000 bpd capacity 9.4 Nelson complexity Wind farm growing to 33 turbines with 50 MW power Texas City, Texas 245,000 bpd capacity 11.1 Nelson complexity Houston, Texas 145,000 bpd capacity 15.1 Nelson complexity Port Arthur, Texas 310,000 bpd capacity 12.5 Nelson complexity St. Charles, Louisiana 250,000 bpd capacity 15.3 Nelson complexity Ardmore, Oklahoma 90,000 bpd capacity 12.0 Nelson complexity Memphis, Tennessee 195,000 bpd capacity 7.5 Nelson complexity Paulsboro, New Jersey 185,000 bpd capacity 9.4 Nelson complexity San Nicholas, Aruba 235,000 bpd capacity 8.0 Nelson complexity Delaware City, Delaware 210,000 bpd capacity 13.2 Nelson complexity Note: Capacity shown in terms of total throughput include crude and feedstocks Sources: Nelson complexities, Oil & Gas Journal and Valero estimates Legend Quebec, Canada 235,000 bpd capacity 7.7 Nelson complexity Ethanol Production 7 plants + development site 51,000 bpd capacity |

| Crude Oil Price Rising Despite Weak Fundamentals 4 WTI Cushing (per bbl) 4 Source: Argus weekly averages; 2009 through June 12 Technical signs indicate continued upside Suggesting expectations of economic recovery Financial flows into commodities provide support Hedge for inflation and weak dollar, but not as strong or consistent as last year Recently stronger pull from China Mostly going into inventory, not for demand growth Very high global inventories U.S. and OECD on-land stocks very high Consultants estimate approximately 85 million barrels in floating storage Global consumption continues to decline in 2009 Economy remains weak 2Q is seasonal low in world demand 5 Yr Avg 2009 2008 U.S. Crude Oil Stocks (millions of barrels) Source: DOE PSM through March 2009; DOE WPSR for April through June 2009 |
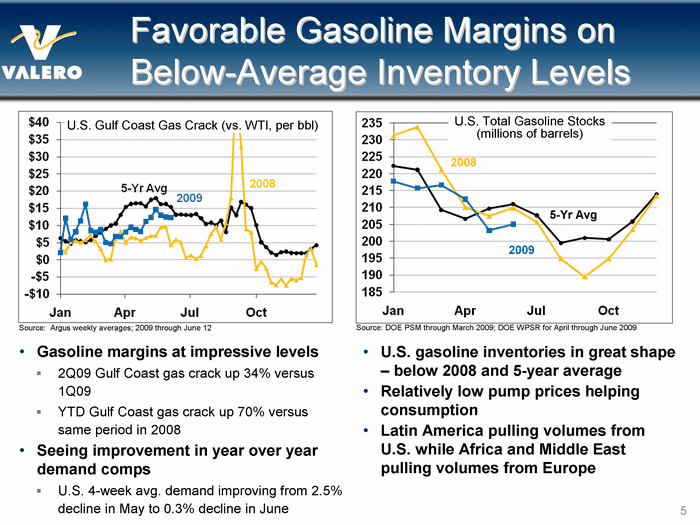
| U.S. gasoline inventories in great shape - - below 2008 and 5-year average Relatively low pump prices helping consumption Latin America pulling volumes from U.S. while Africa and Middle East pulling volumes from Europe Favorable Gasoline Margins on Below-Average Inventory Levels 5 Gasoline margins at impressive levels 2Q09 Gulf Coast gas crack up 34% versus 1Q09 YTD Gulf Coast gas crack up 70% versus same period in 2008 Seeing improvement in year over year demand comps U.S. 4-week avg. demand improving from 2.5% decline in May to 0.3% decline in June U.S. Gulf Coast Gas Crack (vs. WTI, per bbl) Source: Argus weekly averages; 2009 through June 12 5-Yr Avg 2009 2008 U.S. Total Gasoline Stocks (millions of barrels) Source: DOE PSM through March 2009; DOE WPSR for April through June 2009 |
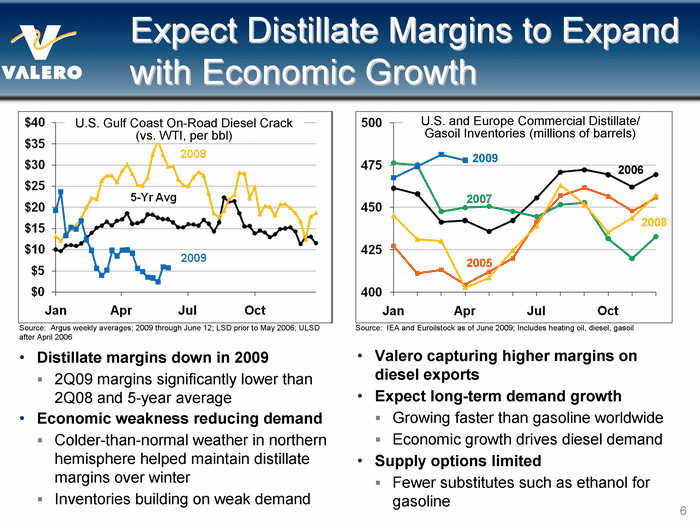
| Valero capturing higher margins on diesel exports Expect long-term demand growth Growing faster than gasoline worldwide Economic growth drives diesel demand Supply options limited Fewer substitutes such as ethanol for gasoline U.S. Gulf Coast On-Road Diesel Crack (vs. WTI, per bbl) Source: Argus weekly averages; 2009 through June 12; LSD prior to May 2006; ULSD after April 2006 Expect Distillate Margins to Expand with Economic Growth 6 2006 2005 2008 2007 U.S. and Europe Commercial Distillate/ Gasoil Inventories (millions of barrels) Source: IEA and Euroilstock as of June 2009; Includes heating oil, diesel, gasoil Distillate margins down in 2009 2Q09 margins significantly lower than 2Q08 and 5-year average Economic weakness reducing demand Colder-than-normal weather in northern hemisphere helped maintain distillate margins over winter Inventories building on weak demand 2009 |
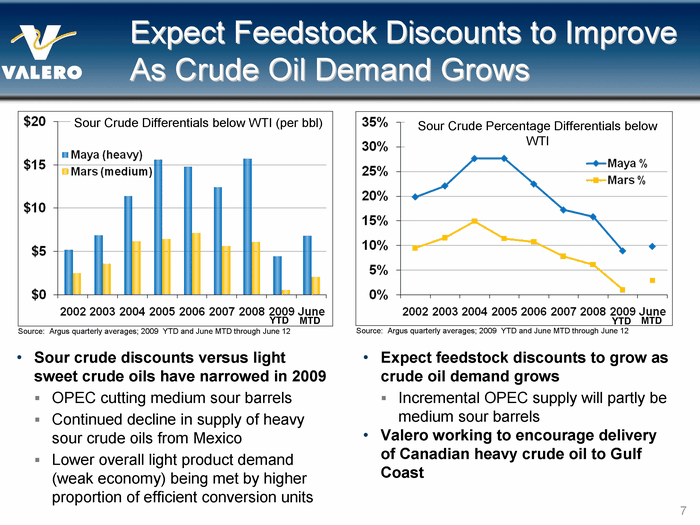
| Expect Feedstock Discounts to Improve As Crude Oil Demand Grows 7 Sour crude discounts versus light sweet crude oils have narrowed in 2009 OPEC cutting medium sour barrels Continued decline in supply of heavy sour crude oils from Mexico Lower overall light product demand (weak economy) being met by higher proportion of efficient conversion units Expect feedstock discounts to grow as crude oil demand grows Incremental OPEC supply will partly be medium sour barrels Valero working to encourage delivery of Canadian heavy crude oil to Gulf Coast Sour Crude Percentage Differentials below WTI Source: Argus quarterly averages; 2009 YTD and June MTD through June 12 Source: Argus quarterly averages; 2009 YTD and June MTD through June 12 Sour Crude Differentials below WTI (per bbl) YTD YTD MTD MTD |
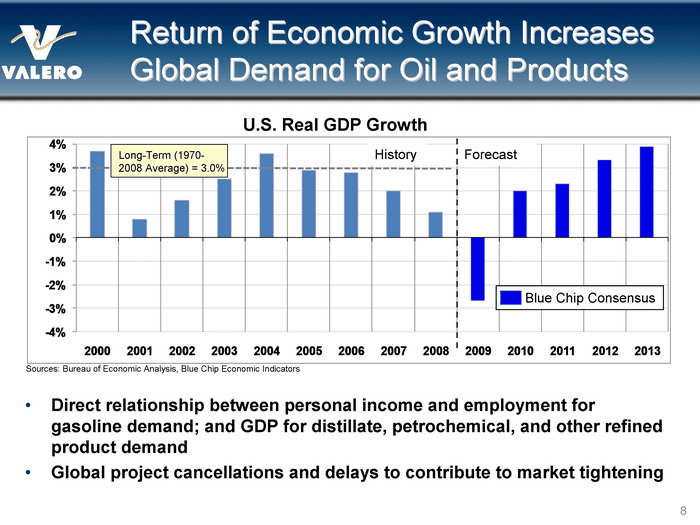
| Return of Economic Growth Increases Global Demand for Oil and Products Direct relationship between personal income and employment for gasoline demand; and GDP for distillate, petrochemical, and other refined product demand Global project cancellations and delays to contribute to market tightening 8 U.S. Real GDP Growth Long-Term (1970- 2008 Average) = 3.0% Blue Chip Consensus Sources: Bureau of Economic Analysis, Blue Chip Economic Indicators |
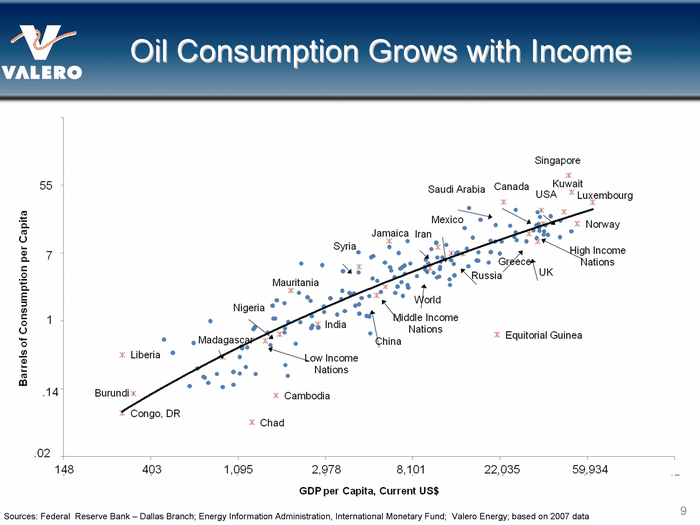
| Oil Consumption Grows with Income 9 Sources: Federal Reserve Bank - Dallas Branch; Energy Information Administration, International Monetary Fund; Valero Energy; based on 2007 data |

| Many Developing Countries Are Approaching Mobility Threshold Approaching Mobility Threshold Approaching Mobility Threshold 10 Source: Booz & Company analysis; Note: Each line of symbols represents a 19-year progression for one country, from 1990 through 2008; U.S $. Automobile ownership accelerates around $10,000 GDP per capita ("Mobility Threshold") Countries approaching Mobility Threshold |

| 2Q09 Interim Update Due to timing of equity offering, Valero announced on June 2, 2009 that it expects to report a net loss of approximately $0.50 per share for 2Q09 Extended downtime mainly at the Delaware City and McKee refineries Total impact to throughput margin of approximately $200 million Weak sour crude oil discounts and distillate margins Key impacts on operating income versus 1Q09 results $550 million estimated decline due to lower sour crude discounts and margins on distillates and other products, which more than offset increase from gasoline margins and throughputs $180 million estimated improvement in refinery operating expense and other $440 million estimated decline due to change in results from derivative instruments 11 Source: Argus; 5-3-2 consists of 5 barrels WTI = 3 barrels of conventional unleaded gasoline and 2 barrels of ULSD |
| Taking Actions to Improve Profitability 12 Restarted from major turnarounds at McKee (FCC) and Delaware City (coker, gasifier) Adjusting crude diet to increase liquid volume yields Shifting endpoints and conversion to increase gasoline yields Shifting bottoms to higher-margin asphalt market and heavy fuel oil Completing project at Texas City to provide flexibility to shift bottoms into heavy fuel oil market if fuel oil margins continue stronger than coker margins Implementing refinery-wide shutdown at Aruba for 2-3 months |
| Improving Competitiveness Increasing energy efficiency Implemented strategies at nine refineries in 2008/2009 Captured $100 million of estimated total $200 million in annual savings versus not implementing the strategies Program should be fully implemented in mid-2010 Reducing non-energy cash operating costs Continued focus on workforce efficiency and equipment reliability Made large improvement of one-full quartile in industry benchmarking survey from 2006 to 2008 Improving margins via molecule management Identified non-capital improvements to optimize profitability of each refinery unit Program in early stages, but have captured $20 million to date Reducing costs via measurement assurance Identified and achieving savings by mass/volume analysis throughout system Working on reliability Implementing standards for consistent, world-class operations No cracks in Port Arthur coke drums since repair in spring 2008 13 Systematically reviewing each department's costs and how we do business More than $250 million of aggregate SG&A expense reductions since 2007 |
| Investing in Key Long-Term Trends Diesel outperforms gasoline Global fuel of choice, especially for developing markets Economic rebound grows diesel demand faster than gasoline But, gasoline still grows worldwide Diesel has fewer substitution threats than gasoline (ethanol) Biofuels are part of the fuel mix and growing rapidly U.S. policy mandates corn-based ethanol usage of 685 mbpd in 2009, and mandate grows nearly 100 mbpd in 2010 As oil prices rise, discretionary ethanol blending economics improve Global competition increases value of flexible operations Feedstocks - capability to source and run a wide variety Yields - capability to shift yields depending on market needs Products trading and exports - capability to move products to highest netback market, local or foreign 14 |
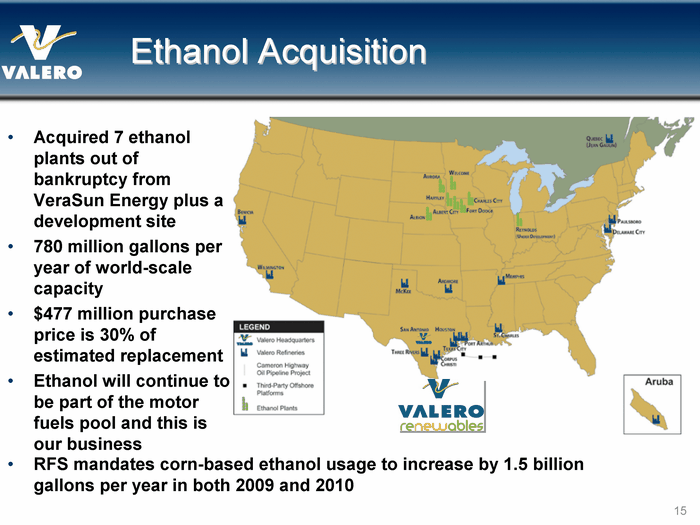
| Ethanol Acquisition Acquired 7 ethanol plants out of bankruptcy from VeraSun Energy plus a development site 780 million gallons per year of world-scale capacity $477 million purchase price is 30% of estimated replacement Ethanol will continue to be part of the motor fuels pool and this is our business 15 RFS mandates corn-based ethanol usage to increase by 1.5 billion gallons per year in both 2009 and 2010 |

| Lower Capital Spending Budget Reflects Buy vs. Build Strategy 16 In the current environment, we will continue to seek opportunities to buy high- quality assets at a discount to new-build price 2009 budget estimated at $2.5 billion, down from previous $3.5 billion Will continue to evaluate budget for additional reductions 2010 preliminary budget estimated at approximately $2 billion, including heavy turnaround schedule Estimate minimum capital of $1.8 billion over next couple of years, including regulatory $3,200 $2,500 Millions Strategic Turnarounds Sustaining/ Reliability Regulatory Tier II 2008 2009 Estimate |
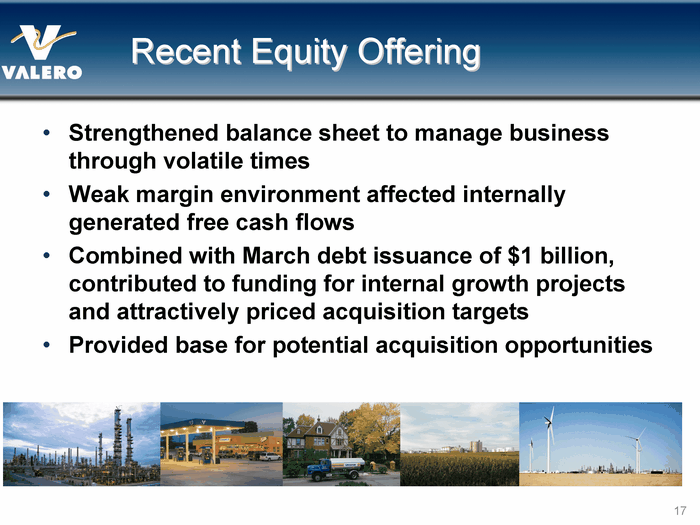
| Recent Equity Offering Strengthened balance sheet to manage business through volatile times Weak margin environment affected internally generated free cash flows Combined with March debt issuance of $1 billion, contributed to funding for internal growth projects and attractively priced acquisition targets Provided base for potential acquisition opportunities 17 |

| Shareholder-Focused Company 18 Margin/ barrel billions 1Sour 6-3-2-1 margin consists of feedstocks: 1/3 WTI, 1/3 Mars, and 1/3 Maya; products Gulf Coast 1/2 gasoline, 1/3 ULSD, and 1/6 heavy fuel oil through 2Q estimated Higher margins drove higher operating cash flows and asset values At low valuations, Valero acquired assets and issued debt + equity At high valuations, Valero sold assets, returned cash to shareholders, and paid down debt Valuations becoming attractive: ethanol, TRN |
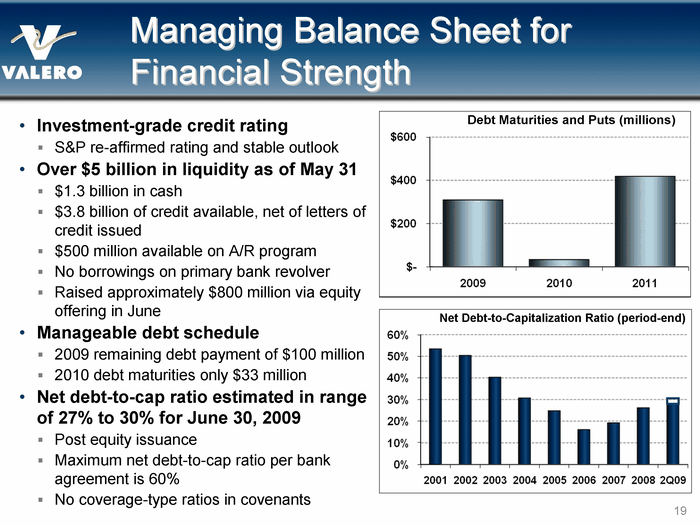
| Managing Balance Sheet for Financial Strength Investment-grade credit rating S&P re-affirmed rating and stable outlook Over $5 billion in liquidity as of May 31 $1.3 billion in cash $3.8 billion of credit available, net of letters of credit issued $500 million available on A/R program No borrowings on primary bank revolver Raised approximately $800 million via equity offering in June Manageable debt schedule 2009 remaining debt payment of $100 million 2010 debt maturities only $33 million Net debt-to-cap ratio estimated in range of 27% to 30% for June 30, 2009 Post equity issuance Maximum net debt-to-cap ratio per bank agreement is 60% No coverage-type ratios in covenants 19 Net Debt-to-Capitalization Ratio (period-end) Debt Maturities and Puts (millions) |
| 20 Committed to Creating Long-Term Shareholder Value |
| Appendix 21 |
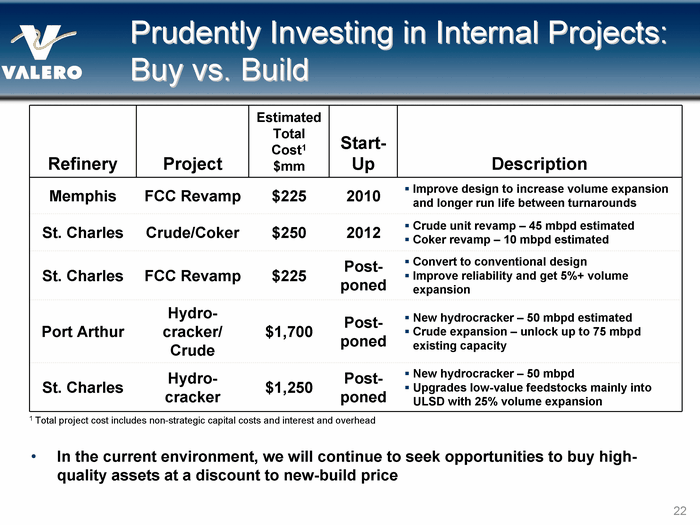
| Prudently Investing in Internal Projects: Buy vs. Build In the current environment, we will continue to seek opportunities to buy high- quality assets at a discount to new-build price 22 Refinery Project Estimated Total Cost1 $mm Start-Up Description Memphis FCC Revamp $225 2010 Improve design to increase volume expansion and longer run life between turnarounds St. Charles Crude/Coker $250 2012 Crude unit revamp - 45 mbpd estimated Coker revamp - 10 mbpd estimated St. Charles FCC Revamp $225 Post-poned Convert to conventional design Improve reliability and get 5%+ volume expansion Port Arthur Hydro-cracker/ Crude $1,700 Post-poned New hydrocracker - 50 mbpd estimated Crude expansion - unlock up to 75 mbpd existing capacity St. Charles Hydro-cracker $1,250 Post-poned New hydrocracker - 50 mbpd Upgrades low-value feedstocks mainly into ULSD with 25% volume expansion 1 Total project cost includes non-strategic capital costs and interest and overhead |