- VLO Dashboard
- Financials
- Filings
-
Holdings
- Transcripts
- ETFs
- Insider
- Institutional
- Shorts
-
8-K Filing
Valero Energy (VLO) 8-KRegulation FD Disclosure
Filed: 10 Aug 11, 12:00am
Exhibit 99.1

| Investor Presentation August 2011 |

| Safe Harbor Statement Statements contained in this presentation that state the Company's or management's expectations or predictions of the future are forward- looking statements intended to be covered by the safe harbor provisions of the Securities Act of 1933 and the Securities Exchange Act of 1934. The words "believe," "expect," "should," "estimates," and other similar expressions identify forward-looking statements. It is important to note that actual results could differ materially from those projected in such forward-looking statements. For more information concerning factors that could cause actual results to differ from those expressed or forecasted, see Valero's annual reports on Form 10^K and quarterly reports on Form 10^Q, filed with the Securities and Exchange Commission, and available on Valero's website at www.valero.com. 2 |
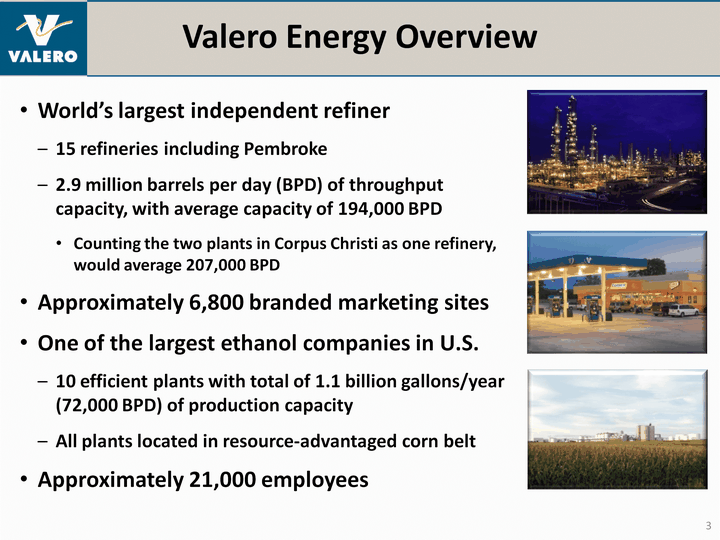
| Valero Energy Overview World's largest independent refiner15 refineries including Pembroke2.9 million barrels per day (BPD) of throughput capacity, with average capacity of 194,000 BPDCounting the two plants in Corpus Christi as one refinery, would average 207,000 BPDApproximately 6,800 branded marketing sitesOne of the largest ethanol companies in U.S. 10 efficient plants with total of 1.1 billion gallons/year (72,000 BPD) of production capacity All plants located in resource-advantaged corn beltApproximately 21,000 employees 3 |

| Refining Industry Discussion Three main themes in refining this yearWTI spread to LLS or BrentRefined product exportsHeavy sour crude discountsRefining business todayLocation is most importantComplexity and size are still importantMust Execute, Execute, Execute! 4 |

| Valero's Geographically Diverse Operations 5 Refinery Capacities (000 bpd) Capacities (000 bpd) Nelson Index Refinery Total Through-put Crude Oil Nelson Index Aruba 235 235 8.0 Ardmore 90 86 12.0 Benicia 170 145 15.0 Corpus Chris. 325 205 20.6 Houston 160 90 15.1 McKee 170 168 9.5 Memphis 195 180 7.5 Port Arthur 310 290 12.7 Pembroke 270 220 11.8 Quebec City 235 230 7.7 St. Charles 270 190 15.2 Texas City 245 225 11.1 Three Rivers 100 95 12.4 Wilmington 135 85 15.8 Total or Avg. 2,910 2,444 12.1 |

| Pembroke Acquisition: High-Quality Assets at Attractive Price Valero acquired Chevron's Pembroke refinery, marketing and logistics assets in the United Kingdom and Ireland for $730 millionWorking capital and inventories with estimated value of $1.1 billionClosed on August 1st270,000 barrels-per-day refinery with estimated value of $480 millionNelson complexity of 11.8 makes it one of the largest, most complex refineries in Western EuropeRefinery value is 14% of estimated replacement cost, compared to Valero's estimated refining value at 28% of replacement costMarketing and logistics assets with estimated value of $250 millionNetwork of over 1,000 Texaco-branded wholesale sites, plus 14,000-bpd aviation fuels business and ownership interest in 4 major product pipelines and 11 terminalsConsistent with Valero's portfolio-upgrading strategyImproves quality and profitability versus our recent divestituresEstimate accretive to EPS by $0.26 per share using 2010 market prices, higher with forward curveBolt-on acquisition fits well within existing portfolioAdds geographic diversification 6 |

| Pembroke Refinery Pembroke Refinery 7 |

| Excellent Location, Deep-Water Port, and Tankage Deep-water port and docks can handle VLCCs, providing significant flexibilityCrude is delivered by ship directly without reliance on third-party terminal or pipelinesAdvantaged location to obtain growing light crude volumes from Africa and the Caspian regionMoves most of production by water, but can also move via U.K. pipeline system100% of distillate distributed in Europe, nearly all to local U.K. and Ireland markets50% of gasoline exported to New York Harbor and Florida marketsCapable of exporting larger-than-standard cargoes at advantaged freight costs relative to other European refineries10.5 million barrels of storage, approximately half used for feedstocks 8 |

| Pembroke One of Largest, Most Complex Refineries in Western Europe Source: PIRA, All data based on firm capacities based on period ending 2Q 2011 9 |
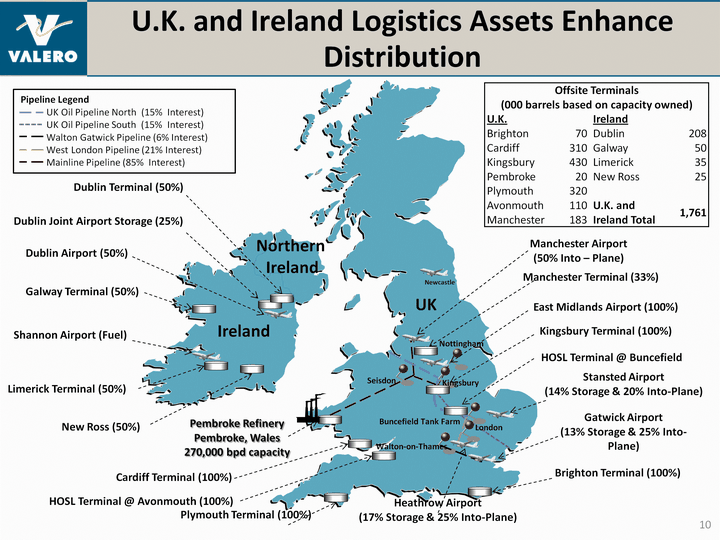
| Manchester Airport(50% Into - Plane) Newcastle UK Ireland Manchester Terminal (33%) Dublin Terminal (50%) Dublin Airport (50%) Galway Terminal (50%) Shannon Airport (Fuel) New Ross (50%) Buncefield Tank Farm Seisdon Nottingham London East Midlands Airport (100%) Kingsbury Terminal (100%) HOSL Terminal @ Buncefield Stansted Airport (14% Storage & 20% Into-Plane) Gatwick Airport (13% Storage & 25% Into- Plane) Brighton Terminal (100%) Dublin Joint Airport Storage (25%) Limerick Terminal (50%) Heathrow Airport (17% Storage & 25% Into-Plane) Plymouth Terminal (100%) HOSL Terminal @ Avonmouth (100%) Cardiff Terminal (100%) Pembroke RefineryPembroke, Wales270,000 bpd capacity Pipeline Legend UK Oil Pipeline North (15% Interest) UK Oil Pipeline South (15% Interest) Walton Gatwick Pipeline (6% Interest) West London Pipeline (21% Interest) Mainline Pipeline (85% Interest) U.K. and Ireland Logistics Assets Enhance Distribution 10 Offsite Terminals (000 barrels based on capacity owned) Offsite Terminals (000 barrels based on capacity owned) Offsite Terminals (000 barrels based on capacity owned) Offsite Terminals (000 barrels based on capacity owned) U.K. U.K. Ireland Ireland Brighton 70 Dublin 208 Cardiff 310 Galway 50 Kingsbury 430 Limerick 35 Pembroke 20 New Ross 25 Plymouth 320 Avonmouth 110 U.K. and Ireland Total 1,761 Manchester 183 U.K. and Ireland Total 1,761 Walton-on-Thames Kingsbury Northern Ireland |
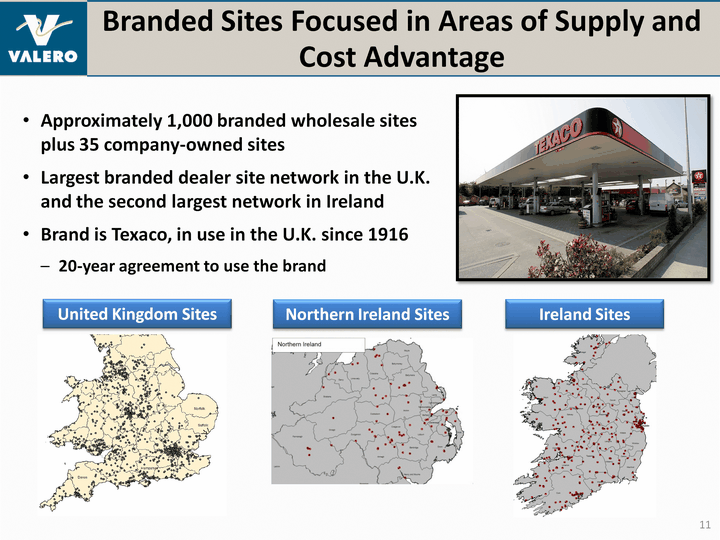
| Branded Sites Focused in Areas of Supply and Cost Advantage Approximately 1,000 branded wholesale sites plus 35 company-owned sitesLargest branded dealer site network in the U.K. and the second largest network in IrelandBrand is Texaco, in use in the U.K. since 191620-year agreement to use the brand 11 United Kingdom Sites Ireland Sites Northern Ireland Sites |

| Pembroke Enhances Valero's Margin Optimization Strategy in the Atlantic Basin 12 Quebec U.S. Gulf Coast Aruba Pembroke |

| (CHART) Continued Global Demand Growth Important to Refining Margins Refining is a global business - global demand growth impacts refiners in every marketStrong growth in emerging markets is leading the surge in global petroleum demand2010 - 2012 demand estimated at very high level like 2003 - 2005, though 2011 demand may get reduced 13 Source: Consultant and Valero estimates |
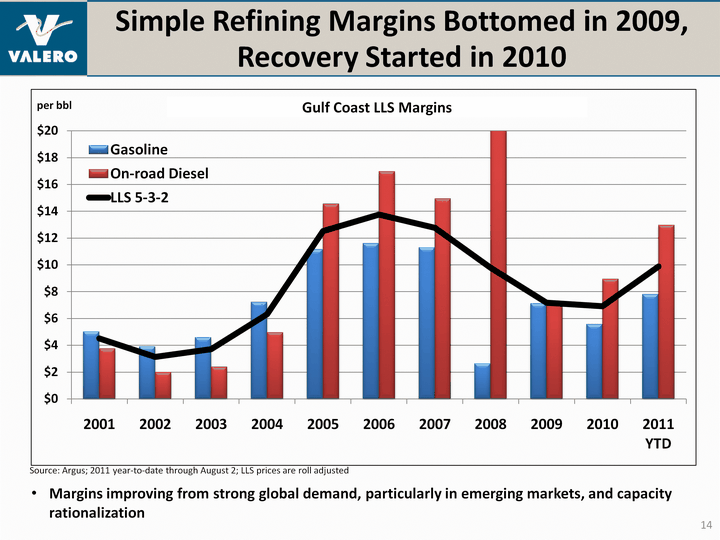
| Simple Refining Margins Bottomed in 2009, Recovery Started in 2010 14 Gulf Coast LLS Margins Margins improving from strong global demand, particularly in emerging markets, and capacity rationalization per bbl Source: Argus; 2011 year-to-date through August 2; LLS prices are roll adjusted |
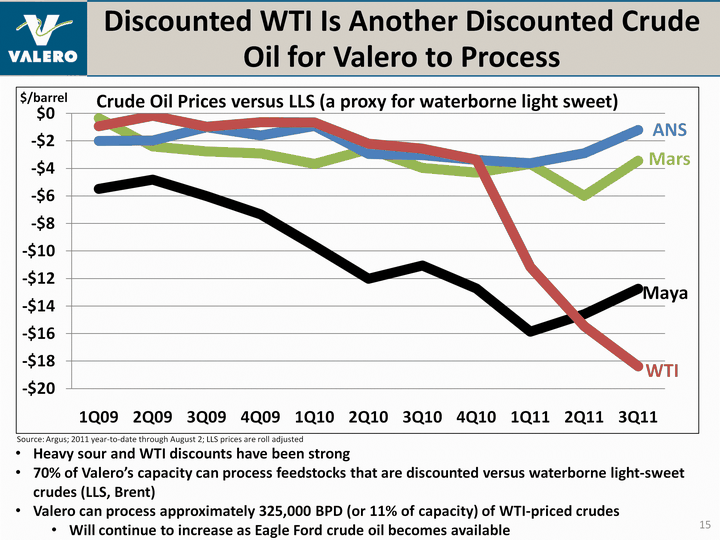
| (CHART) Discounted WTI Is Another Discounted Crude Oil for Valero to Process 15 $/barrel Source: Argus; 2011 year-to-date through August 2; LLS prices are roll adjusted Heavy sour and WTI discounts have been strong70% of Valero's capacity can process feedstocks that are discounted versus waterborne light-sweet crudes (LLS, Brent)Valero can process approximately 325,000 BPD (or 11% of capacity) of WTI-priced crudesWill continue to increase as Eagle Ford crude oil becomes available |

| Key Drivers of Large Feedstock Discounts 16 Light-sweet waterborne crude oils are the marginal feedstock when demand is strongExamples: LLS, Brent, among othersLibyan outage plus North Sea maintenance has tightened light-sweet marketLower-quality and logistically constrained crude oils seeing wide discounts Maya, Mars, M-100Significant production of inland crudes with insufficient logistics to major refining centers: WTI, Eagle FordExpect key drivers of discounts to continueOPEC increasing production of lower-quality heavier crudesReplacements for lost light-sweet production is medium-sourLight product demand outpacing heavy product demand growthSupply of low-quality crudes from Latin America and Mexico have been better than expectedLogistics lagging production growth of inland crude oilsRussian M-100 and other resids coming to market with Russian tax changesLonger term, expect to benefit from Canadian heavy crude oil to Gulf Coast, but timing is later than originally planned |

| Strong Rebound in Refinery Margins in Most Regions Most Regions Most Regions 17 Source: Argus; 2011 year-to-date through August 3; see Appendix for details on refinery configuration assumptions |

| Valero's Gulf Coast System Well-Positioned for Global Export Opportunities 18 Our large, complex refineries on Gulf Coast are competitive due to low-cost operations and feedstocksStructural supply-demand imbalance in Latin America and diesel-shortage in Europe provide higher-margin export opportunitiesLow-cost natural gas is a competitive cost advantage versus other global refiners(CHART) 1Based on 918 MBPD of average total U.S. gasoline and diesel exports from 1Q09 -May 11 |
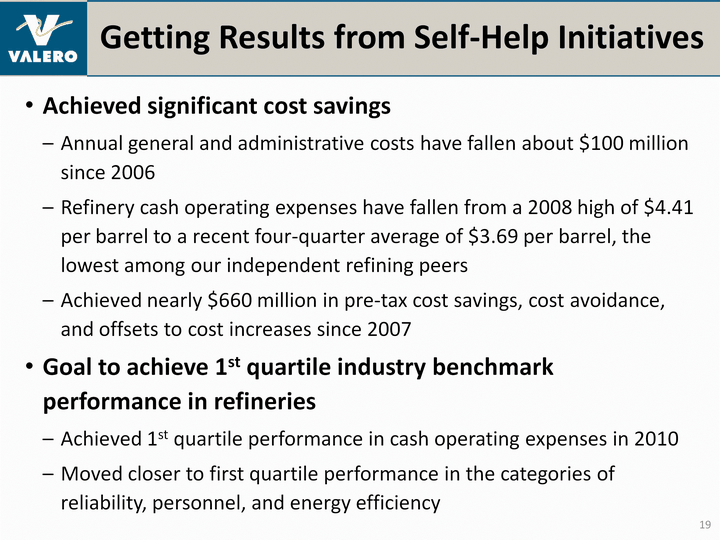
| Getting Results from Self-Help Initiatives Achieved significant cost savingsAnnual general and administrative costs have fallen about $100 million since 2006Refinery cash operating expenses have fallen from a 2008 high of $4.41 per barrel to a recent four-quarter average of $3.69 per barrel, the lowest among our independent refining peersAchieved nearly $660 million in pre-tax cost savings, cost avoidance, and offsets to cost increases since 2007Goal to achieve 1st quartile industry benchmark performance in refineriesAchieved 1st quartile performance in cash operating expenses in 2010Moved closer to first quartile performance in the categories of reliability, personnel, and energy efficiency 19 |

| Refinery Yield Improvements Contribute to Higher Margin Capture 20 Note: Does not include Aruba, Paulsboro or Delaware City refineries Higher-value products and liquid volume are very important when crude oil prices are highLiquid products generally have a much higher value than solid products like coke and sulfurValero's focus on liquid volume yield achieved an increase of 0.4% in 2010 versus 2009Via optimization of refining units, catalysts, and feedstocksEstimated improvement was worth $242 million using 2010 pricesIn current price environment, each 0.1% improvement generates $60 million in additional EBITDA each yearIn 2011, continuing to grow liquid volume yield |

| Valero Increasing Use of Lower-Cost Crude Oils Constantly evaluating opportunities to process lower-cost crude oilsIn 2010, we ran 86 different crude oilsRapid growth in crude oil from Eagle Ford shale, prices similarly to WTI Recent discount of $18 to 23 per bbl versus light-sweet alternativesTwo of Valero's refineries are positioned to process Eagle Ford oilThree Rivers RefineryGrew from 0 to 25 MBPD in 1Q11Currently processing approx. 40 MBPDExpect 60 MBPD by the end of 2011 21 Corpus Christi Refinery Eagle Ford crude and condensateExpect to process 25 MBPD in 3Q11McKee Refinery expansionConsidering an expansion of 25 MBPD to process the growing amounts of price- advantaged, WTI-like crudes in the Texas Panhandle Valero Three Rivers Refinery |

| (CHART) (CHART) Financial Strength Provides Opportunity for Growth Investment grade credit ratingPaid off $718 million of debt in 1H11Ended 2Q11 with $4.1 billion of cash and $4.1 billion of additional liquidityUsed $1.8 billion of cash for August 1 closing of Pembroke acquisitionNet debt-to-cap ratio at 6/30/11 was 18.0%, down from 25% at 12/31/10 and far below credit facility covenant of 60%No other coverage-type ratios or borrowings on bank revolverSignificant liquidity enables Valero to take advantage of investment opportunities Net Debt-to-Capitalization Ratio (period-end) Total Liquidity (millions) (Credit Facility, Letters of Credit, etc.) 22 $7.16/sh in cash |

| Capital Program Focused on Completion of Large Economic Growth Projects 23 "Stay-in- business" spending Preliminary 2012 capital spending is expected to be similar to 2011 as we complete our large economic growth projects |

| Economic Projects Offer Significant Earnings Growth Potential Potential for significant earnings power and project returnsProjects developed based on our "bullish crude, bearish natural gas" price outlook 24 1D&A = depreciation and amortization expense; 2estimated IRR is unlevered and could improve due to pending changes in tax laws regarding accelerated depreciation expense; 3Most of project commissioned in 2010; 4Forward curve as of 8/3/11 Refinery Project Estimated Completion Date Estimated Annual Op. Inc. before D&A using Base Case1 (millions) Estimated IRR2 using Base Case Estimated Annual Op. Inc. before D&A1 using 2011 Fwd Curve Prices4 (millions) Memphis FCC Revamp 2Q113 $75 20% $135 St. Charles FCC Revamp 2Q11 $140 30% $120 McKee & Memphis New Hydrogen Plants 1Q12 $105 39% $158 Port Arthur New Hydrocracker 3Q12 $485 21% $786 Montreal New Products Pipeline 4Q12 $55 12% $55 St. Charles New Hydrocracker 4Q12 $325 16% $644 Total $1,185 20% $1,899 |

| Valero's Strategic Priorities 25 Manage overhead and maintain investment grade credit ratingImprove margin capture, operating costs, and reliability at refineriesComplete major, value-added capital projects at key refineriesOptimize portfolio - continue "high-grading" strategy of the last several yearsAsset sales: sold underperforming and non-core assetsEvaluate attractively priced acquisitions that improve competitiveness via higher margins and lower costs and broaden geographic reachAdd selective investments in retail and alternative fuels for U.S. market Goal: Increase returns to grow long-term shareholder value |
| Appendix 26 |

| Why Invest in Valero Today? 27 |
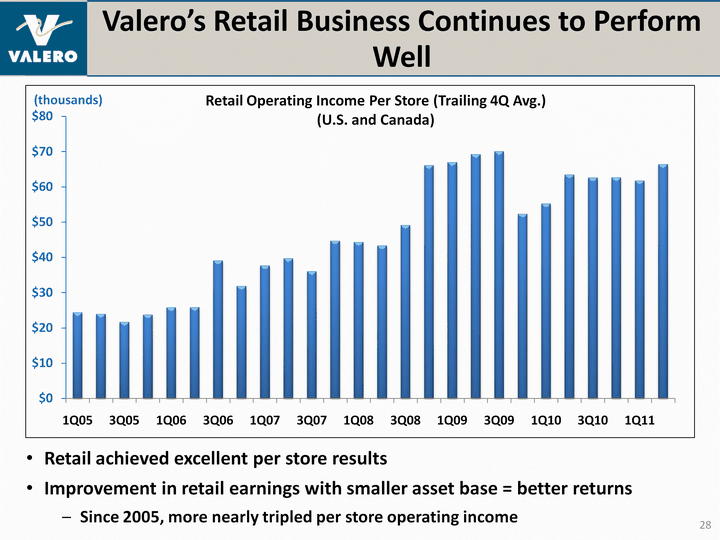
| Valero's Retail Business Continues to Perform Well (CHART) Retail Operating Income Per Store (Trailing 4Q Avg.)(U.S. and Canada) 28 Retail achieved excellent per store resultsImprovement in retail earnings with smaller asset base = better returnsSince 2005, more nearly tripled per store operating income |
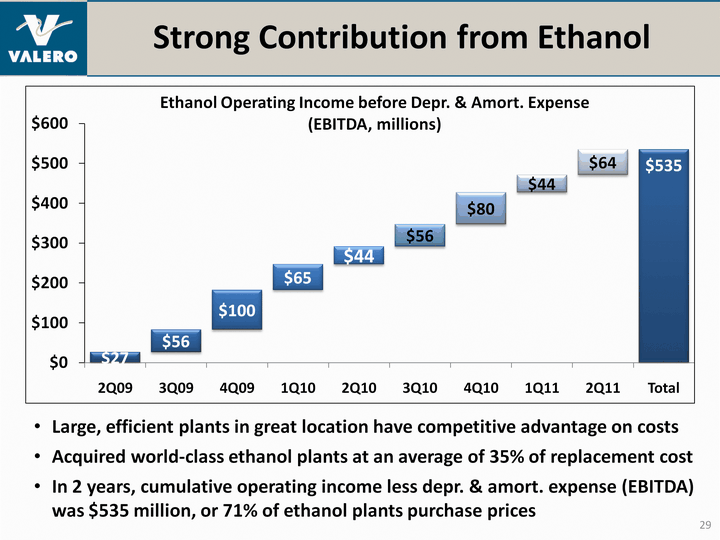
| Strong Contribution from Ethanol 29 Large, efficient plants in great location have competitive advantage on costsAcquired world-class ethanol plants at an average of 35% of replacement costIn 2 years, cumulative operating income less depr. & amort. expense (EBITDA) was $535 million, or 71% of ethanol plants purchase prices (CHART) Ethanol Operating Income before Depr. & Amort. Expense (EBITDA, millions) |

| Impact of Cost Savings Programs Impact of Cost Savings Programs 30 Ongoing cost savings programs have contributed to Valero's competitiveness and improved financial performance millions (CHART) |

| Valero Has Competitive, Low-Cost Refining Operations 31 Refining Cash Operating Expenses less Natural Gas Usage ($/bbl) Source: Macquarie Capital (CHART) |
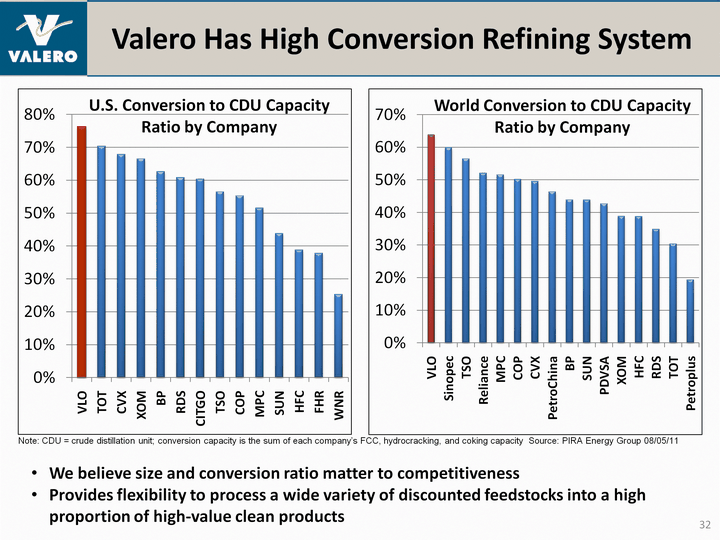
| Valero Has High Conversion Refining System Valero Has High Conversion Refining System 32 Note: CDU = crude distillation unit; conversion capacity is the sum of each company's FCC, hydrocracking, and coking capacity Source: PIRA Energy Group 08/05/11 (CHART) We believe size and conversion ratio matter to competitivenessProvides flexibility to process a wide variety of discounted feedstocks into a high proportion of high-value clean products |

| Memphis FCC Revamp Project Investment HighlightsFavorable economics driven by better reliability and gains on margin and volumeImproves flexibility to run lower- quality feedstocksImproves FCC reliability and increases run length between turnarounds to four years from 1.5 yearsIncrease in run length drives estimated annualized savings of $0.17/barrel 33 Summary of Project Status and Economics1 Summary of Project Status and Economics1 Summary of Project Status and Economics1 Estimated timing of full benefit 2Q113 2Q113 Estimated total investment (mil.) $255 $255 Cumulative spend thru 1Q11 (mil.) $255 $255 Estimated Incremental Operating Income before D&A2 (mil.), Base Case Estimated Incremental Operating Income before D&A2 (mil.), Base Case $75 Estimated Unlevered IRR on Total Spend, Base Case Estimated Unlevered IRR on Total Spend, Base Case 20% Estimated Incremental Operating Income before D&A2 (mil.), 2011 Fwd Curve Estimated Incremental Operating Income before D&A2 (mil.), 2011 Fwd Curve $118 1See Appendix for key price assumptions; 2D&A = depreciation and amortization expense; 3Most of project commissioned in 2010 |

| St. Charles MSCC to FCC Conversion Project Investment HighlightsFavorable economics driven by better reliability and gains on margin and volume Improves FCC reliability and increases run length between turnarounds to four years from 1.5 yearsAdds 5%+ volume expansion through FCCImproves energy efficiency via new power recovery turbineDoubles flexibility of FCC to process lower-priced resid feedstocks, backing out higher-priced VGO 34 Summary of Project Status and Economics1 Summary of Project Status and Economics1 Summary of Project Status and Economics1 Estimated completion date 2Q11 2Q11 Estimated total investment (mil.) $315 $315 Cumulative spend thru 1Q11 (mil.) $245 $245 Estimated Incremental Operating Income before D&A2 (mil.), Base Case Estimated Incremental Operating Income before D&A2 (mil.), Base Case $140 Estimated Unlevered IRR on Total Spend, Base Case Estimated Unlevered IRR on Total Spend, Base Case 30% Estimated Incremental Operating Income before D&A2 (mil.), 2011 Fwd Curve Estimated Incremental Operating Income before D&A2 (mil.), 2011 Fwd Curve $119 1See Appendix for key price assumptions; 2D&A = depreciation and amortization expense |

| Hydrogen Plant Projects 35 Summary of Project Status and Economics1 Summary of Project Status and Economics1 Summary of Project Status and Economics1 Estimated completion date 1Q12 1Q12 Estimated total investment (mil.) $180 $180 Cumulative spend thru 1Q11 (mil.) $40 $40 Incremental Operating Income before D&A2 (mil.), Base Case Incremental Operating Income before D&A2 (mil.), Base Case $105 Unlevered IRR on Total Spend, average, Base Case Unlevered IRR on Total Spend, average, Base Case 39% Estimated Incremental Operating Income before D&A2 (mil.), 2011 Fwd Curve Estimated Incremental Operating Income before D&A2 (mil.), 2011 Fwd Curve $162 Investment HighlightsFavorable economics driven by cost savings and gains on margin and volumeReduces cost of hydrogen by using cheaper natural gas instead of more expensive crude oilNatural gas price per mmBtu (energy unit) is approximately 1/3 the price per mmBtu as WTI crude oilProjects will be at the McKee and Memphis refineriesMemphis project also includes conversion of a distillate hydrotreater to a mild hydrocracker 1See Appendix for key price assumptions; 2D&A = depreciation and amortization expense |

| Port Arthur Hydrocracker Project Investment HighlightsFavorable economics driven by margin and volume gainsMain unit is 50,000 barrels/day hydrocracker plus facilities to process over 150,000 barrels/day of high-acid, heavy sour Canadian crudeCreates high-value products from low- value feedstocks plus hydrogen sourced from relatively inexpensive natural gasUnit has volume expansion of 25%-30%: 1 barrel of feedstocks yields 1.25 to 1.3 barrels of productsMain products are high-quality diesel and jet fuel for growing global demand for middle distillatesLocated at large, Gulf Coast refinery to leverage existing operations and export logistics 36 Summary of Project Status and Economics1 Summary of Project Status and Economics1 Summary of Project Status and Economics1 Estimated completion date 3Q12 3Q12 Estimated total investment (mil.) $1,525 $1,525 Cumulative spend thru 1Q11 (mil.) $635 $635 Estimated Incremental Operating Income before D&A2 (mil.), Base Case Estimated Incremental Operating Income before D&A2 (mil.), Base Case $485 Estimated Unlevered IRR on Total Spend, Base Case Estimated Unlevered IRR on Total Spend, Base Case 21% Estimated Incremental Operating Income before D&A2 (mil.), 2011 Fwd Curve Estimated Incremental Operating Income before D&A2 (mil.), 2011 Fwd Curve $810 1See Appendix for key price assumptions; 2D&A = depreciation and amortization expense |

| Montreal Pipeline Project Investment HighlightsFavorable economics driven by reducing transportation costs and growing volumesNew pipeline with 100,000 barrels/day of throughput capacityPlanned closure of Shell Montreal refinery allows Valero to place additional products into Montreal and Ontario marketsQuebec refinery is largest refinery in the region with 1st-quartile performance and has a cost advantage 37 Summary of Project Status and Economics1 Summary of Project Status and Economics1 Summary of Project Status and Economics1 Estimated completion date 4Q12 4Q12 Estimated total investment (mil.) $370 $370 Cumulative spend thru 1Q11 (mil.) $59 $59 Estimated Incremental Operating Income before D&A2 (mil.) Estimated Incremental Operating Income before D&A2 (mil.) $55 Estimated Unlevered IRR on Total Spend Estimated Unlevered IRR on Total Spend 12% 1See Appendix for key price assumptions; 2D&A = depreciation and amortization expense |
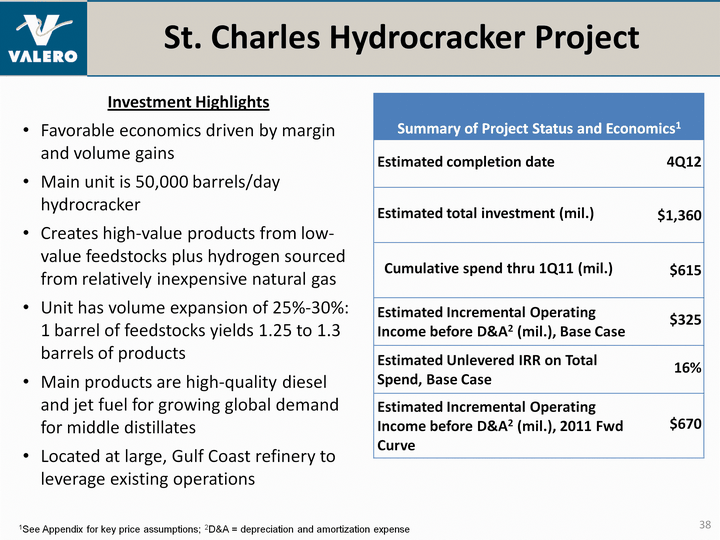
| St. Charles Hydrocracker Project Investment HighlightsFavorable economics driven by margin and volume gainsMain unit is 50,000 barrels/day hydrocrackerCreates high-value products from low- value feedstocks plus hydrogen sourced from relatively inexpensive natural gasUnit has volume expansion of 25%-30%: 1 barrel of feedstocks yields 1.25 to 1.3 barrels of productsMain products are high-quality diesel and jet fuel for growing global demand for middle distillatesLocated at large, Gulf Coast refinery to leverage existing operations 38 Summary of Project Status and Economics1 Summary of Project Status and Economics1 Summary of Project Status and Economics1 Estimated completion date 4Q12 4Q12 Estimated total investment (mil.) $1,360 $1,360 Cumulative spend thru 1Q11 (mil.) $615 $615 Estimated Incremental Operating Income before D&A2 (mil.), Base Case Estimated Incremental Operating Income before D&A2 (mil.), Base Case $325 Estimated Unlevered IRR on Total Spend, Base Case Estimated Unlevered IRR on Total Spend, Base Case 16% Estimated Incremental Operating Income before D&A2 (mil.), 2011 Fwd Curve Estimated Incremental Operating Income before D&A2 (mil.), 2011 Fwd Curve $670 1See Appendix for key price assumptions; 2D&A = depreciation and amortization expense |

| Project Price Set Assumptions 39 Commodity Base Case($/barrel) 2011 Fwd Curve as of 8/3/11 ($/barrel) WTI 85.00 95.87 WTI - USGC HS Gas Oil -3.45 -19.73 USGC Gas Crack 6.00 24.62 USGC ULSD Crack 11.00 26.61 Natural Gas, $/MMBTU (HHV) 5.00 4.26 Prices shown below are for illustrating a potential estimate for Valero's economic projectsPrice assumptions are based on a blend of recent market prices and Valero's price forecast |
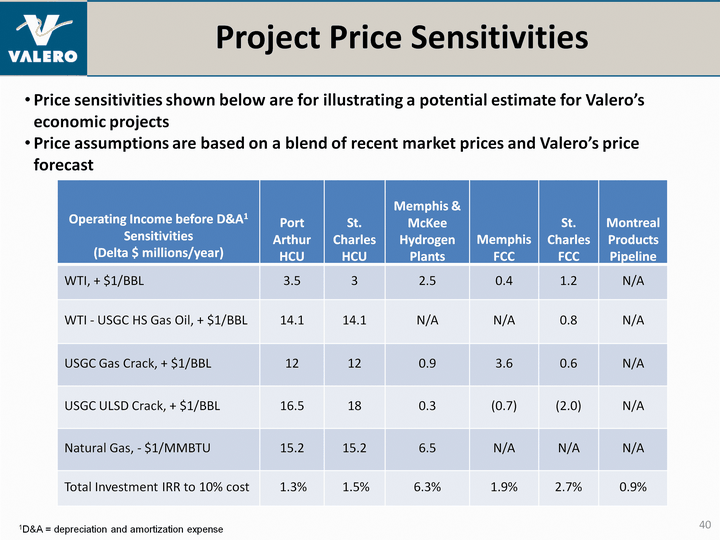
| Project Price Sensitivities 40 Operating Income before D&A1 Sensitivities (Delta $ millions/year) Port Arthur HCU St. Charles HCU Memphis & McKee Hydrogen Plants Memphis FCC St. Charles FCC Montreal Products Pipeline WTI, + $1/BBL 3.5 3 2.5 0.4 1.2 N/A WTI - USGC HS Gas Oil, + $1/BBL 14.1 14.1 N/A N/A 0.8 N/A USGC Gas Crack, + $1/BBL 12 12 0.9 3.6 0.6 N/A USGC ULSD Crack, + $1/BBL 16.5 18 0.3 (0.7) (2.0) N/A Natural Gas, - $1/MMBTU 15.2 15.2 6.5 N/A N/A N/A Total Investment IRR to 10% cost 1.3% 1.5% 6.3% 1.9% 2.7% 0.9% 1D&A = depreciation and amortization expense Price sensitivities shown below are for illustrating a potential estimate for Valero's economic projectsPrice assumptions are based on a blend of recent market prices and Valero's price forecast |

| 41 Source: Valero and Consultant Estimates MMBPD (CHART) Global CDU Capacity and Additions Gross Adds 1.7 MMBPDClosures 0.7 MMBPD Gross Adds 1.8 MMBPDClosures 0.1 MMBPD Gross Adds 1.6 MMBPDClosures 0.5 MMBPD |

| (CHART) (CHART) Continued Global Demand Growth Important to Refining Margins 42 Source: Consultant and Valero estimates Source: Consultant and Valero estimates MMBPD MMBPD Forecast Forecast |
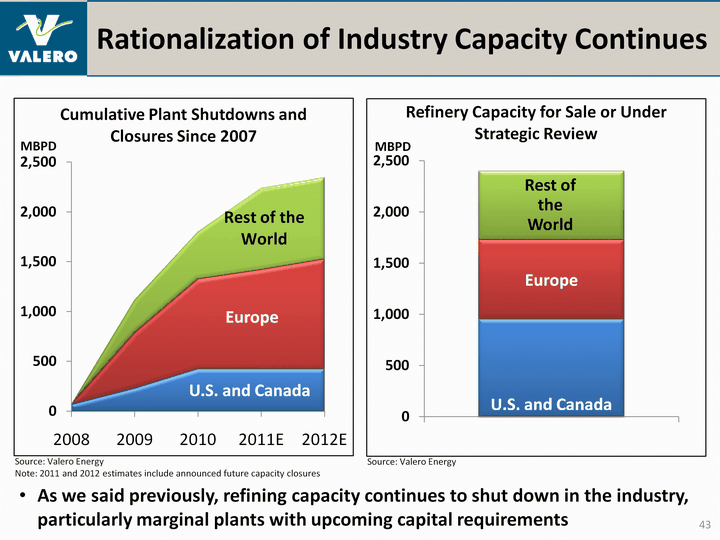
| (CHART) (CHART) Rationalization of Industry Capacity Continues Source: Valero EnergyNote: 2011 and 2012 estimates include announced future capacity closures MBPD 43 Source: Valero Energy MBPD As we said previously, refining capacity continues to shut down in the industry, particularly marginal plants with upcoming capital requirements U.S. and Canada |
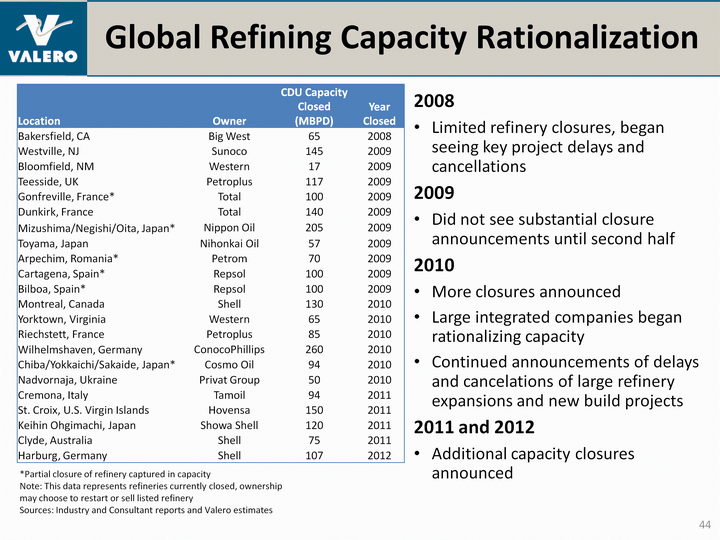
| *Partial closure of refinery captured in capacityNote: This data represents refineries currently closed, ownership may choose to restart or sell listed refinerySources: Industry and Consultant reports and Valero estimates Global Refining Capacity Rationalization 2008Limited refinery closures, began seeing key project delays and cancellations2009Did not see substantial closure announcements until second half2010More closures announcedLarge integrated companies began rationalizing capacityContinued announcements of delays and cancelations of large refinery expansions and new build projects2011 and 2012Additional capacity closures announced 44 Location Owner CDU CapacityClosed(MBPD) Year Closed Bakersfield, CA Big West 65 2008 Westville, NJ Sunoco 145 2009 Bloomfield, NM Western 17 2009 Teesside, UK Petroplus 117 2009 Gonfreville, France* Total 100 2009 Dunkirk, France Total 140 2009 Mizushima/Negishi/Oita, Japan* Nippon Oil 205 2009 Toyama, Japan Nihonkai Oil 57 2009 Arpechim, Romania* Petrom 70 2009 Cartagena, Spain* Repsol 100 2009 Bilboa, Spain* Repsol 100 2009 Montreal, Canada Shell 130 2010 Yorktown, Virginia Western 65 2010 Riechstett, France Petroplus 85 2010 Wilhelmshaven, Germany ConocoPhillips 260 2010 Chiba/Yokkaichi/Sakaide, Japan* Cosmo Oil 94 2010 Nadvornaja, Ukraine Privat Group 50 2010 Cremona, Italy Tamoil 94 2011 St. Croix, U.S. Virgin Islands Hovensa 150 2011 Keihin Ohgimachi, Japan Showa Shell 120 2011 Clyde, Australia Shell 75 2011 Harburg, Germany Shell 107 2012 |
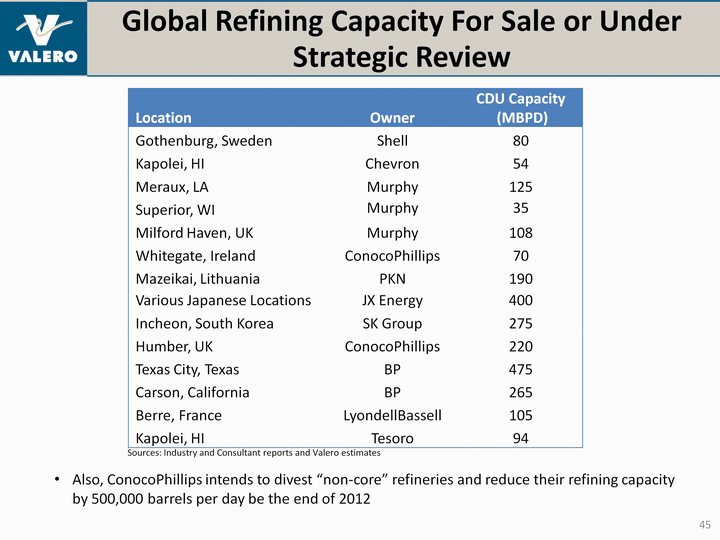
| Global Refining Capacity For Sale or Under Strategic Review 45 Location Owner CDU Capacity (MBPD) Gothenburg, Sweden Shell 80 Kapolei, HI Chevron 54 Meraux, LA Murphy 125 Superior, WI Murphy 35 Milford Haven, UK Murphy 108 Whitegate, Ireland ConocoPhillips 70 Mazeikai, Lithuania PKN 190 Various Japanese Locations JX Energy 400 Incheon, South Korea SK Group 275 Humber, UK ConocoPhillips 220 Texas City, Texas BP 475 Carson, California BP 265 Berre, France LyondellBassell 105 Kapolei, HI Tesoro 94 Sources: Industry and Consultant reports and Valero estimates Also, ConocoPhillips intends to divest "non-core" refineries and reduce their refining capacity by 500,000 barrels per day be the end of 2012 |

| Note: Availability of world CDU capacity assumed to average ~94%; Historical CDU capacity data from the DOE; USGC 5/3/2 = 3*USGC Gasoline+2*USGC ULSD-5*WTI Estimated global spare refining capacity fell from 7 million BPD of at end of 2009 to 5.7 million BPD at end of 2010(CHART) MMBPD Margin/bbl Golden Age Global Spare Capacity 46 |

| Made Excellent Ethanol Acquisitions Built position for average of only 35% of estimated replacement cost2Q09: acquired 7 plants with 780 million gallons per year of world-scale capacity in advantaged locations1Q10: Added 3 plants with 330 million gallons per year of capacity 47 Favorable margin outlookHigh crude oil prices support ethanol prices 2011 ethanol mandate grows 5% over 2010Expect demand to outgrow capacity, but blend wall must be addressed To incentivize new builds, margins must be high enough to yield reasonable return on higher-cost, new-build plantsValero's low-cost acquisitions of high-quality plants imply a competitive advantage in any margin environmentProvides platform for future production of advanced biofuels |

| U.S. Ethanol Demand BGal/yr We expect ethanol volumes to meet corn RFS requirements, but expect advanced (cellulosic) ethanol to develop more slowly than prescribedCurrent corn ethanol capacity is approximately 13.8 BGPY and the 2015 RFS for corn-based ethanol is 15 BGPY Source: Consultant and Valero estimates Ethanol Grows as Part of the Fuel Mix 48 |

| World Demand Favors Diesel World Demand Favors Diesel World Demand MMBPD Diesel demand is expected to recover past prior highs and grow rapidlyDiesel demand has grown to become much larger than gasoline globallyGrowing global diesel demand is an export opportunity for U.S. refineries History Forecast Source: Consultant, IEA, and Valero estimates 49 |

| Gasoline Fundamentals 50 50 (CHART) USGC LLS Gasoline Crack (per bbl) U.S. Gasoline Demand (mmbpd) (CHART) Source: Argus; 2011 data through July 29 Source: DOE weekly data; 2011 data through week ending July 29 Source: DOE weekly data; 2011 data through week ending July 29 Source: DOE weekly data; 2011 data through week ending July 29 U.S. Gasoline Days of Supply (CHART) U.S. Imports of Gasoline and Blendstocks (mbpd) |

| Distillate Fundamentals 51 51 (CHART) USGC LLS On-road Diesel Crack (per bbl) U.S. Distillate Demand (mmbpd) (CHART) (CHART) Source: Argus; 2011 data through July 29 Source: DOE weekly data; 2011 data through week ending July 29 Source: DOE weekly data; 2011 data through week ending July 29 Source: DOE monthly data; 2011 data through May 2011 U.S. Distillate Days of Supply U.S. Distillate Net Imports (mbpd) |
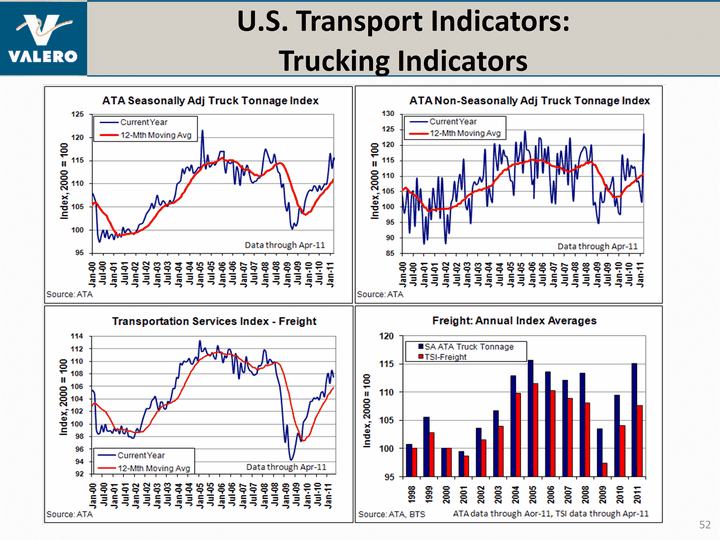
| U.S. Transport Indicators: Trucking Indicators 52 |

| (CHART) U.S. Transport Indicators 53 53 Latest data 23 W 2011 |

| (CHART) (CHART) Mexico Statistics Diesel Net Imports (MBPD) Source: PEMEX, latest data Apr-11 Gasoline Net Imports (MBPD) Source: PEMEX, latest data Apr-11 (CHART) Crude Unit Throughput (MBPD) Crude Unit Utilization (CHART) 54 Source: PEMEX, latest data Apr-11 Source: PEMEX, latest data Apr-11 |
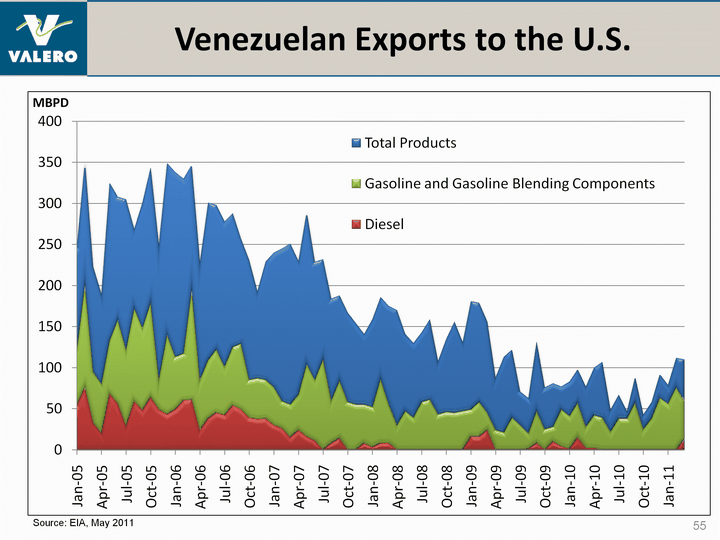
| Venezuelan Exports to the U.S. 55 (CHART) Source: EIA, May 2011 |
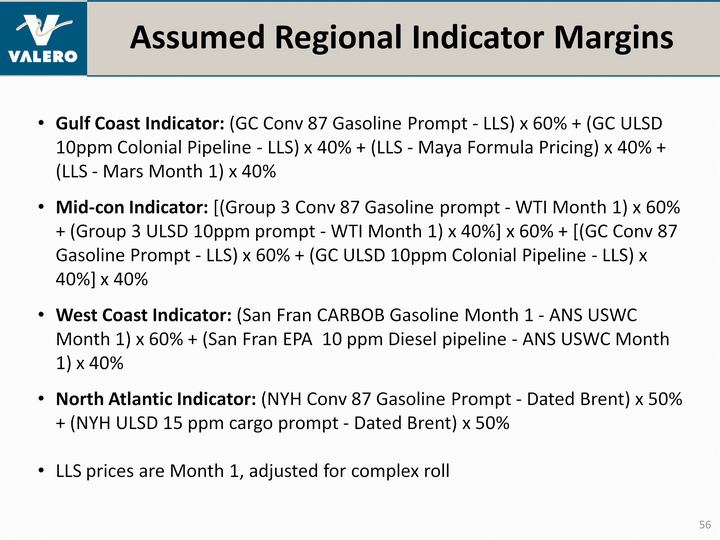
| Assumed Regional Indicator Margins Gulf Coast Indicator: (GC Conv 87 Gasoline Prompt - LLS) x 60% + (GC ULSD 10ppm Colonial Pipeline - LLS) x 40% + (LLS - Maya Formula Pricing) x 40% + (LLS - Mars Month 1) x 40%Mid-con Indicator: [(Group 3 Conv 87 Gasoline prompt - WTI Month 1) x 60% + (Group 3 ULSD 10ppm prompt - WTI Month 1) x 40%] x 60% + [(GC Conv 87 Gasoline Prompt - LLS) x 60% + (GC ULSD 10ppm Colonial Pipeline - LLS) x 40%] x 40%West Coast Indicator: (San Fran CARBOB Gasoline Month 1 - ANS USWC Month 1) x 60% + (San Fran EPA 10 ppm Diesel pipeline - ANS USWC Month 1) x 40%North Atlantic Indicator: (NYH Conv 87 Gasoline Prompt - Dated Brent) x 50% + (NYH ULSD 15 ppm cargo prompt - Dated Brent) x 50%LLS prices are Month 1, adjusted for complex roll 56 |

| Investor Relations Contacts For more information, please contact:Ashley Smith, CFA, CPAVice President, Investor Relations210.345.2744ashley.smith@valero.comMatthew JacksonInvestor Relations Specialist210.345.2564matthew.jackson@valero.com 57 |