EXHIBIT 99.1
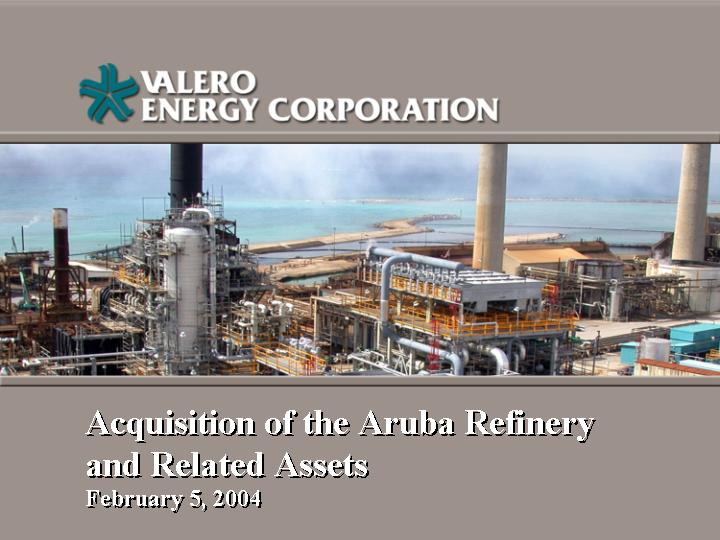
| Acquisition of the Aruba Refinery and Related Assets February 5, 2004 |
| Statements contained in this presentation that state the Company's or management's expectations or predictions of the future are forward-looking statements intended to be covered by the safe harbor provisions of the Securities Act of 1933 and the Securities Exchange Act of 1934. It is important to note that the Company's actual results could differ materially from those projected in such forward-looking statements. Factors that could affect those results include those mentioned in the documents that the Company has filed with the Securities and Exchange Commission and those listed in the Appendix. Safe Harbor Statement |
| The unaudited projections contained in this presentation were subject to and prepared on the basis of estimates, limitations, qualifications and assumptions and involved judgments with respect to, among other things, future economic, competitive, regulatory and financial market conditions and other matters, including effective tax rates and future business decisions that may not be realized, and are inherently subject to significant business, economic, competitive and regulatory uncertainties, all of which are difficult to predict and many of which are beyond Valero's control. Although Valero believes that these estimates and assumptions are reasonable, there can be no assurance that the unaudited projections will be accurate, and actual results may vary materially from those shown. In light of the uncertainties inherent in forward-looking information of any kind, the inclusion of these unaudited projections herein should not be regarded as a representation by Valero or any other entity or person that the anticipated results will be achieved, and investors are cautioned not to place undue reliance on such information. The unaudited projection data was not prepared in compliance with the published guidelines of the SEC or the guidelines established by the American Institute of Certified Public Accountants regarding projections and forecasts. Special Note Regarding Projections |
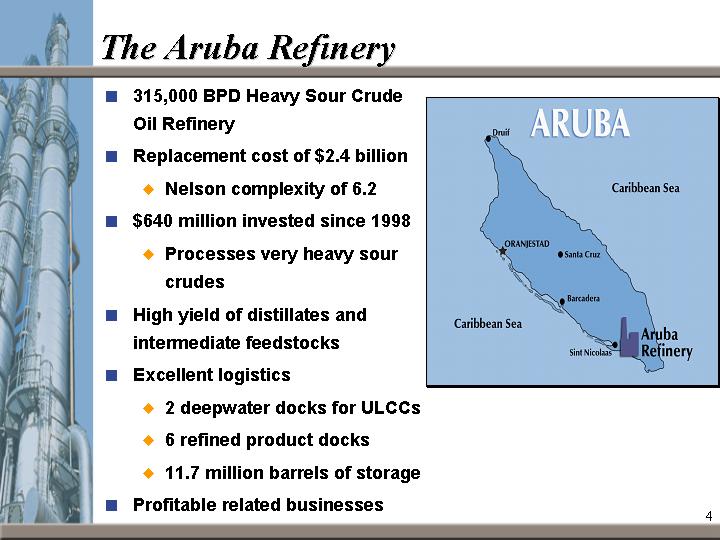
| The Aruba Refinery 315,000 BPD Heavy Sour Crude Oil Refinery Replacement cost of $2.4 billion Nelson complexity of 6.2 $640 million invested since 1998 Processes very heavy sour crudes High yield of distillates and intermediate feedstocks Excellent logistics 2 deepwater docks for ULCCs 6 refined product docks 11.7 million barrels of storage Profitable related businesses |
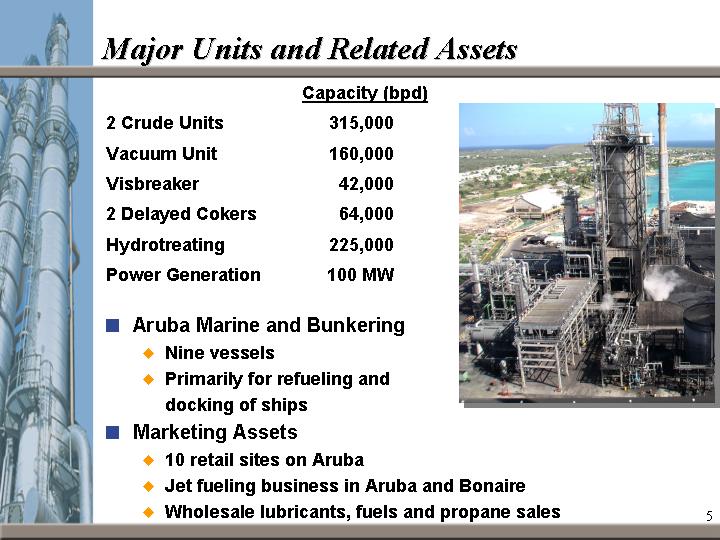
| Major Units and Related Assets Capacity (bpd) 2 Crude Units 315,000 Vacuum Unit 160,000 Visbreaker 42,000 2 Delayed Cokers 64,000 Hydrotreating 225,000 Power Generation 100 MW Aruba Marine and Bunkering Nine vessels Primarily for refueling and docking of ships Marketing Assets 10 retail sites on Aruba Jet fueling business in Aruba and Bonaire Wholesale lubricants, fuels and propane sales |
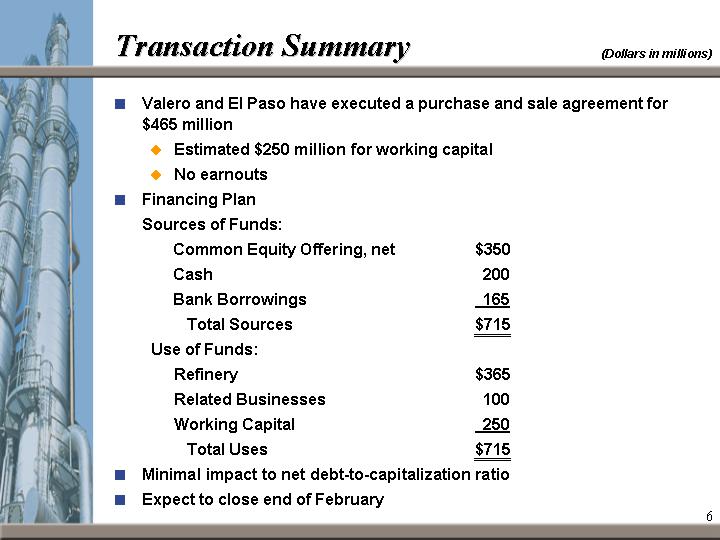
| Transaction Summary (Dollars in millions) Valero and El Paso have executed a purchase and sale agreement for $465 million Estimated $250 million for working capital No earnouts Financing Plan Sources of Funds: Common Equity Offering, net $350 Cash 200 Bank Borrowings 165 Total Sources $715 Use of Funds: Refinery $365 Related Businesses 100 Working Capital 250 Total Uses $715 Minimal impact to net debt-to-capitalization ratio Expect to close end of February |

| Strategic Rationale Expected to be accretive to earnings in 2004 and beyond Poor financial and operating history provides opportunity Expect to significantly increase reliability Key units are relatively new or recently upgraded Initial focus on improving power reliability Proven track record - St. Charles refinery Increases leverage to positive heavy sour crude oil fundamentals Strengthens geographic and product diversification Secure supply of intermediate feedstocks and blendstocks |
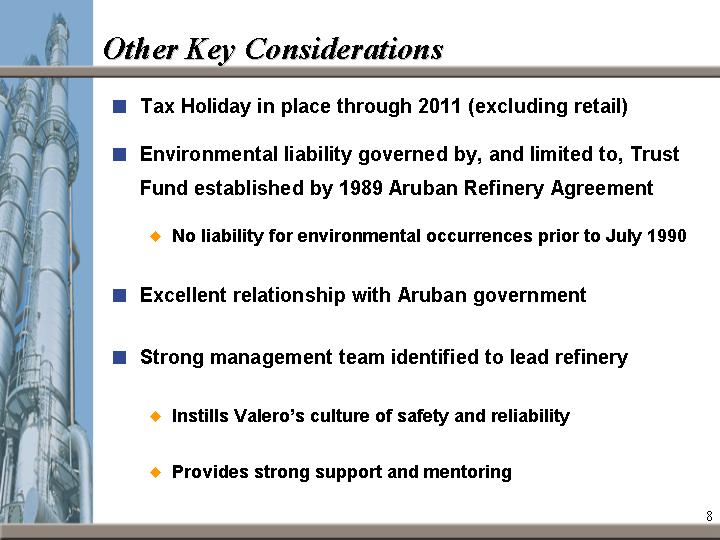
| Other Key Considerations Tax Holiday in place through 2011 (excluding retail) Environmental liability governed by, and limited to, Trust Fund established by 1989 Aruban Refinery Agreement No liability for environmental occurrences prior to July 1990 Excellent relationship with Aruban government Strong management team identified to lead refinery Instills Valero's culture of safety and reliability Provides strong support and mentoring |
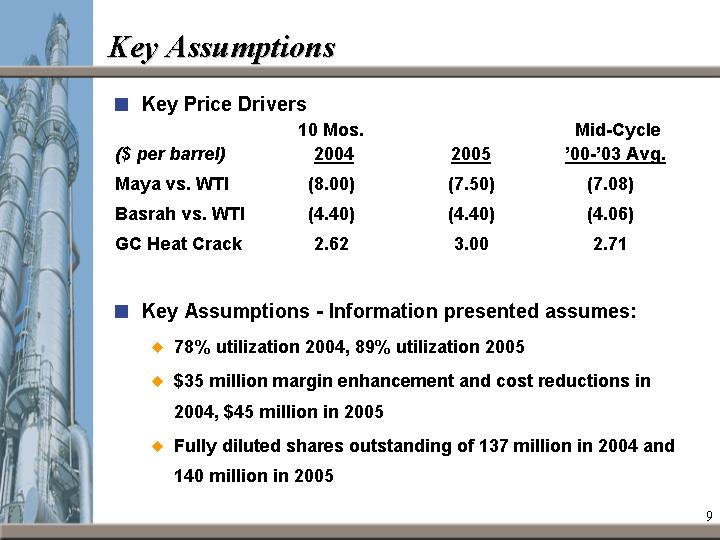
| Key Assumptions Key Price Drivers 10 Mos. Mid-Cycle ($ per barrel) 2004 2005 '00-'03 Avg. Maya vs. WTI (8.00) (7.50) (7.08) Basrah vs. WTI (4.40) (4.40) (4.06) GC Heat Crack 2.62 3.00 2.71 Key Assumptions - Information presented assumes: 78% utilization 2004, 89% utilization 2005 $35 million margin enhancement and cost reductions in 2004, $45 million in 2005 Fully diluted shares outstanding of 137 million in 2004 and 140 million in 2005 |
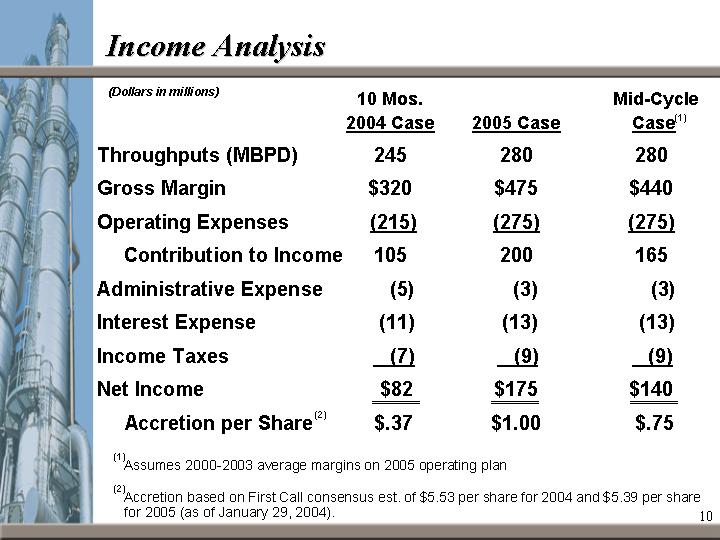
| Income Analysis 10 Mos. Mid-Cycle 2004 Case 2005 Case Case Throughputs (MBPD) 245 280 280 Gross Margin $320 $475 $440 Operating Expenses (215) (275) (275) Contribution to Income 105 200 165 Administrative Expense (5) (3) (3) Interest Expense (11) (13) (13) Income Taxes (7) (9) (9) Net Income $82 $175 $140 Accretion per Share $.37 $1.00 $.75 Assumes 2000-2003 average margins on 2005 operating plan Accretion based on First Call consensus est. of $5.53 per share for 2004 and $5.39 per share for 2005 (as of January 29, 2004). (Dollars in millions) (2) (1) (2) (1) |
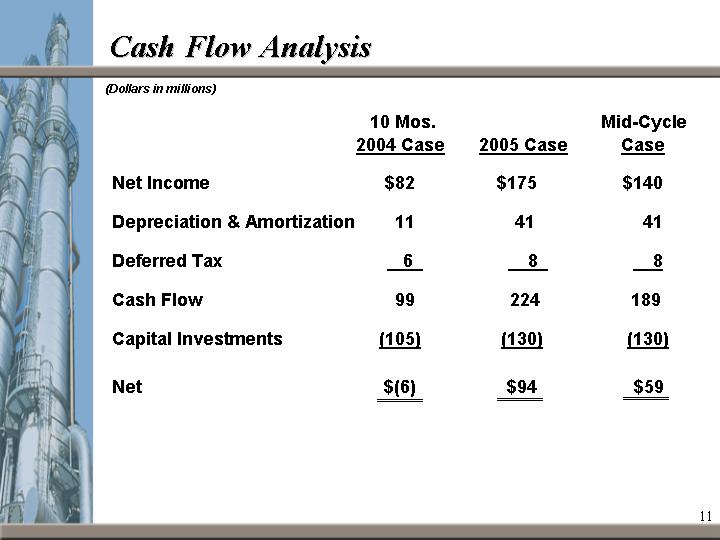
| Cash Flow Analysis 10 Mos. Mid-Cycle 2004 Case 2005 Case Case Net Income $82 $175 $140 Depreciation & Amortization 11 41 41 Deferred Tax 6 8 8 Cash Flow 99 224 189 Capital Investments (105) (130) (130) Net $(6) $94 $59 (Dollars in millions) |
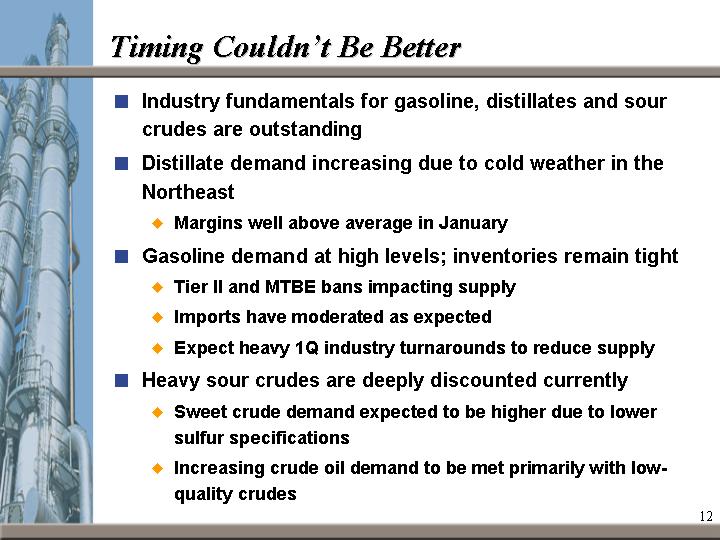
| Timing Couldn't Be Better Industry fundamentals for gasoline, distillates and sour crudes are outstanding Distillate demand increasing due to cold weather in the Northeast Margins well above average in January Gasoline demand at high levels; inventories remain tight Tier II and MTBE bans impacting supply Imports have moderated as expected Expect heavy 1Q industry turnarounds to reduce supply Heavy sour crudes are deeply discounted currently Sweet crude demand expected to be higher due to lower sulfur specifications Increasing crude oil demand to be met primarily with low- quality crudes |
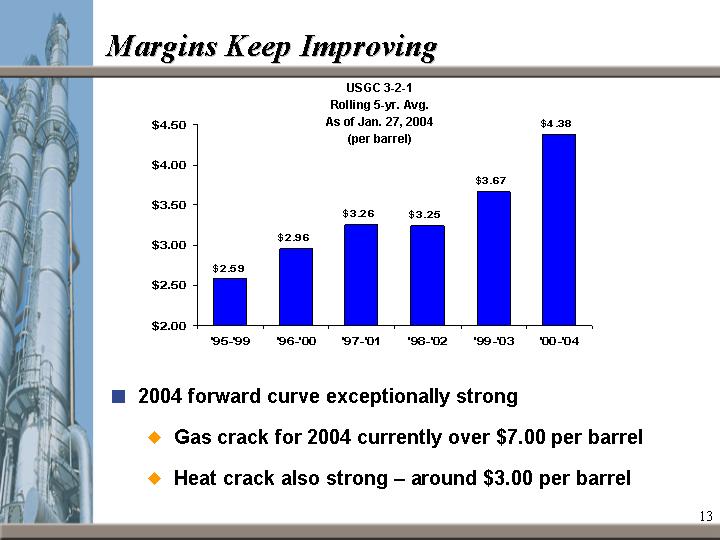
| 2004 forward curve exceptionally strong Gas crack for 2004 currently over $7.00 per barrel Heat crack also strong - around $3.00 per barrel Margins Keep Improving '95-'99 '96-'00 '97-'01 '98-'02 '99-'03 '00-'04 USGC 3-2-1 2.59 2.96 3.26 3.25 3.67 4.38 USGC 3-2-1 Rolling 5-yr. Avg. As of Jan. 27, 2004 (per barrel) |

| Over $5.00/bbl 2% of time Over $5.00/bbl 29% of time Higher highs and higher lows a reality Best positioned refiner to benefit from the New Era New Era for Refining |
| Appendix |
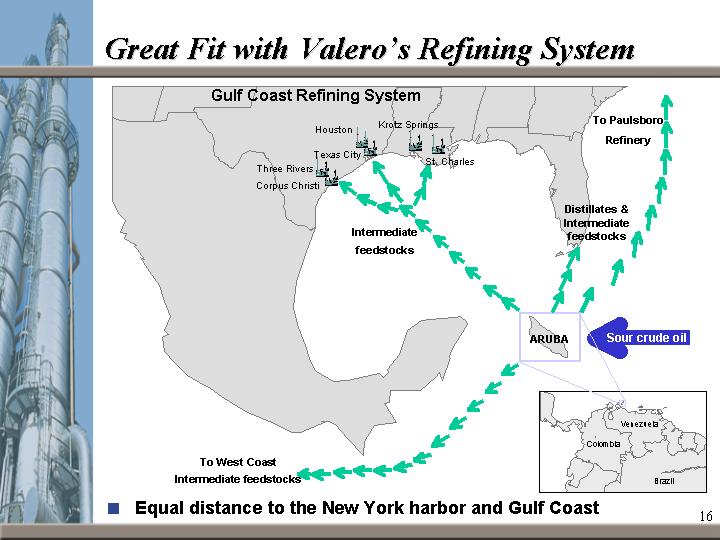
| Great Fit with Valero's Refining System Equal distance to the New York harbor and Gulf Coast Venezuela Colombia Brazil To Paulsboro Refinery Distillates & Intermediate feedstocks Gulf Coast Refining System To West Coast Intermediate feedstocks ARUBA Intermediate feedstocks Sour crude oil Three Rivers Corpus Christi Houston Texas City Krotz Springs St. Charles |

| Aruba Charges & Yields Profile |
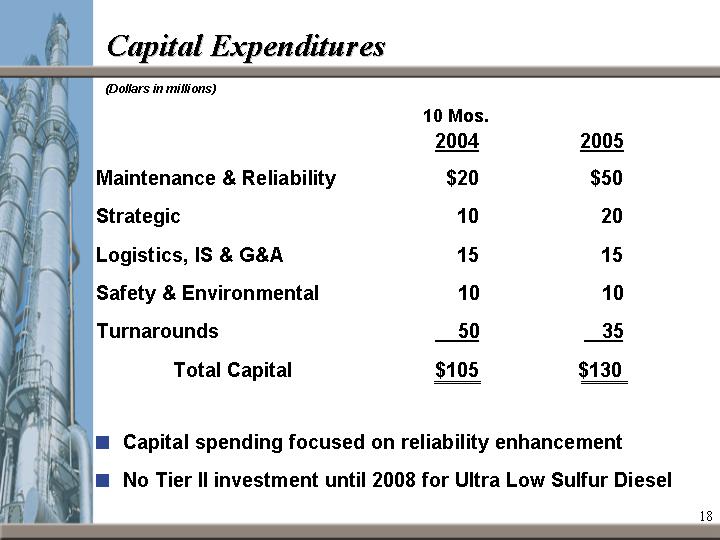
| Capital Expenditures 10 Mos. 2004 2005 Maintenance & Reliability $20 $50 Strategic 10 20 Logistics, IS & G&A 15 15 Safety & Environmental 10 10 Turnarounds 50 35 Total Capital $105 $130 Capital spending focused on reliability enhancement No Tier II investment until 2008 for Ultra Low Sulfur Diesel (Dollars in millions) |
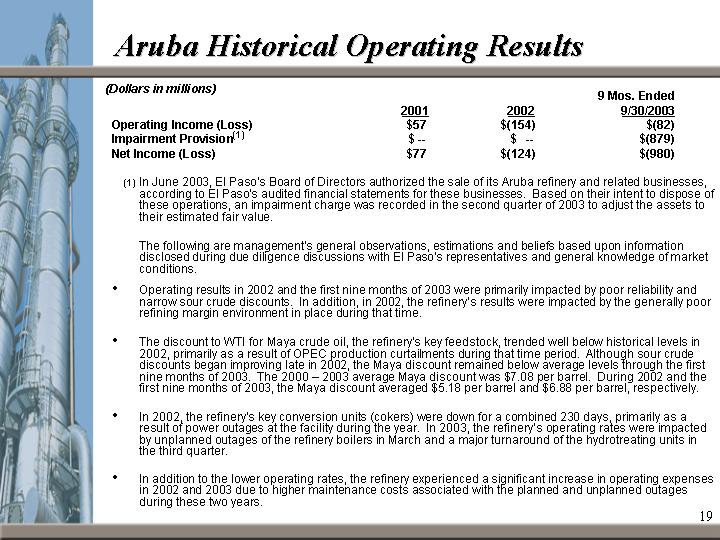
| 9 Mos. Ended 2001 2002 9/30/2003 Operating Income (Loss) $57 $(154) $(82) Impairment Provision $ -- $ -- $(879) Net Income (Loss) $77 $(124) $(980) In June 2003, El Paso's Board of Directors authorized the sale of its Aruba refinery and related businesses, according to El Paso's audited financial statements for these businesses. Based on their intent to dispose of these operations, an impairment charge was recorded in the second quarter of 2003 to adjust the assets to their estimated fair value. The following are management's general observations, estimations and beliefs based upon information disclosed during due diligence discussions with El Paso's representatives and general knowledge of market conditions. Operating results in 2002 and the first nine months of 2003 were primarily impacted by poor reliability and narrow sour crude discounts. In addition, in 2002, the refinery's results were impacted by the generally poor refining margin environment in place during that time. The discount to WTI for Maya crude oil, the refinery's key feedstock, trended well below historical levels in 2002, primarily as a result of OPEC production curtailments during that time period. Although sour crude discounts began improving late in 2002, the Maya discount remained below average levels through the first nine months of 2003. The 2000 - 2003 average Maya discount was $7.08 per barrel. During 2002 and the first nine months of 2003, the Maya discount averaged $5.18 per barrel and $6.88 per barrel, respectively. In 2002, the refinery's key conversion units (cokers) were down for a combined 230 days, primarily as a result of power outages at the facility during the year. In 2003, the refinery's operating rates were impacted by unplanned outages of the refinery boilers in March and a major turnaround of the hydrotreating units in the third quarter. In addition to the lower operating rates, the refinery experienced a significant increase in operating expenses in 2002 and 2003 due to higher maintenance costs associated with the planned and unplanned outages during these two years. Aruba Historical Operating Results (Dollars in millions) (1) (1) |
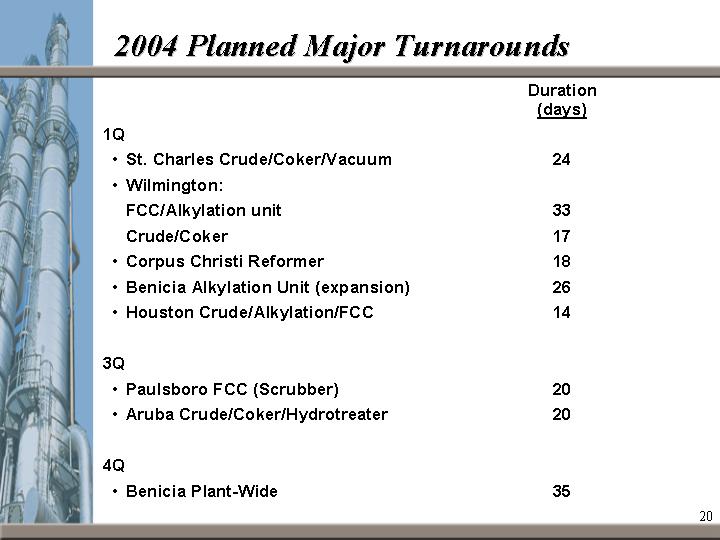
| 2004 Planned Major Turnarounds Duration (days) 1Q St. Charles Crude/Coker/Vacuum 24 Wilmington: FCC/Alkylation unit 33 Crude/Coker 17 Corpus Christi Reformer 18 Benicia Alkylation Unit (expansion) 26 Houston Crude/Alkylation/FCC 14 3Q Paulsboro FCC (Scrubber) 20 Aruba Crude/Coker/Hydrotreater 20 4Q Benicia Plant-Wide 35 |
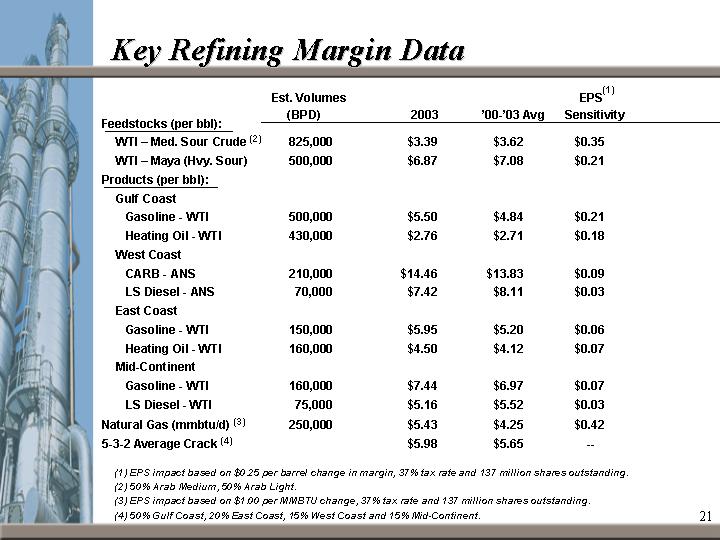
| Est. Volumes EPS (BPD) 2003 '00-'03 Avg Sensitivity Feedstocks (per bbl): WTI - Med. Sour Crude (2) 825,000 $3.39 $3.62 $0.35 WTI - Maya (Hvy. Sour) 500,000 $6.87 $7.08 $0.21 Products (per bbl): Gulf Coast Gasoline - WTI 500,000 $5.50 $4.84 $0.21 Heating Oil - WTI 430,000 $2.76 $2.71 $0.18 West Coast CARB - ANS 210,000 $14.46 $13.83 $0.09 LS Diesel - ANS 70,000 $7.42 $8.11 $0.03 East Coast Gasoline - WTI 150,000 $5.95 $5.20 $0.06 Heating Oil - WTI 160,000 $4.50 $4.12 $0.07 Mid-Continent Gasoline - WTI 160,000 $7.44 $6.97 $0.07 LS Diesel - WTI 75,000 $5.16 $5.52 $0.03 Natural Gas (mmbtu/d) (3) 250,000 $5.43 $4.25 $0.42 5-3-2 Average Crack (4) $5.98 $5.65 -- Key Refining Margin Data (1) EPS impact based on $0.25 per barrel change in margin, 37% tax rate and 137 million shares outstanding. (2) 50% Arab Medium, 50% Arab Light. (3) EPS impact based on $1.00 per MMBTU change, 37% tax rate and 137 million shares outstanding. (4) 50% Gulf Coast, 20% East Coast, 15% West Coast and 15% Mid-Continent. (1) |
| Forward-Looking Statements |