| Management Presentation March 2003 |
| Statements contained in this presentation that state the Company's or management's expectations or predictions of the future are forward-looking statements intended to be covered by the safe harbor provisions of the Securities Act of 1933 and the Securities Exchange Act of 1934. It is important to note that the Company's actual results could differ materially from those projected in such forward-looking statements. Factors that could affect those results include those mentioned in the documents that the Company has filed with the Securities and Exchange Commission. Safe Harbor Statement |

| UDS Acquisition Key to Current & Future Success Large size and scope of operations coupled with complex refining system gives us a competitive advantage Economies of scale and access to capital are critical Geographic diversity stabilizes earnings Mid-Continent and Canadian refining systems contributed $250 million to 2002 operating income Integrated business lines Retail exposure contributing to earnings $130 million to operating income in 2002 Valero L.P. - logistics and pipeline business Currently 74% owned by Valero |

| UDS Acquisition Great/Timing Proved Challenging Challenging Conditions in 2002 9/11; poor economy; record warm winter Resulted in poor product margins and weak sour crude discounts More difficult to pay down debt than originally anticipated Still able to reduce debt-to-cap from 53.4% at beginning of the year to 50.4% at year-end Aggressive inventory management - reduced inventories from a high of 69 million barrels during the year to 54 million barrels at year-end Reduced cash requirements by $450 million |
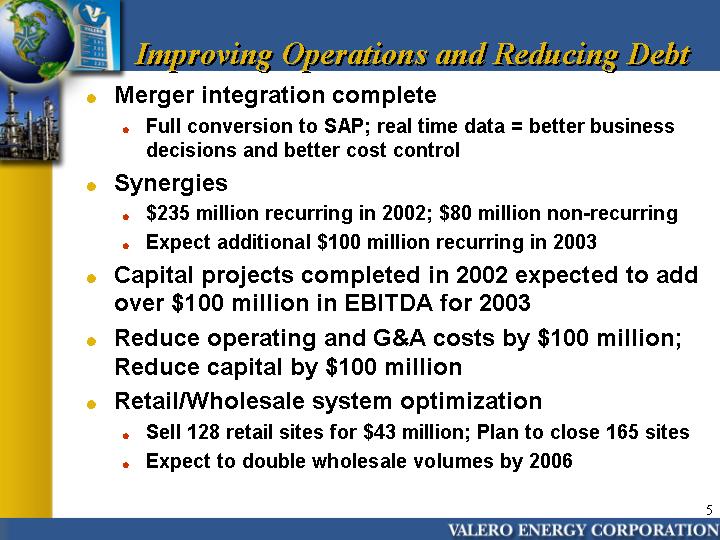
| Improving Operations and Reducing Debt Merger integration complete Full conversion to SAP; real time data = better business decisions and better cost control Synergies $235 million recurring in 2002; $80 million non-recurring Expect additional $100 million recurring in 2003 Capital projects completed in 2002 expected to add over $100 million in EBITDA for 2003 Reduce operating and G&A costs by $100 million; Reduce capital by $100 million Retail/Wholesale system optimization Sell 128 retail sites for $43 million; Plan to close 165 sites Expect to double wholesale volumes by 2006 |
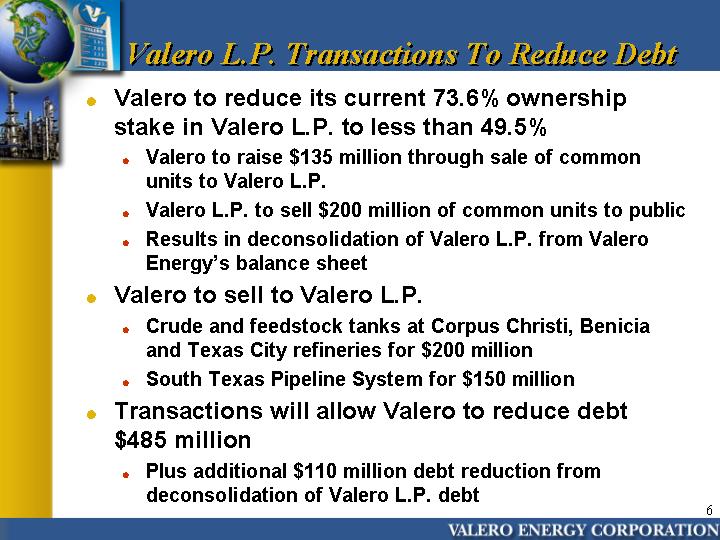
| Valero to reduce its current 73.6% ownership stake in Valero L.P. to less than 49.5% Valero to raise $135 million through sale of common units to Valero L.P. Valero L.P. to sell $200 million of common units to public Results in deconsolidation of Valero L.P. from Valero Energy's balance sheet Valero to sell to Valero L.P. Crude and feedstock tanks at Corpus Christi, Benicia and Texas City refineries for $200 million South Texas Pipeline System for $150 million Transactions will allow Valero to reduce debt $485 million Plus additional $110 million debt reduction from deconsolidation of Valero L.P. debt Valero L.P. Transactions To Reduce Debt |
| Strike in Venezuela reduced global gasoline and distillate stocks Cold winter drew down distillate stocks in U.S. Continued fuel switching demand throughout 2003 Heavy industry turnaround schedule in 1Q 85% refinery utilization in February Only one major turnaround for Valero in 2003 Throughput volumes to be up 10% vs. 2002 Global refined product inventories at 5-year lows Expect imports to moderate Japan consuming intermediates for power Sour crude discounts widening Venezuelan crude oil returning to market OPEC production has increased Strong Fundamentals |
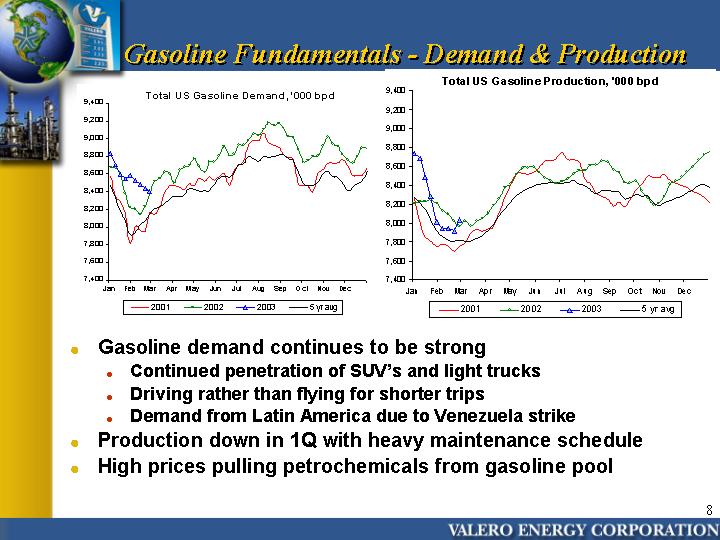
| Gasoline Fundamentals - Demand & Production Gasoline demand continues to be strong Continued penetration of SUV's and light trucks Driving rather than flying for shorter trips Demand from Latin America due to Venezuela strike Production down in 1Q with heavy maintenance schedule High prices pulling petrochemicals from gasoline pool |
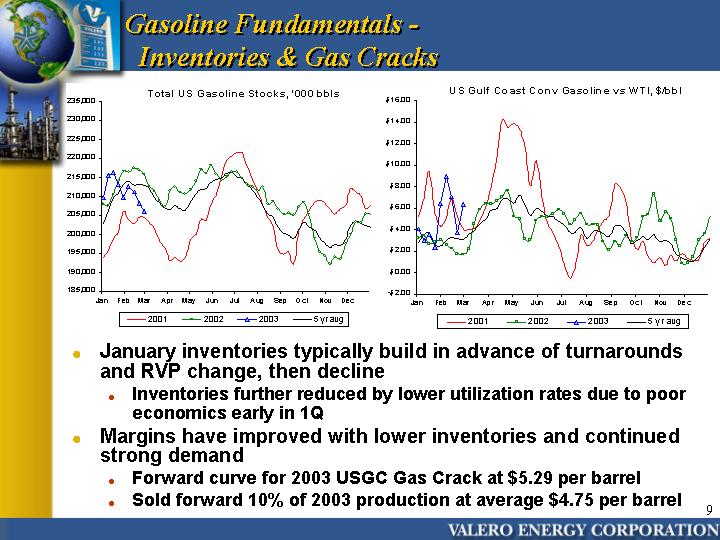
| January inventories typically build in advance of turnarounds and RVP change, then decline Inventories further reduced by lower utilization rates due to poor economics early in 1Q Margins have improved with lower inventories and continued strong demand Forward curve for 2003 USGC Gas Crack at $5.29 per barrel Sold forward 10% of 2003 production at average $4.75 per barrel Gasoline Fundamentals - Inventories & Gas Cracks |

| MTBE phase-out underway, expected to result in reduced CARB production of 60,000 barrels per day Lower RVP standard began March 1 10% of California conversion capacity down in February CARB cracks currently around $20 per barrel compared to $7 per barrel in January Gasoline Fundamentals - California |
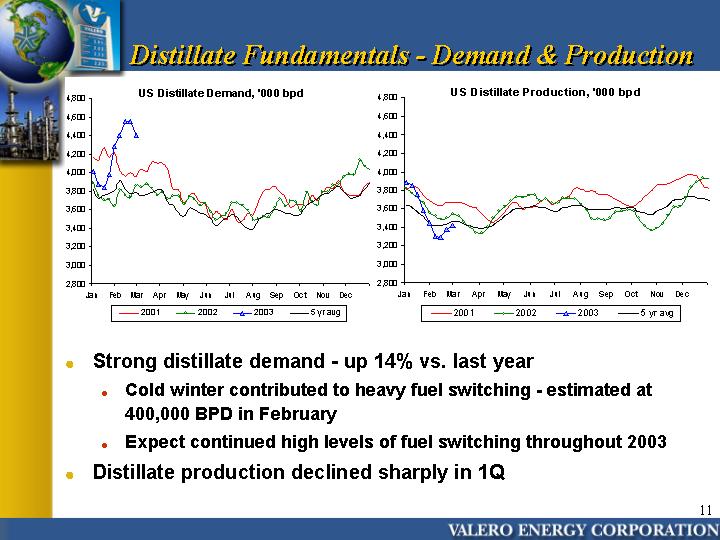
| Strong distillate demand - up 14% vs. last year Cold winter contributed to heavy fuel switching - estimated at 400,000 BPD in February Expect continued high levels of fuel switching throughout 2003 Distillate production declined sharply in 1Q Distillate Fundamentals - Demand & Production |

| Distillate inventories at extremely low levels Good demand, heavy turnaround schedule, exports to Latin America As a result, distillate margins are at near record levels Forward curve for 2003 USGC Heat Crack at $4.40 per barrel versus 5-year average of $1.96 per barrel Sold forward 30% of 2003 production at average $3.15 per barrel Distillate Fundamentals - Inventories & Heat Cracks |

| Sour crude discounts have widened considerably after narrowing briefly due to Venezuela strike Additional OPEC production made available Sour crude discount at $4.45 per barrel for April; Improvement of $2.00 per barrel since February Gulf Coast Mars sour crude discount currently over $6.50 per barrel Sour Crude Discounts |
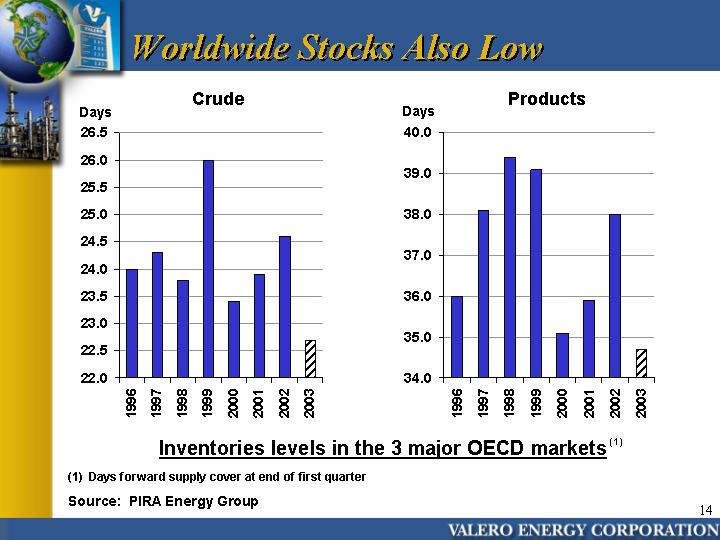
| Worldwide Stocks Also Low 1996 24 1997 24.3 1998 23.8 1999 26 2000 23.4 2001 23.9 2002 24.6 2003 22.7 1996 36 1997 38.1 1998 39.4 1999 39.1 2000 35.1 2001 35.9 2002 38 2003 34.7 Crude Products Days Days Inventories levels in the 3 major OECD markets Source: PIRA Energy Group (1) (1) Days forward supply cover at end of first quarter |
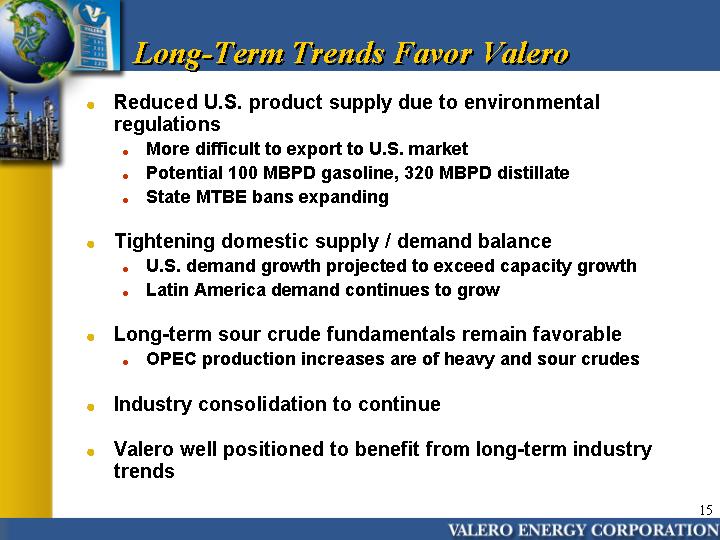
| Reduced U.S. product supply due to environmental regulations More difficult to export to U.S. market Potential 100 MBPD gasoline, 320 MBPD distillate State MTBE bans expanding Tightening domestic supply / demand balance U.S. demand growth projected to exceed capacity growth Latin America demand continues to grow Long-term sour crude fundamentals remain favorable OPEC production increases are of heavy and sour crudes Industry consolidation to continue Valero well positioned to benefit from long-term industry trends Long-Term Trends Favor Valero |
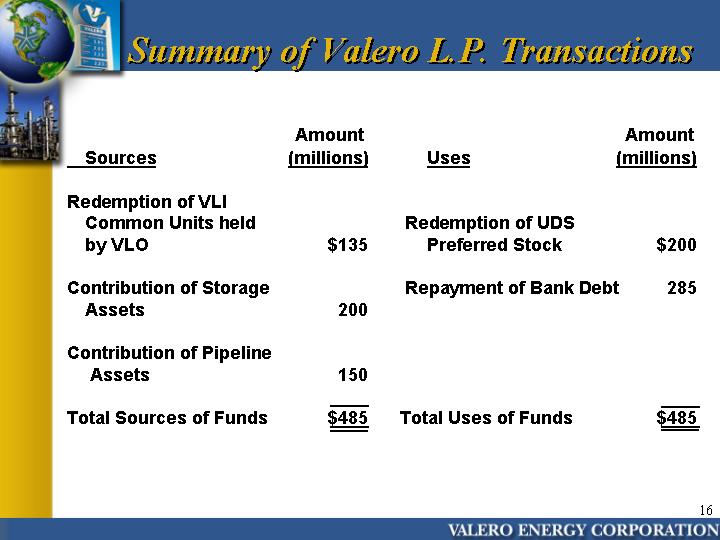
| Summary of Valero L.P. Transactions Amount Amount Sources (millions) Uses (millions) Redemption of VLI Common Units held Redemption of UDS by VLO $135 Preferred Stock $200 Contribution of Storage Repayment of Bank Debt 285 Assets 200 Contribution of Pipeline Assets 150 Total Sources of Funds $485 Total Uses of Funds $485 |
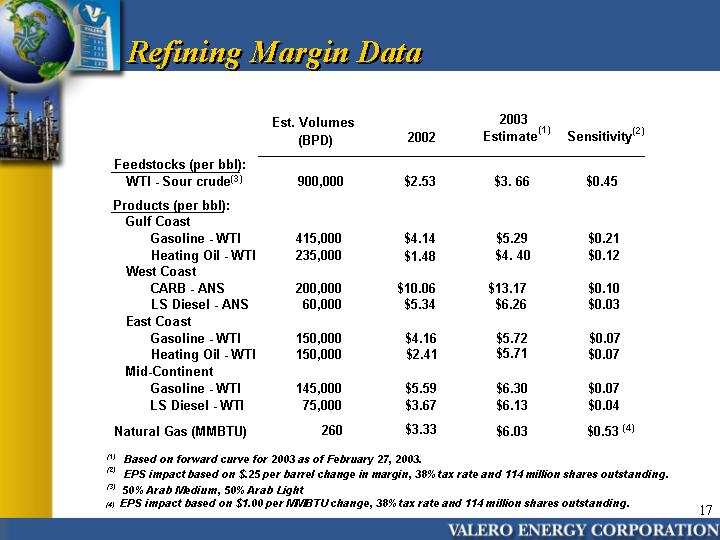
| Est. Volumes 2002 2003 (BPD) Estimate (1) Sensitivity (2) Feedstocks (per bbl): WTI - Sour crude(3) 900,000 $2.53 $3. 66 $0.45 Products (per bbl): Gulf Coast Gasoline - WTI 415,000 $4.14 $5.29 $0.21 Heating Oil - WTI 235,000 $1.48 $4. 40 $0.12 West Coast CARB - ANS 200,000 $10.06 $13.17 $0.10 LS Diesel - ANS 60,000 $5.34 $6.26 $0.03 East Coast Gasoline - WTI 150,000 $4.16 $5.72 $0.07 Heating Oil - WTI 150,000 $2.41 $5.71 $0.07 Mid-Continent Gasoline - WTI 145,000 $5.59 $6.30 $0.07 LS Diesel - WTI 75,000 $3.67 $6.13 $0.04 (1) Based on forward curve for 2003 as of February 27, 2003. (2) EPS impact based on $.25 per barrel change in margin, 38% tax rate and 114 million shares outstanding. Refining Margin Data Natural Gas (MMBTU) 260 $3.33 $6.03 $0.53 50% Arab Medium, 50% Arab Light (3) (4) (4) EPS impact based on $1.00 per MMBTU change, 38% tax rate and 114 million shares outstanding. |

| ($ in millions, except per share amounts) 2002 2003 est. EBITDA $879 $1,945 Net Income $91 $740 Earnings Per Share (diluted) $0.83 $6.50 Cash Flow (2) $1,800 $1,650 Capital Investments $960 $1,000 Debt & UDS Preferred Stock $5,164 $4,650 After VLI deconsolidation $4,593 $4,050 Debt-to-Capitalization (net of cash) 50.4% 43.8% After VLI deconsolidation 48.5% 40.9% Shares Outstanding (MM, diluted) 110.0 114.0 (1) Based on forward curve for 2003 as of February 27. (2) Cash Flow includes Operating Sources plus $1.2 billion asset sales in 2002 and $172 MM proceeds from mandatory convertible transaction in 2003 Financial Summary |
| Anticipate debt reduction of $1.1 billion in 2003 $485 million related to Valero L.P. transactions Additional $110 million related to deconsolidation of Valero L.P. debt Maintain investment grade rating Valero L.P. transactions to have minimal impact to Valero Energy's recurring income Enhances both entities ability to finance future growth opportunities Much Stronger Financial Position |

| Appendix |

| Valero Refineries Branded Marketing Presence San Antonio Headquarters Valero Terminals Valero Pipelines Valero LP Refined Products Terminals Valero LP Crude Oil Storage Facilities Valero LP Pipelines VALERO LP ASSETS VALERO ASSETS System Map |
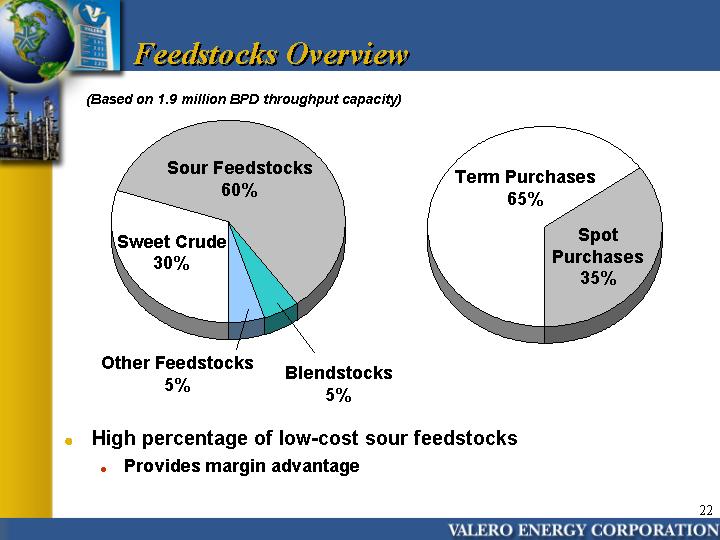
| Term Crude Spot Purchases 0.65 0.35 Sweet Crude Sour Feedstocks Blendstocks Other Feedstocks 0.3 0.6 0.05 0.05 Sour Feedstocks 60% Sweet Crude 30% Spot Purchases 35% Term Purchases 65% Other Feedstocks 5% (Based on 1.9 million BPD throughput capacity) Blendstocks 5% Feedstocks Overview High percentage of low-cost sour feedstocks Provides margin advantage |

| Gasoline/Blendstocks Distillate Asphalt, Petro. Other 52 30 18 Distillate 30% Asphalt, Petrochemicals, Other 18% Gasoline & Blendstocks 52% Bulk Retail Wholesale 60 10 30 Bulk 60% Wholesale 30% Retail 10% REFINED PRODUCT SLATE GASOLINE & DISTILLATE DISTRIBUTION CHANNELS Refined Products & Distribution Channels 50% of gasoline produced as RFG and CARB 75% of distillates are low-sulfur |