- VLO Dashboard
- Financials
- Filings
-
Holdings
- Transcripts
- ETFs
- Insider
- Institutional
- Shorts
-
8-K Filing
Valero Energy (VLO) 8-KRegulation FD Disclosure
Filed: 26 Apr 07, 12:00am
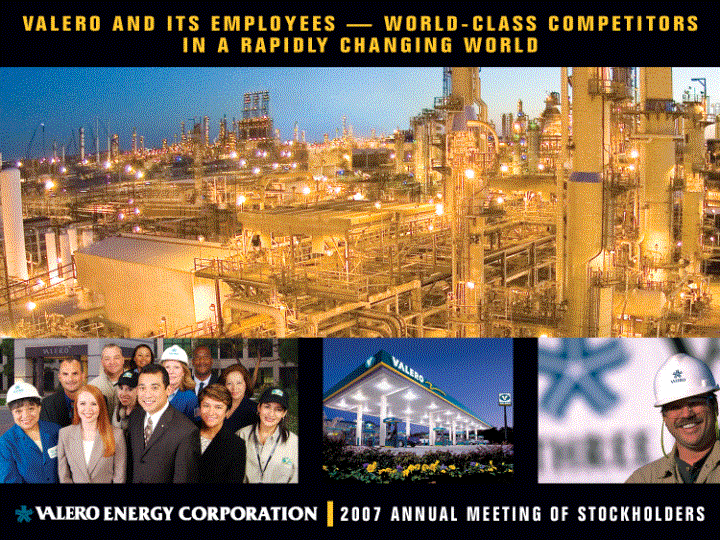
| 2006 - Best Year in Valero's History Terrific Financial Results $5.5 billion net income, $92 billion in revenues #16 on Fortune 500 list Record $8.64 EPS Largest Capital Investment Program $3.75 billion invested in our company Purchased 35 million shares of stock (5% of outstanding shares) Increased dividend twice in 2006 and by 50% in January of 2007 3 |
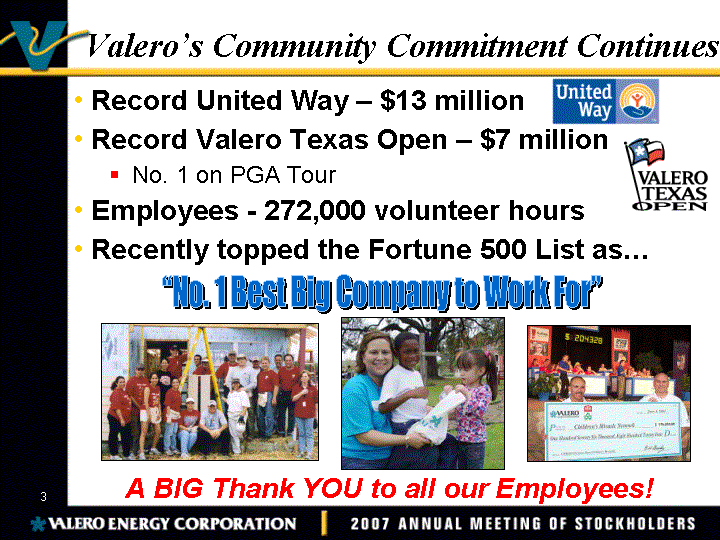
| Valero's Community Commitment Continues Record United Way - $13 million Record Valero Texas Open - $7 million No. 1 on PGA Tour Employees - 272,000 volunteer hours Recently topped the Fortune 500 List as... A BIG Thank YOU to all our Employees! 5 "No. 1 Best Big Company to Work For" |
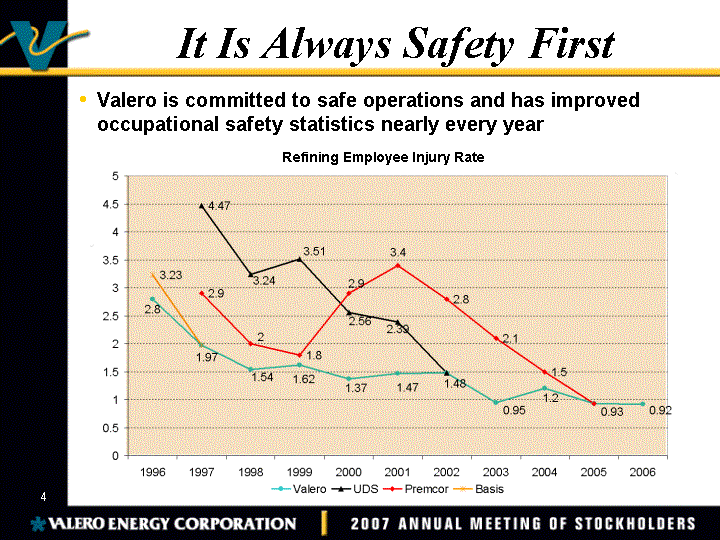
| It Is Always Safety First Valero is committed to safe operations and has improved occupational safety statistics nearly every year Refining Employee Injury Rate 7 |
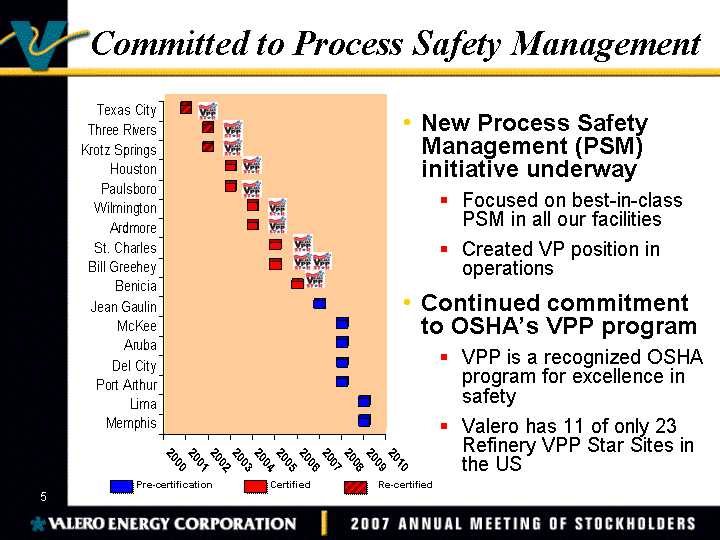
| Pre-certification Re-certified Committed to Process Safety Management New Process Safety Management (PSM) initiative underway Focused on best-in-class PSM in all our facilities Created VP position in operations Continued commitment to OSHA's VPP program VPP is a recognized OSHA program for excellence in safety Valero has 11 of only 23 Refinery VPP Star Sites in the US 9 |
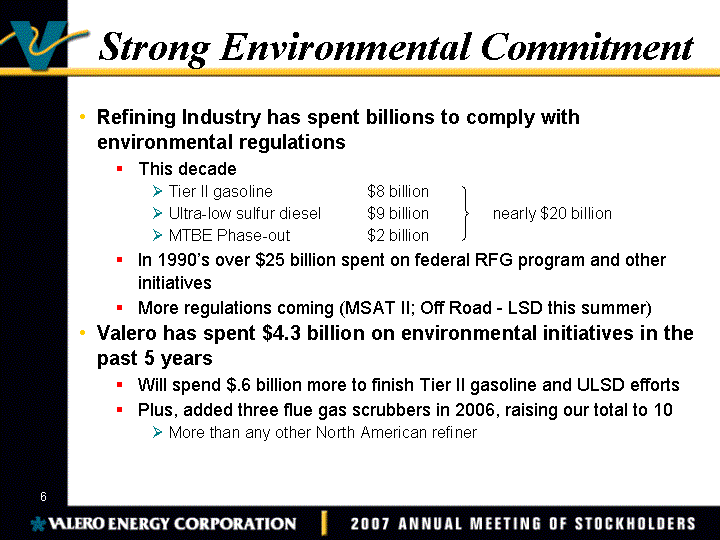
| Strong Environmental Commitment Refining Industry has spent billions to comply with environmental regulations This decade Tier II gasoline $8 billion Ultra-low sulfur diesel $9 billion nearly $20 billion MTBE Phase-out $2 billion In 1990's over $25 billion spent on federal RFG program and other initiatives More regulations coming (MSAT II; Off Road - LSD this summer) Valero has spent $4.3 billion on environmental initiatives in the past 5 years Will spend $.6 billion more to finish Tier II gasoline and ULSD efforts Plus, added three flue gas scrubbers in 2006, raising our total to 10 More than any other North American refiner 11 |
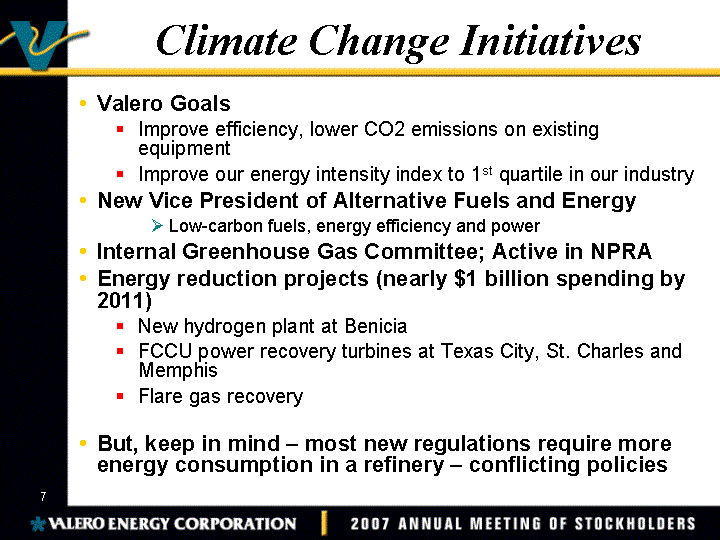
| Climate Change Initiatives Valero Goals Improve efficiency, lower CO2 emissions on existing equipment Improve our energy intensity index to 1st quartile in our industry New Vice President of Alternative Fuels and Energy Low-carbon fuels, energy efficiency and power Internal Greenhouse Gas Committee; Active in NPRA Energy reduction projects (nearly $1 billion spending by 2011) New hydrogen plant at Benicia FCCU power recovery turbines at Texas City, St. Charles and Memphis Flare gas recovery But, keep in mind - most new regulations require more energy consumption in a refinery - conflicting policies |

| Strategic Focus Shifting Growth through acquisition strategy was clearly the right call at the right time Throughput Capacity '3-2-1 Maya Diff 1997 0.53 3.321046328 5.603151767 1998 0.735 2.472635628 5.628834473 1999 0.785 1.806875275 4.791944615 2000 1 4.339628166 7.492355576 2001 1.9 4.33108198 8.677755893 2002 1.913 3.273494493 5.364652941 2003 2.126 4.586451944 6.819834811 2004 2.458 6.463591788 11.44569076 2005 3.26 11.02823179 15.65974257 2006 3.29 10.8923712 14.79508375 2007 Fwd Curve 3.29 13.43 VLO Throughput Capacity and 3-2-1 Crack $/bbl mmbbls/day GC 3-2-1 Crack/bbl |
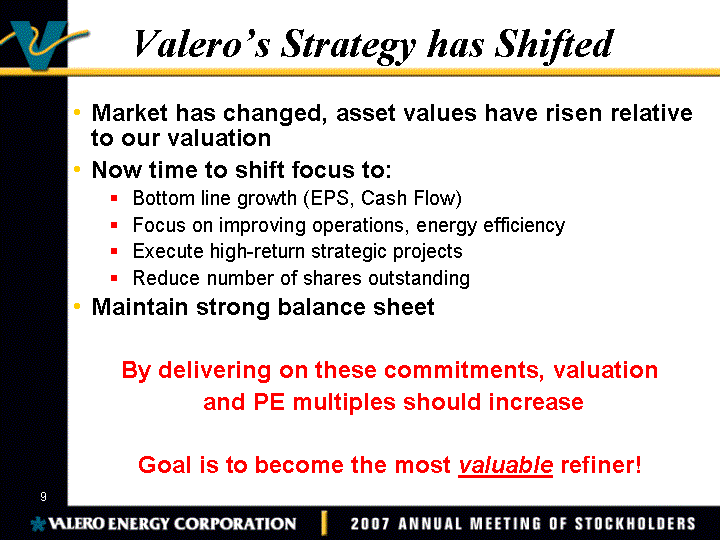
| Valero's Strategy has Shifted Market has changed, asset values have risen relative to our valuation Now time to shift focus to: Bottom line growth (EPS, Cash Flow) Focus on improving operations, energy efficiency Execute high-return strategic projects Reduce number of shares outstanding Maintain strong balance sheet By delivering on these commitments, valuation and PE multiples should increase Goal is to become the most valuable refiner! |
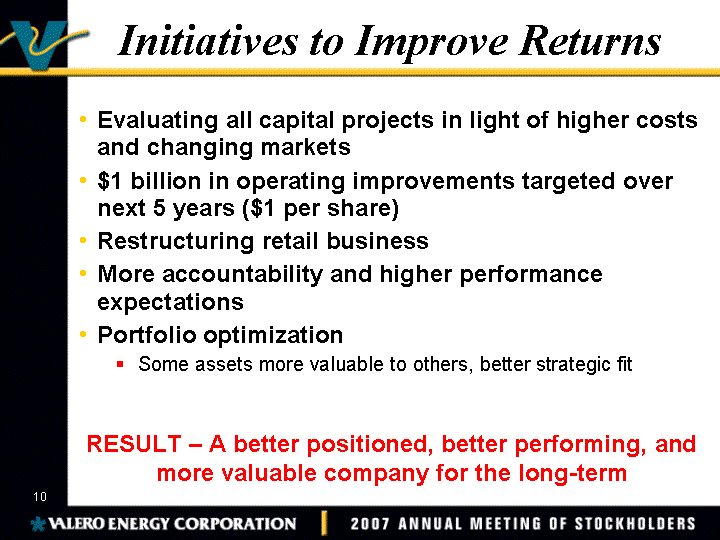
| Initiatives to Improve Returns Evaluating all capital projects in light of higher costs and changing markets $1 billion in operating improvements targeted over next 5 years ($1 per share) Restructuring retail business More accountability and higher performance expectations Portfolio optimization Some assets more valuable to others, better strategic fit 19 RESULT - A better positioned, better performing, and more valuable company for the long-term |
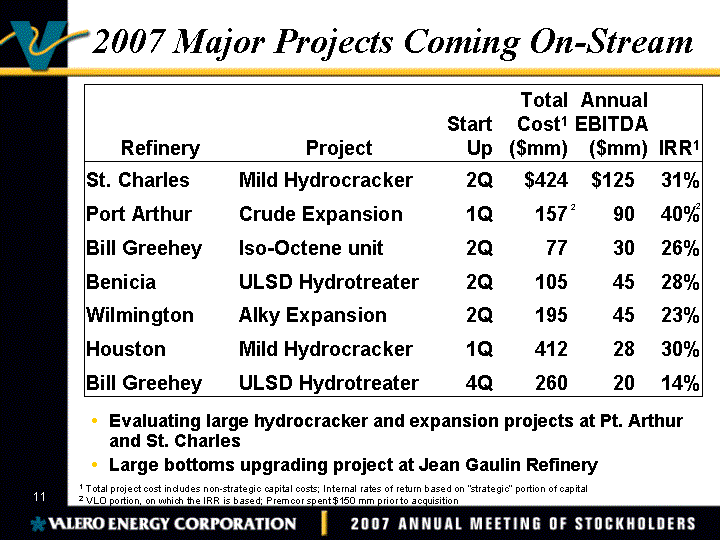
| 2007 Major Projects Coming On-Stream Refinery Project Start Up Total Cost1 ($mm) Annual EBITDA ($mm) IRR1 St. Charles Mild Hydrocracker 2Q $424 $125 31% Port Arthur Crude Expansion 1Q 157 90 40% Bill Greehey Iso-Octene unit 2Q 77 30 26% Benicia ULSD Hydrotreater 2Q 105 45 28% Wilmington Alky Expansion 2Q 195 45 23% Houston Mild Hydrocracker 1Q 412 28 30% Bill Greehey ULSD Hydrotreater 4Q 260 20 14% 1 Total project cost includes non-strategic capital costs; Internal rates of return based on "strategic" portion of capital 2 VLO portion, on which the IRR is based; Premcor spent $150 mm prior to acquisition 2 2 Evaluating large hydrocracker and expansion projects at Pt. Arthur and St. Charles Large bottoms upgrading project at Jean Gaulin Refinery |
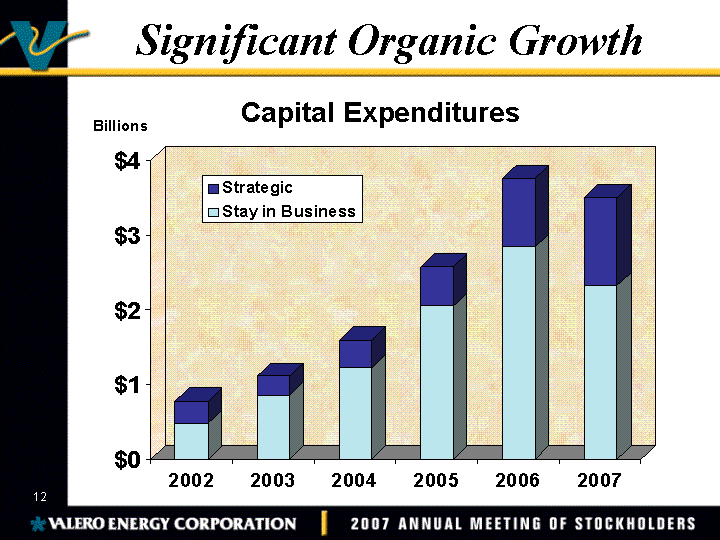
| Significant Organic Growth 2002 2003 2004 2005 2006 2007 Stay in Business 480 855 1220 2044 2836 2320 Strategic 299 257 376 530 920 1180 Capital Expenditures |

| Balanced Approach to Investing Cash Increased dividend twice in 2006 and by 50% already in 2007 Paying off callable and maturing higher coupon debt $465 million in 2007 Sticking to $3.5 billion Capex budget for 2007 Board approved additional $4 billion share repurchase authorization - total of $6 billion authorized Thruput Capacity 1/1/2003 0.2 12/31/2004 0.22 12/31/2005 0.189 12/31/2006 0.403 1Q07 0.9 VLO Earnings Payout Ratio (Dividends + Buybacks)/Earnings $3 billion to be purchased under accelerated share repurchase program funded with debt With $1 billion of stock purchased YTD, leaves $2 billion for additional purchases this year (authorized) 25 |
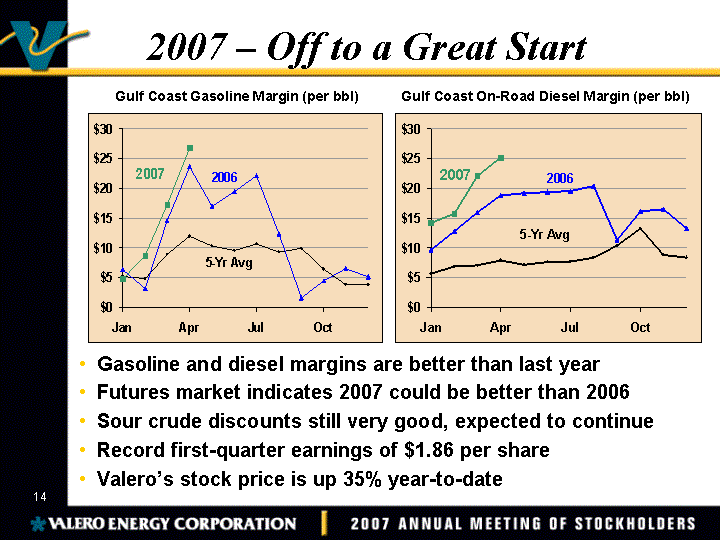
| 2007 - Off to a Great Start 5-Yr Avg 2007 2006 High Low 1/1/2007 5.15 4.69 6.33 7.12 2.87 2/1/2007 4.82 8.7 3.11 8.42 1.98 3/1/2007 8.88 17.21 14.55 14.55 5.64 4/1/2007 11.9 26.73 23.6 23.6 5.77 5/1/2007 10.26 16.97 16.97 4.1 6/1/2007 9.56 19.4 19.4 4.09 7/1/2007 10.63 22.14 22.14 4.83 8/1/2007 9.25 12.29 16.54 3.22 9/1/2007 9.89 1.58 32.95 1.58 10/1/2007 6.43 4.45 13.52 3.45 11/1/2007 3.79 6.49 6.49 2.54 12/1/2007 3.78 5.06 6.42 0.45 5-Yr Avg 2007 2006 High Low 1/1/2007 5.63 14.21 9.62 9.62 1.91 2/1/2007 6.86 15.72 12.76 12.76 1.7 3/1/2007 7.07 22.08 15.9 15.9 2.09 4/1/2007 7.84 25.22 18.8 18.8 1.73 5/1/2007 7.14 19.18 19.18 0.4 6/1/2007 7.56 19.37 19.37 0.86 7/1/2007 7.71 19.55 19.55 1.07 8/1/2007 8.35 20.39 20.39 1.47 9/1/2007 10.38 11.28 25.68 2.55 10/1/2007 13.21 16.09 32.71 3.72 11/1/2007 8.77 16.48 16.48 3.19 12/1/2007 8.29 13.2 13.2 3.53 Gulf Coast Gasoline Margin (per bbl) Gulf Coast On-Road Diesel Margin (per bbl) Gasoline and diesel margins are better than last year Futures market indicates 2007 could be better than 2006 Sour crude discounts still very good, expected to continue Record first-quarter earnings of $1.86 per share Valero's stock price is up 35% year-to-date 27 |
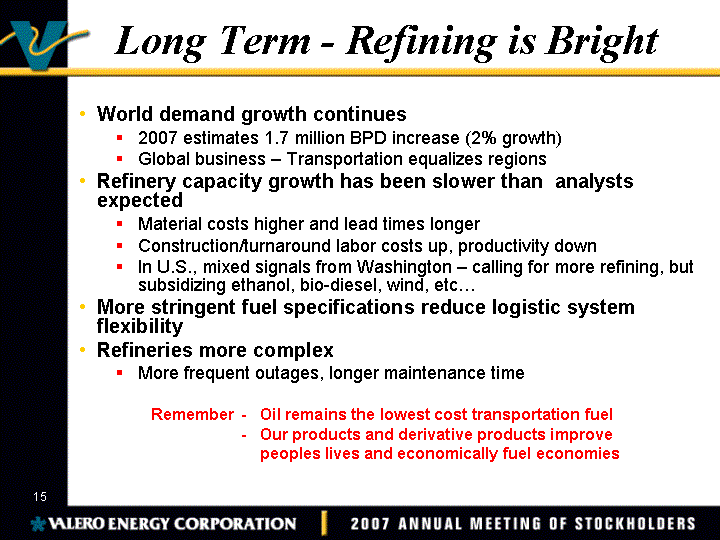
| Long Term - Refining is Bright World demand growth continues 2007 estimates 1.7 million BPD increase (2% growth) Global business - Transportation equalizes regions Refinery capacity growth has been slower than analysts expected Material costs higher and lead times longer Construction/turnaround labor costs up, productivity down In U.S., mixed signals from Washington - calling for more refining, but subsidizing ethanol, bio-diesel, wind, etc... More stringent fuel specifications reduce logistic system flexibility Refineries more complex More frequent outages, longer maintenance time Remember - Oil remains the lowest cost transportation fuel - Our products and derivative products improve peoples lives and economically fuel economies 29 |
| Valero and its Employees - World-Class Competitors in a Rapidly Changing World We will achieve: Meaningful bottom-line growth Improved operating and financial performance Valero is the best value in refining We will continue to look for acquisitions - but selectively We know you, our shareholders, own Valero and we must deliver you excellent financial results We are focused on creating long-term, sustainable shareholder value Your investment is operated, maintained, and managed by terrific, hard-working and dedicated employees that are committed to Valero's success. 31 |
| Safe Harbor Statement Statements contained in this presentation that state the company's or management's expectations or predictions of the future are forward- looking statements intended to be covered by the safe harbor provisions of the Securities Act of 1933 and the Securities Exchange Act of 1934. The words "believe," "expect," "should," "estimates," and other similar expressions identify forward-looking statements. It is important to note that actual results could differ materially from those projected in such forward-looking statements. For more information concerning factors that could cause actual results to differ from those expressed or forecasted, see Valero's annual reports on Form 10 K and quarterly reports on Form 10 Q, filed with the Securities and Exchange Commission and on Valero's website at www.valero.com |