Exhibit 99.1

| European Investor Presentation June 25-28, 2007 |

| Greg King President Rich Marcogliese EVP - Refining Operations Mike Ciskowski EVP - Chief Financial Officer Eric Fisher VP - Investor and Corporate Communications Introduction |
| 2007 Refining Margins Stronger Than Last Year 5-Yr Avg 2007 2006 High Low 1/1/2007 5.15 4.69 6.33 7.12 2.87 2/1/2007 4.82 8.7 3.11 8.42 1.98 3/1/2007 8.88 17.21 14.55 14.55 5.64 4/1/2007 11.9 27.8 23.6 23.6 5.77 5/1/2007 10.26 34.77 16.97 16.97 4.1 6/1/2007 9.56 25.18 19.4 19.4 4.09 7/1/2007 10.63 22.14 22.14 4.83 8/1/2007 9.25 12.29 16.54 3.22 9/1/2007 9.89 1.58 32.95 1.58 10/1/2007 6.43 4.45 13.52 3.45 11/1/2007 3.79 6.49 6.49 2.54 12/1/2007 3.78 5.06 6.42 0.45 YTD Gulf Coast gasoline margins 30% higher than YTD 2006 YTD Gulf Coast diesel margins 15% higher than YTD 2006 Forward curve shows 2007 Gulf Coast 3-2-1 crack spread 50% higher than 2006 2007 = $16.10 per barrel 2006 = $10.60 per barrel Gulf Coast Gasoline Margin (per bbl) Source: Platts conventional unleaded 87; 2007 data through June 20 Source: Platts; 2007 data through June 20 = ULSD; Prior years data = LSD 5-Yr Avg 2007 2006 High Low 1/1/2007 5.63 14.21 9.62 9.62 1.91 2/1/2007 6.86 15.72 12.76 12.76 1.7 3/1/2007 7.07 21.86 15.9 15.9 2.09 4/1/2007 7.84 24.01 18.8 18.8 1.73 5/1/2007 7.14 22.4 19.18 19.18 0.4 6/1/2007 7.56 20.77 19.37 19.37 0.86 7/1/2007 7.71 19.55 19.55 1.07 8/1/2007 8.35 20.39 20.39 1.47 9/1/2007 10.38 11.28 25.68 2.55 10/1/2007 13.21 16.09 32.71 3.72 11/1/2007 8.77 16.48 16.48 3.19 12/1/2007 8.29 13.2 13.2 3.53 Gulf Coast Diesel Margin (per bbl) |

| Gasoline Fundamentals Bullish Factors Continue 5-Yr Avg 2007 2006 High Low 1/6/2006 23.78 22.95 22.64 24.78 22.64 1/13/2006 24.29 23.6 23.25 25.17 23.25 1/20/2006 24.53 24.19 23.87 25.52 23.87 1/27/2006 24.87 24.71 24.67 26.36 24.26 2/3/2006 25 25.04 25.14 26.38 23.97 2/10/2006 25.14 24.8 25.22 26.7 23.83 2/17/2006 24.96 24.4 25.09 26.33 23.47 2/24/2006 24.74 24.121 25.06 25.77 23.01 3/3/2006 24.21 23.7 24.88 25.19 22.61 3/10/2006 23.93 23.3 24.77 24.77 22.32 3/17/2006 23.6 22.9 24.47 24.47 22.29 3/24/2006 23.47 22.8 23.82 24.1 22.6 3/31/2006 23.53 22.1 23.32 24.88 22.33 4/7/2006 23.28 21.33 22.78 24.59 21.86 4/14/2006 23.06 21.04 22.18 24.33 21.94 4/21/2006 23.01 20.79 22 24.22 21.73 4/28/2006 23.22 20.8 22.21 24.16 22.21 5/5/2006 23.31 20.9 22.44 24.65 22.18 5/12/2006 23.4 21 22.44 25.22 22.22 5/19/2006 23.12 21 22.56 24.73 22.2 5/26/2006 23.2 21 22.44 24.97 22.14 6/2/2006 23.29 21.3 22.55 24.53 22.55 6/9/2006 23.17 21.3 22.79 24.05 22.46 6/16/2006 23.26 21.4 22.68 24.43 22.34 6/23/2006 23.07 22.5 24.52 22.38 6/30/2006 22.86 22.41 24.25 22.28 7/7/2006 22.84 22.25 24.06 22.2 7/14/2006 22.77 22.33 23.75 22.31 7/21/2006 22.48 21.98 23.48 21.98 7/28/2006 22.38 21.96 23.42 21.69 8/4/2006 22.02 21.59 23.33 21.17 8/11/2006 21.56 21.37 22.66 20.9 8/18/2006 21.38 21.42 22.81 20.3 8/25/2006 21.38 21.47 22.55 20.35 9/1/2006 21.37 21.59 22.49 20.38 9/8/2006 21.67 21.69 22.79 21.01 9/15/2006 21.95 21.95 22.75 21.61 9/22/2006 22.56 22.81 23.34 21.72 9/29/2006 22.69 23.27 23.85 21.99 10/6/2006 22.53 23.39 23.46 21.5 10/13/2006 22.33 22.78 22.78 21.91 10/20/2006 22.04 22.34 22.42 21.23 10/27/2006 21.79 21.8 22.44 20.88 11/3/2006 21.7 21.73 22.21 21.09 11/10/2006 21.61 21.43 22.13 20.8 11/17/2006 21.81 21.79 22.26 21.36 11/24/2006 22.08 21.83 22.46 21.78 12/1/2006 22.35 21.59 22.84 21.59 12/8/2006 22.54 21.41 23.3 21.41 12/15/2006 22.44 21.33 23.08 21.33 12/22/2006 22.53 21.69 23.09 21.69 12/29/2006 22.78 22.43 23.24 21.96 Gasoline Days of Supply Source: DOE; 2007 data through June 15 5-Yr Avg 2007 2006 1/6/2006 0.906621279 0.910287503 0.891526784 1/13/2006 0.90526036 0.903356011 0.887761854 1/20/2006 0.901387651 0.894484291 0.881195633 1/27/2006 0.891947231 0.88453469 0.873985638 2/3/2006 0.880584885 0.8742743 0.863900403 2/10/2006 0.875488532 0.871075483 0.862791173 2/17/2006 0.874280736 0.865664254 0.863812832 2/24/2006 0.873618048 0.862954314 0.859317532 3/3/2006 0.873380879 0.859181034 0.852192619 3/10/2006 0.873024388 0.856566092 0.85119806 3/17/2006 0.872669703 0.859367816 0.851385858 3/24/2006 0.875683545 0.861939655 0.855952242 3/31/2006 0.883500836 0.864928161 0.86344145 4/7/2006 0.889050376 0.871859144 0.863205593 4/14/2006 0.894333561 0.882035505 0.86198688 4/21/2006 0.900271008 0.883999797 0.864782232 4/28/2006 0.904307342 0.887052421 0.871877704 5/5/2006 0.910862987 0.889 0.883498769 5/12/2006 0.919601677 0.886 0.8924517 5/19/2006 0.925136782 0.895 0.896256049 5/26/2006 0.931358009 0.902 0.902901979 6/2/2006 0.935541136 0.903 0.904746381 6/9/2006 0.938812738 0.9025 0.912043526 6/16/2006 0.942666716 0.89375 0.921124643 6/23/2006 0.944361667 0.927000058 6/30/2006 0.946404112 0.932351853 7/7/2006 0.945058807 0.926719566 7/14/2006 0.942763543 0.925773629 7/21/2006 0.940162471 0.922584819 7/28/2006 0.938338691 0.916891892 8/4/2006 0.935961034 0.919773124 8/11/2006 0.93418844 0.916127728 8/18/2006 0.935377791 0.916722358 8/25/2006 0.935378635 0.921974705 9/1/2006 0.933561248 0.926789307 9/8/2006 0.933426179 0.930698477 9/15/2006 0.932033659 0.932365622 9/22/2006 0.922285955 0.931115263 9/29/2006 0.902906401 0.922032193 10/6/2006 0.883712452 0.912452721 10/13/2006 0.862135541 0.894707909 10/20/2006 0.85319695 0.879176307 10/27/2006 0.862304323 0.876725129 11/3/2006 0.871706637 0.874036803 11/10/2006 0.883773467 0.876495112 11/17/2006 0.892551663 0.878637148 11/24/2006 0.8976121 0.876451984 12/1/2006 0.905510761 0.882274296 12/8/2006 0.911401701 0.886774008 12/15/2006 0.912587481 0.895816561 12/22/2006 0.912671089 0.902975848 12/29/2006 0.910722181 0.904427832 Operable Refinery CDU Utilization, 4-Week Avg Source: DOE; 2007 data through June 15 Refinery utilization has been relatively low given margins More stringent specifications More complicated refining operations Tightness in labor and equipment for maintenance activities, delays Unplanned outages Industry-wide emphasis on safety Demand at high levels YTD growth at 1.7% over 2006 Strong worldwide economies High global demand for gasoline and blending components YTD imports of gasoline and components down 8% over 2006 Days of supply far below historical levels |
| Distillate Fundamentals Strong Outlook for Distillate 5-Yr Avg 2007 2006 1/6/2006 4.0448 4.201 4.291 1/13/2006 3.92725 4.114 4.162 1/20/2006 3.9222 4.053 4.109 1/27/2006 3.998 4.151 4.146 2/3/2006 4.1893 4.319 4.194 2/10/2006 4.2806 4.502 4.217 2/17/2006 4.3103 4.659 4.244 2/24/2006 4.29455 4.701 4.266 3/3/2006 4.2246 4.663 4.299 3/10/2006 4.1961 4.605 4.352 3/17/2006 4.1433 4.537 4.281 3/24/2006 4.08185 4.446 4.237 3/31/2006 4.0464 4.394 4.158 4/7/2006 4.0547 4.352 4.116 4/14/2006 4.00235 4.343 4.095 4/21/2006 3.9889 4.321 4.051 4/28/2006 3.9828 4.321 4.084 5/5/2006 3.9366 4.278 4.066 5/12/2006 3.9396 4.194 4.099 5/19/2006 3.90025 4.169 4.109 5/26/2006 3.9087 4.181 4.102 6/2/2006 3.88795 4.168 4.056 6/9/2006 3.87415 4.165 4.045 6/16/2006 3.908 4.146 4.081 6/23/2006 3.88725 4.069 6/30/2006 3.92 4.095 7/7/2006 3.91805 4.121 7/14/2006 3.8654 4.139 7/21/2006 3.8466 4.154 7/28/2006 3.8038 4.142 8/4/2006 3.79835 4.102 8/11/2006 3.83385 4.039 8/18/2006 3.83725 4.027 8/25/2006 3.88545 4.068 9/1/2006 3.89725 4.103 9/8/2006 3.8731 4.139 9/15/2006 3.8644 4.147 9/22/2006 3.84645 4.123 9/29/2006 3.83855 4.136 10/6/2006 3.91445 4.205 10/13/2006 3.9623 4.302 10/20/2006 3.9704 4.337 10/27/2006 4.04195 4.429 11/3/2006 4.0805 4.44 11/10/2006 4.09285 4.459 11/17/2006 4.124 4.442 11/24/2006 4.1317 4.353 12/1/2006 4.0936 4.331 12/8/2006 4.0852 4.255 12/15/2006 4.14485 4.284 12/22/2006 4.1758 4.313 12/29/2006 4.1908 4.281 Record demand YTD total distillates growth 4.2%, YTD diesel (LSD + ULSD) growth 11.4% Key growth drivers Good economy, weather, and ULSD's lower miles per gallon Days of supply below last year and 5-year average Off-road diesel sulfur spec fell from 2,000 to 500 ppm on 6/1/07 Shifts off-road diesel demand to on-road (ULSD + LSD) market Distillate Demand, 4-Week Avg (mmbpd) Source: DOE; 2007 data through June 15 5-Yr Avg 2007 2006 High Low 1/6/2006 32.99844861 33.6 31.2 30.91 24.84 1/13/2006 34.3442117 34.5 32.4 31.3 25.85 1/20/2006 33.88183987 35.2 33.2 32.57 26.27 1/27/2006 32.54684752 33.7 32.9 31.42 25.43 2/3/2006 30.00133404 31.6 32.4 31.55 23.34 2/10/2006 28.9515541 29.6 32.5 31.99 22.46 2/17/2006 28.16730824 27.5 31.9 31 22.51 2/24/2006 27.5940533 26.5 31.4 30.96 22.19 3/3/2006 27.5858214 26.4 30.6 30.77 22.15 3/10/2006 27.46915436 26.2 29.3 27.87 21.95 3/17/2006 27.45594073 26.2 29.6 28.68 23.23 3/24/2006 27.57736341 26.5 29.3 28.5 21.53 3/31/2006 27.44195988 26.8 29.2 26.94 22.03 4/7/2006 26.95618034 27.1 28.5 28.72 22.26 4/14/2006 26.97869851 27 28 27.53 21.62 4/21/2006 27.08064931 27.2 28.5 26.7 20.87 4/28/2006 27.12082532 27.1 28 27.4 20.74 5/5/2006 27.72693215 27.8 28.2 25.47 21.35 5/12/2006 27.90153179 28.6 28 26.54 21.17 5/19/2006 28.72643751 28.8 28.5 27 21.3 5/26/2006 28.74921709 28.8 29 26.78 21.93 6/2/2006 29.41778758 29.3 29.7 29.54 22.33 6/9/2006 30.01640314 29.4 30.4 29.08 22.53 6/16/2006 30.09420203 29.6 30.5 27.88 22.35 6/23/2006 30.37129969 31 27.45 21.52 6/30/2006 30.34236841 31.1 26.17 22.13 7/7/2006 30.92943955 31.5 27.78 23.07 7/14/2006 32.07973208 31.7 28.79 23.18 7/21/2006 32.55673171 31.8 28.58 22.98 7/28/2006 33.30271056 32 29.65 22.74 8/4/2006 33.70971804 32.3 28.45 22.17 8/11/2006 33.5127002 33 27.62 23.5 8/18/2006 33.81514399 33.6 27.63 23.68 8/25/2006 33.53111959 33.6 26.72 23.75 9/1/2006 33.64418056 34.1 28.1 23.81 9/8/2006 34.48784483 34.9 28.92 24.34 9/15/2006 34.91156173 35.9 27.54 23.91 9/22/2006 34.98889305 36.7 26.52 24.24 9/29/2006 34.73454142 36.6 26.37 23.23 10/6/2006 33.53747006 35.7 26.72 22.69 10/13/2006 32.52134524 33.8 26.93 22.5 10/20/2006 32.41203313 33.2 26.63 21.23 10/27/2006 31.61012329 31.9 26.21 20.96 11/3/2006 30.97277122 31.2 25.72 21.35 11/10/2006 30.70738637 30.3 24.31 20.28 11/17/2006 30.34237053 30.1 24.78 19.91 11/24/2006 30.24097224 30.5 25.74 20.51 12/1/2006 30.88607785 30.6 26.39 21.41 12/8/2006 31.2191554 31 28.33 22.53 12/15/2006 30.70151738 31.1 26.89 22.84 12/22/2006 30.38399013 31 27.59 22.89 12/29/2006 30.55365034 31.7 29.82 23.07 Distillate Days of Supply Source: DOE; 2007 data through June 15 |
| Feedstock Differentials Remain Wide Worldwide crude supply mix expected to be stable going forward Heavy sours hold steady Near-term significant new production is light sweet crude Demand for light sweet crude growing rapidly to meet worldwide clean fuels requirements 2005 2010 Light Sweet 0.34 0.34 Light/ Medium Sour 0.51 0.5 Heavy Sour 0.13 0.13 High TAN 0.02 0.03 Stable World Crude Supply Mix - 2005 vs. 2010 Source: Industry reports Feedstock differentials expected to remain wide Oversupply of crude oil in WTI pricing hub of Cushing, OK depressing WTI relative to similar grades like Light Louisiana Sweet (LLS) Due to recent Mid-Continent refinery outages and greater supply of Canadian crude oils WTI - Maya WTI - Mars LLS - Mars 2002 5.74 2.15 2.52 2002 5.96 1.96 2.36 2002 5.75 2.06 2.47 2002 4.22 1.63 2.07 2002 4.64 2.74 2.2 2002 4.1 2.02 2.17 2002 4.39 1.9 1.96 2002 5.38 2.93 2.54 2002 5.25 2.52 2.41 2002 4.58 2.78 3.01 2002 6.32 4.42 4.37 2002 6.93 2.82 3.4 2003 5.41 3.27 3.85 2003 8.22 5.19 5.28 2003 9.15 3.69 6.02 2003 7.7 3.94 3.6 2003 6.68 2.26 2.35 2003 7.36 3.57 3.18 2003 5.62 3.22 2.95 2003 5.96 3.1 3.04 2003 5.97 3.36 3.66 2003 6.26 3.11 3.64 2003 6.85 3.51 3.58 2003 7.66 2.82 3.26 2004 8.54 4.06 5.74 2004 10.01 5.6 6.48 2004 9.49 4.6 5.76 2004 9.21 5.55 5.77 2004 8.54 4.31 4.47 2004 8.28 4.76 4.49 2004 10.68 4.99 5.48 2004 11.99 6.21 6.98 2004 13.71 7 7.85 2004 14.67 10.44 11.51 2004 16.63 8.89 8.51 2004 15.22 7.67 7.12 2005 16.93 7.18 6.8 2005 17.09 6.61 5.73 2005 17.82 7.21 6.58 2005 14.84 6.56 5.42 2005 11.24 5.11 4.18 2005 14.26 5.15 4.31 2005 14.47 5.46 4.62 2005 17.38 7.24 7.04 2005 15.23 5.63 6.95 2005 15.48 6.87 7.48 2005 16.56 6.83 6.2 2005 17.51 7.61 7 2006 18.08 7.08 6.81 2006 15.01 8.18 7.31 2006 14.28 7.86 7.59 2006 14.27 5.87 6.12 2006 15.56 7.04 7.24 2006 17.28 7.16 7.1 2006 16.45 6.67 7.17 2006 13.54 7.69 8.27 2006 12.56 8.14 7.06 2006 12.34 7.01 5.61 2006 13.08 6.05 6.36 2006 13.97 6.74 8.08 2007 12.68 5.96 7.24 2007 12.89 5.77 7.06 2007 12.75 3.02 4.92 2007 11.15 1.86 5 2007 9.05 3.25 7.21 2007 8.3 2.94 7.64 Sour Crude Differentials (per bbl) Source: Platts; 2007 data through June 20 |
| Industry Trends Support Strong Margins Industry margins to stay higher for longer Result World oil demand growth continues 2007 estimates 1.6 million barrels per day increase (1.9% growth) Industry refinery expansions and new construction costing much more and taking much longer Since 2004, prices of steel up 74% and heavy-wall reactors up 133% and lead times longer (heavy-wall reactors 36+ months) Gulf Coast skilled labor costs up 60%, but productivity down 35% from 2004 Refineries more complex and units more interdependent than ever Results in longer turnarounds and maintenance periods Downtime at one unit impacts refinery-wide throughput More stringent regulations reduce system flexibility tremendously Product specifications and regulations more difficult to meet Reduced ability to blend off-spec products |
| Valero's Strategic Focus Has Shifted GOAL - Become a better positioned, better performing, and more valuable company for the long-term Aggressive acquisition strategy was the right call over the past decade Acquisition market has changed Asset values have risen relative to our valuation and replacement cost Bargains are gone Now time to focus on Bottom-line growth in EPS and cash flow per share Substantial opportunities to improve operations (Solomon rankings) Strategic projects for organic growth Returning cash to shareholders |
| Valero's Key Initiatives Evaluating all capital projects in light of higher costs and changing markets Removing or deferring some strategic projects Focusing on value-added, organic growth projects at flagship and niche refineries Targeting at least $1 billion in annual operating income improvements over next 5 years Energy, reliability, other operating costs Higher performance expectations and more accountability across all lines of business Restructuring retail business, centralizing services like refinery accounting and procurement Selective portfolio optimization Some assets in our portfolio more strategic and valuable to others Executed agreement, subject to regulatory approval, to sell Lima, OH refinery to Husky Energy for $1.9 billion plus working capital - expect to close by July 1 Balanced approach to allocating cash |
| Balanced Approach to Investing Cash Capital expenditures - maintaining $3.5 billion budget for 2007 Dividends - increased twice in 2006 and by 50% already in 2007 Goal is to pay dividends in-line with peer group Stock buybacks Board approved additional $4 billion share repurchase authorization - total of $6 billion authorized plus anti-dilution $1 billion purchased through April $3 billion purchased under accelerated share repurchase (ASR) program Remaining $2 billion to be used for additional buybacks in 2007 Continue purchases under anti-dilution program By year-end 2007, estimate 85-90 million (14%-15%) net share reduction Debt Paying off callable higher coupon and maturing debt - $465 million in 2007 Targeting net book debt-to-cap ratio around 25% Issued $2.25 billion of long-term notes and used cash on hand to repay $3 billion bridge loan for ASR Intend to maintain investment grade rating |
| Capital Expenditures Details 2006 2007E Regulatory 585 410 Turnarounds 570 425 Sustaining/Other 685 1100 Tier II 990 385 Strategic 920 1180 Strategic Tier II Sustaining/ Other Turnarounds Regulatory $3,750 $3,500 millions Regulatory and Tier II capital spending drops by $780 million from 2006 actual to 2007 budget |
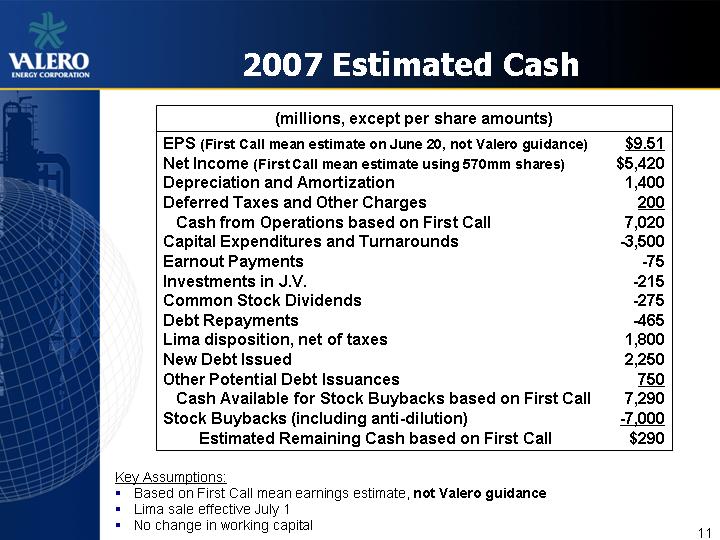
| 2007 Estimated Cash Flow Model (millions, except per share amounts) (millions, except per share amounts) EPS (First Call mean estimate on June 20, not Valero guidance) Net Income (First Call mean estimate using 570mm shares) Depreciation and Amortization Deferred Taxes and Other Charges Cash Flow from Operations Capital Expenditures and Turnarounds Earnout Payments Investments in J.V. Common Stock Dividends Debt Repayments Lima disposition, net of taxes New Debt Issued Other Potential Debt Issuances Cash Flow Available for Stock Buybacks Stock Buybacks (including anti-dilution) Remaining Cash Flow $9.51 $5,420 1,400 200 7,020 - -3,500 - -75 - -215 - -275 - -465 1,800 2,250 750 7,290 - -7,000 $290 Key Assumptions: Based on First Call mean earnings estimate, not Valero guidance Lima sale effective July 1 No change in working capital |
| Reducing Share Count, Increasing Leverage to Refining Margins Diluted Shares Outstanding EPS Sensitivity to $1/bbl Change in Throughput Margins EPS Sensitivity to $1/bbl Change in Refining Margins Shares Repurchased 4Q05 654.1 1.14 1.18 7.3 1Q06 644.3 1.08 1.21 10.7 2Q06 635.8 1.16 1.24 9.7 3Q06 627.8 1.14 1.25 10.5 4Q06 619.6 1.18 1.27 3.8 1Q07 615.3 1.15 1.29 15.6 2Q07E 578 1.22 1.3 46.5 3Q07E 555 1.29 Diluted shares outstanding EPS Sensitivity $1/bbl in Throughput Margins |
| Valero's Commitment to Safety and the Environment Continued commitment to OSHA's Voluntary Protection Program (VPP) VPP is a recognized OSHA program for excellence in safety Valero has 11 of only 23 VPP Star Sites in the U.S. New Process Safety Management (PSM) initiative underway Created VP position in Operations to focus efforts on safety Achieve best-in-class PSM at all our facilities Valero has spent $4.3 billion on environmental initiatives in the past five years Will spend $0.5 billion more to finish Tier II gasoline and ULSD efforts Since 2001, our fluid catalytic cracker and coker throughputs are up 12%, but NOX emissions from those units reduced by 70% Certified Pre-certification Re-certified Valero's VPP Schedule |
| Valero's Advantages Aruba Throughput capacities in thousand barrels per day; Excludes 165,000 bpd Lima, OH refinery 17 Refineries Across Four Key Regions High-complexity system and leader in conversion capacity Enables us to convert more low- quality, discounted feedstocks into high-quality products Refining system designed for feedstock flexibility Increased variety of heavy sour and resid feedstocks from 27 in 2002 to 40 in 2006 Source: Company reports; VLO figures exclude Lima, OH refinery Gulf Coast 1,720 West Coast 305 Mid-Con 455 Northeast 620 Total 3,100 3.1 million barrels per day of throughput capacity Scale helps mitigate effect of specific outages Geographically diverse Valero participates in four key regions Optimization among regional refining systems Coking Hydrocracking Cat Cracking VLO 392.3 286 922 XOM 395 158 823 COP 313 133 732 RDS 276 230 506 BP 217 231 473 CVX 173 212 264 MRO 61 28 384 TSO 94 94 196 SUN 8.5 28 322 Conversion Capacity (mbpd) |
| Operations Improvements Energy efficiency 1st quartile performance ^ $360mm operating income improvement Examples: new FCCU power recovery turbines at St. Charles, hydrogen plant at Benicia, and multi-site heater efficiency Mechanical availability (reliability) 1% improvement ^ $240mm operating income improvement Examples: Port Arthur coke drum replacement and Aruba utility upgrades Non-energy operating costs 1st quartile performance ^ $400mm operating income improvement Examples: refinery accounting and procurement centralization, planning and scheduling efficiencies at Delaware City $1 billion in operating income improvements in 5 years Goal |
| 2007 Major Strategic Projects Continuing to invest in meaningful organic growth projects Sour-up and product upgrading opportunities Completed Port Arthur crude expansion, Houston and St. Charles mild hydrocrackers in 2007 Evaluating large hydrocracker and expansion projects at St. Charles and Port Arthur focused on diesel production Refinery Project Start Up Total Cost1 ($mm) Est. Annual EBITDA ($mm) IRR1 Port Arthur Crude Expansion 1Q $157 $95 40% Houston Mild Hydrocracker 2Q 412 28 30% Corpus Christi Iso-Octene unit 2Q 77 30 26% St. Charles Mild Hydrocracker 3Q 424 125 31% Benicia ULSD Hydrotreater 3Q 105 45 28% Wilmington Alky Expansion 4Q 195 45 23% Corpus Christi ULSD Hydrotreater 4Q 260 20 14% 2 2 1 Total project cost includes non-strategic capital costs. Internal rates of return based on strategic portion of capital only. 2 VLO portion, on which the IRR is based. Premcor spent $150 million prior to acquisition. |
| Valero - Best Value in Refining Compelling fundamentals driving strong industry margins Expect strong margin environment through end of decade Improving returns, growing EPS and cash flow per share through Operating improvements Organic growth projects Stock buybacks Acquisitions that meet our criteria Doing what we said we'd do - Executing to create long-term, sustainable shareholder value GOAL - Become a better positioned, better performing, and more valuable company for the long-term |
| Appendix |
| Map of Valero Refineries Valero Marketing Presence Quebec, Canada 215,000 bpd capacity Three Rivers, Texas 100,000 bpd capacity Corpus Christi, Texas 340,000 bpd capacity Wilmington, California 135,000 bpd capacity Benicia, California 170,000 bpd capacity McKee, Texas 170,000 bpd capacity Krotz Springs, Louisiana 85,000 bpd capacity Texas City, Texas 245,000 bpd capacity Houston, Texas 130,000 bpd capacity Port Arthur, Texas 325,000 bpd capacity St. Charles, Louisiana 250,000 bpd capacity Ardmore, Oklahoma 90,000 bpd capacity Memphis, Tennessee 195,000 bpd capacity Paulsboro, New Jersey 195,000 bpd capacity San Nicholas, Aruba 275,000 bpd capacity Delaware City, Delaware 210,000 bpd capacity Capacity shown in terms of crude and feedstock throughput Lima, Ohio 165,000 bpd capacity Transaction pending |
| Safe Harbor Statement Statements contained in this presentation that state the Company's or management's expectations or predictions of the future are forward-looking statements intended to be covered by the safe harbor provisions of the Securities Act of 1933 and the Securities Exchange Act of 1934. The words "believe," "expect," "should," "estimates," and other similar expressions identify forward-looking statements. It is important to note that actual results could differ materially from those projected in such forward- looking statements. For more information concerning factors that could cause actual results to differ from those expressed or forecasted, see Valero's annual reports on Form 10^K and quarterly reports on Form 10^Q, filed with the Securities and Exchange Commission, and available on Valero's website at www.valero.com. |