Exhibit 99.1

| Lehman Brothers Energy/Power ConferenceSeptember 5, 2007 |
| Bill Klesse |
| Chairman and CEO |
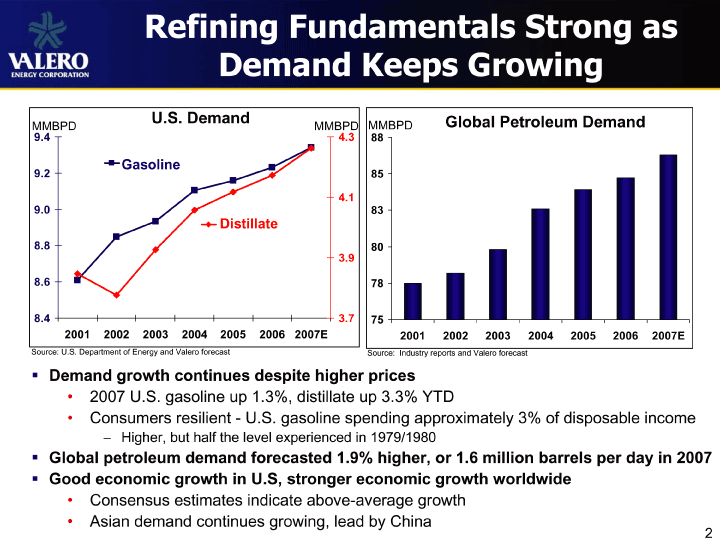
| Refining Fundamentals Strong as Demand Keeps Growing |
| U.S. Demand Global Petroleum Demand |
| MMBPD MMBPD MMBPD9.4 4.3 88 Gasoline 9.2 85 |
| 4.1 9.0 83 |
| Distillate |
| 8.8 80 3.9 |
| 8.6 78 8.4 3.7 75 |
| 2001 2002 2003 2004 2005 2006 2007E 2001 2002 2003 2004 2005 2006 2007E |
| Source: U.S. Department of Energy and Valero forecast Source: Industry reports and Valero forecast |
| Demand growth continues despite higher prices |
| · 2007 U.S. gasoline up 1.3%, distillate up 3.3% YTD |
| · Consumers resilient — U.S. gasoline spending approximately 3% of disposable income |
| Higher, but half the level experienced in 1979/1980 |
| Global petroleum demand forecasted 1.9% higher, or 1.6 million barrels per day in 2007Good economic growth in U.S, stronger economic growth worldwide |
| · Consensus estimates indicate above-average growth |
| · Asian demand continues growing, lead by China |
|
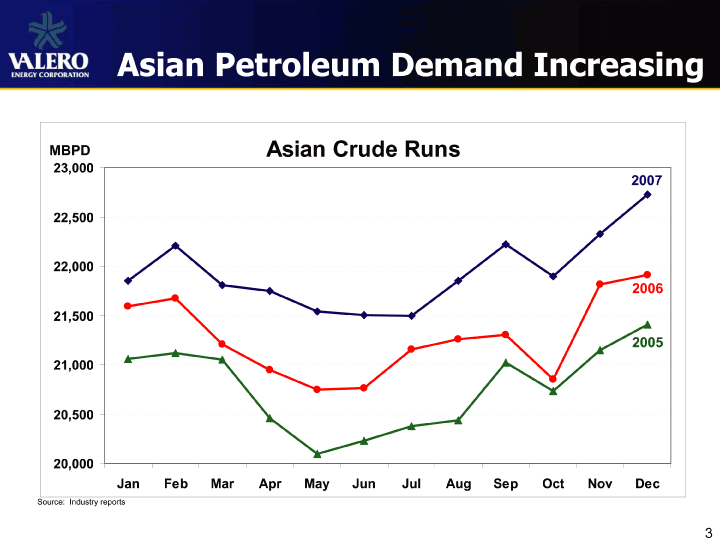
| Asian Petroleum Demand Increasing |
| MBPD Asian Crude Runs |
| 23,000 |
| 2007 |
| 22,500 22,000 |
| 2006 |
| 21,500 |
| 2005 |
| 21,000 20,500 20,000 Jan Feb Mar Apr May Jun Jul ; Aug Sep Oct Nov Dec |
| Source: Industry reports |
|
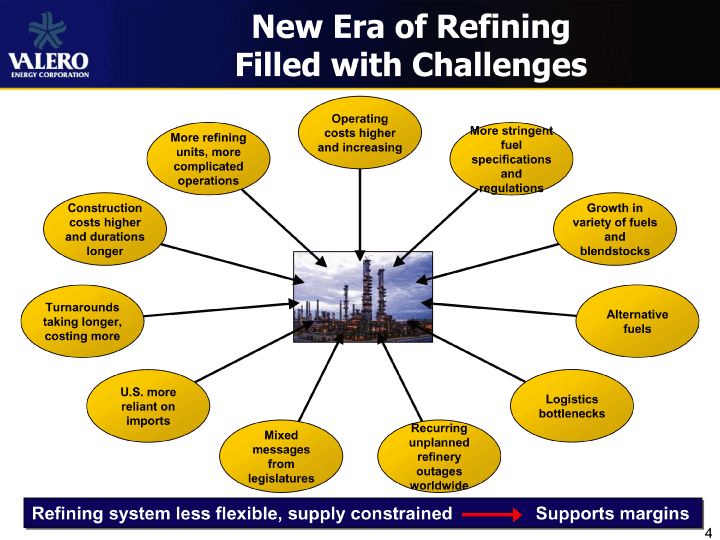
| New Era of Refining Filled with Challenges |
| Operating costs higher More stringent More refining and increasingfuel units, more specifications complicated and operations regulations Construction Growth in costs higher variety of fuels and durations and longer blendstocks |
| Turnarounds |
| Alternative taking longer, fuels costing more |
| U.S. more |
| Logistics reliant on bottlenecks imports Recurring Mixed unplanned messages refinery from outages legislatures worldwide |
| Refining system less flexible, supply constrained Supports margins |
|
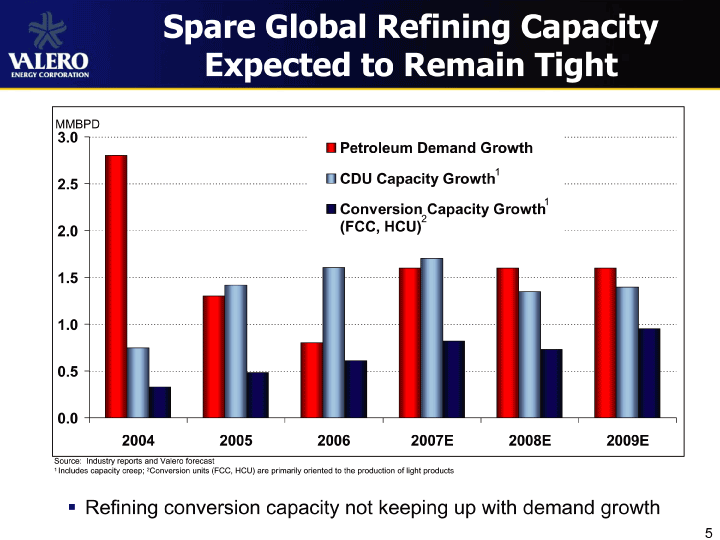
| Spare Global Refining Capacity Expected to Remain Tight |
| MMBPD |
| 3.0 |
| Petroleum Demand Growth CDU Capacity Growth 2.5 |
| Conversion Capacity Growth |
| 22.0 (FCC, HCU) 1.5 1.0 0.5 0.0 2004 2005 2006 2007E 2008E 2009E |
| Source: Industry reports and Valero forecast 1Includes capacity creep;2Conversion units (FCC, HCU) are primarily oriented to the production of light products |
| Refining conversion capacity not keeping up with demand growth |
|
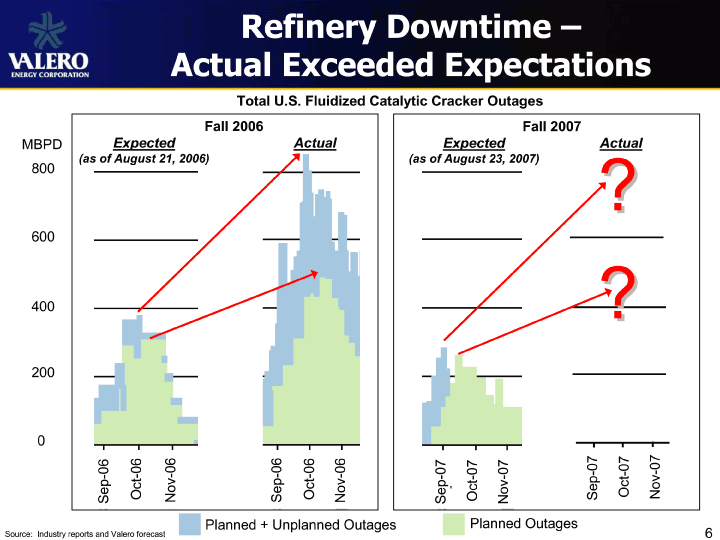
| Refinery Downtime – Actual Exceeded Expectations |
| Total U.S. Fluidized Catalytic Cracker Outages Fall 2006 Fall 2007 |
| MBPDExpected Actual Expected Actual (as of August 21, 2006) (as of August 23, 2007) |
| 800 600 |
| 400 200 0 Sep-06 Oct-06 Nov-06 Sep-06 Oct-06 Nov-06 Sep-07 Oct-07 Nov-07 Sep-07 Oct-07 Nov-07 Planned + Unplanned Outages Planned Outages Source: Industry reports and Valero forecast 6 |
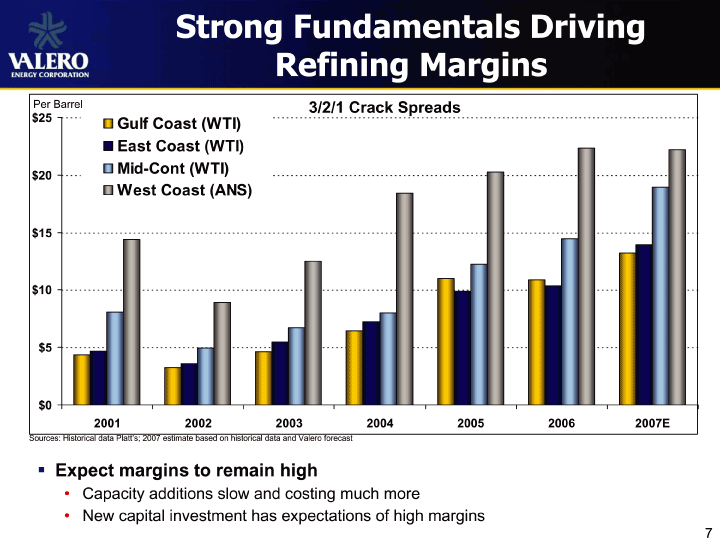
| Strong Fundamentals Driving Refining Margins |
| Per Barrel3/2/1 Crack Spreads |
| $25 Gulf Coast (WTI) East Coast (WTI) Mid-Cont (WTI) |
| $20 |
| West Coast (ANS) |
| $15 $10 $5 |
| $0 2001 2002 2003 2004 2005 2006 2007E |
| Sources: Historical data Platt’s; 2007 estimate based on historical data and Valero forecastExpect margins to remain high |
| · Capacity additions slow and costing much more |
| · New capital investment has expectations of high margins |
|
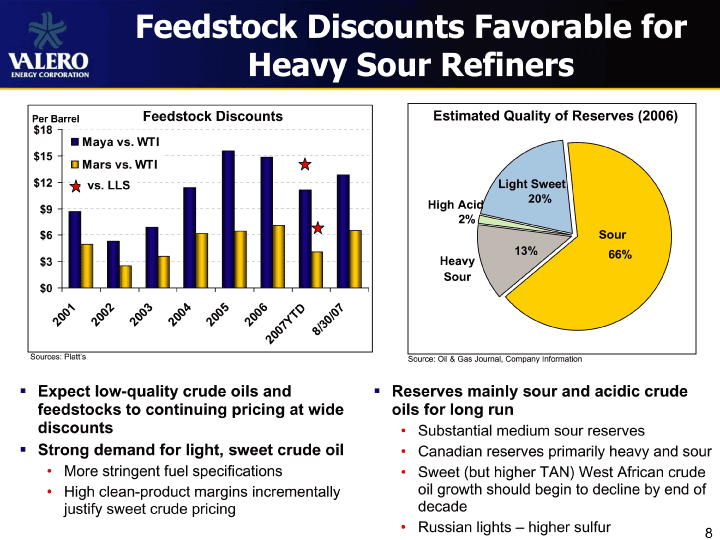
| Feedstock Discounts Favorable for Heavy Sour Refiners |
| Per Barrel Feedstock Discounts Estimated Quality of Reserves (2006) |
| $18 |
| Maya vs. WTI $15 |
| Mars vs. WTI $12 vs. LLS Light Sweet |
| 20% |
| $9 High Acid |
| 2% |
| $6 |
| Sour 13% 66% $3 Heavy Sour $001 720 2002 2003 2004 2005 20060/0 |
| 2007YTD 8/3 |
| Sources: Platt’s Source: Oil & Gas Journal, Company Information |
| Expect low-quality crude oils andReserves mainly sour and acidic crude feedstocks to continuing pricing at wide oils for long run discounts• Substantial medium sour reservesStrong demand for light, sweet crude oil• Canadian reserves primarily heavy and sour |
| · More stringent fuel specifications• Sweet (but higher TAN) West African crude |
| · High clean-product margins incrementally oil growth should begin to decline by end of justify sweet crude pricing decade |
| · Russian lights – higher sulfur |
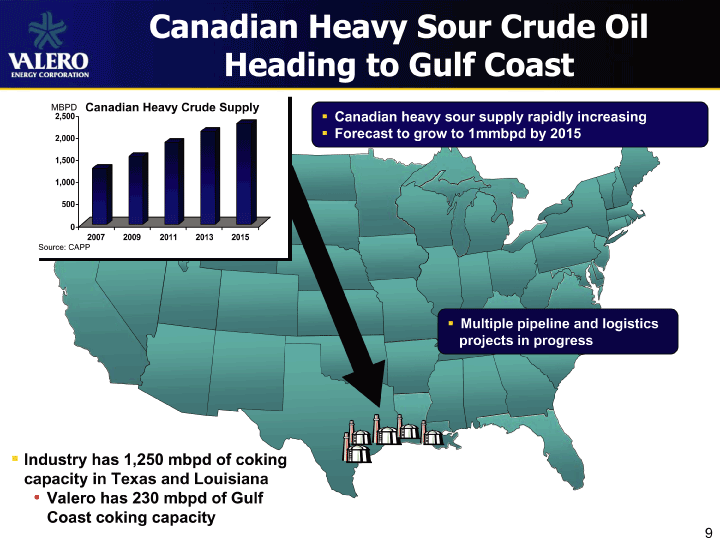
| Canadian Heavy Sour Crude Oil Heading to Gulf Coast |
| MBPDCanadian Heavy Crude Supply |
| 2,500Canadian heavy sour supply rapidly increasing 2,000Forecast to grow to 1mmbpd by 2015 |
| 1,500 1,000 500 |
| 0 |
| 2007 2009 2011 2013 2015 |
| Source: CAPP |
| Multiple pipeline and |
| logistics projects in progress |
| Industry has 1,250 mbpd of coking capacity in Texas and Louisiana |
| •Valero has 230 mbpd of Gulf Coast coking capacity |
|
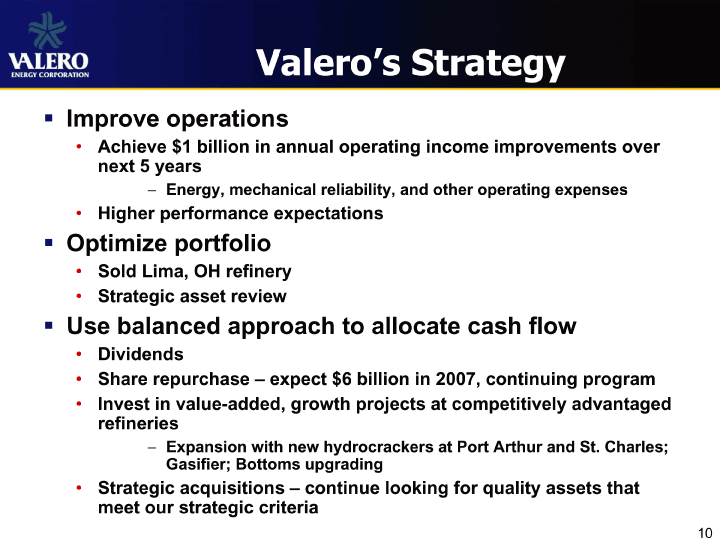
| Valero’s Strategy |
| Improve operations |
| •Achieve $1 billion in annual operating income improvements over next 5 years |
| Energy, mechanical reliability, and other operating expenses |
| •Higher performance expectations |
| Optimize portfolio |
| ·Sold Lima, OH refinery |
| ·Strategic asset review |
| Use balanced approach to allocate cash flow |
| •Dividends |
| ·Share repurchase – expect $6 billion in 2007, continuing program |
| ·Invest in value-added, growth projects at competitively advantaged refineries |
| Expansion with new hydrocrackers at Port Arthur and St. Charles; Gasifier; Bottoms upgrading |
| •Strategic acquisitions – continue looking for quality assets that meet our strategic criteria |
|
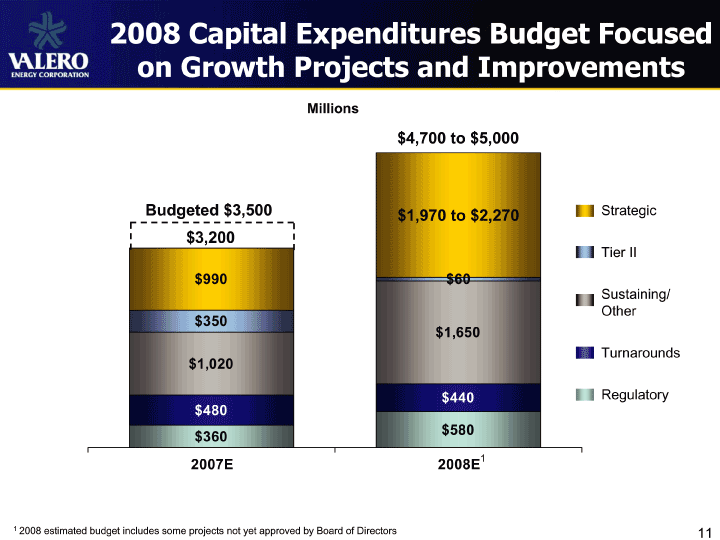
| 2008 Capital Expenditures Budget Focused on Growth Projects and Improvements |
| Millions |
| $4,700 to $5,000 |
| Budgeted $3,500 $1,970 to $2,270Strategic$3,200 |
| Tier II$990 $60 |
| Sustaining/ Other$350 $1,650 |
| Turnarounds$1,020 |
| $440Regulatory$480 $580 $360 2007E 2008E11 2008 estimated budget includes some projects not yet approved by Board of Directors 11 |

| Major Growth Projects |
| IRR/ 2008 Total On- Annual Spend Cost Line EBITDA1 |
| Plant Project ($mm) ($mm) Date ($mm) Description |
| Crude throughput expansion – 75 mbpdNew coker – 45 mbpdPort Crude/Coker/ >20%New hydrocracker – 50 mbpd$300 $1,750 2010 Arthur Hydrocracker $750New distillate hydrotreater – 15 mbpdUpgrades high sulfur vacuum gas oil to ULSD |
| Crude unit expansion |
| – 50 mbpdCoker expansion – 10 mbpd |
| St. Crude/Coker/ >20% $305 $1,250 2010New hydrocracker – 50 mbpd |
| Charles Hydrocracker $350 |
| Eliminates vacuum gas oil exportsBalances refineryNew 30 mbpd ROSE unit and 30 mbpdROSE/ >20%hydrocracker |
| Quebec $125 $900 2011 |
| Hydrocracker $320Increases bottoms destruction and feedstock flexibility |
| 1Based on average of prices for 2004 through 2006 12 |
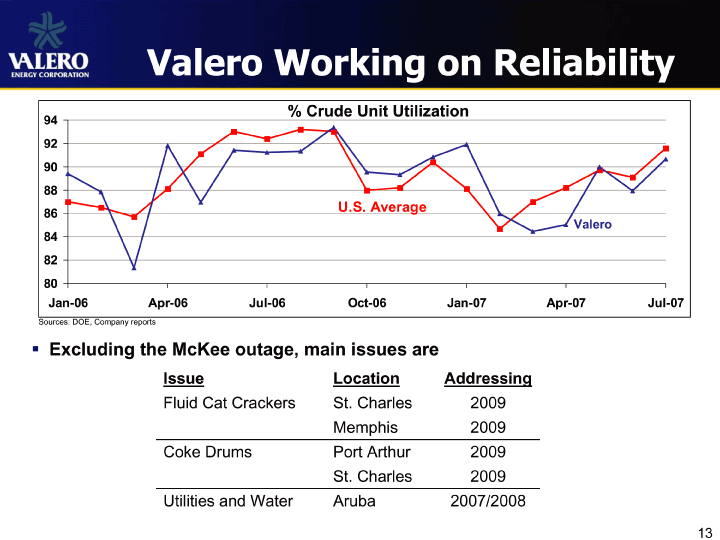
| Valero Working on Reliability |
| % Crude Unit Utilization |
| 94 92 90 88 |
| U.S. Average |
| 86 |
| Valero 84 82 80 |
| Jan-06 Apr-06 Jul-06 Oct-06 Jan-07 Apr-07 Jul-07 |
| Sources: DOE, Company reports |
| Excluding the McKee outage, main issues are |
| Issue Location Addressing |
| Fluid Cat Crackers St. Charles 2009 Memphis 2009 Coke Drums Port Arthur 2009 St. Charles 2009 Utilities and Water Aruba 2007/2008 |
| 13 |
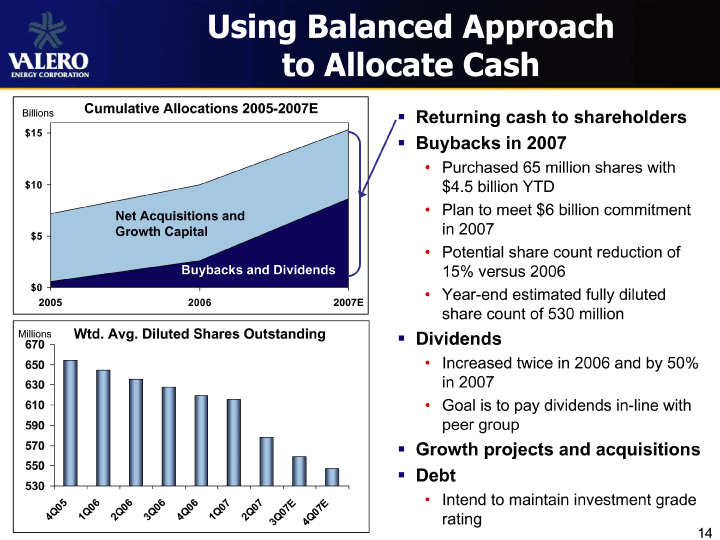
| Using Balanced Approach to Allocate Cash |
| BillionsCumulative Allocations 2005-2007E Returning cash to shareholders |
| $15 |
| Buybacks in 2007 |
| • Purchased 65 milli |
| on shares with |
| $10$4.5 billion YTD |
| Net Acquisitions and• Plan to meet $6 billion commitment Growth Capitalin 2007 |
| $5 |
| • Potential share |
| count reduction of |
| Buybacks and Dividends15% versus 2006 |
| $0• Year-end estimated fully diluted |
| 2005 2006 2007E |
| sha |
| re count of 530 million |
| MillionsWtd. Avg. Diluted Shares OutstandingDividends |
| 670 650• Increased twice in 2006 and by 50%630in 2007610• Goal is to pay dividends in-line with590peer group570Growth projects and acquisitions 550 |
| Debt |
| 530 |
| 6 6 6 7• Intend to maintain investment grade |
| 0000 E 7E Q051Q2Q3Q4Q06 1Q072Q07 0 |
| 4Q 4Q rating |
| 3 |
| 14 |
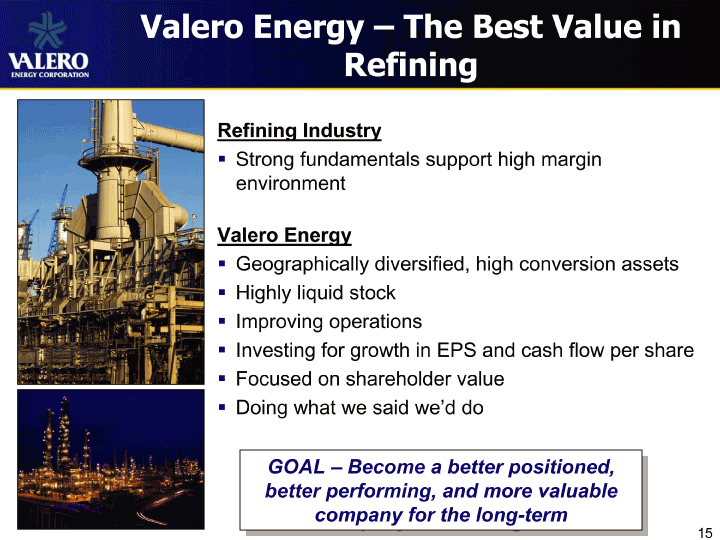
| Valero Energy – The Best Value in Refining |
| Refining Industry |
| Strong fundamentals support high margin environment |
| • Longer than Wall Street expects |
| Valero Energy |
| Geographically diversified, high conversion assetsHighly liquid stockImproving operationsInvesting for growth in EPS and cash flow per shareFocused on shareholder valueDoing what we said we’d do |
| GOAL – Become a better positioned, better performing, and more valuable company for the long-term |
| 15 |
| Appendix |
| 16 |
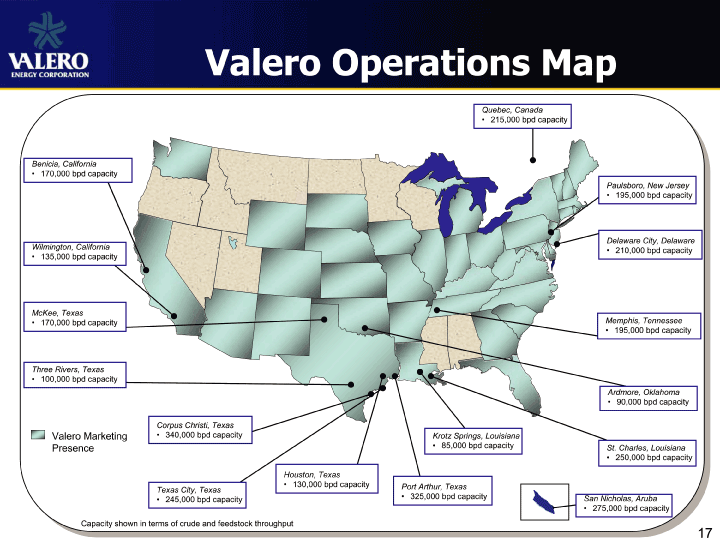
| Valero Operations Map |
| Quebec, Canada |
| · 215,000 bpd capacityBenicia, California |
| · 170,000 bpd capacity |
| Paulsboro, New Je |
| rsey |
| · 195,000 bpd capacity |
| Delaware City, Delaware Wilmington, California• 210,000 bpd capacity |
| · 135,000 bpd capacity |
| McKee, Texas |
| · 170,000 bpd capacityMemphis, Tennessee |
| · 195,000 bpd capacityThree Rivers, Texas |
| · 100,000 bpd capacity |
| Ardmore, Oklah |
| oma |
| · 90,000 bpd capacity |
| Corpus Christi, Texas |
| Valero Marketing• 340,000 bpd capacityKrotz Springs, Louisiana |
| Presence• 85,000 bpd capacitySt. Charles, Louisiana |
| · 250,000 bpd capacity |
| Houston, Texas |
| · 130,000 bpd capacityPort Arthur, Texas Texas City, Texas |
| · 245,000 bpd capacity• 325,000 bpd capacitySan Nicholas, Aruba |
| · 275,000 bpd capacity Capacity shown in terms of crude and feedstock throughput |
| 17 |
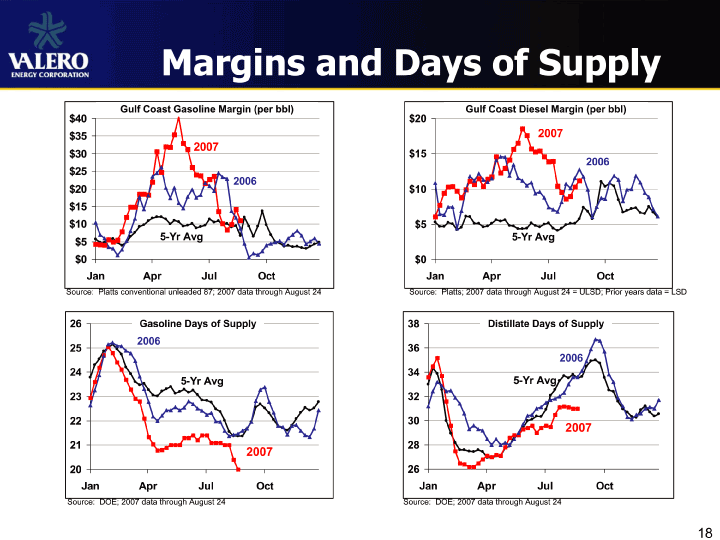
| Margins and Days of Supply |
| Gulf Coast Gasoline Margin (per bbl) Gulf Coast Diesel Margin (per bbl) |
| $40$ 20 |
| $35 2007 2007 $30$ 15 |
| 2006 $25 2006 |
| $20 $10 $15 |
| $10$ 5 5-Yr Avg 5-Yr Avg $5 $0$ 0 Jan Apr Jul Oct Jan Apr Jul ; Oct |
| Source: Platts conventional unleaded 87; 2007 data through August 24 Source: Platts; 2007 data through August 24 = ULSD; Prior years data = LSD |
| 26 Gasoline Days of Supply 38 Distillate Days of Supply |
| 2006 |
| 25 36 |
| 2006 |
| 24 34 5-Yr Avg 5-Yr Avg 23 32 22 30 |
| 2007 |
| 21 28 2007 |
| 20 26 Jan Apr Jul Oct Jan Apr Jul ; Oct |
| Source: DOE; 2007 data through August 24 Source: DOE; 2007 data through August 24 |
| 18 |
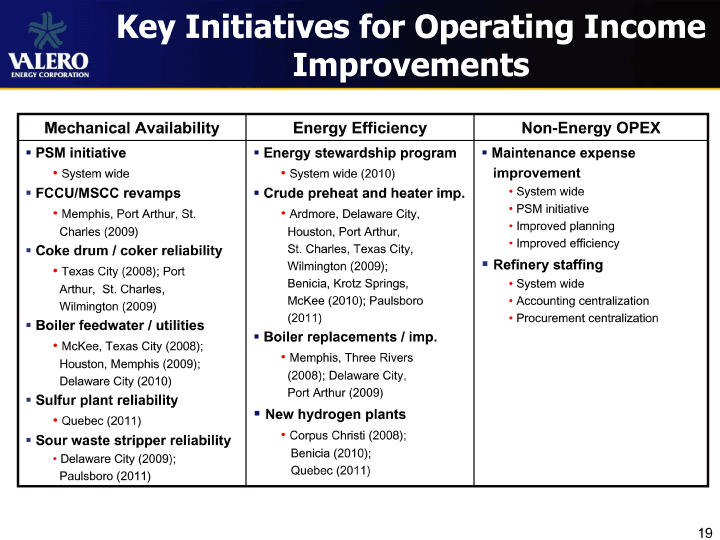
| Key Initiatives for Operating Income Improvements Mechanical AvailabilityEnergy EfficiencyNon-Energy OPEX PSM initiative Energy stewardship program Maintenance expense•System wide• System wide (2010)improvement FCCU/MSCC revamps Crude preheat and heater imp.• System wide•Memphis, Port Arthur, St.• Ardmore, Delaware City,• PSM initiative• Improved planning Charles (2009)Houston, Port Arthur,•Improved efficiencyCoke drum / coker reliabilitySt. Charles, Texas City,•Wilmington (2009);Refinery staffingTexas City (2008); Port Benicia, Krotz Springs,• System wide Arthur, St. Charles, McKee (2010); Paulsboro• Accounting centralization Wilmington (2009) (2011)• Procurement centralizationBoiler feedwater / utilities Boiler replacements / imp.•McKee, Texas City (2008);• Memphis, Three Rivers Houston, Memphis (2009); (2008); Delaware City, Delaware City (2010) Port Arthur (2009)Sulfur plant reliability New hydrogen plants•Quebec (2011)Sour waste stripper reliability• Corpus Christi (2008); Benicia (2010);•Delaware City (2009); Quebec (2011) Paulsboro (2011) 19 |
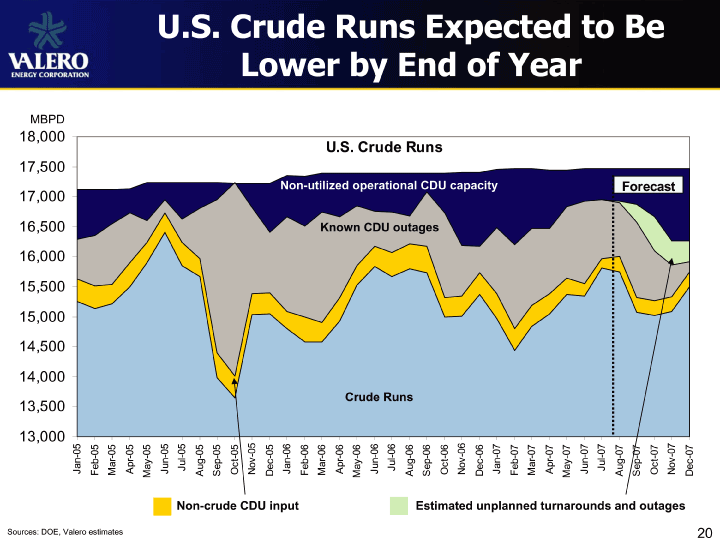
| 13,000 13,500 14,000 14,500 15,000 15,500 16,000 16,500 17,000 17,500 18,000 MBPD Jan-05 Feb-05 Sources: DOE, Valero estimatesMar-05 Apr-05 May-05 Jun-05 Jul-05 Aug-05 Sep-05 Oct-05 Nov-05 Dec-05Non-crude CDU inputJan-06 Feb-06 Mar-06 Apr-06 May-06 Jun-06 Jul-06 Aug-06Crude Runs Sep-06Known CDU outagesU.S. Crude Runs Oct-06 Nov-06 Dec-06Non-utilized operational CDU capacity Jan-07 Feb-07 Mar-07 Apr-07 May-07Lower by End of Year Jun-07 Jul-07 Aug-07 Sep-07 Oct-07U.S. Crude Runs Expected to Be Estimated unplanned turnarounds and outagesNov-07Forecast Dec-07 20 |
| Safe Harbor Statement |
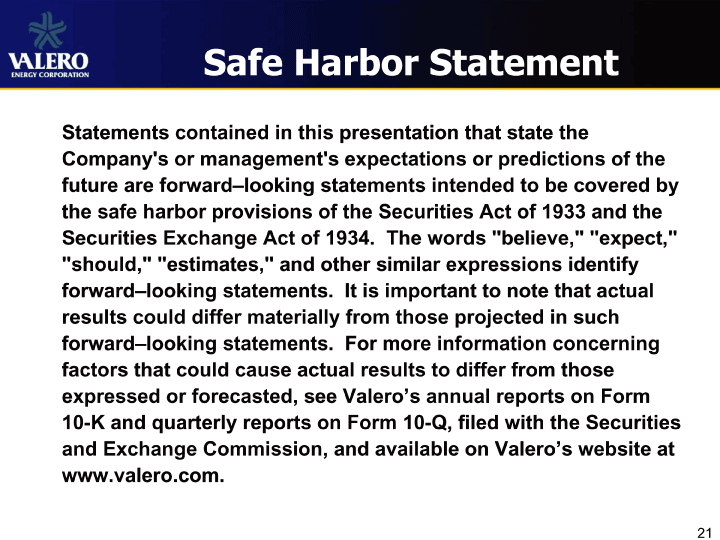
| Statements contained in this presentation that state the Company’s or management’s expectations or predictions of the future are forward–looking statements intended to be covered by the safe harbor provisions of the Securities Act of 1933 and the Securities Exchange Act of 1934. The words “believe,” “expect,” “should,” “estimates,” and other similar expressions identify forward–looking statements. It is important to note that actual results could differ materially from those projected in such forward–looking statements. For more information concerning factors that could cause actual results to differ from those expressed or forecasted, see Valero’s annual reports on Form 10-K and quarterly reports on Form 10-Q, filed with the Securities and Exchange Commission, and available on Valero’s website at www.valero.com. |
| 21 |