1
Howard Weil
Energy Conference
Greg King, President
March 30, 2004

Statements contained in this presentation that state
the Company’s or management’s expectations or
predictions of the future are forward-looking
statements intended to be covered by the safe
harbor provisions of the Securities Act of 1933 and
the Securities Exchange Act of 1934. It is important
to note that the Company’s actual results could
differ materially from those projected in such
forward-looking statements. Factors that could
affect those results include those mentioned in the
documents that the Company has filed with the
Securities and Exchange Commission.
Safe Harbor Statement
2
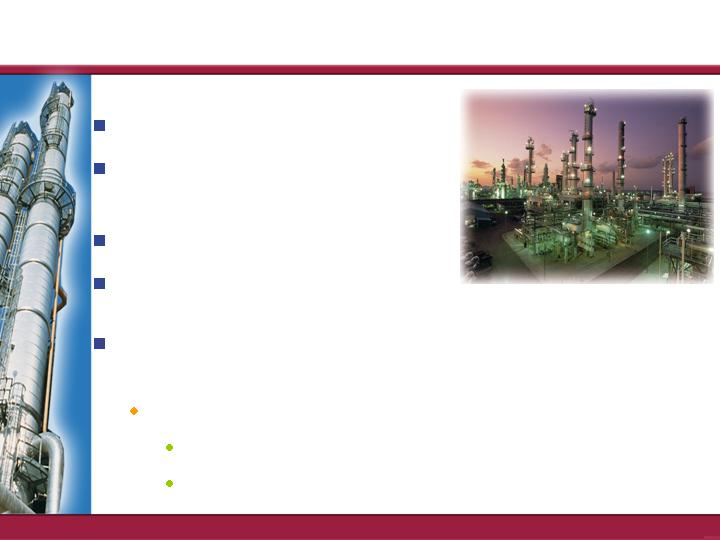
2003 Accomplishments
Record net income -- $622 million
$390 million of operating income from Canadian
operations
Reduced debt-to-cap ratio from 50% to 40%
53.4% at time of UDS acquisition
Acquired St. Charles refinery in July
Commissioned coker at Texas City in October
Great year for retail and wholesale businesses
3

Acquisition of Aruba Refinery
Completed acquisition on March 5 for $465 million plus
162 million for working capital
Financed with $406 million equity and $221 million
cash and debt
315,000 BPD heavy sour crude oil refinery
Replacement cost of $2.4 billion
$640 million invested since 1998
Produces distillates and intermediate feedstocks
Profitable related businesses
Aruba Marine and Bunkering
Marketing assets
Improving reliability and profitability
Proven track record at St. Charles refinery
4
-1.00
1.00
3.00
5.00
7.00
9.00
11.00
13.00
1992
1993
1994
1995
1996
1997
1998
1999
2000
2001
2002
2003
2004
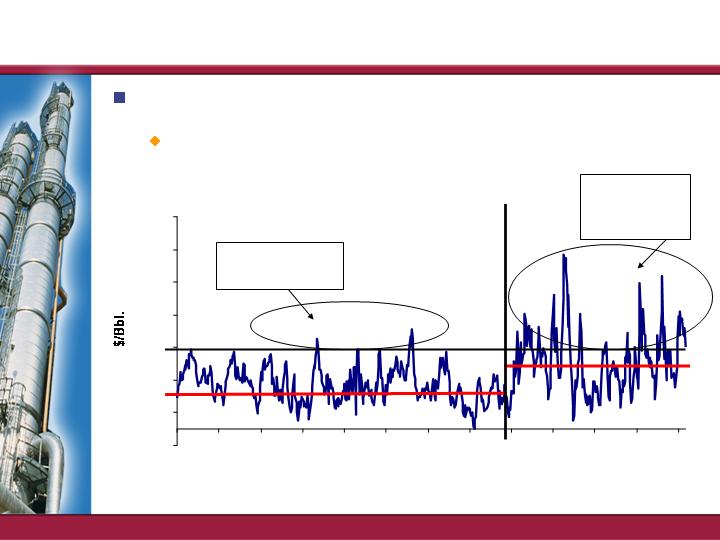
New Era for Refining
Over $5.00/bbl
2% of time
Over
$5.00/bbl
30% of time
Gulf Coast 3-2-1 Refining Margin (1992-2004)
Times have changed since the ’90s
Structural changes in refining industry
Source: Simmons & Company/Valero Research
5
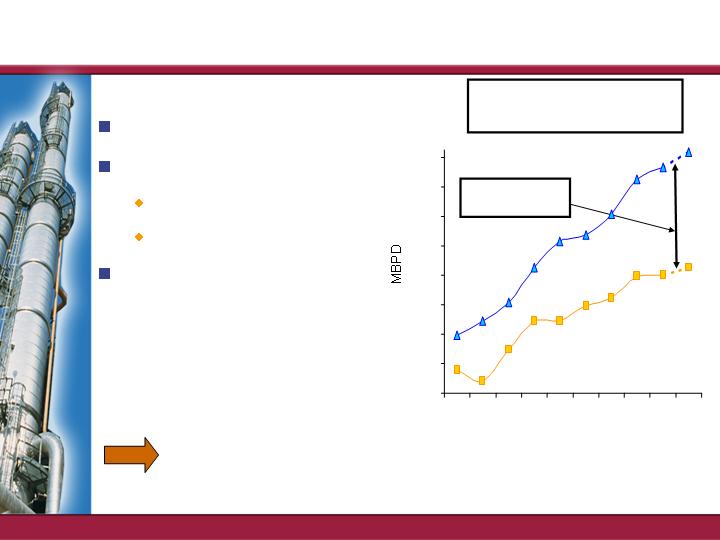
U.S. Gasoline Demand
vs. Production
Gap must be
met by imports
Production
Demand
Gasoline Demand Outpacing Domestic Supply
Demand growing
Supply impacted by
Tier II sulfur specs
MTBE Phase-outs
Gap between U.S.
demand and
production continues
to widen
Higher margins needed to attract
additional supplies to meet U.S. demand
7400
7600
7800
8000
8200
8400
8600
8800
9000
1995
1997
1999
2001
2003
6
U.S./Global Demand Growth
U.S. economy growing
Increasing number of SUVs
on the road
More miles driven
Gasoline demand growing
1-2% per year (up 1.7% YTD)
Nearly all key global regions experiencing strong
economic growth
China economy booming
Economy grew by 9% in ’03; expect 8.2% growth in ’04
China automobile ownership jumped 60% in ’03
7
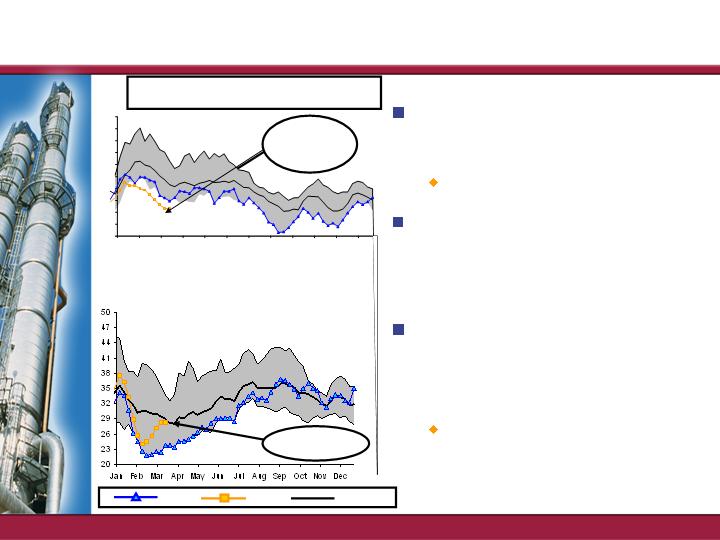
Refined Product Fundamentals
U.S. Gasoline Days of Supply
U.S. Distillate Days of Supply
Record low
Fairly balanced
2003
2004
5 yr avg
U.S.G.C. gasoline margins
$7.75 per bbl QTD
Currently $11.00 per bbl
Full year forward curve
around $7.50 per bbl
40% of 2004 distillate
production hedged at
$4.20 per bbl NYMEX
Full year forward curve
around $3.75 per bbl
NYMEX
20
21
22
23
24
25
26
27
28
29
30
Jan
Feb
Mar
Apr
May
Jun
Jul
Aug
Sep
Oct
Nov
Dec
8

$0.00
$1.00
$2.00
$3.00
$4.00
$5.00
$6.00
$7.00
$8.00
$9.00
Jan
Feb
Mar
Apr
May
Jun
Jul
Aug
Sep
Oct
Nov
Dec
Positive Sour Crude Outlook
WTI vs Sour Crude Basket, $/bbl
(50% Arab Medium and 50% Arab Light)
WTI vs GC Maya (FOB), $/bbl
Sour crude discounts
at attractive levels
Expected to continue
Low-sulfur specs
increasing demand for
sweet crude
Residual fuel oils at
depressed price levels
Growing production of
low-quality crude oils
$2.00
$4.00
$6.00
$8.00
$10.00
$12.00
$14.00
Jan
Feb
Mar
Apr
May
Jun
Jul
Aug
Sep
Oct
Nov
Dec
2003
2004
5 yr avg
9

Product margins
Expected to be around
$1.25 per bbl higher than 2003
Sour crude discounts
Expected to widen
$1.00 per bbl vs. 2003
Throughput volumes
Projected to be 350
MBPD higher than 2003
Off to a great start
Comfortable with 1Q04
First Call Consensus
Full year 2004 First Call
Consensus too low
2004 Looking Better Than 2003
New Texas City Coker
10
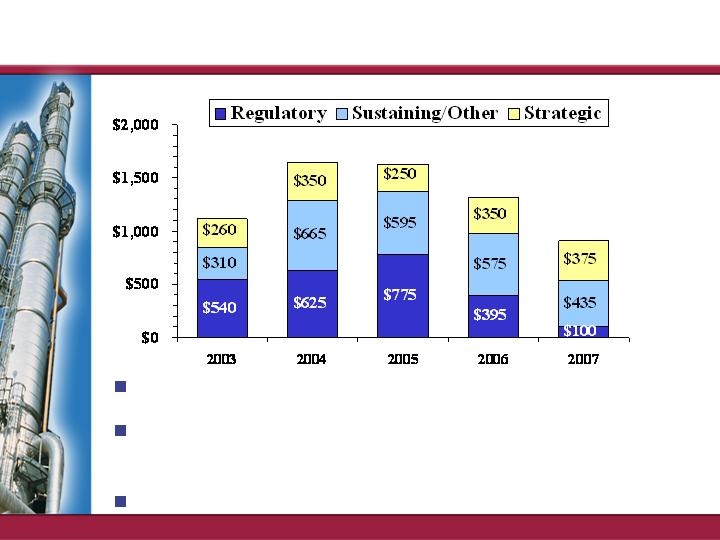
$1,640
(Dollars in Millions)
$1,110
$1,620
$1,320
$910
Investing for the Future
Tier II investments expected to be $1.5 billion
Strategic projects to increase leverage to sour
crudes and clean fuels
Significant increase in free cash flow in 2006
11

Well Positioned for the Future
For refiners who have invested, future has
never looked better
Strong margins and wider sour crude discounts a
powerful combination for Valero
Valero already in strong financial position
Solid financial ratios
Conservative capital structure
Valero has all the advantages
Most refining capacity
Highest complexity
Highest leverage to sour crude oil
Best geographic diversity
Best employees in the industry
12