Exhibit 99.1
Link to searchable text of slide shown above
Link to searchable text of slide shown above
Link to searchable text of slide shown above
Link to searchable text of slide shown above

Link to searchable text of slide shown above
Link to searchable text of slide shown above
Link to searchable text of slide shown above
Link to searchable text of slide shown above
Link to searchable text of slide shown above
Link to searchable text of slide shown above
Link to searchable text of slide shown above
Link to searchable text of slide shown above
Link to searchable text of slide shown above
Link to searchable text of slide shown above
Link to searchable text of slide shown above
Link to searchable text of slide shown above
Searchable text section of graphics shown above
[GRAPHIC]
[LOGO]
2005 Simmons & Company Energy Conference
[LOGO] | | [LOGO] | | [LOGO] | | [LOGO] | | [LOGO] |
Top Company
in America
2004 | | 2004
Oil Company
of the Year | | 2004
United Way Spirit
of America Award | | Seven VPP
Star Site
Refineries | | Number 23 on
2005 Fortune 100 Best
Companies to Work For |
Safe Harbor Statement
Statements contained in this presentation that state the company’s or management’s expectations or predictions of the future are forward-looking statements intended to be covered by the safe harbor provisions of the Securities Act of 1933 and the Securities Exchange Act of 1934. The words “believe,” “expect,” “should,” “estimates,” and other similar expressions identify forward-looking statements. It is important to note that the company’s actual results could differ materially from those projected in its forward-looking statements. For more information concerning factors that could cause actual results to differ from those expressed or forecast, see the company’s annual report on Form 10-K and quarterly reports on Form 10-Q, filed with the Securities and Exchange Commission and available on the company’s web site at http://www.valero.com. These factors include potential changes in gasoline, crude oil, distillate and other commodity prices, varying market conditions, actions of government, hostilities in oil producing regions, adverse rulings in litigation and potential delays or other changes in work and repair schedules. The company undertakes noobligation to update or publicly release the result of any revisions to any forward-looking statements that may be made to reflect events or circumstances that occur, or which the company becomes aware of after the date of this presentation or to reflect the occurrence of unanticipated events.
2
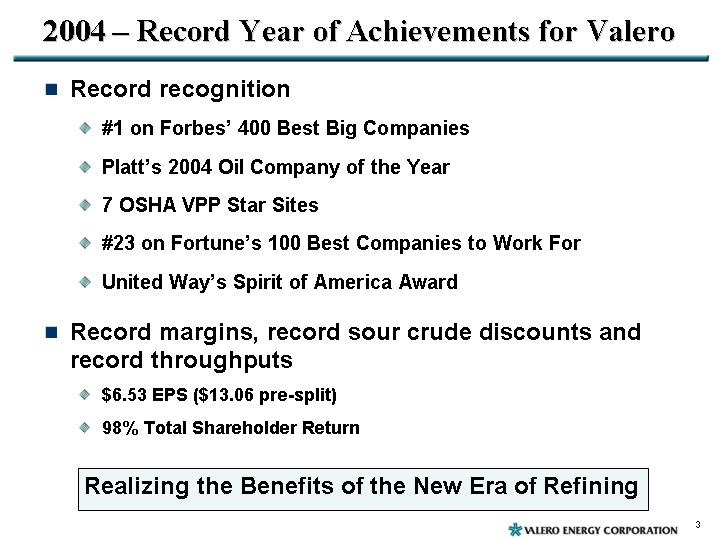
2004 – Record Year of Achievements for Valero
• Record recognition
• #1 on Forbes’ 400 Best Big Companies
• Platt’s 2004 Oil Company of the Year
• 7 OSHA VPP Star Sites
• #23 on Fortune’s 100 Best Companies to Work For
• United Way’s Spirit of America Award
• Record margins, record sour crude discounts and record throughputs
• $6.53 EPS ($13.06 pre-split)
• 98% Total Shareholder Return
Realizing the Benefits of the New Era of Refining
3
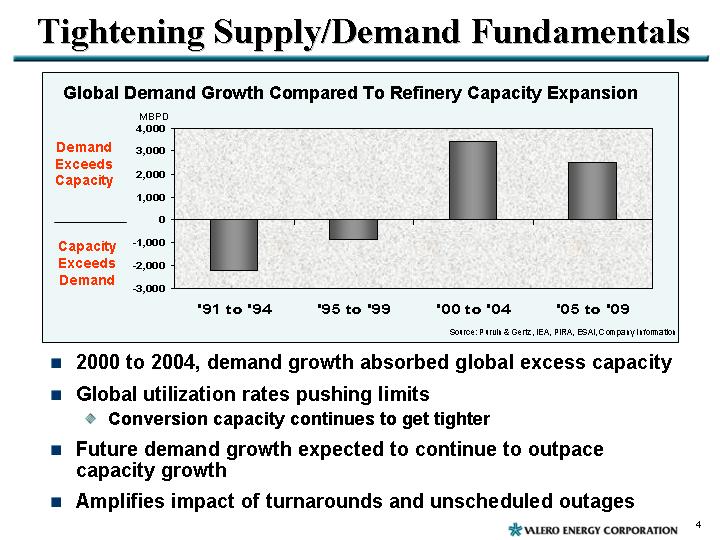
Tightening Supply/Demand Fundamentals
Global Demand Growth Compared To Refinery Capacity Expansion
[CHART]
Source: Purvin & Gertz, IEA, PIRA, ESAI, Company Information
• 2000 to 2004, demand growth absorbed global excess capacity
• Global utilization rates pushing limits
• Conversion capacity continues to get tighter
• Future demand growth expected to continue to outpace capacity growth
• Amplifies impact of turnarounds and unscheduled outages
4
Regulatory Changes Impacting Supply
Maximum Gasoline | Maximum Diesel |
Sulfur Content (PPM) | Sulfur Content (PPM) |
| |
[CHART] | [CHART] |
• Major changes in sulfur specs
• 2005 in Europe and 2006 in US
• Capital diverted to regulatory compliance rather than capacity increases
Further tightens supply; restricts pool of potential imports
5
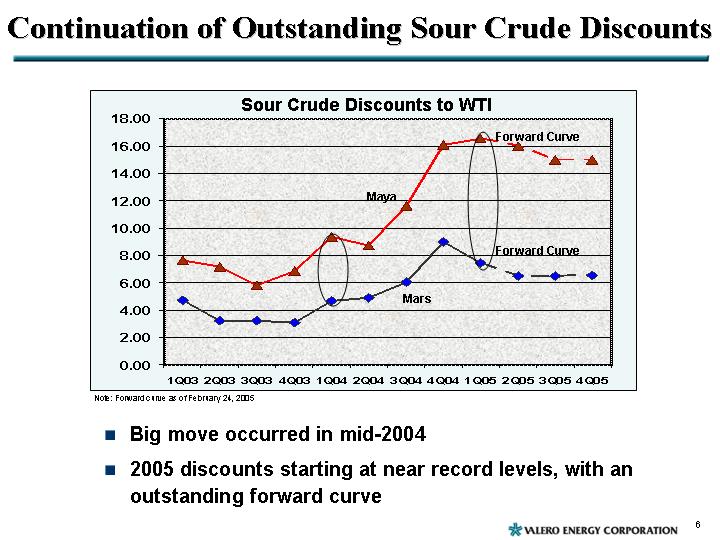
Continuation of Outstanding Sour Crude Discounts
Sour Crude Discounts to WTI
[CHART]
Note: Forward curve as of February 24, 2005
• Big move occurred in mid-2004
• 2005 discounts starting at near record levels, with an outstanding forward curve
6
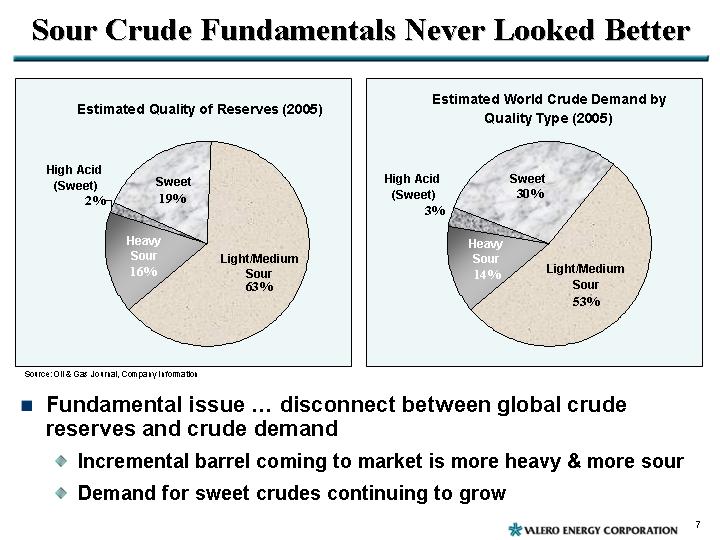
Sour Crude Fundamentals Never Looked Better
Estimated Quality of Reserves (2005) | | Estimated World Crude Demand by
Quality Type (2005) |
| | |
[CHART] | | [CHART] |
Source: Oil & Gas Journal, Company Information
• Fundamental issue … disconnect between global crude reserves and crude demand
• Incremental barrel coming to market is more heavy & more sour
• Demand for sweet crudes continuing to grow
7
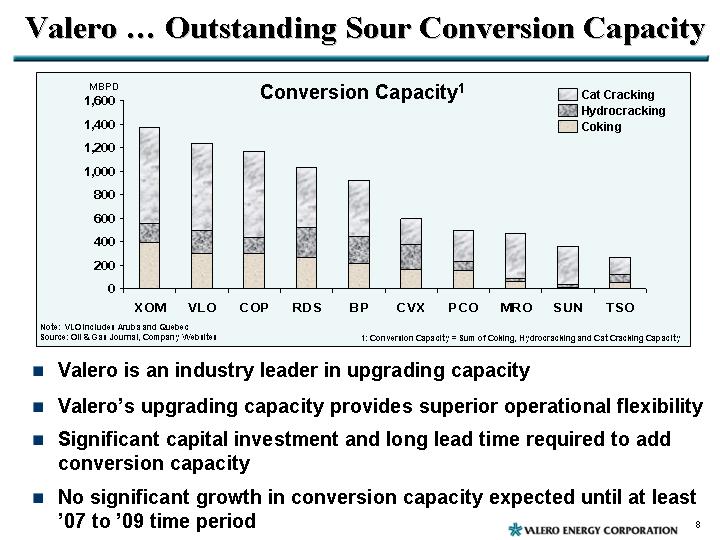
Valero … Outstanding Sour Conversion Capacity
Conversion Capacity(1)
[CHART]
Note: VLO includes Aruba and Quebec
Source: Oil & Gas Journal, Company Websites
(1): Conversion Capacity = Sum of Coking, Hydrocracking and Cat Cracking Capacity
• Valero is an industry leader in upgrading capacity
• Valero’s upgrading capacity provides superior operational flexibility
• Significant capital investment and long lead time required to add conversion capacity
• No significant growth in conversion capacity expected until at least ‘07 to ‘09 time period
8
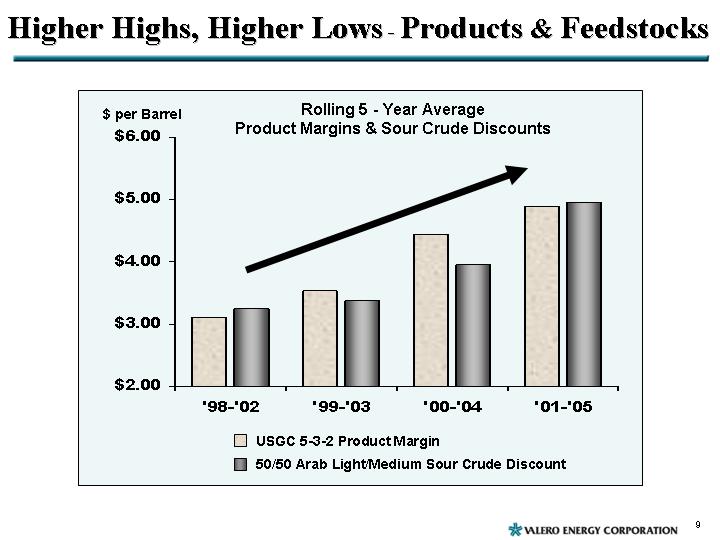
Higher Highs, Higher Lows - Products & Feedstocks
Rolling 5 - Year Average
Product Margins & Sour Crude Discounts
[CHART]
9
[GRAPHIC]
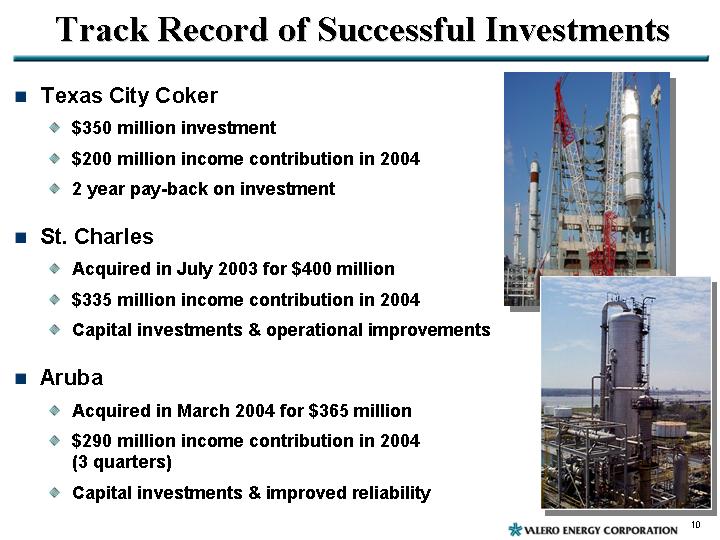
Track Record of Successful Investments
• Texas City Coker
• $350 million investment
• $200 million income contribution in 2004
• 2 year pay-back on investment
• St. Charles
• Acquired in July 2003 for $400 million
• $335 million income contribution in 2004
• Capital investments & operational improvements
• Aruba
• Acquired in March 2004 for $365 million
• $290 million income contribution in 2004 (3 quarters)
• Capital investments & improved reliability
10
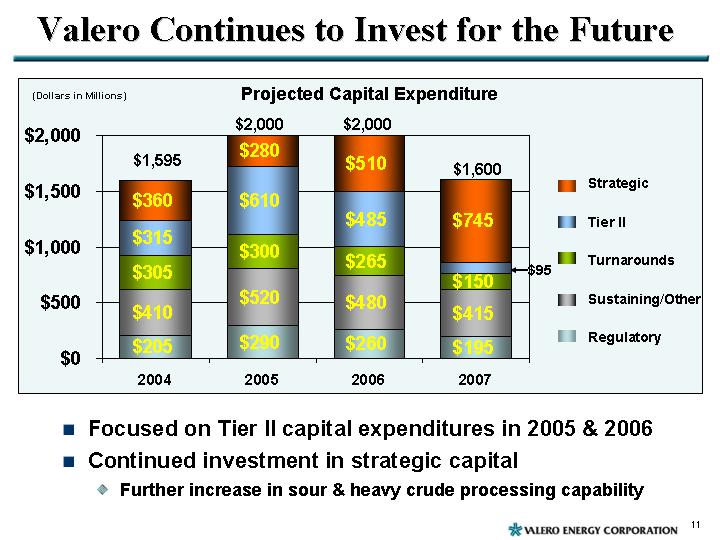
Valero Continues to Invest for the Future
Projected Capital Expenditure
[CHART]
• Focused on Tier II capital expenditures in 2005 & 2006
• Continued investment in strategic capital
• Further increase in sour & heavy crude processing capability
11
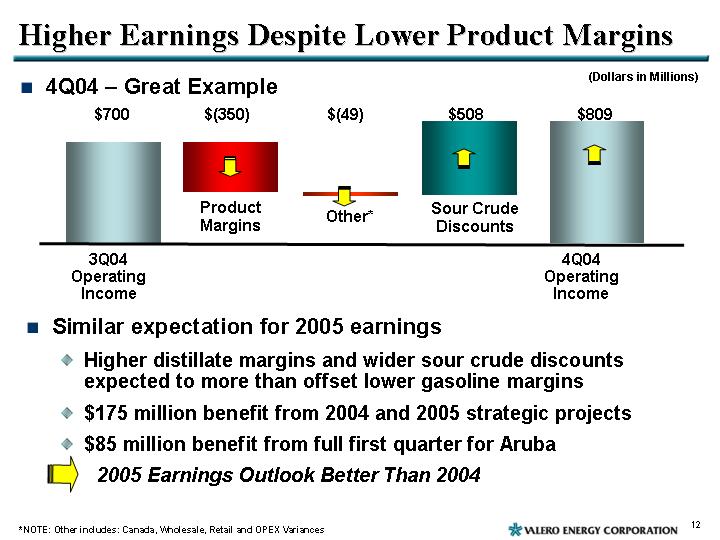
Higher Earnings Despite Lower Product Margins
• 4Q04 – Great Example
[CHART]
• Similar expectation for 2005 earnings
• Higher distillate margins and wider sour crude discounts expected to more than offset lower gasoline margins
• $175 million benefit from 2004 and 2005 strategic projects
• $85 million benefit from full first quarter for Aruba
• 2005 Earnings Outlook Better Than 2004
*NOTE: Other includes: Canada, Wholesale, Retail and OPEX Variances
12
Valero … Continuing Our Successful Strategy
• Proven results in utilizing cash flow
• Highly successful acquisition & CAPEX strategy
• Experienced management with a sustainable growth plan
• Will continue to:
• Invest in our assets
• Look for selective, accretive acquisitions
• Reduce debt
• Increase dividend
• Buy back stock
• Invest in our communities and our employees
Great Assets and Proven Strategy …
• Outstanding Value for Shareholders
13
APPENDIX
14
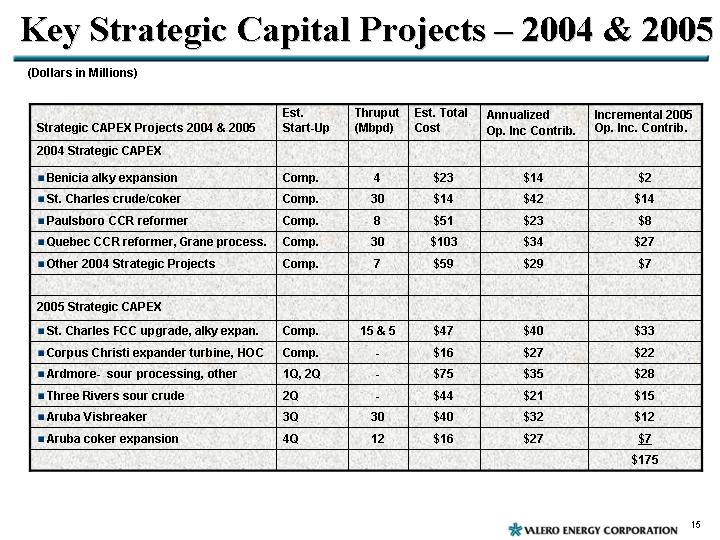
Key Strategic Capital Projects – 2004 & 2005
(Dollars in Millions)
Strategic CAPEX Projects 2004 & 2005 | | Est.
Start-Up | | Thruput
(Mbpd) | | Est. Total
Cost | | Annualized
Op. Inc Contrib. | | Incremental 2005
Op. Inc. Contrib. | |
2004 Strategic CAPEX | | | | | | | | | | | |
• Benicia alky expansion | | Comp. | | 4 | | $ | 23 | | $ | 14 | | $ | 2 | |
• St. Charles crude/coker | | Comp. | | 30 | | $ | 14 | | $ | 42 | | $ | 14 | |
• Paulsboro CCR reformer | | Comp. | | 8 | | $ | 51 | | $ | 23 | | $ | 8 | |
• Quebec CCR reformer, Grane process. | | Comp. | | 30 | | $ | 103 | | $ | 34 | | $ | 27 | |
• Other 2004 Strategic Projects | | Comp. | | 7 | | $ | 59 | | $ | 29 | | $ | 7 | |
| | | | | | | | | | | |
2005 Strategic CAPEX | | | | | | | | | | | |
• St. Charles FCC upgrade, alky expan. | | Comp. | | 15 & 5 | | $ | 47 | | $ | 40 | | $ | 33 | |
• Corpus Christi expander turbine, HOC | | Comp. | | — | | $ | 16 | | $ | 27 | | $ | 22 | |
• Ardmore- sour processing, other | | 1Q, 2Q | | — | | $ | 75 | | $ | 35 | | $ | 28 | |
• Three Rivers sour crude | | 2Q | | — | | $ | 44 | | $ | 21 | | $ | 15 | |
• Aruba Visbreaker | | 3Q | | 30 | | $ | 40 | | $ | 32 | | $ | 12 | |
• Aruba coker expansion | | 4Q | | 12 | | $ | 16 | | $ | 27 | | $ | 7 | |
| | | | | | | | | | $ | 175 | |
15
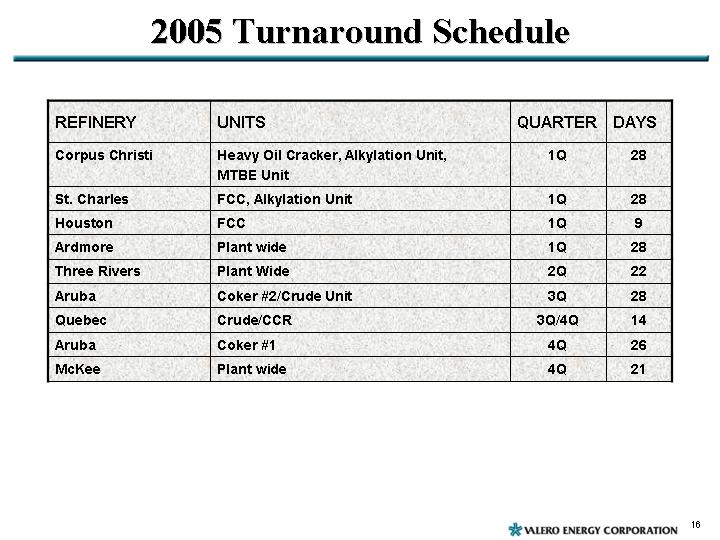
2005 Turnaround Schedule
REFINERY | | UNITS | | QUARTER | | DAYS | |
Corpus Christi | | Heavy Oil Cracker, Alkylation Unit, MTBE Unit | | 1Q | | 28 | |
St. Charles | | FCC, Alkylation Unit | | 1Q | | 28 | |
Houston | | FCC | | 1Q | | 9 | |
Ardmore | | Plant wide | | 1Q | | 28 | |
Three Rivers | | Plant Wide | | 2Q | | 22 | |
Aruba | | Coker #2/Crude Unit | | 3Q | | 28 | |
Quebec | | Crude/CCR | | 3Q/4Q | | 14 | |
Aruba | | Coker #1 | | 4Q | | 26 | |
McKee | | Plant wide | | 4Q | | 21 | |
16