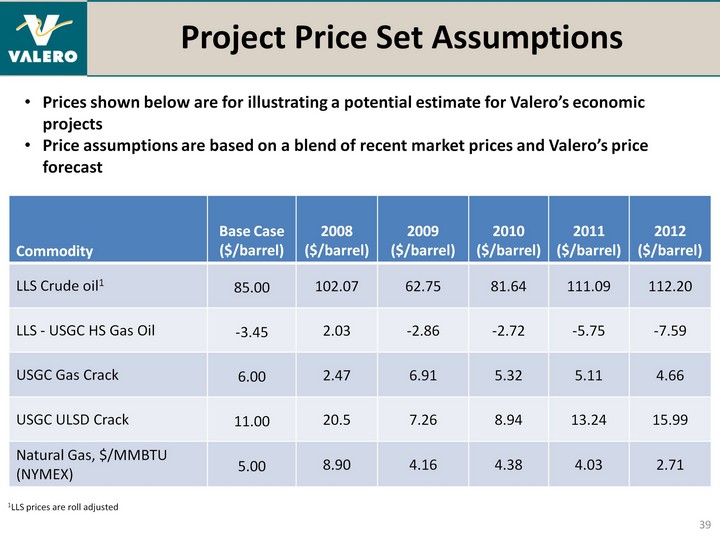
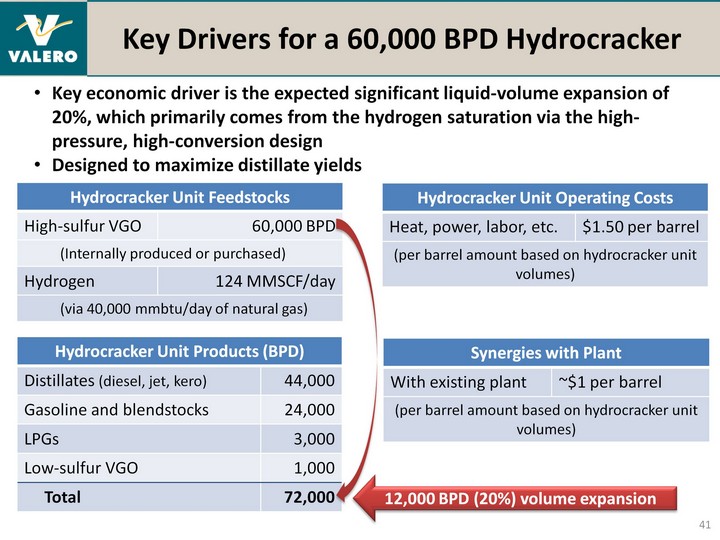
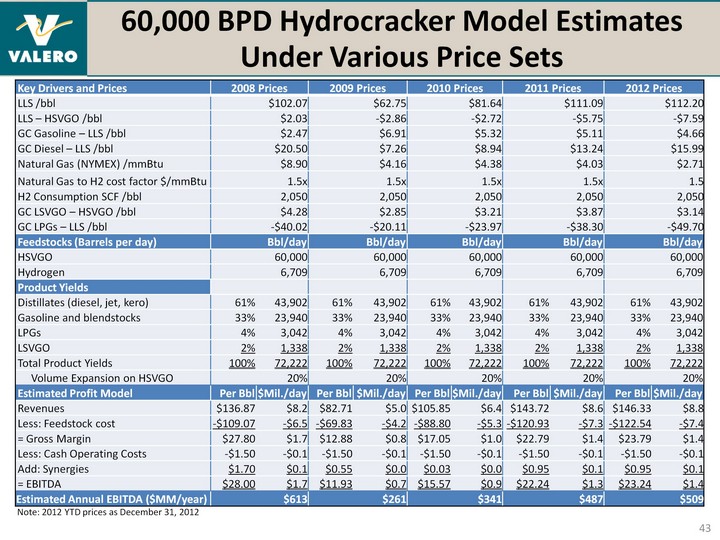
| 60,000 BPD Hydrocracker Model Estimates Under Various Price Sets 43 Key Drivers and Prices 2008 Prices 2008 Prices 2009 Prices 2009 Prices 2010 Prices 2010 Prices 2011 Prices 2011 Prices 2012 Prices 2012 Prices LLS /bbl $102.07 $62.75 $81.64 $111.09 $112.20 LLS - HSVGO /bbl $2.03 -$2.86 -$2.72 -$5.75 -$7.59 GC Gasoline - LLS /bbl $2.47 $6.91 $5.32 $5.11 $4.66 GC Diesel - LLS /bbl $20.50 $7.26 $8.94 $13.24 $15.99 Natural Gas (NYMEX) /mmBtu $8.90 $4.16 $4.38 $4.03 $2.71 Natural Gas to H2 cost factor $/mmBtu 1.5x 1.5x 1.5x 1.5x 1.5 H2 Consumption SCF /bbl 2,050 2,050 2,050 2,050 2,050 GC LSVGO - HSVGO /bbl $4.28 $2.85 $3.21 $3.87 $3.14 GC LPGs - LLS /bbl -$40.02 -$20.11 -$23.97 -$38.30 -$49.70 Feedstocks (Barrels per day) Bbl/day Bbl/day Bbl/day Bbl/day Bbl/day HSVGO 60,000 60,000 60,000 60,000 60,000 Hydrogen 6,709 6,709 6,709 6,709 6,709 Product Yields Distillates (diesel, jet, kero) 61% 43,902 61% 43,902 61% 43,902 61% 43,902 61% 43,902 Gasoline and blendstocks 33% 23,940 33% 23,940 33% 23,940 33% 23,940 33% 23,940 LPGs 4% 3,042 4% 3,042 4% 3,042 4% 3,042 4% 3,042 LSVGO 2% 1,338 2% 1,338 2% 1,338 2% 1,338 2% 1,338 Total Product Yields 100% 72,222 100% 72,222 100% 72,222 100% 72,222 100% 72,222 Volume Expansion on HSVGO 20% 20% 20% 20% 20% Estimated Profit Model Per Bbl $Mil./day Per Bbl $Mil./day Per Bbl $Mil./day Per Bbl $Mil./day Per Bbl $Mil./day Revenues $136.87 $8.2 $82.71 $5.0 $105.85 $6.4 $143.72 $8.6 $146.33 $8.8 Less: Feedstock cost -$109.07 -$6.5 -$69.83 -$4.2 -$88.80 -$5.3 -$120.93 -$7.3 -$122.54 -$7.4 = Gross Margin $27.80 $1.7 $12.88 $0.8 $17.05 $1.0 $22.79 $1.4 $23.79 $1.4 Less: Cash Operating Costs -$1.50 -$0.1 -$1.50 -$0.1 -$1.50 -$0.1 -$1.50 -$0.1 -$1.50 -$0.1 Add: Synergies $1.70 $0.1 $0.55 $0.0 $0.03 $0.0 $0.95 $0.1 $0.95 $0.1 = EBITDA $28.00 $1.7 $11.93 $0.7 $15.57 $0.9 $22.24 $1.3 $23.24 $1.4 Estimated Annual EBITDA ($MM/year) $613 $261 $341 $487 $509 Note: 2012 YTD prices as December 31, 2012 |