Exhibit 99.01

| ISI Energy Conference May 7-8, 2013 |
| Safe Harbor Statement Statements contained in this presentation that state the Company's or management's expectations or predictions of the future are forward- looking statements intended to be covered by the safe harbor provisions of the Securities Act of 1933 and the Securities Exchange Act of 1934. The words "believe," "expect," "should," "estimates," "intend," and other similar expressions identify forward-looking statements. It is important to note that actual results could differ materially from those projected in such forward-looking statements. For more information concerning factors that could cause actual results to differ from those expressed or forecasted, see Valero's annual reports on Form 10^K and quarterly reports on Form 10^Q, filed with the Securities and Exchange Commission, and available on Valero's website at www.valero.com. 2 |
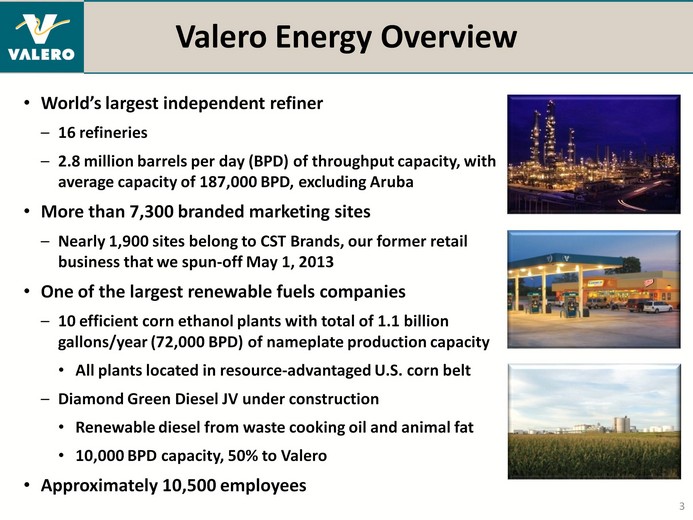
| Valero Energy Overview World's largest independent refiner 16 refineries 2.8 million barrels per day (BPD) of throughput capacity, with average capacity of 187,000 BPD, excluding Aruba More than 7,300 branded marketing sites Nearly 1,900 sites belong to CST Brands, our former retail business that we spun-off May 1, 2013 One of the largest renewable fuels companies 10 efficient corn ethanol plants with total of 1.1 billion gallons/year (72,000 BPD) of nameplate production capacity All plants located in resource-advantaged U.S. corn belt Diamond Green Diesel JV under construction Renewable diesel from waste cooking oil and animal fat 10,000 BPD capacity, 50% to Valero Approximately 10,500 employees 3 |
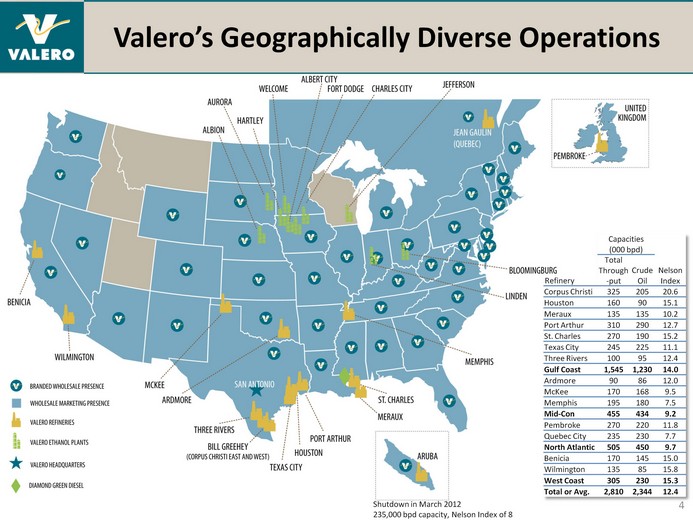
| Refinery Capacities (000 bpd) Capacities (000 bpd) Nelson Index Refinery Total Through-put Crude Oil Nelson Index Corpus Christi 325 205 20.6 Houston 160 90 15.1 Meraux 135 135 10.2 Port Arthur 310 290 12.7 St. Charles 270 190 15.2 Texas City 245 225 11.1 Three Rivers 100 95 12.4 Gulf Coast 1,545 1,230 14.0 Ardmore 90 86 12.0 McKee 170 168 9.5 Memphis 195 180 7.5 Mid-Con 455 434 9.2 Pembroke 270 220 11.8 Quebec City 235 230 7.7 North Atlantic 505 450 9.7 Benicia 170 145 15.0 Wilmington 135 85 15.8 West Coast 305 230 15.3 Total or Avg. 2,810 2,344 12.4 Valero's Geographically Diverse Operations 4 Shutdown in March 2012 235,000 bpd capacity, Nelson Index of 8 |
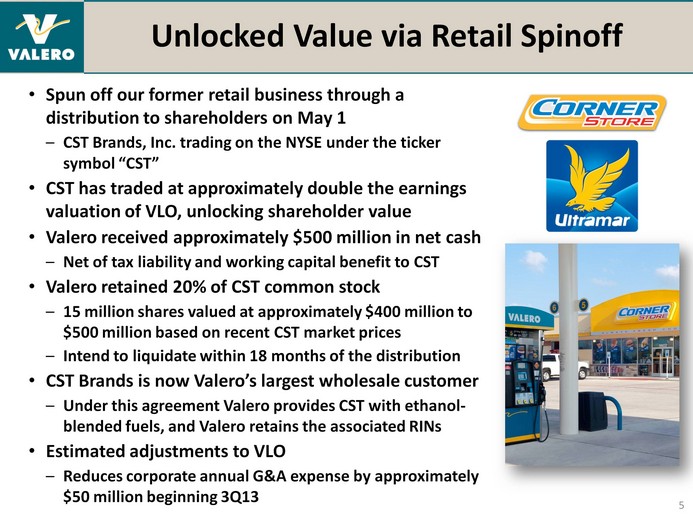
| Unlocked Value via Retail Spinoff Spun off our former retail business through a distribution to shareholders on May 1 CST Brands, Inc. trading on the NYSE under the ticker symbol "CST" CST has traded at approximately double the earnings valuation of VLO, unlocking shareholder value Valero received approximately $500 million in net cash Net of tax liability and working capital benefit to CST Valero retained 20% of CST common stock 15 million shares valued at approximately $400 million to $500 million based on recent CST market prices Intend to liquidate within 18 months of the distribution CST Brands is now Valero's largest wholesale customer Under this agreement Valero provides CST with ethanol- blended fuels, and Valero retains the associated RINs Estimated adjustments to VLO Reduces corporate annual G&A expense by approximately $50 million beginning 3Q13 5 |
| VLO Well-Positioned to Benefit from Changing Market Trends Atlantic Basin refining closures reducing excess capacity U.S. competitively exporting into growing and undersupplied markets Expect abundant and growing U.S. shale oil and Canadian production to provide feedstock cost advantage Low-cost U.S. natural gas provides competitive advantage Increasing Valero's yield of distillates, which have higher margins and global growth 6 |
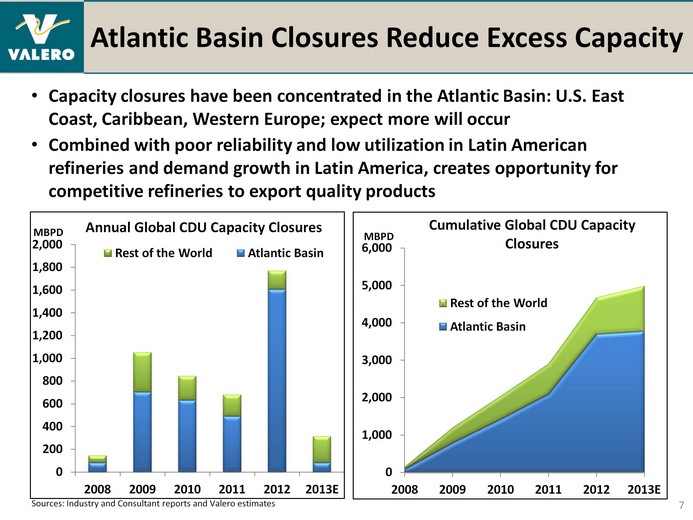
| (CHART) Atlantic Basin Closures Reduce Excess Capacity Capacity closures have been concentrated in the Atlantic Basin: U.S. East Coast, Caribbean, Western Europe; expect more will occur Combined with poor reliability and low utilization in Latin American refineries and demand growth in Latin America, creates opportunity for competitive refineries to export quality products 7 (CHART) Sources: Industry and Consultant reports and Valero estimates |
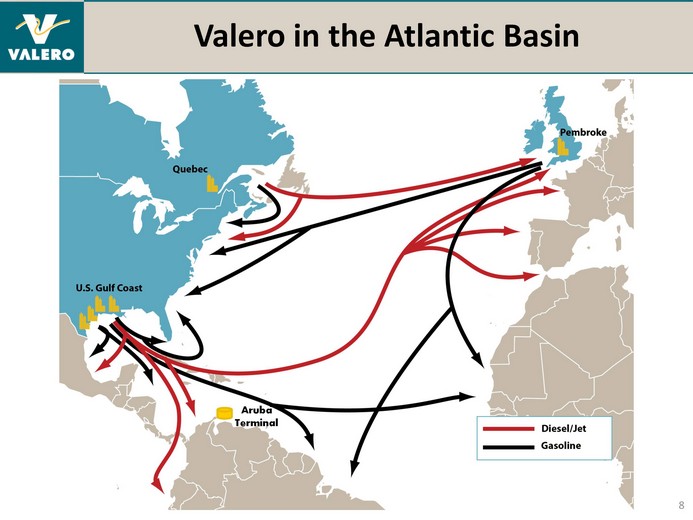
| Valero in the Atlantic Basin 8 8 Aruba Terminal |
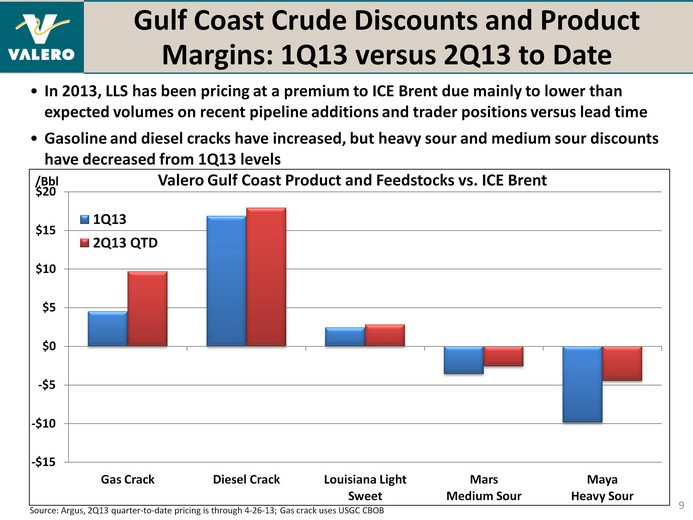
| Gulf Coast Crude Discounts and Product Margins: 1Q13 versus 2Q13 to Date Margins: 1Q13 versus 2Q13 to Date Margins: 1Q13 versus 2Q13 to Date 9 Source: Argus, 2Q13 quarter-to-date pricing is through 4-26-13; Gas crack uses USGC CBOB Valero Gulf Coast Product and Feedstocks vs. ICE Brent In 2013, LLS has been pricing at a premium to ICE Brent due mainly to lower than expected volumes on recent pipeline additions and trader positions versus lead time Gasoline and diesel cracks have increased, but heavy sour and medium sour discounts have decreased from 1Q13 levels |

| (CHART) Continued Global Demand Growth Important to Refining Margins 10 Source: Consultant and Valero estimates World Petroleum Demand Growth Emerging markets are taking the lead in terms of global petroleum demand growth, but refining is a global business and world growth impacts refiners in every market because products are generally very storable, transportable, and fungible commodities MMBPD |

| (CHART) World Refinery Capacity Growth Expect significant new global refining additions in the next several years Mainly new plants in Asia and the Middle East Some investment in Latin America New capacity announcements from Brazil, Mexico, and Colombia will likely be much smaller and much later than originally announced Others very unlikely to happen because of costs: Ecuador, Peru, Algeria, Egypt Asian demand growth has been consuming Asian refining growth Net Global Refinery Additions 11 MMBPD Source: Consultant and Valero estimates; Net Global Refinery Additions = New Capacity + Restarts- Closures |
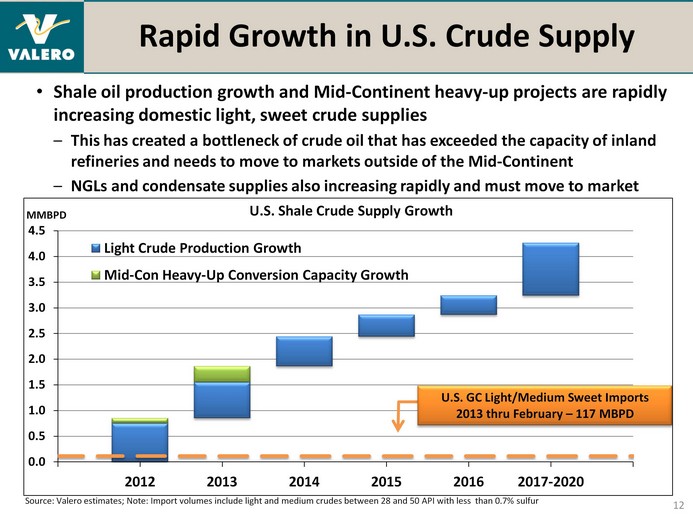
| Rapid Growth in U.S. Crude Supply 12 (CHART) Shale oil production growth and Mid-Continent heavy-up projects are rapidly increasing domestic light, sweet crude supplies This has created a bottleneck of crude oil that has exceeded the capacity of inland refineries and needs to move to markets outside of the Mid-Continent NGLs and condensate supplies also increasing rapidly and must move to market Source: Valero estimates; Note: Import volumes include light and medium crudes between 28 and 50 API with less than 0.7% sulfur U.S. GC Light/Medium Sweet Imports 2013 thru February - 117 MBPD |
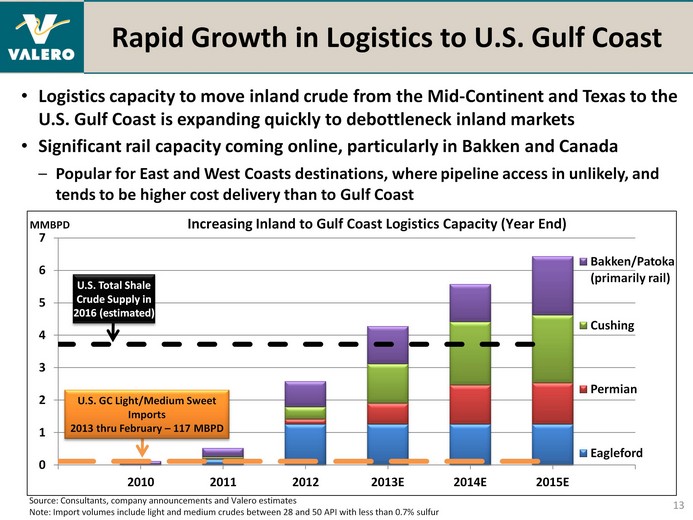
| Rapid Growth in Logistics to U.S. Gulf Coast 13 (CHART) Logistics capacity to move inland crude from the Mid-Continent and Texas to the U.S. Gulf Coast is expanding quickly to debottleneck inland markets Significant rail capacity coming online, particularly in Bakken and Canada Popular for East and West Coasts destinations, where pipeline access in unlikely, and tends to be higher cost delivery than to Gulf Coast Source: Consultants, company announcements and Valero estimates Note: Import volumes include light and medium crudes between 28 and 50 API with less than 0.7% sulfur U.S. GC Light/Medium Sweet Imports 2013 thru February - 117 MBPD U.S. Total Shale Crude Supply in 2016 (estimated) |
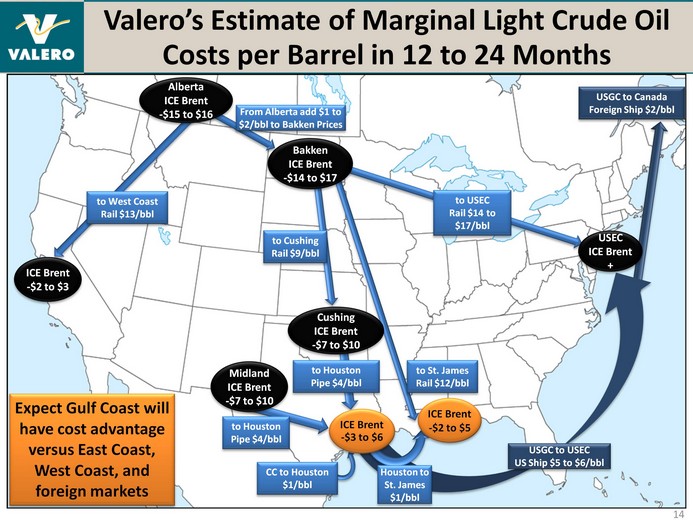
| Valero's Estimate of Marginal Light Crude Oil Costs per Barrel in 12 to 24 Months 14 to USEC Rail $14 to $17/bbl to St. James Rail $12/bbl to Cushing Rail $9/bbl Cushing ICE Brent -$7 to $10 to Houston Pipe $4/bbl Midland ICE Brent -$7 to $10 to Houston Pipe $4/bbl CC to Houston $1/bbl Houston to St. James $1/bbl Bakken ICE Brent -$14 to $17 to West Coast Rail $13/bbl USGC to USEC US Ship $5 to $6/bbl USGC to Canada Foreign Ship $2/bbl From Alberta add $1 to $2/bbl to Bakken Prices USEC ICE Brent + ICE Brent -$2 to $5 ICE Brent -$2 to $3 ICE Brent -$3 to $6 Alberta ICE Brent -$15 to $16 Expect Gulf Coast will have cost advantage versus East Coast, West Coast, and foreign markets |
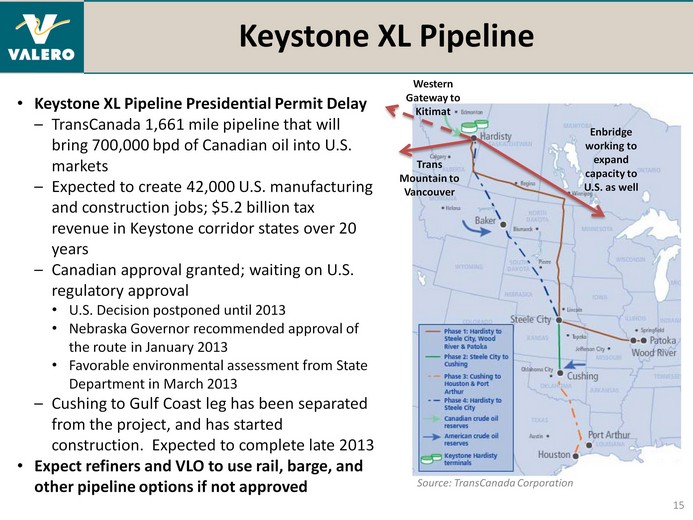
| Keystone XL Pipeline Keystone XL Pipeline Presidential Permit Delay TransCanada 1,661 mile pipeline that will bring 700,000 bpd of Canadian oil into U.S. markets Expected to create 42,000 U.S. manufacturing and construction jobs; $5.2 billion tax revenue in Keystone corridor states over 20 years Canadian approval granted; waiting on U.S. regulatory approval U.S. Decision postponed until 2013 Nebraska Governor recommended approval of the route in January 2013 Favorable environmental assessment from State Department in March 2013 Cushing to Gulf Coast leg has been separated from the project, and has started construction. Expected to complete late 2013 Expect refiners and VLO to use rail, barge, and other pipeline options if not approved 15 Source: TransCanada Corporation Western Gateway to Kitimat Trans Mountain to Vancouver Enbridge working to expand capacity to U.S. as well |
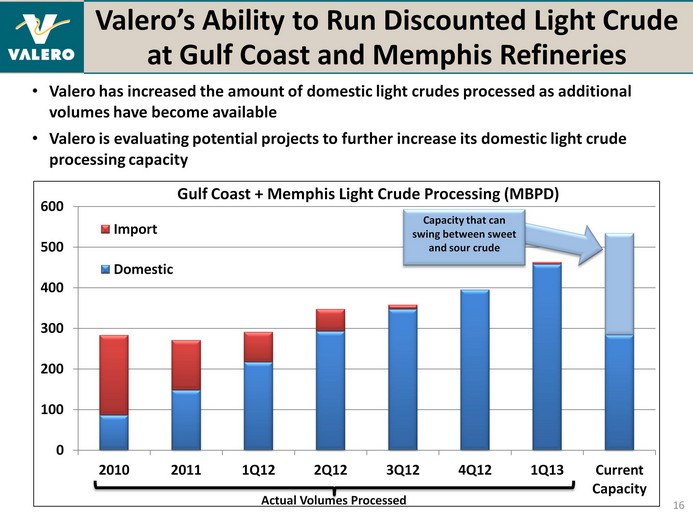
| Valero has increased the amount of domestic light crudes processed as additional volumes have become available Valero is evaluating potential projects to further increase its domestic light crude processing capacity Valero's Ability to Run Discounted Light Crude at Gulf Coast and Memphis Refineries 16 (CHART) Actual Volumes Processed |
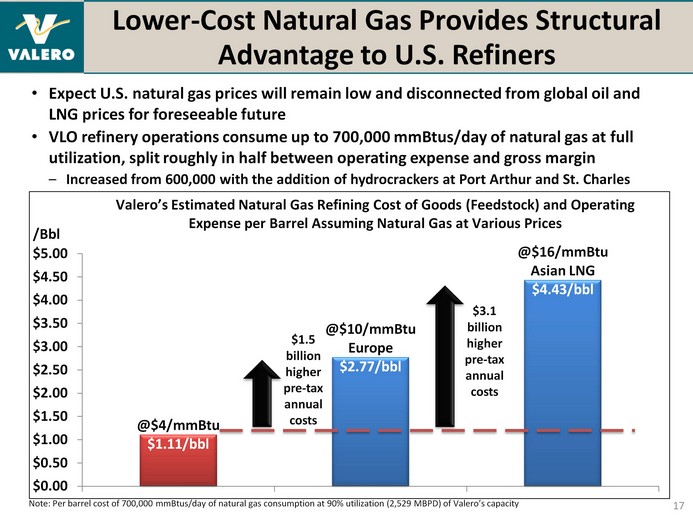
| Lower-Cost Natural Gas Provides Structural Advantage to U.S. Refiners 17 Note: Per barrel cost of 700,000 mmBtus/day of natural gas consumption at 90% utilization (2,529 MBPD) of Valero's capacity $1.5 billion higher pre-tax annual costs $3.1 billion higher pre-tax annual costs Expect U.S. natural gas prices will remain low and disconnected from global oil and LNG prices for foreseeable future VLO refinery operations consume up to 700,000 mmBtus/day of natural gas at full utilization, split roughly in half between operating expense and gross margin Increased from 600,000 with the addition of hydrocrackers at Port Arthur and St. Charles |

| Distillates Are Premium Refined Products with Higher Margins and Faster Growth 18 Distillate (diesel, kero, jet fuel) margins are significantly higher than gasoline Distillate demand growth rate is much higher than gasoline Europe continues to be short diesel, but long marginal refining capacity and processing expensive crude oils and natural gas (CHART) Source: Argus, 2013 YTD through April 26, 2013 /bbl (CHART) World Product Demand Growth /year |
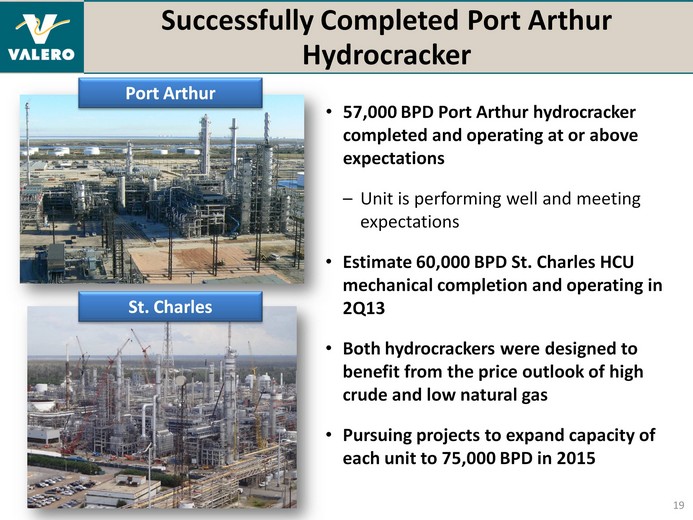
| 57,000 BPD Port Arthur hydrocracker completed and operating at or above expectations Unit is performing well and meeting expectations Estimate 60,000 BPD St. Charles HCU mechanical completion and operating in 2Q13 Both hydrocrackers were designed to benefit from the price outlook of high crude and low natural gas Pursuing projects to expand capacity of each unit to 75,000 BPD in 2015 Successfully Completed Port Arthur Hydrocracker 19 St. Charles Port Arthur |
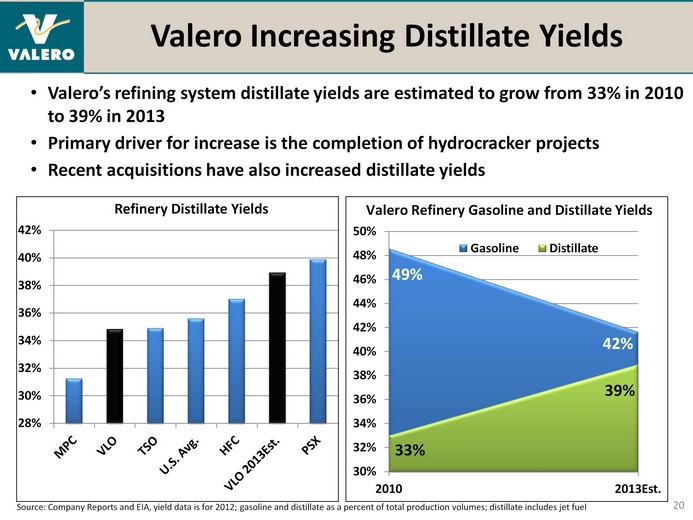
| Valero Increasing Distillate Yields 20 (CHART) Source: Company Reports and EIA, yield data is for 2012; gasoline and distillate as a percent of total production volumes; distillate includes jet fuel Valero's refining system distillate yields are estimated to grow from 33% in 2010 to 39% in 2013 Primary driver for increase is the completion of hydrocracker projects Recent acquisitions have also increased distillate yields (CHART) |
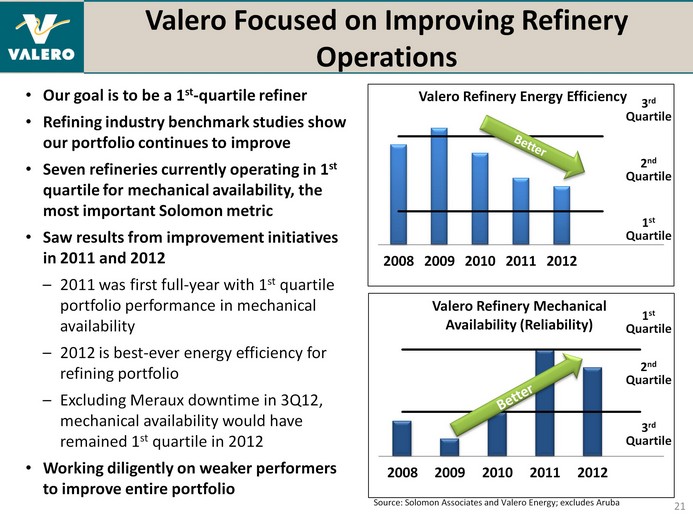
| Better Better Our goal is to be a 1st-quartile refiner Refining industry benchmark studies show our portfolio continues to improve Seven refineries currently operating in 1st quartile for mechanical availability, the most important Solomon metric Saw results from improvement initiatives in 2011 and 2012 2011 was first full-year with 1st quartile portfolio performance in mechanical availability 2012 is best-ever energy efficiency for refining portfolio Excluding Meraux downtime in 3Q12, mechanical availability would have remained 1st quartile in 2012 Working diligently on weaker performers to improve entire portfolio Valero Focused on Improving Refinery Operations 21 1st Quartile 2nd Quartile 1st Quartile 2nd Quartile 3rd Quartile 3rd Quartile Source: Solomon Associates and Valero Energy; excludes Aruba |

| Expect Large Decline in Capital Spending in 2013 22 "Stay- in- business" spending 2012 spending was higher mainly due to the two new hydrocrackers 2013 spending includes approximate $60 million for retail (CST Brands) through April 2013 spending increased approximately $140 million from prior guidance due mainly to the addition and acceleration of logistics projects within growth category $1,515 $1,645 $1,625 Decline |
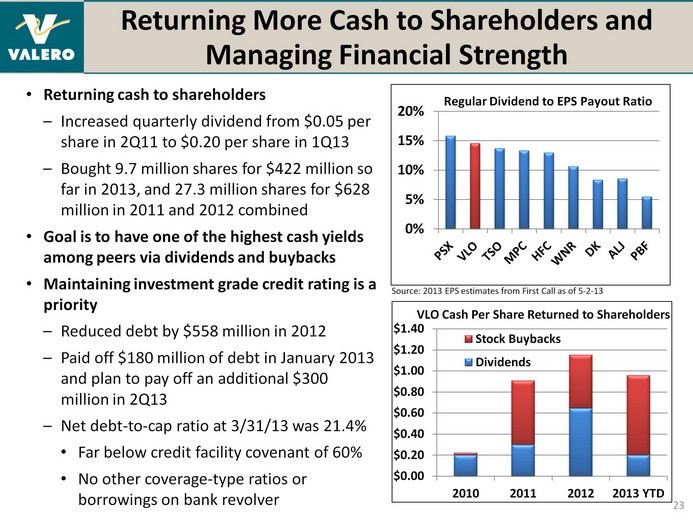
| (CHART) Returning More Cash to Shareholders and Managing Financial Strength Returning cash to shareholders Increased quarterly dividend from $0.05 per share in 2Q11 to $0.20 per share in 1Q13 Bought 9.7 million shares for $422 million so far in 2013, and 27.3 million shares for $628 million in 2011 and 2012 combined Goal is to have one of the highest cash yields among peers via dividends and buybacks Maintaining investment grade credit rating is a priority Reduced debt by $558 million in 2012 Paid off $180 million of debt in January 2013 and plan to pay off an additional $300 million in 2Q13 Net debt-to-cap ratio at 3/31/13 was 21.4% Far below credit facility covenant of 60% No other coverage-type ratios or borrowings on bank revolver 23 VLO Cash Per Share Returned to Shareholders (CHART) Source: 2013 EPS estimates from First Call as of 5-2-13 |
| Valero's Strategic Priorities 24 Constant focus on safety, environmental, and regulatory compliance Produce quality products in safe, reliable, and environmentally responsible manner Maintain investment grade credit rating and continue to reduce debt Select/optimize financial structure for our assets and financial market demands Continue improvement in refining performance to 1st quartile levels Continue cost reduction efforts - must be low-cost producer to prosper in commodity businesses Invest in projects with sustainable competitive advantages Build on our manufacturing base Export capability Adjust crude slate capability Return cash to shareholders Goal: Increase long-term shareholder value |
| We Believe Valero Is an Excellent Buy Today Well-positioned to benefit from changing market trends Atlantic Basin capacity closures have improved refining fundamentals Benefiting from strong export market/strong competitive position of U.S. refining Expect abundant U.S. shale and Canadian crude oil production to provide a cost advantage to U.S. Gulf Coast refiners versus foreign and U.S. East and West Coast refiners Investing in projects to improve access and capability to process local, cost- advantaged crude oils Valero's hydrocracker projects take advantage of low-cost natural gas and high distillate demand and margins Improving performance of refining portfolio Key growth projects and falling capital expenditures should contribute significant free cash flow in 2013 and 2014 Expect to return more cash to shareholders Goal to have one of the highest cash yields among peers (buybacks and dividends) Retail spin, basically dividend to shareholders 25 |
| Appendix 26 |

| Ethanol Segment Total nameplate production capacity of 1.1 billion gallons per year Built position for average of only 35% of estimated replacement cost 2Q09: Acquired 7 plants with 780 million gallons per year of world- scale capacity in advantaged locations 1Q10: Added 3 plants with 330 million gallons per year of capacity Valero's low-cost acquisitions of high-quality plants imply a competitive advantage in any margin environment 27 (CHART) Note: 2013 YTD EBITDA through 1Q13 |
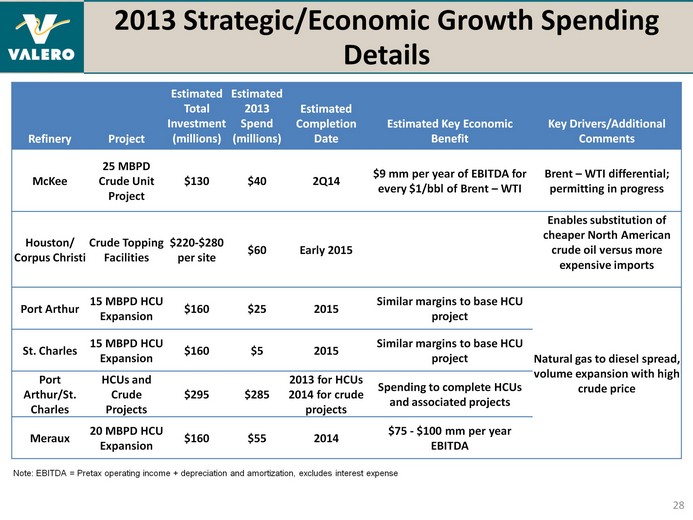
| Refinery Project Estimated Total Investment (millions) Estimated 2013 Spend (millions) Estimated Completion Date Estimated Key Economic Benefit Key Drivers/Additional Comments McKee 25 MBPD Crude Unit Project $130 $40 2Q14 $9 mm per year of EBITDA for every $1/bbl of Brent - WTI Brent - WTI differential; permitting in progress Houston/ Corpus Christi Crude Topping Facilities $220-$280 per site $60 Early 2015 Enables substitution of cheaper North American crude oil versus more expensive imports Port Arthur 15 MBPD HCU Expansion $160 $25 2015 Similar margins to base HCU project Natural gas to diesel spread, volume expansion with high crude price St. Charles 15 MBPD HCU Expansion $160 $5 2015 Similar margins to base HCU project Natural gas to diesel spread, volume expansion with high crude price Port Arthur/St. Charles HCUs and Crude Projects $295 $285 2013 for HCUs 2014 for crude projects Spending to complete HCUs and associated projects Natural gas to diesel spread, volume expansion with high crude price Meraux 20 MBPD HCU Expansion $160 $55 2014 $75 - $100 mm per year EBITDA Natural gas to diesel spread, volume expansion with high crude price 2013 Strategic/Economic Growth Spending Details 28 Note: EBITDA = Pretax operating income + depreciation and amortization, excludes interest expense |
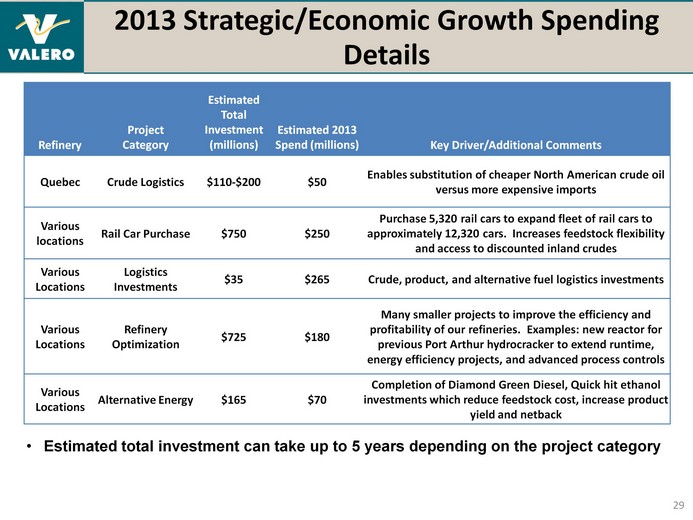
| Refinery Project Category Estimated Total Investment (millions) Estimated 2013 Spend (millions) Key Driver/Additional Comments Quebec Crude Logistics $110-$200 $50 Enables substitution of cheaper North American crude oil versus more expensive imports Various locations Rail Car Purchase $750 $250 Purchase 5,320 rail cars to expand fleet of rail cars to approximately 12,320 cars. Increases feedstock flexibility and access to discounted inland crudes Various Locations Logistics Investments $35 $265 Crude, product, and alternative fuel logistics investments Various Locations Refinery Optimization $725 $180 Many smaller projects to improve the efficiency and profitability of our refineries. Examples: new reactor for previous Port Arthur hydrocracker to extend runtime, energy efficiency projects, and advanced process controls Various Locations Alternative Energy $165 $70 Completion of Diamond Green Diesel, Quick hit ethanol investments which reduce feedstock cost, increase product yield and netback 2013 Strategic/Economic Growth Spending Details 29 Estimated total investment can take up to 5 years depending on the project category |
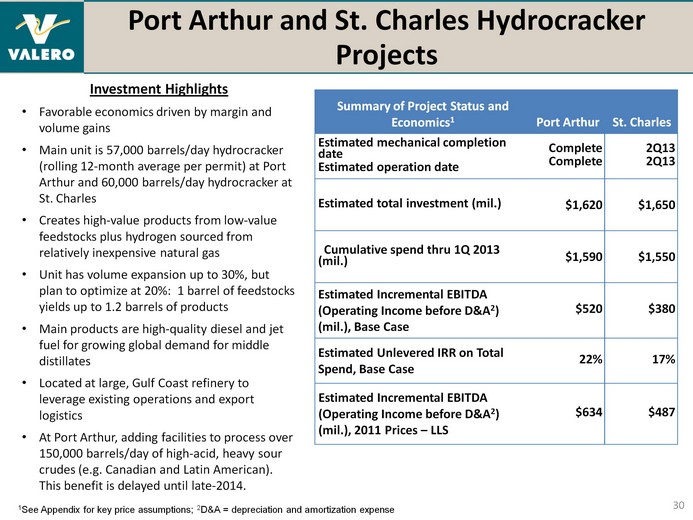
| Port Arthur and St. Charles Hydrocracker Projects Investment Highlights Favorable economics driven by margin and volume gains Main unit is 57,000 barrels/day hydrocracker (rolling 12-month average per permit) at Port Arthur and 60,000 barrels/day hydrocracker at St. Charles Creates high-value products from low-value feedstocks plus hydrogen sourced from relatively inexpensive natural gas Unit has volume expansion up to 30%, but plan to optimize at 20%: 1 barrel of feedstocks yields up to 1.2 barrels of products Main products are high-quality diesel and jet fuel for growing global demand for middle distillates Located at large, Gulf Coast refinery to leverage existing operations and export logistics At Port Arthur, adding facilities to process over 150,000 barrels/day of high-acid, heavy sour crudes (e.g. Canadian and Latin American). This benefit is delayed until late-2014. 30 Summary of Project Status and Economics1 Port Arthur St. Charles Estimated mechanical completion date Estimated operation date Complete Complete 2Q13 2Q13 Estimated total investment (mil.) $1,620 $1,650 Cumulative spend thru 1Q 2013 (mil.) $1,590 $1,550 Estimated Incremental EBITDA (Operating Income before D&A2) (mil.), Base Case $520 $380 Estimated Unlevered IRR on Total Spend, Base Case 22% 17% Estimated Incremental EBITDA (Operating Income before D&A2) (mil.), 2011 Prices - LLS $634 $487 1See Appendix for key price assumptions; 2D&A = depreciation and amortization expense |
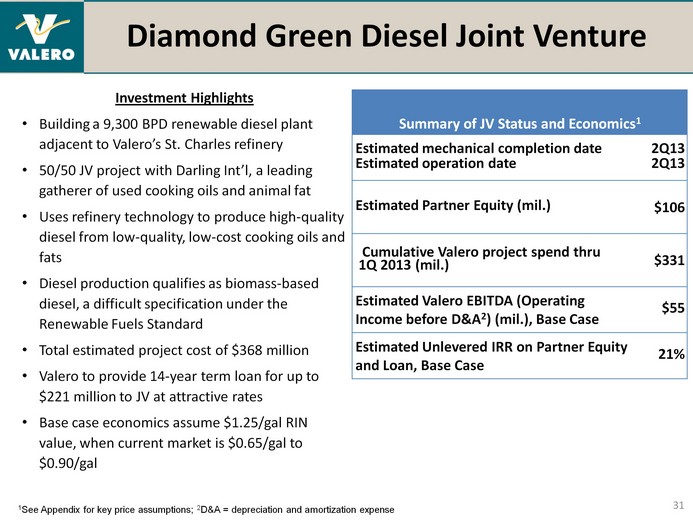
| Diamond Green Diesel Joint Venture Investment Highlights Building a 9,300 BPD renewable diesel plant adjacent to Valero's St. Charles refinery 50/50 JV project with Darling Int'l, a leading gatherer of used cooking oils and animal fat Uses refinery technology to produce high-quality diesel from low-quality, low-cost cooking oils and fats Diesel production qualifies as biomass-based diesel, a difficult specification under the Renewable Fuels Standard Total estimated project cost of $368 million Valero to provide 14-year term loan for up to $221 million to JV at attractive rates Base case economics assume $1.25/gal RIN value, when current market is $0.65/gal to $0.90/gal 31 Summary of JV Status and Economics1 Summary of JV Status and Economics1 Summary of JV Status and Economics1 Estimated mechanical completion date Estimated operation date 2Q13 2Q13 2Q13 2Q13 Estimated Partner Equity (mil.) $106 $106 Cumulative Valero project spend thru 1Q 2013 (mil.) $331 $331 Estimated Valero EBITDA (Operating Income before D&A2) (mil.), Base Case Estimated Valero EBITDA (Operating Income before D&A2) (mil.), Base Case $55 Estimated Unlevered IRR on Partner Equity and Loan, Base Case Estimated Unlevered IRR on Partner Equity and Loan, Base Case 21% 1See Appendix for key price assumptions; 2D&A = depreciation and amortization expense |
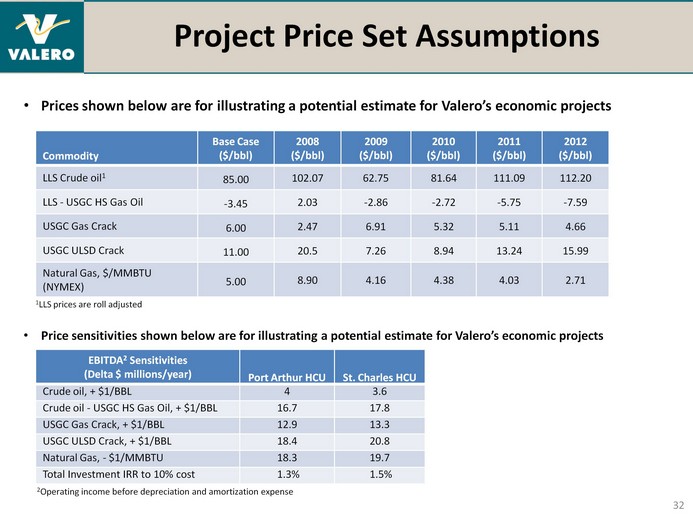
| Project Price Set Assumptions 32 Commodity Base Case ($/bbl) 2008 ($/bbl) 2009 ($/bbl) 2010 ($/bbl) 2011 ($/bbl) 2012 ($/bbl) LLS Crude oil1 85.00 102.07 62.75 81.64 111.09 112.20 LLS - USGC HS Gas Oil -3.45 2.03 -2.86 -2.72 -5.75 -7.59 USGC Gas Crack 6.00 2.47 6.91 5.32 5.11 4.66 USGC ULSD Crack 11.00 20.5 7.26 8.94 13.24 15.99 Natural Gas, $/MMBTU (NYMEX) 5.00 8.90 4.16 4.38 4.03 2.71 Prices shown below are for illustrating a potential estimate for Valero's economic projects 1LLS prices are roll adjusted EBITDA2 Sensitivities (Delta $ millions/year) Port Arthur HCU St. Charles HCU Crude oil, + $1/BBL 4 3.6 Crude oil - USGC HS Gas Oil, + $1/BBL 16.7 17.8 USGC Gas Crack, + $1/BBL 12.9 13.3 USGC ULSD Crack, + $1/BBL 18.4 20.8 Natural Gas, - $1/MMBTU 18.3 19.7 Total Investment IRR to 10% cost 1.3% 1.5% Price sensitivities shown below are for illustrating a potential estimate for Valero's economic projects 2Operating income before depreciation and amortization expense |
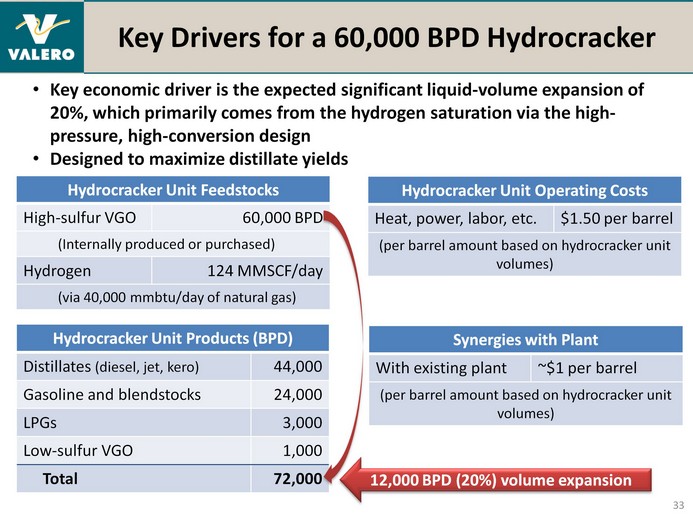
| 12,000 BPD (20%) volume expansion Hydrocracker Unit Operating Costs Hydrocracker Unit Operating Costs Heat, power, labor, etc. $1.50 per barrel (per barrel amount based on hydrocracker unit volumes) (per barrel amount based on hydrocracker unit volumes) Synergies with Plant Synergies with Plant With existing plant ~$1 per barrel (per barrel amount based on hydrocracker unit volumes) (per barrel amount based on hydrocracker unit volumes) Key Drivers for a 60,000 BPD Hydrocracker 33 Key economic driver is the expected significant liquid-volume expansion of 20%, which primarily comes from the hydrogen saturation via the high- pressure, high-conversion design Designed to maximize distillate yields Hydrocracker Unit Products (BPD) Hydrocracker Unit Products (BPD) Distillates (diesel, jet, kero) 44,000 Gasoline and blendstocks 24,000 LPGs 3,000 Low-sulfur VGO 1,000 Total 72,000 Hydrocracker Unit Feedstocks Hydrocracker Unit Feedstocks High-sulfur VGO 60,000 BPD (Internally produced or purchased) (Internally produced or purchased) Hydrogen 124 MMSCF/day (via 40,000 mmbtu/day of natural gas) (via 40,000 mmbtu/day of natural gas) |
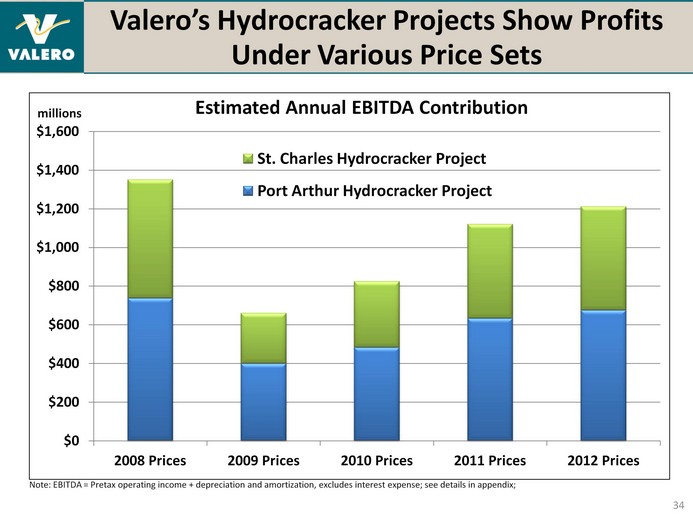
| Valero's Hydrocracker Projects Show Profits Under Various Price Sets Under Various Price Sets Under Various Price Sets 34 Note: EBITDA = Pretax operating income + depreciation and amortization, excludes interest expense; see details in appendix; millions |
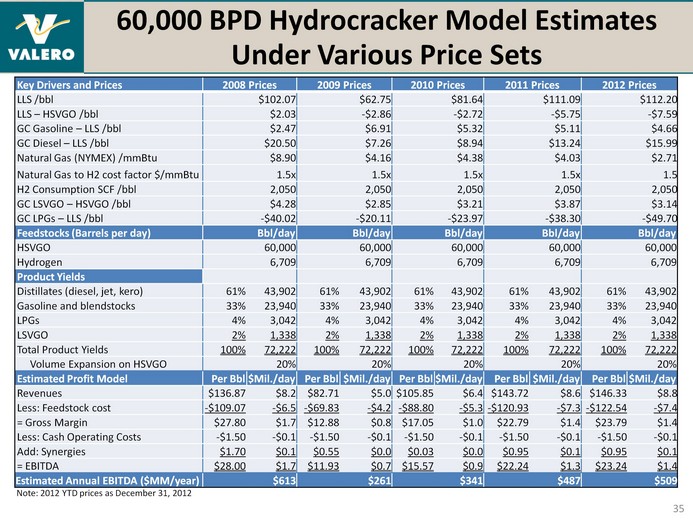
| 60,000 BPD Hydrocracker Model Estimates Under Various Price Sets 35 Key Drivers and Prices 2008 Prices 2008 Prices 2009 Prices 2009 Prices 2010 Prices 2010 Prices 2011 Prices 2011 Prices 2012 Prices 2012 Prices LLS /bbl $102.07 $62.75 $81.64 $111.09 $112.20 LLS - HSVGO /bbl $2.03 -$2.86 -$2.72 -$5.75 -$7.59 GC Gasoline - LLS /bbl $2.47 $6.91 $5.32 $5.11 $4.66 GC Diesel - LLS /bbl $20.50 $7.26 $8.94 $13.24 $15.99 Natural Gas (NYMEX) /mmBtu $8.90 $4.16 $4.38 $4.03 $2.71 Natural Gas to H2 cost factor $/mmBtu 1.5x 1.5x 1.5x 1.5x 1.5 H2 Consumption SCF /bbl 2,050 2,050 2,050 2,050 2,050 GC LSVGO - HSVGO /bbl $4.28 $2.85 $3.21 $3.87 $3.14 GC LPGs - LLS /bbl -$40.02 -$20.11 -$23.97 -$38.30 -$49.70 Feedstocks (Barrels per day) Bbl/day Bbl/day Bbl/day Bbl/day Bbl/day HSVGO 60,000 60,000 60,000 60,000 60,000 Hydrogen 6,709 6,709 6,709 6,709 6,709 Product Yields Distillates (diesel, jet, kero) 61% 43,902 61% 43,902 61% 43,902 61% 43,902 61% 43,902 Gasoline and blendstocks 33% 23,940 33% 23,940 33% 23,940 33% 23,940 33% 23,940 LPGs 4% 3,042 4% 3,042 4% 3,042 4% 3,042 4% 3,042 LSVGO 2% 1,338 2% 1,338 2% 1,338 2% 1,338 2% 1,338 Total Product Yields 100% 72,222 100% 72,222 100% 72,222 100% 72,222 100% 72,222 Volume Expansion on HSVGO 20% 20% 20% 20% 20% Estimated Profit Model Per Bbl $Mil./day Per Bbl $Mil./day Per Bbl $Mil./day Per Bbl $Mil./day Per Bbl $Mil./day Revenues $136.87 $8.2 $82.71 $5.0 $105.85 $6.4 $143.72 $8.6 $146.33 $8.8 Less: Feedstock cost -$109.07 -$6.5 -$69.83 -$4.2 -$88.80 -$5.3 -$120.93 -$7.3 -$122.54 -$7.4 = Gross Margin $27.80 $1.7 $12.88 $0.8 $17.05 $1.0 $22.79 $1.4 $23.79 $1.4 Less: Cash Operating Costs -$1.50 -$0.1 -$1.50 -$0.1 -$1.50 -$0.1 -$1.50 -$0.1 -$1.50 -$0.1 Add: Synergies $1.70 $0.1 $0.55 $0.0 $0.03 $0.0 $0.95 $0.1 $0.95 $0.1 = EBITDA $28.00 $1.7 $11.93 $0.7 $15.57 $0.9 $22.24 $1.3 $23.24 $1.4 Estimated Annual EBITDA ($MM/year) $613 $261 $341 $487 $509 Note: 2012 YTD prices as December 31, 2012 |
| RINflation! - Expect Consumers to Pay Higher Cost of RFS Mandate 36 Situation RFS mandates a specific volume of renewable fuels to be blended with gasoline and diesel Due to lower annual gasoline demand, the mandated renewable volume exceeds the possible blended volume (E-10 and E-85), creating the "Blend Wall" for gasoline Renewable Identification Numbers (RINs) are used to show compliance with mandate RFS mandate is unfair and favors companies that blend more gasoline and diesel than they produce Impact As industry approaches the Blend Wall, the price of ethanol RINs has increased dramatically from 3 cents per gallon in 2012 to more than $1 per gallon, and have recently traded at about $0.75 - $0.80 per gallon Expect higher prices for gasoline and diesel due to flow-through of higher RINs cost and: High RIN prices economically encourage exports and can lower imports of gasoline and diesel Lower imports and higher exports can reduce supplies and cause fuel prices to increase Valero is impacted as a significant spot seller of unblended gasoline Estimated 2013 RFS compliance cost is between $500 million and $750 million based on recent RINs prices and range of volumes depending on obligation, production, exports, and carryovers Solution EPA's unworkable plan is to use E-15 for vehicles from model year 2001 and newer, but car manufacturers and others in car and small engine industries are not supportive of E-15 The real solution is to either 1) Drop RFS, 2) Reduce RFS, or 3) Move responsibility for compliance from producers/importers to blenders |
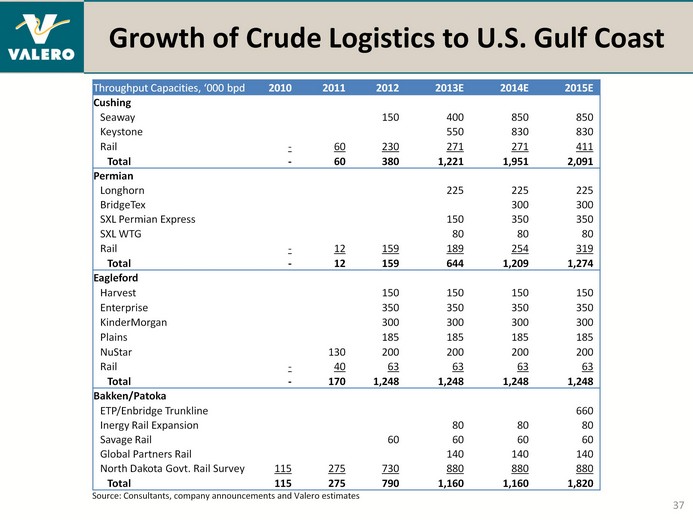
| Growth of Crude Logistics to U.S. Gulf Coast 37 Throughput Capacities, '000 bpd 2010 2011 2012 2013E 2014E 2015E Cushing Seaway 150 400 850 850 Keystone 550 830 830 Rail - 60 230 271 271 411 Total - 60 380 1,221 1,951 2,091 Permian Longhorn 225 225 225 BridgeTex 300 300 SXL Permian Express 150 350 350 SXL WTG 80 80 80 Rail - 12 159 189 254 319 Total - 12 159 644 1,209 1,274 Eagleford Harvest 150 150 150 150 Enterprise 350 350 350 350 KinderMorgan 300 300 300 300 Plains 185 185 185 185 NuStar 130 200 200 200 200 Rail - 40 63 63 63 63 Total - 170 1,248 1,248 1,248 1,248 Bakken/Patoka ETP/Enbridge Trunkline 660 Inergy Rail Expansion 80 80 80 Savage Rail 60 60 60 60 Global Partners Rail 140 140 140 North Dakota Govt. Rail Survey 115 275 730 880 880 880 Total 115 275 790 1,160 1,160 1,820 Source: Consultants, company announcements and Valero estimates |
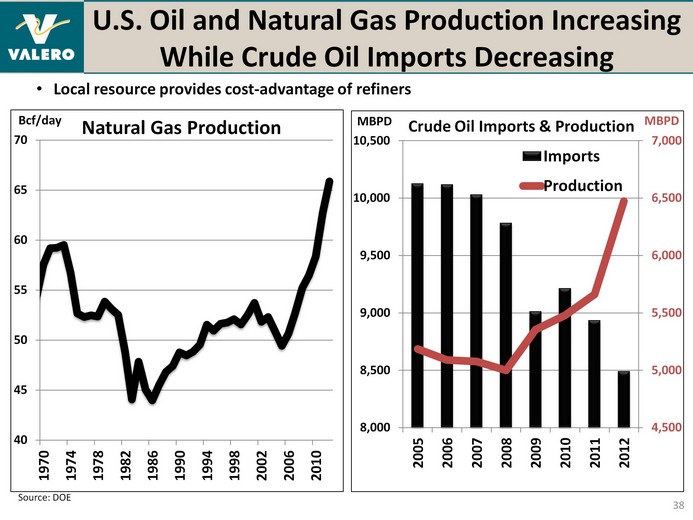
| U.S. Oil and Natural Gas Production Increasing While Crude Oil Imports Decreasing While Crude Oil Imports Decreasing While Crude Oil Imports Decreasing 38 Source: DOE (CHART) Local resource provides cost-advantage of refiners |

| *Partial closure of refinery captured in capacity Note: This data represents refineries currently closed, ownership may choose to restart or sell listed refinery Sources: Industry and Consultant reports and Valero estimates 1The Petit Couronne refinery has shut completely when processing deal with Shell ended in December 2012 2Alon announced the closure of these refineries for economic reasons, may restart Global Refining Capacity Rationalization 39 Location Owner CDU Capacity Closed (MBPD) Year Closed Perth Amboy, NJ Chevron 80 2008 Bakersfield,CA Big West 65 2008 Westville, NJ Sunoco 145 2009 Bloomfield, NM Western 17 2009 Teesside, UK Petroplus 117 2009 Gonfreville, France* Total 100 2009 Dunkirk, France Total 140 2009 Japan* Nippon Oil 205 2009 Toyama, Japan Nihonkai Oil 57 2009 Arpechim, Romania * Petrom 70 2009 Cartagena* REPSOL 100 2009 Bilboa* REPSOL 100 2009 Arpechim, Romania OMV 70 2010 Japan* Cosmo 94 2010 Nadvornaja, Ukraine Privat Group 50 2010 Montreal, Canada1 Shell 130 2010 Yorktown, Virginia Western 65 2010 Reichstett, France Petroplus 85 2010 Wilhemshaven, Germany Phillips 66 260 2010 Ingolstadt, Germany Bayernoil 90 2010 Cremona, Italy Tamoil 94 2011 St. Croix, U.S.V.I,* Hovensa 150 2011 Funshun, China PetroChina 70 2011 Location Owner CDU Capacity Closed (MBPD) Year Closed Keihin Ohgimachi, Japan Showa Shell 120 2011 Clyde, Australia Shell 75 2011 Porto Marghera, Italy ENI 70 2011 Marcus Hook, PA Sunoco 175 2011 Harburg, Germany Shell 107 2012 Berre, France LyondellBassel 105 2012 Coryton, U.K. Petroplus 220 2012 Petit Couronne, France1 Petroplus 160 2012 St. Croix, U.S.V.I Hovensa 350 2012 Aruba Valero 235 2012 Rome, Italy TotalErg 82 2012 Fawley, U.K.* ExxonMobil 80 2012 Trecate, Italy* ExxonMobil 70 2012 Paramo, Czech Republic Unipetrol 20 2012 Lisichansk, Ukraine TNK-BP 175 2012 Bakersfield/Paramount, CA Alon 90 2012 Ewa Beach, Hawaii Tesoro 94 2013 Port Reading, NJ Hess N/A 2013 Venice, Italy ENI 80 2013 Sakaide, Japan Cosmo Oil 140 2013 Japan Indemitsu Kosan 100 2014 Japan Nippon 200 2014 Kurnell, Australia Caltex 135 2014 Kawasaki, Japan Tonen- General 105 2014 |
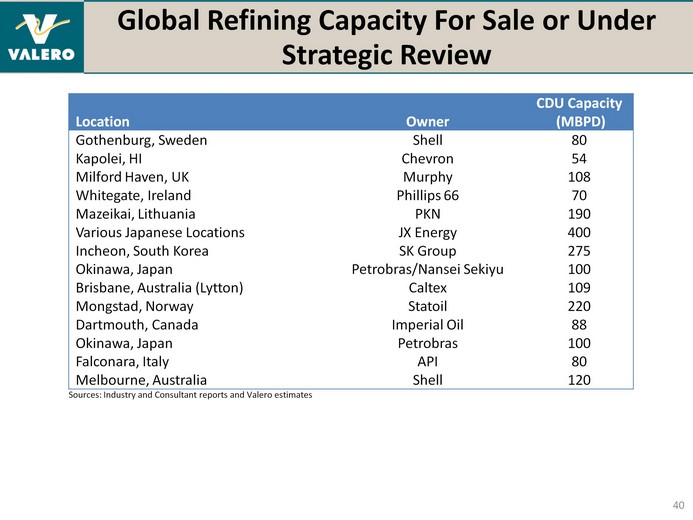
| Global Refining Capacity For Sale or Under Strategic Review 40 Location Owner CDU Capacity (MBPD) Gothenburg, Sweden Shell 80 Kapolei, HI Chevron 54 Milford Haven, UK Murphy 108 Whitegate, Ireland Phillips 66 70 Mazeikai, Lithuania PKN 190 Various Japanese Locations JX Energy 400 Incheon, South Korea SK Group 275 Okinawa, Japan Petrobras/Nansei Sekiyu 100 Brisbane, Australia (Lytton) Caltex 109 Mongstad, Norway Statoil 220 Dartmouth, Canada Imperial Oil 88 Okinawa, Japan Petrobras 100 Falconara, Italy API 80 Melbourne, Australia Shell 120 Sources: Industry and Consultant reports and Valero estimates |
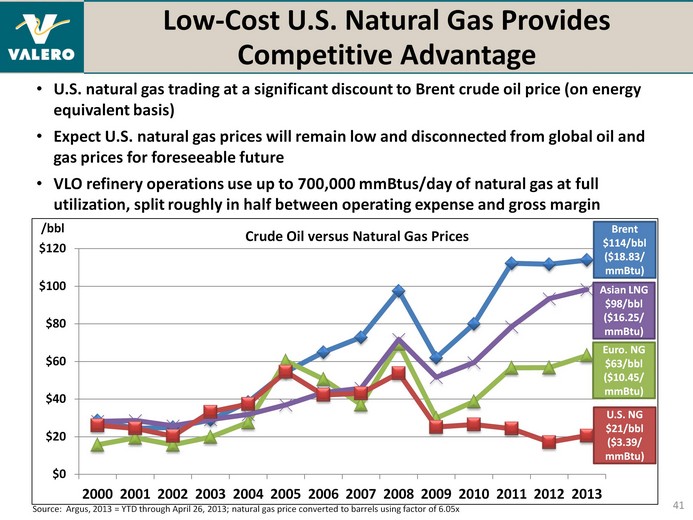
| Low-Cost U.S. Natural Gas Provides Competitive Advantage 41 U.S. natural gas trading at a significant discount to Brent crude oil price (on energy equivalent basis) Expect U.S. natural gas prices will remain low and disconnected from global oil and gas prices for foreseeable future VLO refinery operations use up to 700,000 mmBtus/day of natural gas at full utilization, split roughly in half between operating expense and gross margin (CHART) Source: Argus, 2013 = YTD through April 26, 2013; natural gas price converted to barrels using factor of 6.05x Brent $114/bbl ($18.83/ mmBtu) U.S. NG $21/bbl ($3.39/ mmBtu) Asian LNG $98/bbl ($16.25/ mmBtu) Euro. NG $63/bbl ($10.45/ mmBtu) /bbl |

| (CHART) Gasoline Fundamentals 42 (CHART) USGC LLS Gasoline Crack (per bbl) U.S. Gasoline Demand (mmbpd) (CHART) Source: Argus; 2013 data through April 26 Source: DOE weekly data; 2012 data through week ending April 26 Source: DOE weekly data; 2012 data through week ending April 26 U.S. Gasoline Days of Supply U.S. Net Imports of Gasoline and Blendstocks (mbpd) Source: DOE monthly data; 2013 data through February 2013 |
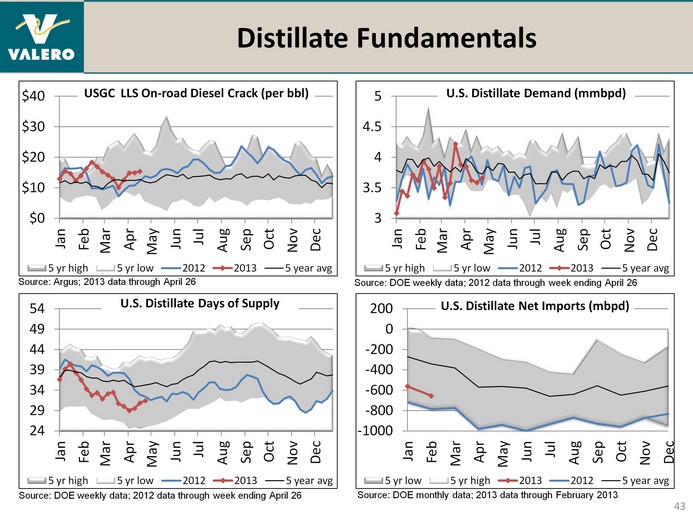
| Distillate Fundamentals 43 43 (CHART) USGC LLS On-road Diesel Crack (per bbl) U.S. Distillate Demand (mmbpd) (CHART) (CHART) Source: Argus; 2013 data through April 26 Source: DOE weekly data; 2012 data through week ending April 26 Source: DOE weekly data; 2012 data through week ending April 26 Source: DOE monthly data; 2013 data through February 2013 U.S. Distillate Days of Supply U.S. Distillate Net Imports (mbpd) |

| U.S. Transport Indicators 44 Latest data Week 16, 2013 (CHART) (CHART) |
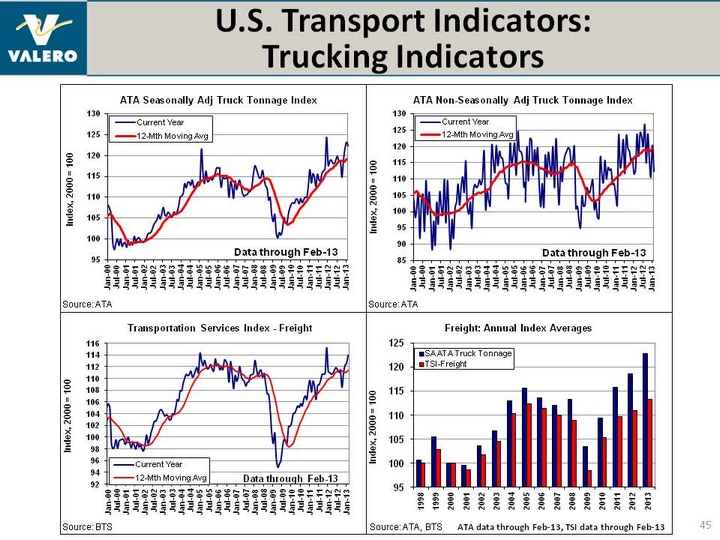
| U.S. Transport Indicators: Trucking Indicators 45 (CHART) (CHART) (CHART) (CHART) ATA data through Feb-13, TSI data through Feb-13 |
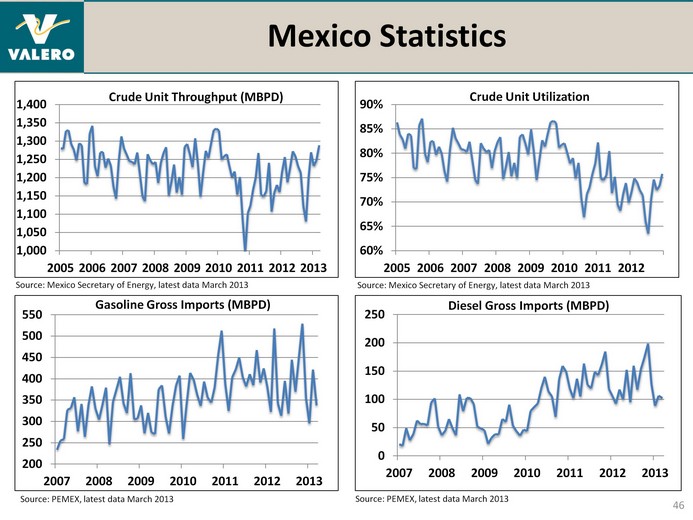
| (CHART) (CHART) Mexico Statistics Diesel Gross Imports (MBPD) Source: PEMEX, latest data March 2013 Gasoline Gross Imports (MBPD) Source: PEMEX, latest data March 2013 (CHART) Crude Unit Throughput (MBPD) Crude Unit Utilization (CHART) 46 Source: Mexico Secretary of Energy, latest data March 2013 Source: Mexico Secretary of Energy, latest data March 2013 |
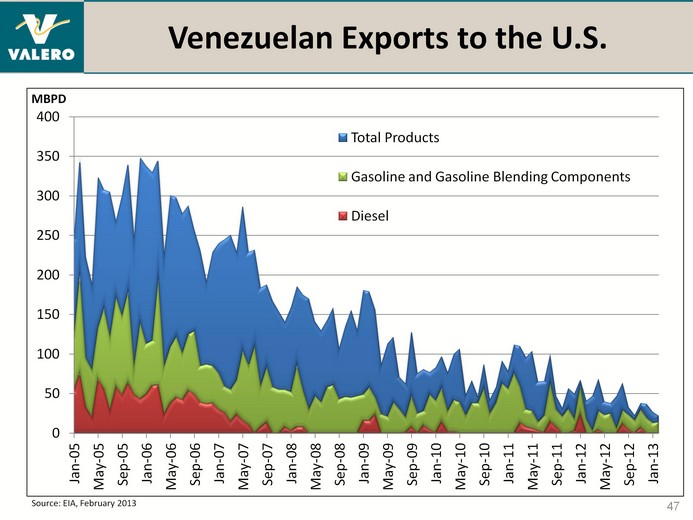
| Venezuelan Exports to the U.S. 47 (CHART) Source: EIA, February 2013 |
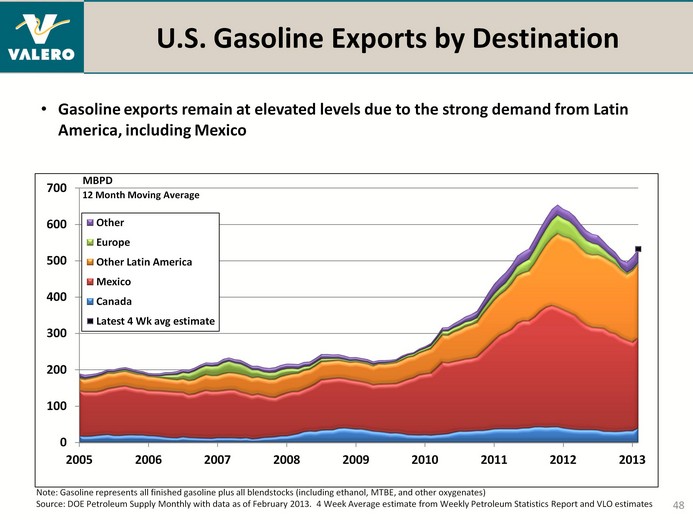
| (CHART) U.S. Gasoline Exports by Destination Gasoline exports remain at elevated levels due to the strong demand from Latin America, including Mexico Note: Gasoline represents all finished gasoline plus all blendstocks (including ethanol, MTBE, and other oxygenates) Source: DOE Petroleum Supply Monthly with data as of February 2013. 4 Week Average estimate from Weekly Petroleum Statistics Report and VLO estimates MBPD 48 12 Month Moving Average |

| U.S. Gasoline Imports by Source Gasoline imports have declined steadily since 2007 Note: Gasoline represents all finished gasoline plus all blendstocks (including ethanol, MTBE, and other oxygenates) Source: DOE Petroleum Supply Monthly with data as of February 2013. 4 Week Average estimate from Weekly Petroleum Statistics Report and VLO estimates Shutdown of the Atlantic Basin refineries will keep pressure on this trend 49 (CHART) MBPD 12 Month Moving Average |
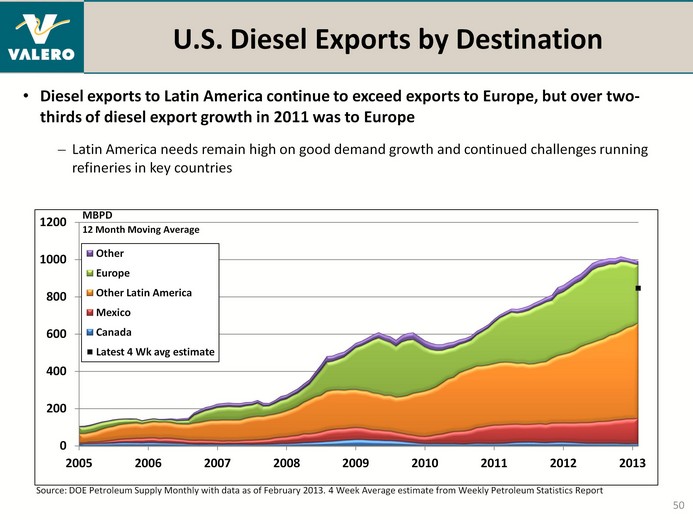
| U.S. Diesel Exports by Destination Diesel exports to Latin America continue to exceed exports to Europe, but over two- thirds of diesel export growth in 2011 was to Europe Source: DOE Petroleum Supply Monthly with data as of February 2013. 4 Week Average estimate from Weekly Petroleum Statistics Report Latin America needs remain high on good demand growth and continued challenges running refineries in key countries 50 (CHART) MBPD 12 Month Moving Average |
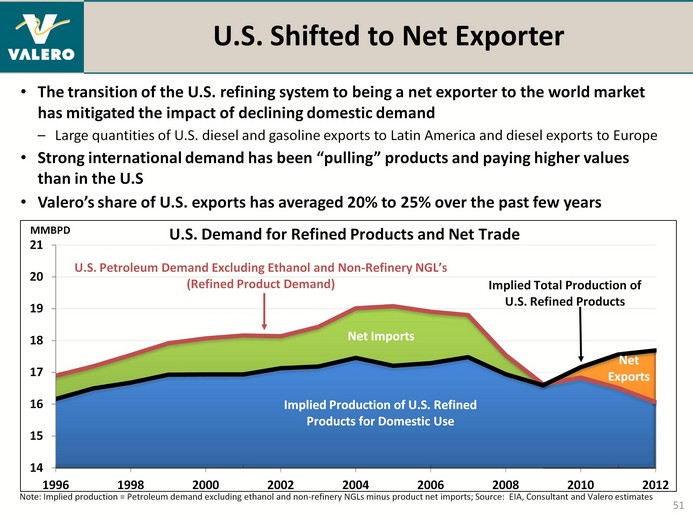
| The transition of the U.S. refining system to being a net exporter to the world market has mitigated the impact of declining domestic demand Large quantities of U.S. diesel and gasoline exports to Latin America and diesel exports to Europe Strong international demand has been "pulling" products and paying higher values than in the U.S Valero's share of U.S. exports has averaged 20% to 25% over the past few years U.S. Shifted to Net Exporter 51 (CHART) U.S. Demand for Refined Products and Net Trade MMBPD U.S. Petroleum Demand Excluding Ethanol and Non-Refinery NGL's (Refined Product Demand) Net Imports Net Exports Implied Total Production of U.S. Refined Products Note: Implied production = Petroleum demand excluding ethanol and non-refinery NGLs minus product net imports; Source: EIA, Consultant and Valero estimates Implied Production of U.S. Refined Products for Domestic Use |
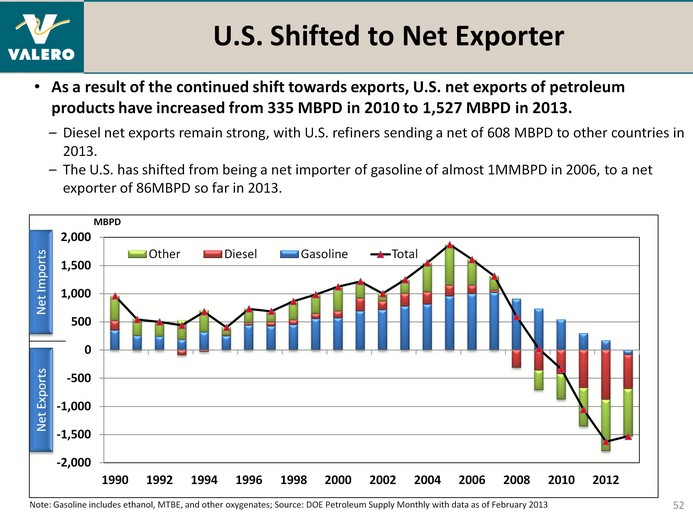
| (CHART) U.S. Shifted to Net Exporter Net Imports Net Exports Note: Gasoline includes ethanol, MTBE, and other oxygenates; Source: DOE Petroleum Supply Monthly with data as of February 2013 MBPD Diesel net exports remain strong, with U.S. refiners sending a net of 608 MBPD to other countries in 2013. The U.S. has shifted from being a net importer of gasoline of almost 1MMBPD in 2006, to a net exporter of 86MBPD so far in 2013. As a result of the continued shift towards exports, U.S. net exports of petroleum products have increased from 335 MBPD in 2010 to 1,527 MBPD in 2013. 52 |

| (CHART) U.S. Competitively Exporting into Growing Markets Source: DOE Petroleum Supply Monthly with data as of February 2013, Latin America includes South and Central America plus Mexico U.S. has become a net exporter of refined products due to growth in developing countries, Atlantic Basin capacity closures, Western European diesel demand, and Latin American refining operating issues U.S. Gulf Coast (PADD III) is the largest source of exported products Latin America continues to be the largest U.S. export market, followed by Western Europe (CHART) U. S. Product Exports By Destination U. S. Product Exports By Source MMBPD 12 Month Moving Average 53 |
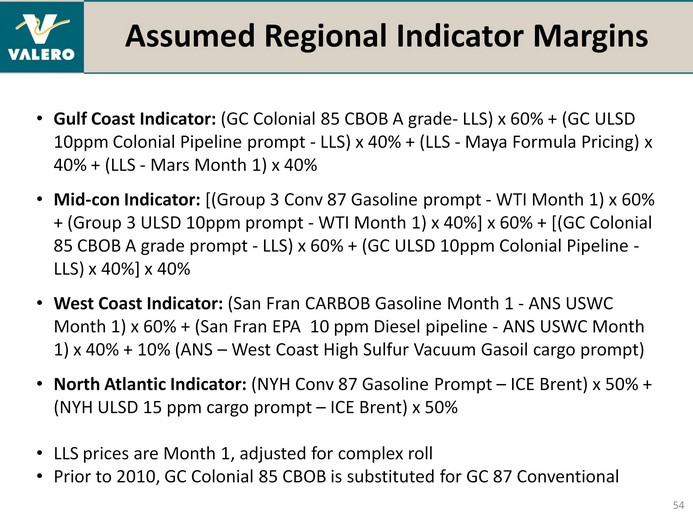
| Assumed Regional Indicator Margins Gulf Coast Indicator: (GC Colonial 85 CBOB A grade- LLS) x 60% + (GC ULSD 10ppm Colonial Pipeline prompt - LLS) x 40% + (LLS - Maya Formula Pricing) x 40% + (LLS - Mars Month 1) x 40% Mid-con Indicator: [(Group 3 Conv 87 Gasoline prompt - WTI Month 1) x 60% + (Group 3 ULSD 10ppm prompt - WTI Month 1) x 40%] x 60% + [(GC Colonial 85 CBOB A grade prompt - LLS) x 60% + (GC ULSD 10ppm Colonial Pipeline - LLS) x 40%] x 40% West Coast Indicator: (San Fran CARBOB Gasoline Month 1 - ANS USWC Month 1) x 60% + (San Fran EPA 10 ppm Diesel pipeline - ANS USWC Month 1) x 40% + 10% (ANS - West Coast High Sulfur Vacuum Gasoil cargo prompt) North Atlantic Indicator: (NYH Conv 87 Gasoline Prompt - ICE Brent) x 50% + (NYH ULSD 15 ppm cargo prompt - ICE Brent) x 50% LLS prices are Month 1, adjusted for complex roll Prior to 2010, GC Colonial 85 CBOB is substituted for GC 87 Conventional 54 |

| Investor Relations Contacts For more information, please contact: Ashley Smith, CFA, CPA Vice President, Investor Relations 210.345.2744 ashley.smith@valero.com Matthew Jackson Investor Relations Specialist 210.345.2564 matthew.jackson@valero.com 55 |