|
Exhibit 99.01 
|
Investor Presentation Credit Suisse Energy Summit
February 2014
Safe Harbor Statement
Statements contained in this presentation that state the company’s or management’s expectations or predictions of the future are forward–looking statements intended to be covered by the safe harbor provisions of the Securities Act of 1933 and the Securities Exchange Act of 1934. The words “believe,” “expect,” “should,” “estimates,” “intend,” and other similar expressions identify forward–looking statements. It is important to note that actual results could differ materially from those projected in such forward–looking statements. For more information concerning factors that could cause actual results to differ from those expressed or forecasted, see Valero’s annual reports on Form 10-K and quarterly reports on Form 10-Q, filed with the Securities and Exchange Commission, and available on Valero’s website at www.valero.com.
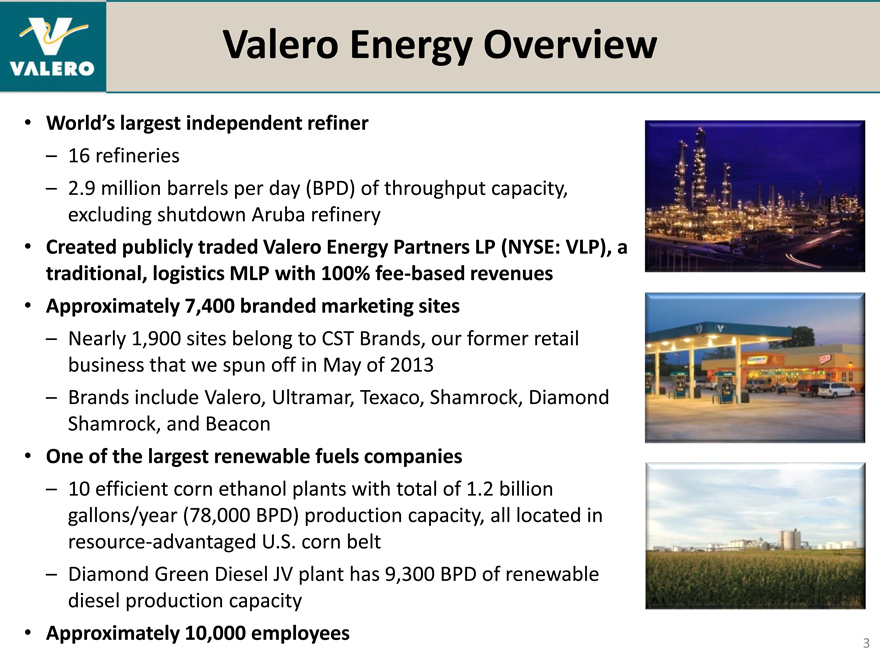
Valero Energy Overview
• | | World’s largest independent refiner |
– 16 refineries
– 2.9 million barrels per day (BPD) of throughput capacity, excluding shutdown Aruba refinery
• | | Created publicly traded Valero Energy Partners LP (NYSE: VLP), a traditional, logistics MLP with 100% fee-based revenues |
• | | Approximately 7,400 branded marketing sites |
– Nearly 1,900 sites belong to CST Brands, our former retail business that we spun off in May of 2013
– Brands include Valero, Ultramar, Texaco, Shamrock, Diamond Shamrock, and Beacon
• | | One of the largest renewable fuels companies |
– 10 efficient corn ethanol plants with total of 1.2 billion gallons/year (78,000 BPD) production capacity, all located in resource-advantaged U.S. corn belt
– Diamond Green Diesel JV plant has 9,300 BPD of renewable diesel production capacity
• | | Approximately 10,000 employees |
Valero’s Geographically Diverse Operations
Refinery Capacities
(000 bpd) Nelson Index
Total Through-put Crude Oil
Corpus Christi 325 205 19.9
Houston 165 90 15.1
Meraux 135 135 10.3
Port Arthur 350 330 12.6
St. Charles 280 190 17.5
Texas City 250 225 11.1
Three Rivers 100 95 12.4
Gulf Coast 1,605 1,270 14.1
Ardmore 90 86 12.1
McKee 170 168 9.5
Memphis 195 180 7.9
Mid-Con 455 434 9.3
Pembroke 270 220 9.7
Quebec City 235 230 7.7
North Atlantic 505 450 8.7
Benicia 170 145 16.1
Wilmington 135 85 15.8
West Coast 305 230 16.0
Total or Avg. 2,870 2,384 12.4
Suspended refinery operations in March 2012 235,000 bpd capacity, Nelson Index of 8
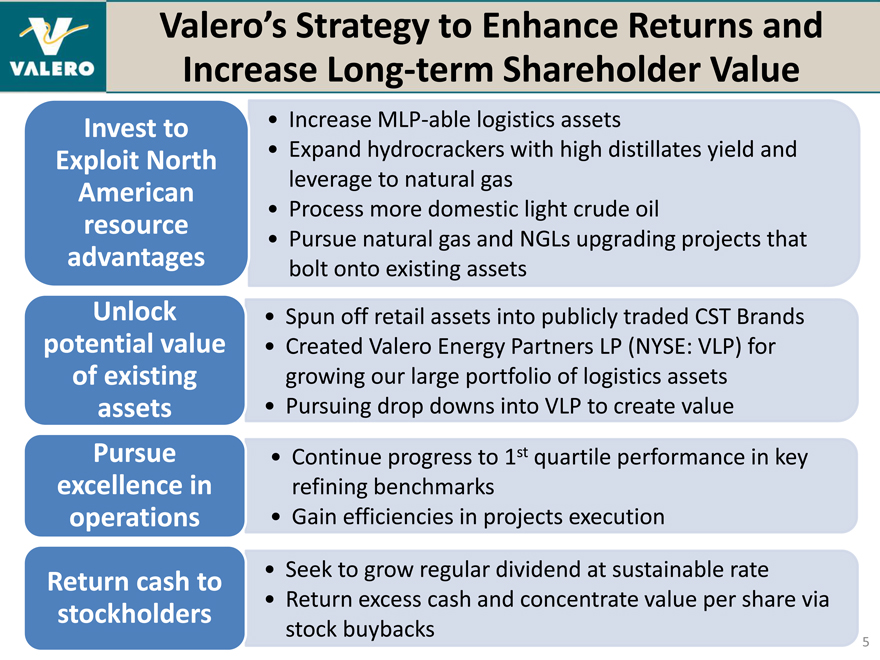
Valero’s Strategy to Enhance Returns and Increase Long-term Shareholder Value
Invest to • Increase MLP-able logistics assets
Exploit North • Expand hydrocrackers with high distillates yield and American leverage to natural gas
• | | Process more domestic light crude oil |
resource
• | | Pursue natural gas and NGLs upgrading projects that advantages bolt onto existing assets Unlock Spun off retail assets into publicly traded CST Brands potential value Created Valero Energy Partners LP (NYSE: VLP) for of existing growing our large portfolio of logistics assets assets Pursuing drop downs into VLP to create value Pursue Continue progress to 1st quartile performance in key excellence in refining benchmarks operations Gain efficiencies in projects execution Return cash to Seek to grow regular dividend at sustainable rate stockholders Return excess cash and concentrate value per share via stock buybacks |
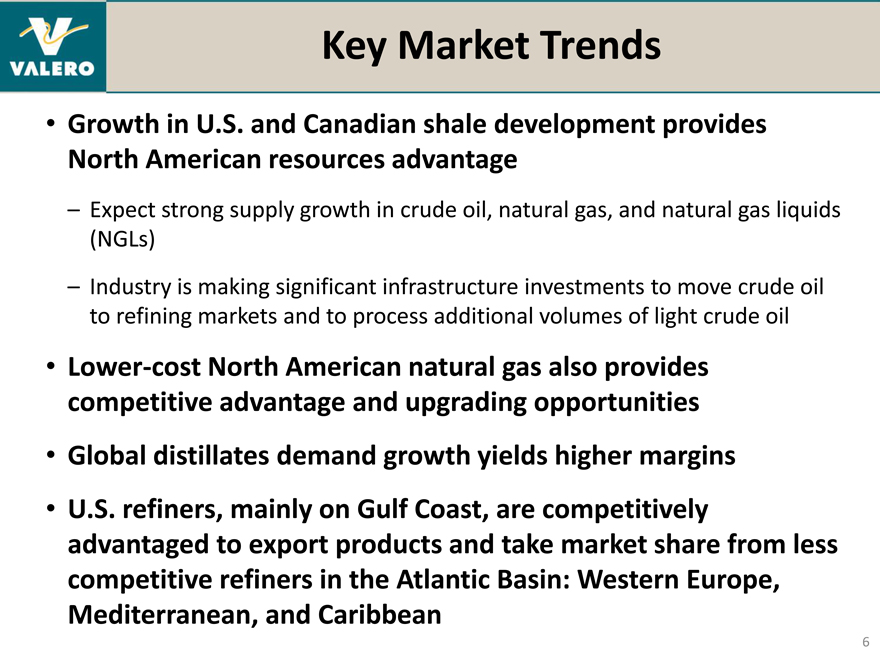
Key Market Trends
• | | Growth in U.S. and Canadian shale development provides North American resources advantage |
– Expect strong supply growth in crude oil, natural gas, and natural gas liquids (NGLs)
– Industry is making significant infrastructure investments to move crude oil to refining markets and to process additional volumes of light crude oil
• | | Lower-cost North American natural gas also provides competitive advantage and upgrading opportunities |
• | | Global distillates demand growth yields higher margins |
• | | U.S. refiners, mainly on Gulf Coast, are competitively advantaged to export products and take market share from less competitive refiners in the Atlantic Basin: Western Europe, Mediterranean, and Caribbean |
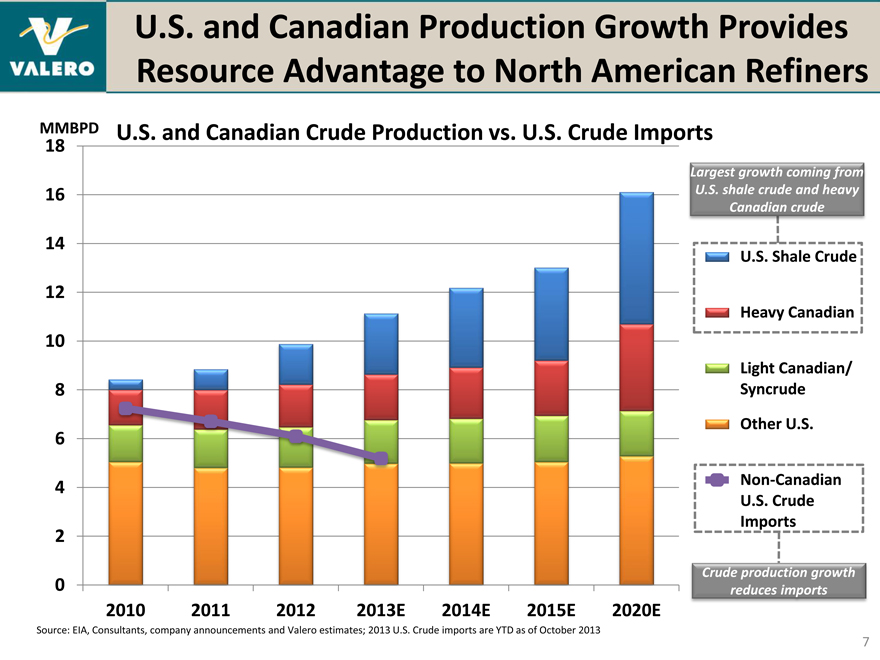
U.S. and Canadian Production Growth Provides Resource Advantage to North American Refiners
U.S. and Canadian Crude Production vs. U.S. Crude Imports
MMBPD
18 16 14 12 10 8 6 4 2 0
2010 2011 2012 2013E 2014E 2015E 2020E
Source: EIA, Consultants, company announcements and Valero estimates; 2013 U.S. Crude imports are YTD as of October 2013
Largest growth coming from
U.S. shale crude and heavy
Canadian crude
U.S. Shale Crude
Heavy Canadian
Light Canadian/
Syncrude
Other U.S.
Non-Canadian
U.S. Crude
Imports
Crude production growth
reduces imports
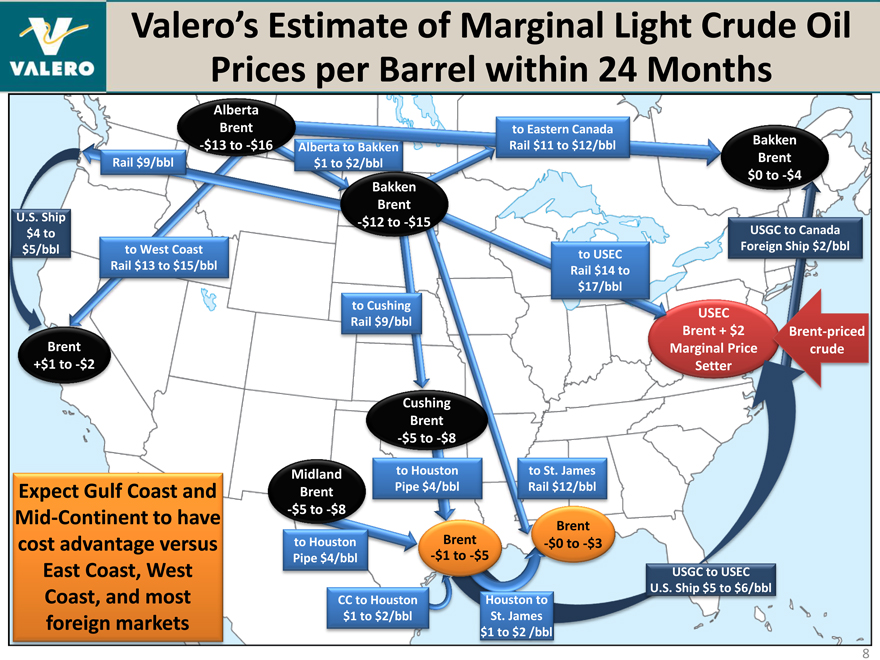
Valero’s Estimate of Marginal Light Crude Oil Prices per Barrel within 24 Months
Alberta
Brent to Eastern Canada
-$13 to -$16 Rail $11 to $12/bbl Bakken
Rail $9/bbl Brent $0 to -$4 Bakken
U.S. Ship Brent
-$12 to -$15 $4 to USGC to Canada $5/bbl to West Coast Foreign Ship $2/bbl to USEC
Rail $13 to $15/bbl Rail $14 to $17/bbl to Cushing USEC
Rail $9/bbl
Brent + $2 Brent-priced Brent Marginal Price crude
+$1 to -$2
Cushing Brent
-$5 to -$8
Midland to Houston to St. James Expect Gulf Coast and Brent Pipe $4/bbl Rail $12/bbl
Mid-Continent to have -$5 to -$8
Brent Brent
cost advantage versus to Houston -$0 to -$3
Pipe $4/bbl -$1 to -$5
East Coast, West USGC to USEC
Coast, and most U.S. Ship $5 to $6/bbl CC to Houston Houston to foreign markets $1 to $2/bbl St. James $1 to $2 /bbl
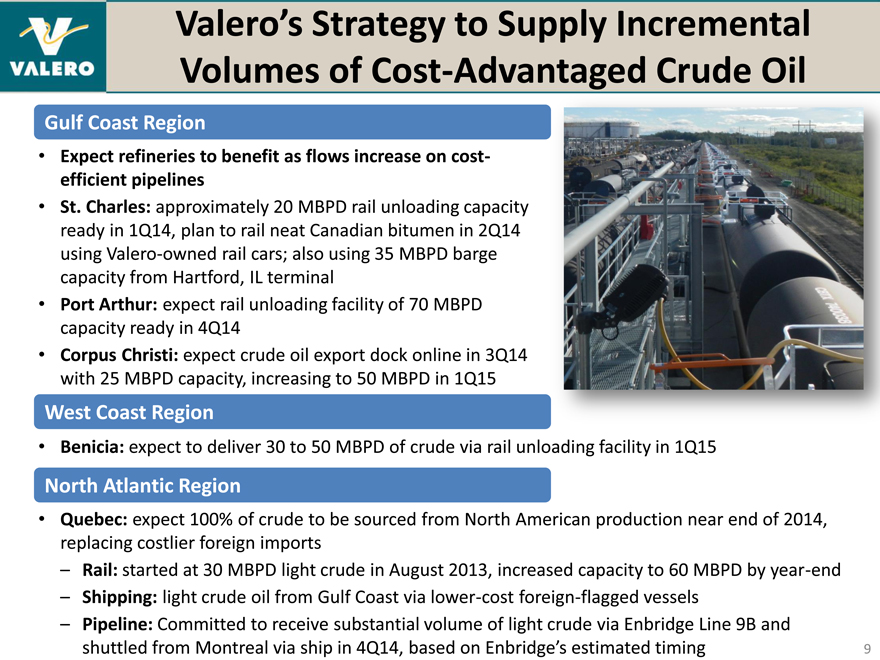
Valero’s Strategy to Supply Incremental Volumes of Cost-Advantaged Crude Oil
Gulf Coast Region
• | | Expect refineries to benefit as flows increase on cost-efficient pipelines |
• | | St. Charles: approximately 20 MBPD rail unloading capacity ready in 1Q14, plan to rail neat Canadian bitumen in 2Q14 using Valero-owned rail cars; also using 35 MBPD barge capacity from Hartford, IL terminal |
• | | Port Arthur: expect rail unloading facility of 70 MBPD capacity ready in 4Q14 |
• | | Corpus Christi: expect crude oil export dock online in 3Q14 with 25 MBPD capacity, increasing to 50 MBPD in 1Q15 |
West Coast Region
• | | Benicia: expect to deliver 30 to 50 MBPD of crude via rail unloading facility in 1Q15 |
North Atlantic Region
• | | Quebec: expect 100% of crude to be sourced from North American production near end of 2014, replacing costlier foreign imports |
– Rail: started at 30 MBPD light crude in August 2013, increased capacity to 60 MBPD by year-end
– Shipping: light crude oil from Gulf Coast via lower-cost foreign-flagged vessels
– Pipeline: Committed to receive substantial volume of light crude via Enbridge Line 9B and shuttled from Montreal via ship in 4Q14, based on Enbridge’s estimated timing
9
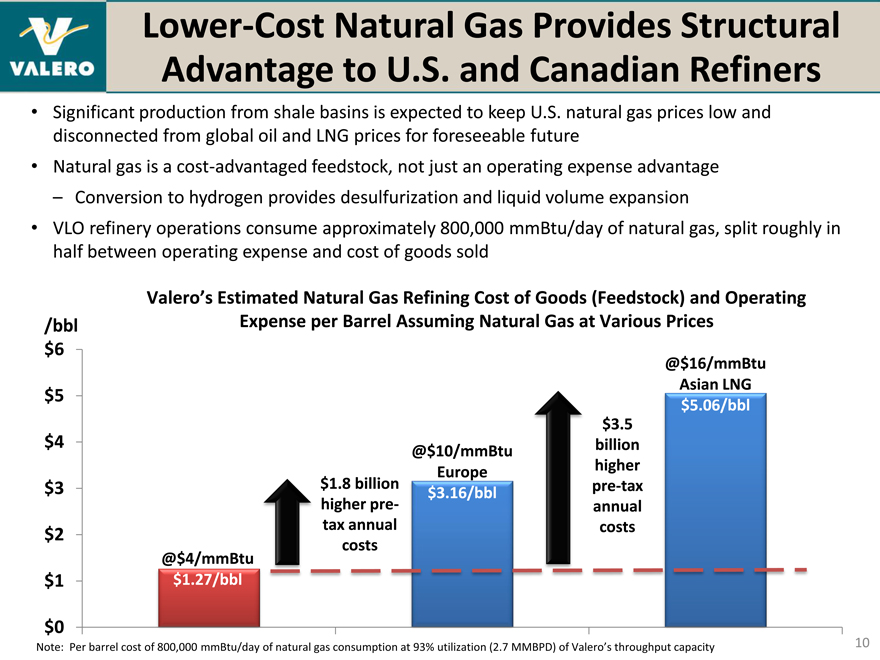
Lower-Cost Natural Gas Provides Structural Advantage to U.S. and Canadian Refiners
Significant production from shale basins is expected to keep U.S. natural gas prices low and disconnected from global oil and LNG prices for foreseeable future
Natural gas is a cost-advantaged feedstock, not just an operating expense advantage – Conversion to hydrogen provides desulfurization and liquid volume expansion
VLO refinery operations consume approximately 800,000 mmBtu/day of natural gas, split roughly in half between operating expense and cost of goods sold
Valero’s Estimated Natural Gas Refining Cost of Goods (Feedstock) and Operating
/bbl Expense per Barrel Assuming Natural Gas at Various Prices
$ 6
@$16/mmBtu
Asian LNG
$ 5 $5.06/bbl
$3.5
$ 4 @$ 10/mmBtu billion
Europe higher
$ 3 $1.8 billion $3.16/bbl pre-tax
higher pre- annual
$ 2 tax annual costs
costs
@$4/mmBtu
$ 1 $1.27/bbl
$ 0
Note: Per barrel cost of 800,000 mmBtu/day of natural gas consumption at 93% utilization (2.7 MMBPD) of Valero’s throughput capacity
10
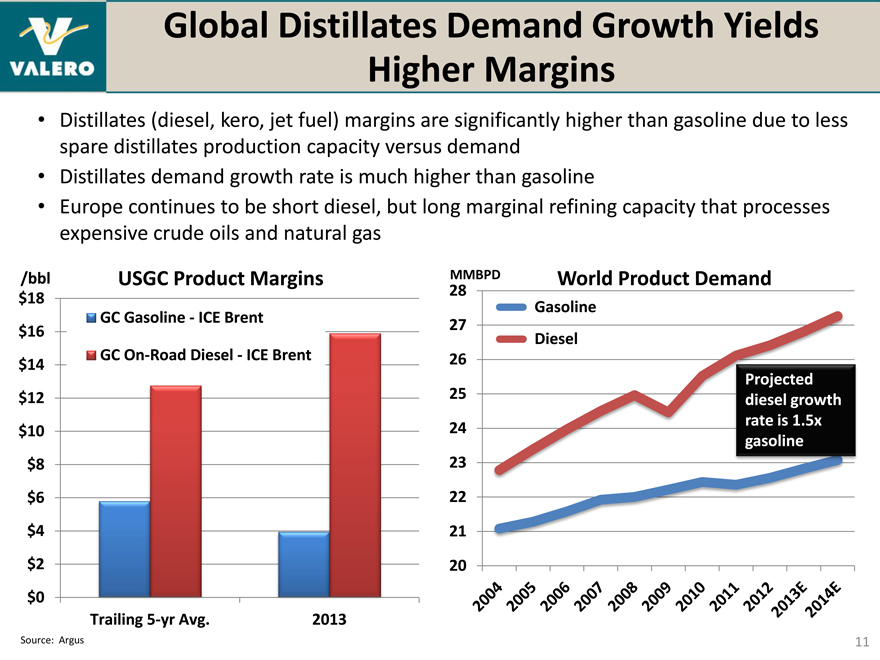
Global Distillates Demand Growth Yields Higher Margins
• | | Distillates (diesel, kero, jet fuel) margins are significantly higher than gasoline due to less spare distillates production capacity versus demand |
• | | Distillates demand growth rate is much higher than gasoline |
• | | Europe continues to be short diesel, but long marginal refining capacity that processes expensive crude oils and natural gas |
/bbl USGC Product Margins
$18
GC Gasoline—ICE Brent $16 GC On-Road Diesel—ICE Brent $14 $12 $10 $8 $6 $4 $2 $0 Trailing 5-yr Avg. 2013
Source: Argus
28 MMBPD World Product Demand
Gasoline 27 Diesel 26
Projected 25 diesel growth 24 rate is 1.5x gasoline 23 22 21 20
11
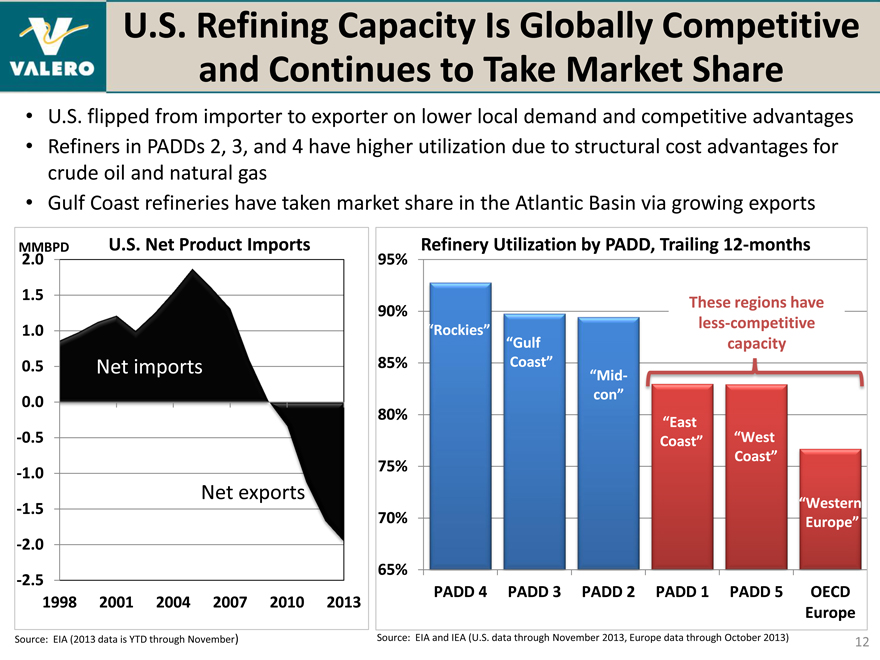
U.S. Refining Capacity Is Globally Competitive and Continues to Take Market Share
• | | U.S. flipped from importer to exporter on lower local demand and competitive advantages |
• | | Refiners in PADDs 2, 3, and 4 have higher utilization due to structural cost advantages for crude oil and natural gas |
• | | Gulf Coast refineries have taken market share in the Atlantic Basin via growing exports |
MMBPD U.S. Net Product Imports
2.0
1.5
1.0
0.0
-0.5
-1.0
Net exports
-1.5
-2.0
-2.5
1998 2001 2004 2007 2010 2013
Refinery Utilization by PADD, Trailing 12-months
95%
90% These regions have
“Rockies” less-competitive
“Gulf capacity
85% Coast”
“Mid-
con”
80% “East
Coast” “West
75% Coast”
“Western
70% Europe”
65%
PADD 4 PADD 3 PADD 2 PADD 1 PADD 5 OECD
Europe
Source: EIA (2013 data is YTD through November)
Source: EIA and IEA (U.S. data through November 2013, Europe data through October 2013)
12
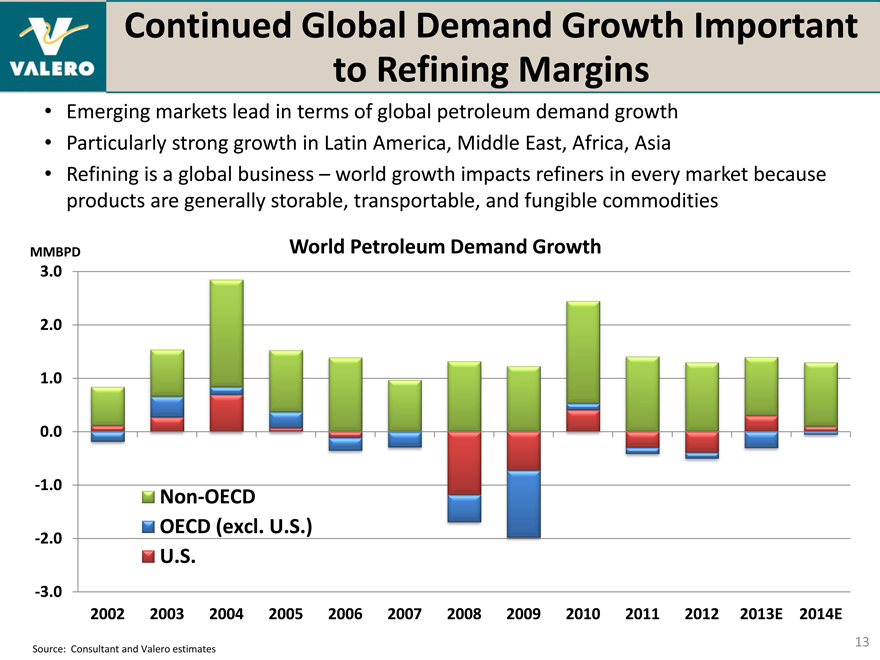
Continued Global Demand Growth Important to Refining Margins
• | | Emerging markets lead in terms of global petroleum demand growth |
• | | Particularly strong growth in Latin America, Middle East, Africa, Asia |
• | | Refining is a global business – world growth impacts refiners in every market because products are generally storable, transportable, and fungible commodities |
MMBPD World Petroleum Demand Growth
3.0
2.0
1.0
0.0
U.S.
-3.0
2002 2003 2004 2005 2006 2007 2008 2009 2010 2011 2012 2013E 2014E
Source: Consultant and Valero estimates
13
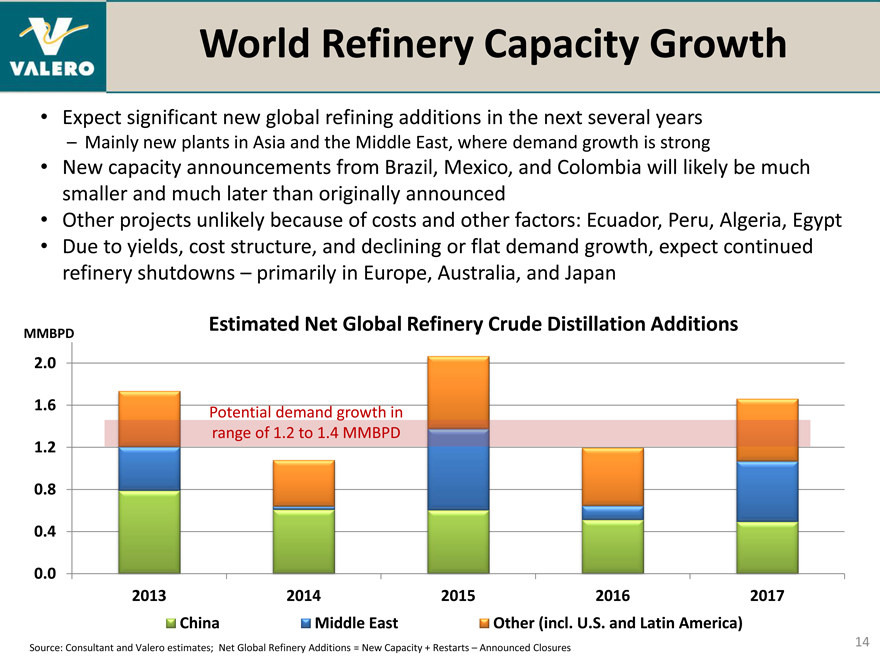
World Refinery Capacity Growth
• | | Expect significant new global refining additions in the next several years |
– Mainly new plants in Asia and the Middle East, where demand growth is strong
• | | New capacity announcements from Brazil, Mexico, and Colombia will likely be much smaller and much later than originally announced |
• | | Other projects unlikely because of costs and other factors: Ecuador, Peru, Algeria, Egypt |
• | | Due to yields, cost structure, and declining or flat demand growth, expect continued refinery shutdowns – primarily in Europe, Australia, and Japan |
MMBPD Estimated Net Global Refinery Crude Distillation Additions
2.0
1.6 | | Potential demand growth in |
range of 1.2 to 1.4 MMBPD
1.2
0.8
0.4
0.0
2013 2014 2015 2016 2017
China Middle East Other (incl. U.S. and Latin America)
Source: Consultant and Valero estimates; Net Global Refinery Additions = New Capacity + Restarts – Announced Closures
14
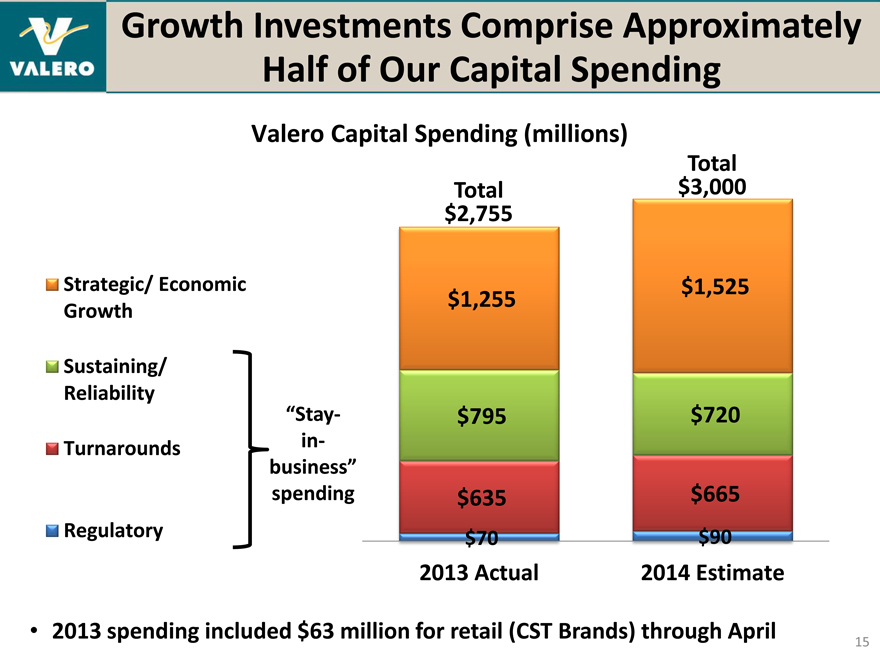
Growth Investments Comprise Approximately Half of Our Capital Spending
Valero Capital Spending (millions)
Total Total $3,000 $2,755
Strategic/ Economic $1,525
$1,255
Growth
Sustaining/
Reliability “Stay-
$795 $720
Turnarounds in- business”
spending $635 $665
Regulatory $70 $90
2013 Actual 2014 Estimate
• | | 2013 spending included $63 million for retail (CST Brands) through April |
15
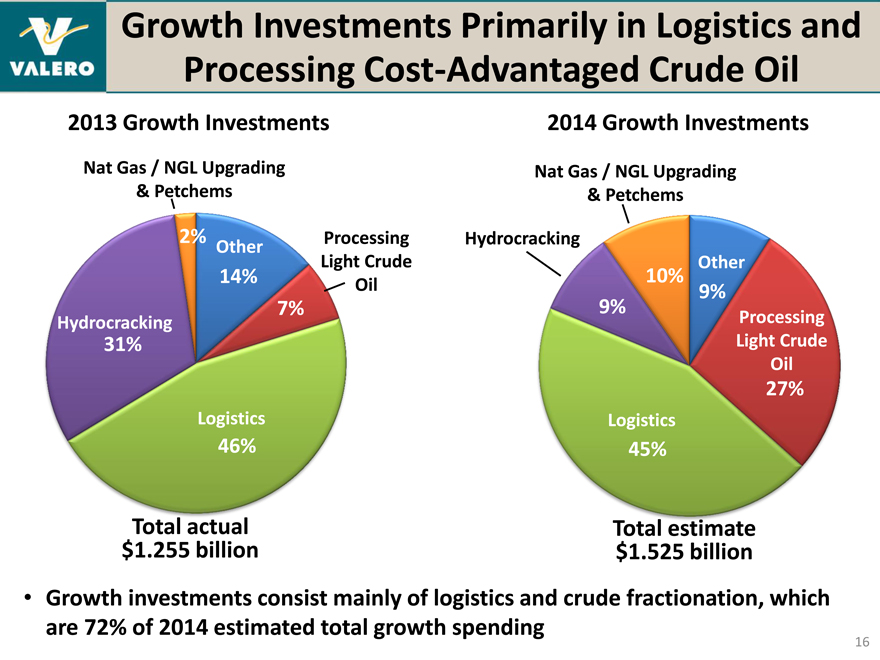
Growth Investments Primarily in Logistics and Processing Cost-Advantaged Crude Oil
2013 Growth Investments
Nat Gas / NGL Upgrading
& Petchems
2% Processing Other Light Crude
14% Oil 7%
Hydrocracking
31%
Logistics
46%
Total actual $1.255 billion
2014 Growth Investments
Nat Gas / NGL Upgrading
& Petchems
Hydrocracking
Other
10% 9% 9%
Processing Light Crude Oil
27%
Logistics
45%
Total estimate $1.525 billion
• | | Growth investments consist mainly of logistics and crude fractionation, which are 72% of 2014 estimated total growth spending |
16
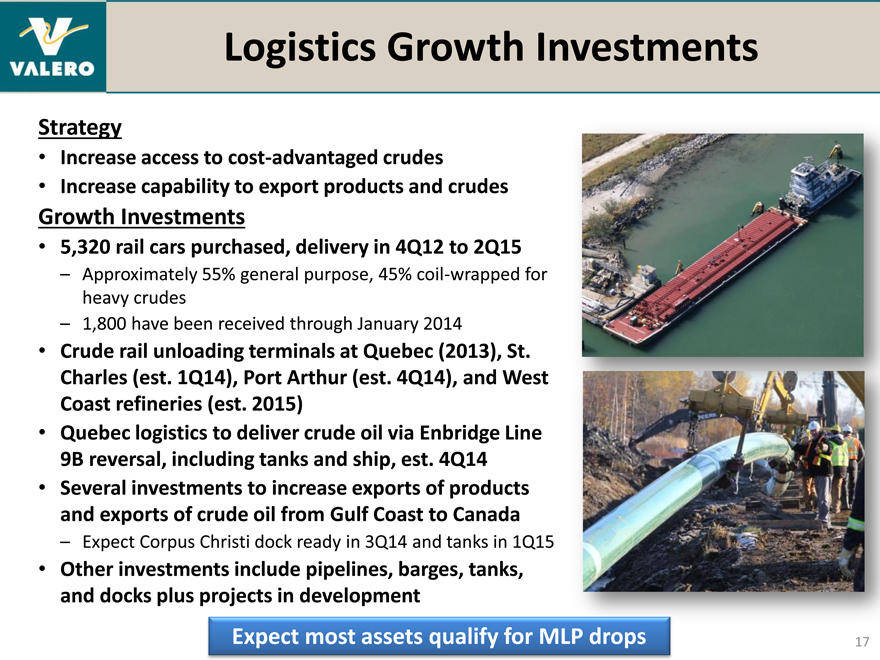
Logistics Growth Investments
Strategy
• | | Increase access to cost-advantaged crudes |
• | | Increase capability to export products and crudes S |
Growth Investments
• | | 5,320 rail cars purchased, delivery in 4Q12 to 2Q15 |
– Approximately 55% general purpose, 45% coil-wrapped for heavy crudes
– 1,800 have been received through January 2014
• | | Crude rail unloading terminals at Quebec (2013), St. Charles (est. 1Q14), Port Arthur (est. 4Q14), and West Coast refineries (est. 2015) |
• | | Quebec logistics to deliver crude oil via Enbridge Line 9B reversal, including tanks and ship, est. 4Q14 |
• | | Several investments to increase exports of products and exports of crude oil from Gulf Coast to Canada |
– Expect Corpus Christi dock ready in 3Q14 and tanks in 1Q15
• | | Other investments include pipelines, barges, tanks, and docks plus projects in development |
Expect most assets qualify for MLP drops
17
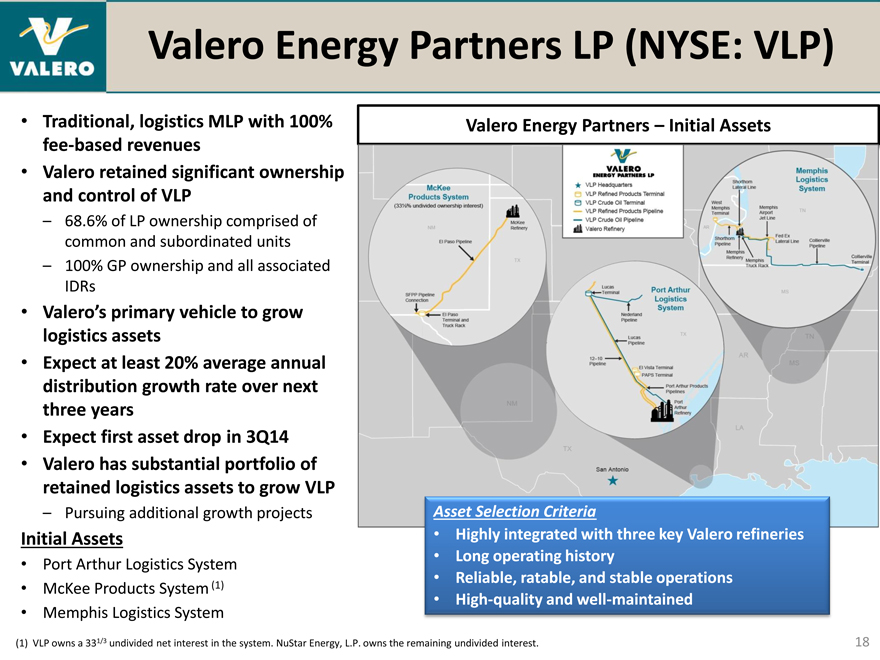
Valero Energy Partners LP (NYSE: VLP)
Traditional, logistics MLP with 100% fee-based revenues
Valero retained significant ownership and control of VLP
– 68.6% of LP ownership comprised of common and subordinated units
– 100% GP ownership and all associated IDRs
Valero’s primary vehicle to grow logistics assets
Expect at least 20% average annual distribution growth rate over next three years
Expect first asset drop in 3Q14
Valero has substantial portfolio of retained logistics assets to grow VLP
– Pursuing additional growth projects
Initial Assets
Port Arthur Logistics System
McKee Products System (1)
Memphis Logistics System
Valero Energy Partners – Initial Assets
Asset Selection Criteria
Highly integrated with three key Valero refineries
Long operating history
Reliable, ratable, and stable operations
High-quality and well-maintained
(1) VLP owns a 331/3 undivided net interest in the system. NuStar Energy, L.P. owns the remaining undivided interest.
18
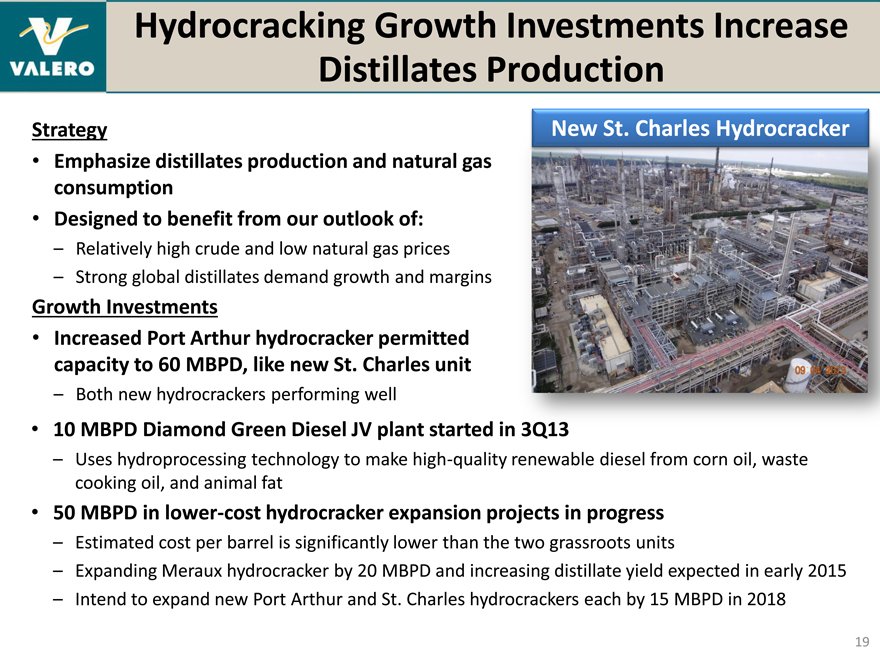
Hydrocracking Growth Investments Increase Distillates Production
Strategy New St. Charles Hydrocracker
Emphasize distillates production and natural gas consumption
Designed to benefit from our outlook of:
– Relatively high crude and low natural gas prices
– Strong global distillates demand growth and margins
Growth Investments
Increased Port Arthur hydrocracker permitted capacity to 60 MBPD, like new St. Charles unit
– Both new hydrocrackers performing well
10 MBPD Diamond Green Diesel JV plant started in
– Uses hydroprocessing technology to make high-quality renewable diesel from corn oil, waste cooking oil, and animal fat
50 MBPD in lower-cost hydrocracker expansion projects in progress
– Estimated cost per barrel is significantly lower than the two grassroots units
– Expanding Meraux hydrocracker by 20 MBPD and increasing distillate yield expected in early 2015
– Intend to expand new Port Arthur and St. Charles hydrocrackers each by 15 MBPD in 2018
19
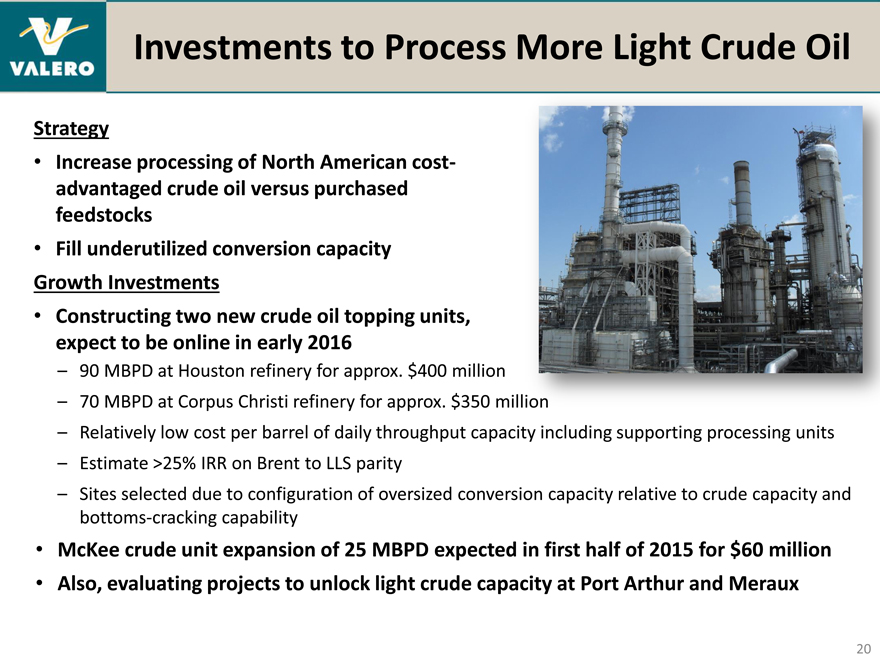
Investments to Process More Light Crude Oil
Strategy
Increase processing of North American cost-advantaged crude oil versus purchased feedstocks
Fill underutilized conversion capacity Growth Investments
Constructing two new crude oil topping units, expect to be online in early 2016
– 90 MBPD at Houston refinery for approx. $400 million
– 70 MBPD at Corpus Christi refinery for approx. $350 m
– Relatively low cost per barrel of daily throughput capacity including supporting processing units
– Estimate >25% IRR on Brent to LLS parity
– Sites selected due to configuration of oversized conversion capacity relative to crude capacity and bottoms-cracking capability
McKee crude unit expansion of 25 MBPD expected in first half of 2015 for $60 million
Also, evaluating projects to unlock light crude capacity at Port Arthur and Meraux
20
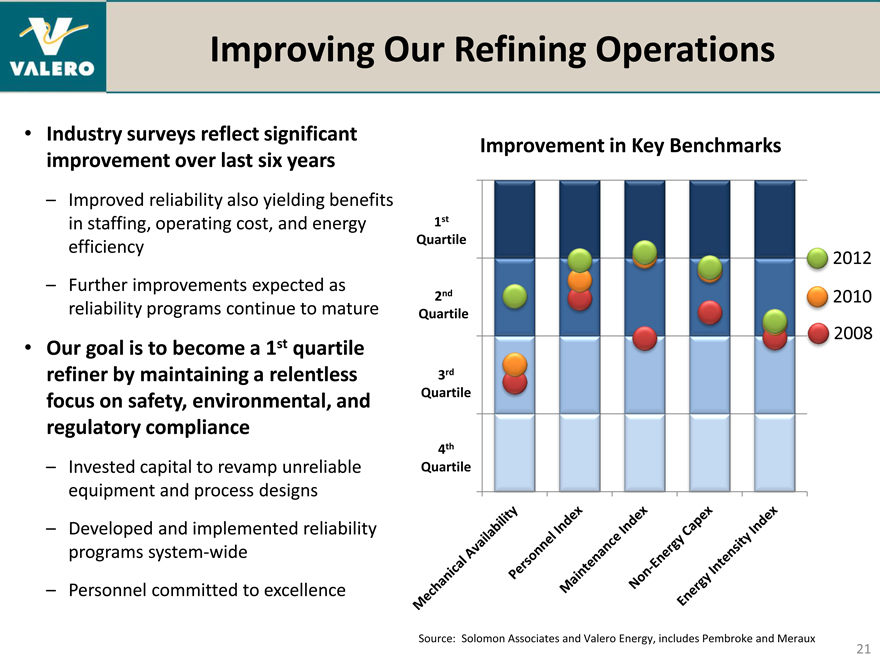
Improving Our Refining Operations
Industry surveys reflect significant improvement over last six years
– Improved reliability also yielding benefits in staffing, operating cost, and energy efficiency
– Further improvements expected as reliability programs continue to mature
Our goal is to become a 1st quartile refiner by maintaining a relentless focus on safety, environmental, and regulatory compliance
– Invested capital to revamp unreliable equipment and process designs
– Developed and implemented reliability programs system-wide
– Personnel committed to excellence
Improvement in Key Benchmarks
100%
1st
Quartile
75% 2012 2nd 2010
Quartile
50% 2008
3rd
Quartile
25%
4th
Quartile
0%
Source: Solomon Associates and Valero Energy, includes Pembroke and Meraux
21
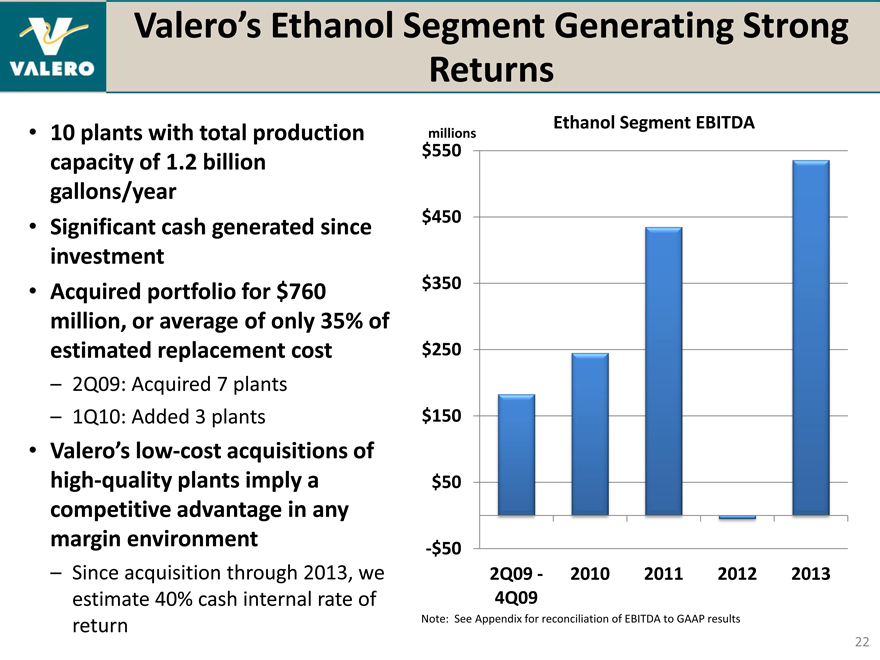
Valero’s Ethanol Segment Generating Strong Returns
10 plants with total production capacity of 1.2 billion gallons/year
Significant cash generated since investment
Acquired portfolio for $760 million, or average of only 35% of estimated replacement cost
– 2Q09: Acquired 7 plants
– 1Q10: Added 3 plants
Valero’s low-cost acquisitions of high-quality plants imply a competitive advantage in any margin environment
– Since acquisition through 2013, we estimate 40% cash internal rate of return
Ethanol Segment EBITDA
$millions 550
$450 $350 $250 $150 $50
-$50
2Q09—2010 2011 2012 2013 4Q09
Note: See Appendix for reconciliation of EBITDA to GAAP results
22
Returning More Cash to Stockholders and Maintaining Financial Strength
• | | Returning more cash to stockholders |
– Increased quarterly dividend from $0.05 per share in 2Q11 to $0.25 per share in 1Q14
– Doubled the amount of cash returned to stockholders in 2013 versus 2012
• | | Goal is to have one of the highest cash returns among peers via dividends and buybacks |
• | | Spun off company-operated retail as CST Brands, equivalent to $3.60 per share of VLO, or $1.9 billion in total |
• | | Maintaining investment grade credit rating is a priority |
– Paid off $480 million of debt in 2013
– Ended 2013 with $4.3 billion of cash, including $375 million for VLP
– Net debt-to-cap ratio at 12/31/13 was 12%, excluding VLP’s cash
– Intend to pay off $200 million notes in April
Cash Returned to VLO Stockholders
millions
$1,400
Stock Buybacks $1,200 Dividends $1,000
$800 $600 $400 $200
$0
2010 2011 2012 2013
23
We Believe Valero Is an Excellent Buy Today
• | | Expect continued growth in North American oil, gas, and NGLs production |
• | | Industry installing significant infrastructure to move crude oil to refining |
markets and process more volumes of light oil
• | | Lower-cost U.S. and Canadian natural gas provides competitive advantage |
• | | Global distillates demand growth yielding higher margins |
• | | U.S. competitively exporting into growing and undersupplied markets |
• | | Invest in growth projects that exploit North American resource advantages |
– Logistics, hydrocracking for distillates, processing more domestic light crude oil, plus
natural gas and NGLs upgrading projects
• | | Unlock potential value of existing assets |
– Spun off retail assets into publicly traded CST Brands
– Created MLP to unlock value of our growing portfolio of logistics assets, pursuing
asset drops
• | | Pursue excellence in operations – 1st quartile in refining |
• | | Return cash to stockholders |
– Seek to grow regular dividend at sustainable rate
– Return excess cash and concentrate value per share via stock buybacks
Valero’s Strategy
Key Market Trends
24
Appendix
25
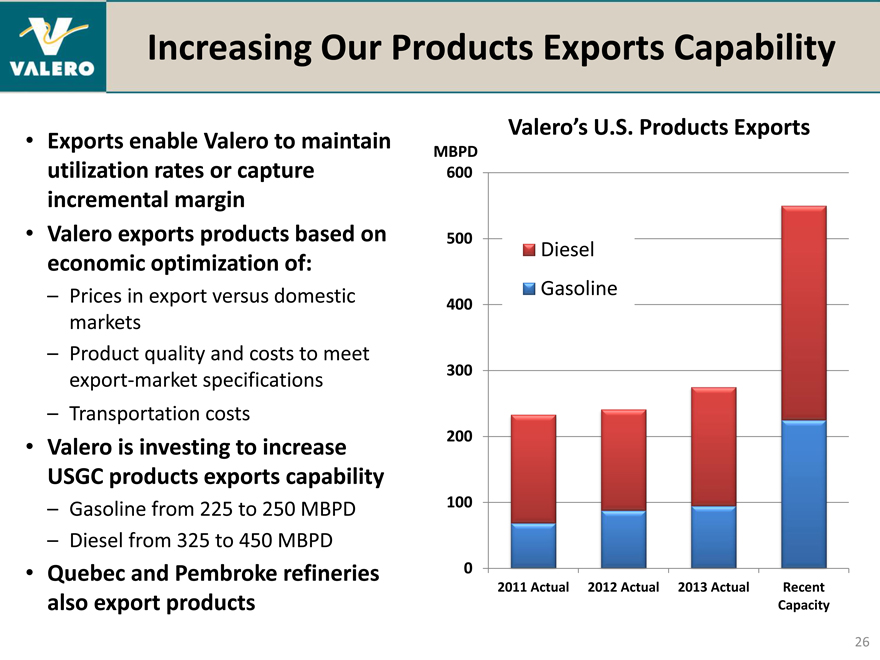
Increasing Our Products Exports Capability
• | | Exports enable Valero to maintain utilization rates or capture incremental margin |
• | | Valero exports products based on economic optimization of: |
– Prices in export versus domestic markets
– Product quality and costs to meet export-market specifications
– Transportation costs
• | | Valero is investing to increase USGC products exports capability |
– Gasoline from 225 to 250 MBPD
– Diesel from 325 to 450 MBPD
• | | Quebec and Pembroke refineries also export products |
Valero’s U.S. Products Exports
MBPD 600
500 Diesel Gasoline
400 300 200 100
0
2011 Actual 2012 Actual 2013 Actual Recent Capacity
26
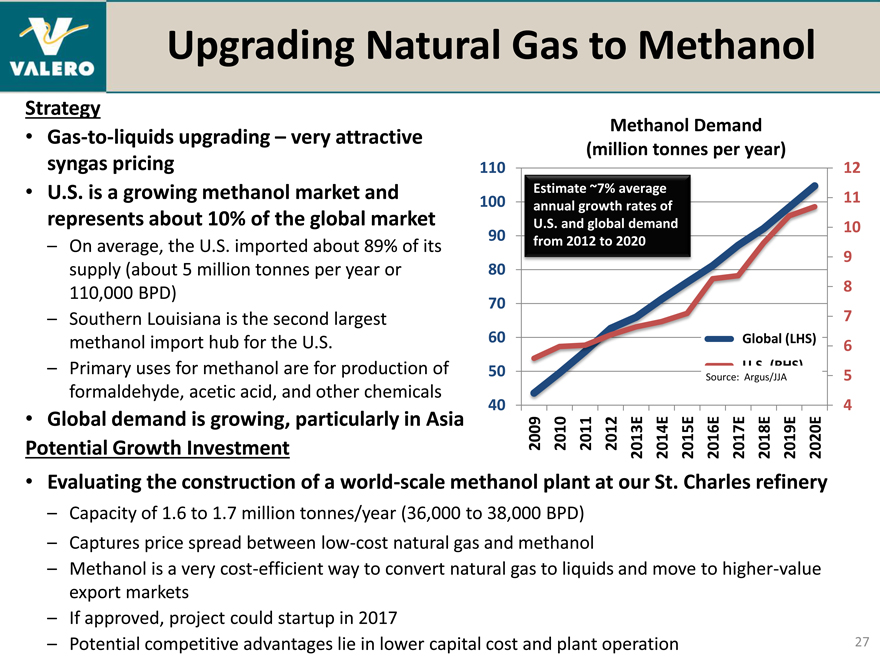
Upgrading Natural Gas to Methanol
Strategy
• | | Gas-to-liquids upgrading – very attractive syngas pricing |
• | | U.S. is a growing methanol market and represents about 10% of the global market |
– On average, the U.S. imported about 89% of its supply (about 5 million tonnes per year or 110,000 BPD)
– Southern Louisiana is the second largest methanol import hub for the U.S.
– Primary uses for methanol are for production of formaldehyde, acetic acid, and other chemicals
• | | Global demand is growing, particularly in Asia Potential Growth Investment |
• | | Evaluating the construction of a world-scale methanol plant at our St. Charles refinery |
– Capacity of 1.6 to 1.7 million tonnes/year (36,000 to 38,000 BPD)
– Captures price spread between low-cost natural gas and methanol
– Methanol is a very cost-efficient way to convert natural gas to liquids and move to higher-value export markets
– If approved, project could startup in 2017
– Potential competitive advantages lie in lower capital cost and plant operation
Methanol Demand (million tonnes per year)
110 12
Estimate ~7% average
100 11
annual growth rates of
U.S. and global demand 10 90 from 2012 to 2020
9
80 8 70 7
60 Global (LHS)
50 Source: U. Argus/JJA S. (RHS)
40 4 2009 20102011 2012 2013E 2014E 2015E 2016E 2017E 2018E2019E 2020E
27
NGLs Upgrading Presents an Opportunity to Create Value
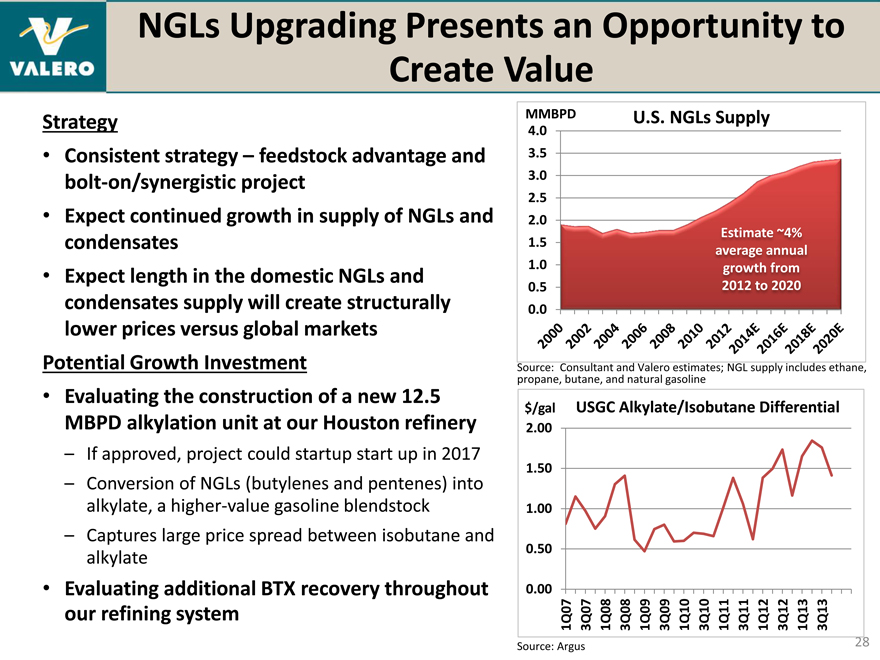
Strategy
• | | Consistent strategy – feedstock advantage and bolt-on/synergistic project |
• | | Expect continued growth in supply of NGLs and condensates |
• | | Expect length in the domestic NGLs and condensates supply will create structurally lower prices versus global markets Potential Growth Investment |
• | | Evaluating the construction of a new 12.5 MBPD alkylation unit at our Houston refinery |
– If approved, project could startup start up in 2017
– Conversion of NGLs (butylenes and pentenes) into alkylate, a higher-value gasoline blendstock
– Captures large price spread between isobutane and alkylate
• | | Evaluating additional BTX recovery throughout our refining system |
MMBPD U.S. NGLs Supply
4.0 3.5 3.0 2.5 2.0
Estimate ~4% 1.5 1.0 average annual growth from 0.5 2012 to 2020 0.0
Source: propane, Consultant butane, and and natural Valero gasoline estimates; NGL supply includes ethane,
$/gal USGC Alkylate/Isobutane Differential
2.00 1.50 1.00 0.50
0.00
1Q07 3Q071Q083Q081Q09 3Q09 1Q103Q10 1Q11 3Q11 1Q12 3Q12 1Q13 3Q13
Source: Argus
28
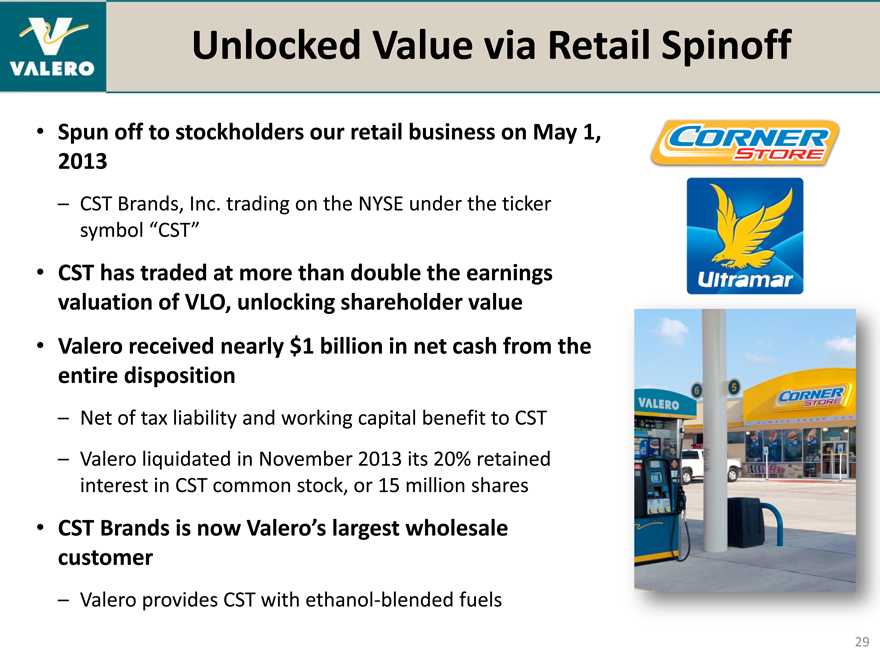
Unlocked Value via Retail Spinoff
• | | Spun off to stockholders our retail business on May 1, 2013 |
– CST Brands, Inc. trading on the NYSE under the ticker symbol “CST”
• | | CST has traded at more than double the earnings valuation of VLO, unlocking shareholder value |
• | | Valero received nearly $1 billion in net cash from the entire disposition |
– Net of tax liability and working capital benefit to CST
– Valero liquidated in November 2013 its 20% retained interest in CST common stock, or 15 million shares
• | | CST Brands is now Valero’s largest wholesale customer |
– Valero provides CST with ethanol-blended fuels
29
Improving Our Safety and Environmental Performance
Personnel Safety
1.8
Employees
1.6
Contractors
1.4 Industry*
1.2
1.0
0.8
0.6
0.4
0.2
0.0
2007 200820092010 2011 2012 2013
Total Recordable Incident Rate (TRIR)
Tier 1 Process Safety
0.20
0.15
0.10
0.05
0.00
Process Safety Event Rate
Environmental Events
40 Legacy Refineries 20 Total Air Emissions
30 15
MBPD /
20 10Tons
10 5
0 0 2007200820092010201120122013
# of Events per Month
*Source: U.S. Bureau of Labor Statistics; Legacy refineries data exclude Pembroke and Meraux
• | | Safety is our highest priority: our goal is zero injuries |
• | | Frequency of Tier 1 process safety events has steadily decreased |
• | | Since 2007, environmental event frequency declined by over 65% |
30
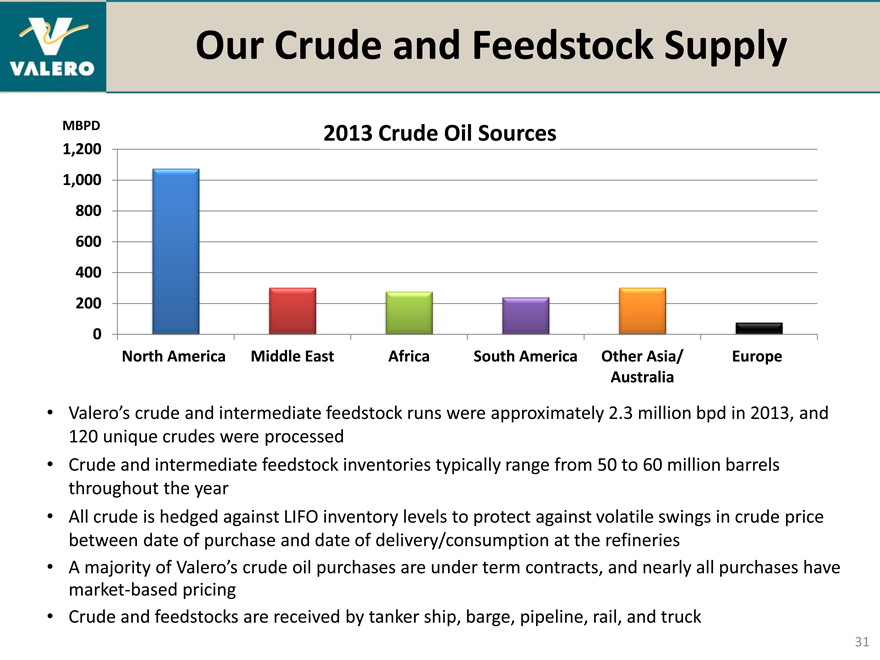
Our Crude and Feedstock Supply
MBPD 2013 Crude Oil Sources
1,200 1,000 800 600 400 200 0
North America Middle East Africa South America Other Asia/ Europe Australia
Valero’s crude and intermediate feedstock runs were approximately 2.3 million bpd in 2013, and 120 unique crudes were processed
Crude and intermediate feedstock inventories typically range from 50 to 60 million barrels throughout the year
All crude is hedged against LIFO inventory levels to protect against volatile swings in crude price between date of purchase and date of delivery/consumption at the refineries
A majority of Valero’s crude oil purchases are under term contracts, and nearly all purchases have market-based pricing
Crude and feedstocks are received by tanker ship, barge, pipeline, rail, and truck
31
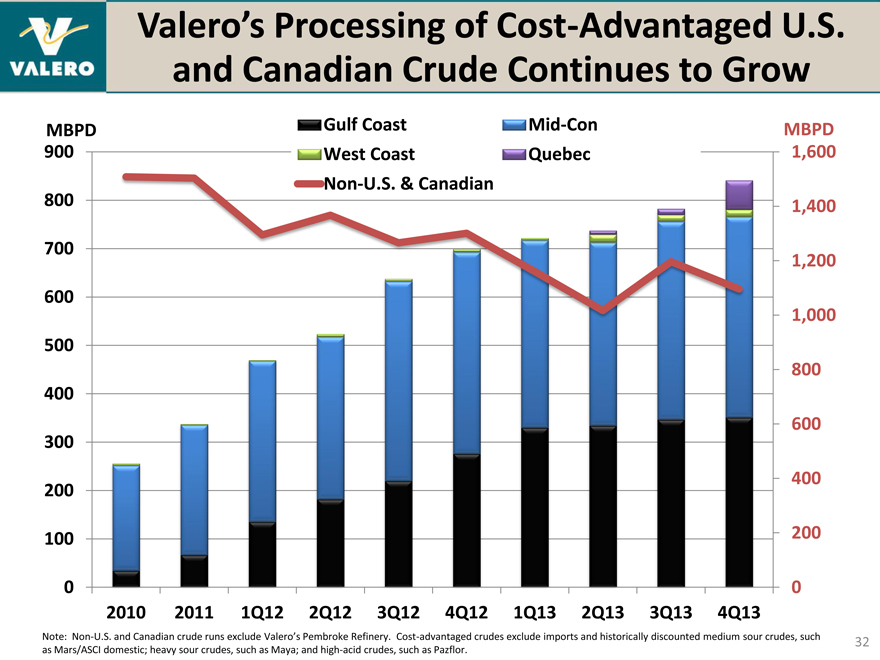
Valero’s Processing of Cost-Advantaged U.S. and Canadian Crude Continues to Grow
MBPD Gulf Coast Mid-Con MBPD 900 West Coast Quebec 1,600 Non-U.S. & Canadian 800 1,400 700 1,200 600 1,000 500 800 400 600 300 400 200
100 200
0 0 2010 2011 1Q12 2Q12 3Q12 4Q12 1Q13 2Q13 3Q13 4Q13
Note: Non-U.S. and Canadian crude runs exclude Valero’s Pembroke Refinery. Cost-advantaged crudes exclude imports and historically discounted medium sour crudes, such as Mars/ASCI domestic; heavy sour crudes, such as Maya; and high-acid crudes, such as Pazflor.
32
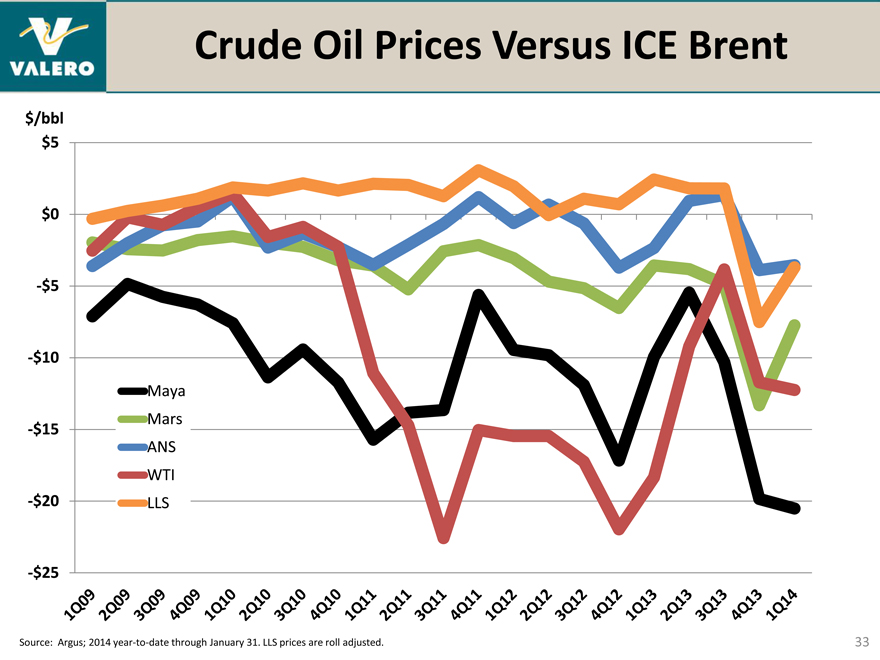
Crude Oil Prices Versus ICE Brent
$/bbl $5
$0
-$5
-$10
-$15
-$20
-$25
Maya
Mars
ANS
WTI
LLS
Source: Argus; 2014 year-to-date through January 31. LLS prices are roll adjusted.
33
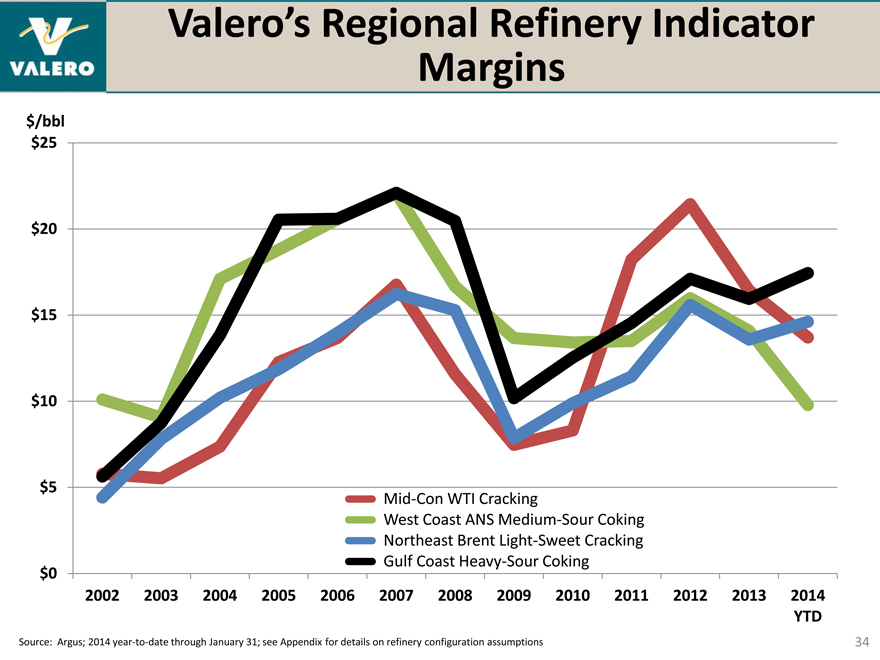
Valero’s Regional Refinery Indicator Margins
$/bbl $25
$20 $15 $10 $5 $0
Mid-Con WTI Cracking
West Coast ANS Medium-Sour Coking Northeast Brent Light-Sweet Cracking Gulf Coast Heavy-Sour Coking
2002 2003 2004 2005 2006 2007 2008 2009 2010 2011 2012 2013 2014
YTD
Source: Argus; 2014 year-to-date through January 31; see Appendix for details on refinery configuration assumptions
34
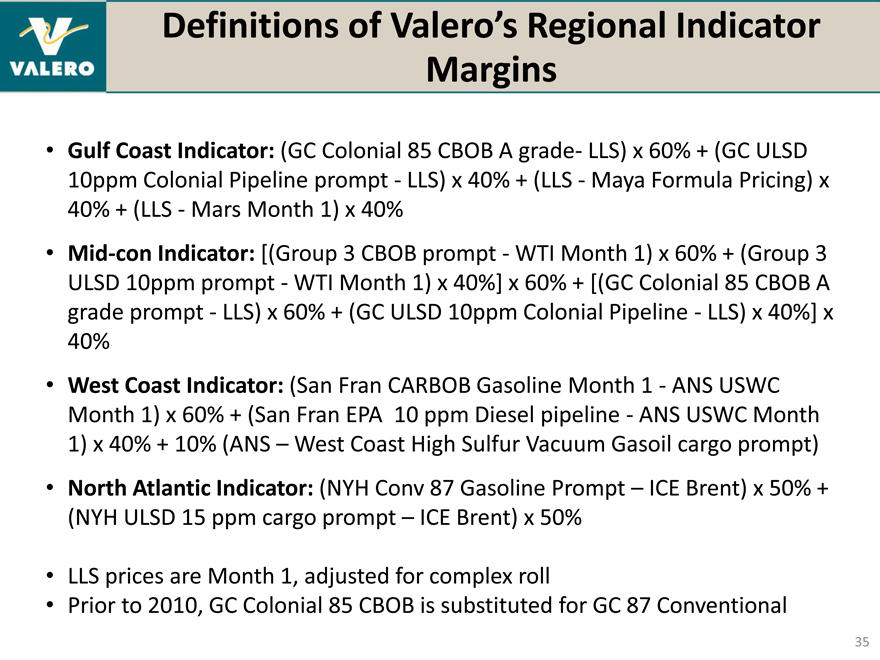
Definitions of Valero’s Regional Indicator Margins
• | | Gulf Coast Indicator: (GC Colonial 85 CBOB A grade- LLS) x 60% + (GC ULSD 10ppm Colonial Pipeline prompt—LLS) x 40% + (LLS—Maya Formula Pricing) x 40% + (LLS—Mars Month 1) x 40% |
• | | Mid-con Indicator: [(Group 3 CBOB prompt—WTI Month 1) x 60% + (Group 3 ULSD 10ppm prompt—WTI Month 1) x 40%] x 60% + [(GC Colonial 85 CBOB A grade prompt—LLS) x 60% + (GC ULSD 10ppm Colonial Pipeline—LLS) x 40%] x 40% |
• | | West Coast Indicator: (San Fran CARBOB Gasoline Month 1—ANS USWC Month 1) x 60% + (San Fran EPA 10 ppm Diesel pipeline—ANS USWC Month 1) x 40% + 10% (ANS – West Coast High Sulfur Vacuum Gasoil cargo prompt) |
• | | North Atlantic Indicator: (NYH Conv 87 Gasoline Prompt – ICE Brent) x 50% + (NYH ULSD 15 ppm cargo prompt – ICE Brent) x 50% |
• | | LLS prices are Month 1, adjusted for complex roll |
• | | Prior to 2010, GC Colonial 85 CBOB is substituted for GC 87 Conventional |
35
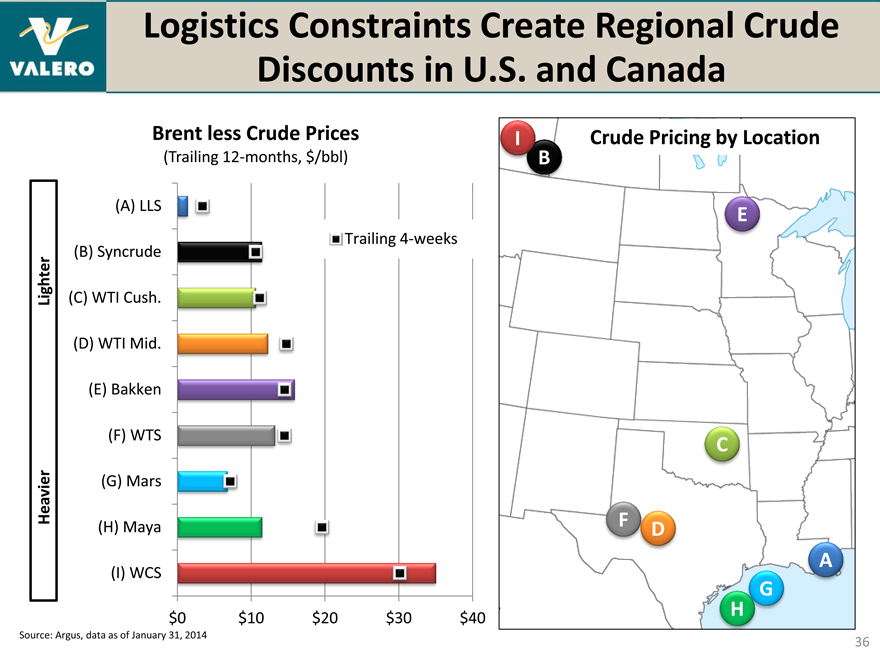
Logistics Constraints Create Regional Crude Discounts in U.S. and Canada
Brent less Crude Prices
(Trailing 12-months, $/bbl)
(A) LLS
Trailing 4-weeks
(B) Syncrude
Lighter (C) WTI Cush.
(D) WTI Mid.
(E) Bakken
(F) WTS
Heavier (G) Mars
(H) Maya
(I) WCS
$0 $10 $20 $30 $40
I Crude Pricing by Location
B
E
C
F D
A
G
H
Source: Argus, data as of January 31, 2014
36
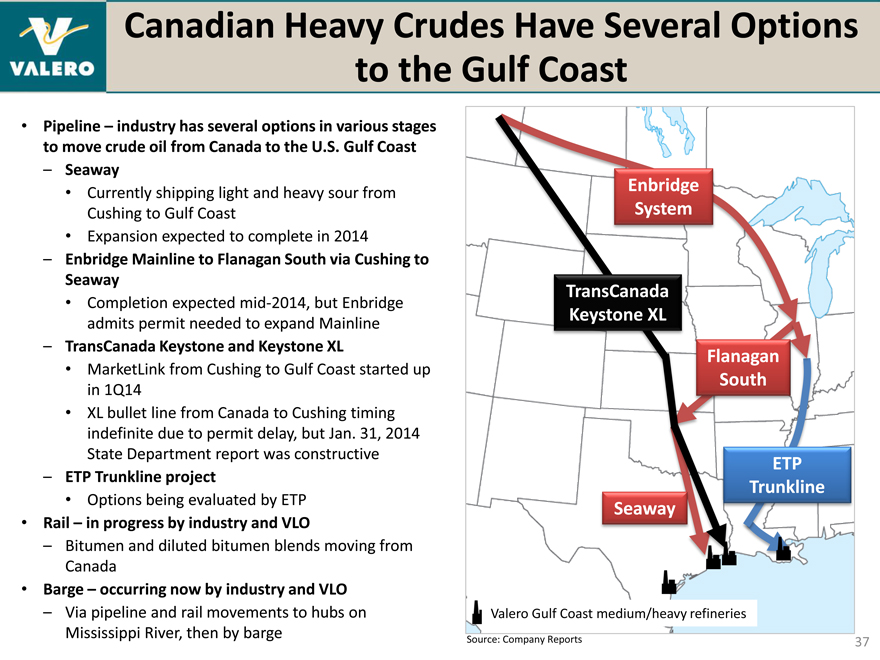
Canadian Heavy Crudes Have Several Options to the Gulf Coast
• | | Pipeline – industry has several options in various stages to move crude oil from Canada to the U.S. Gulf Coast |
– Seaway
• | | Currently shipping light and heavy sour from Cushing to Gulf Coast |
• | | Expansion expected to complete in 2014 |
– Enbridge Mainline to Flanagan South via Cushing to Seaway
• | | Completion expected mid-2014, but Enbridge admits permit needed to expand Mainline |
– TransCanada Keystone and Keystone XL
• | | MarketLink from Cushing to Gulf Coast started up in 1Q14 |
• | | XL bullet line from Canada to Cushing timing indefinite due to permit delay, but Jan. 31, 2014 State Department report was constructive |
– ETP Trunkline project
• | | Options being evaluated by ETP |
• | | Rail – in progress by industry and VLO |
– Bitumen and diluted bitumen blends moving from Canada
• | | Barge – occurring now by industry and VLO |
– Via pipeline and rail movements to hubs on Mississippi River, then by barge
Enbridge System
TransCanada Keystone XL
Flanagan South
ETP Trunkline Seaway
Valero Gulf Coast medium/heavy refineries
Source: Company Reports
37
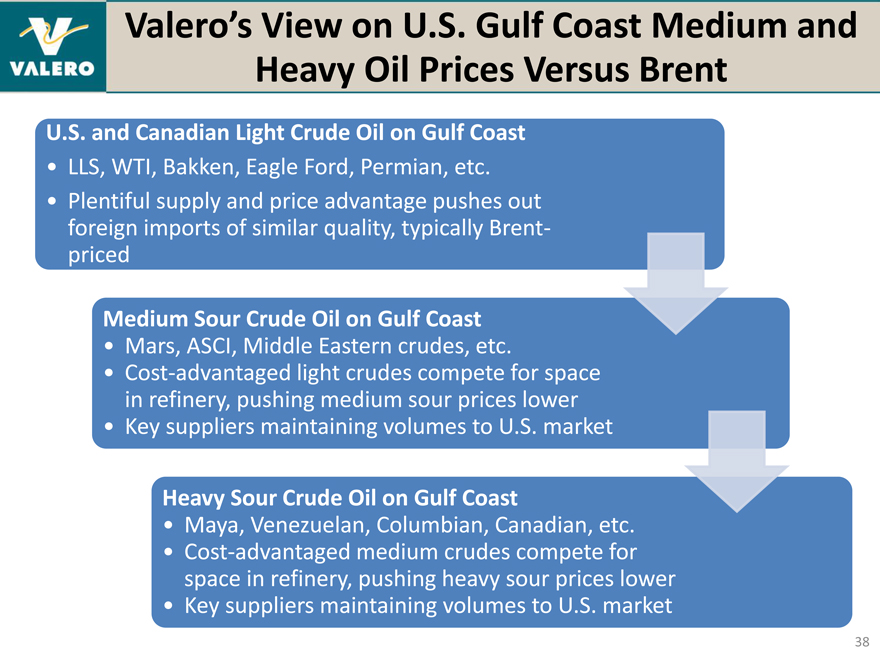
Valero’s View on U.S. Gulf Coast Medium and Heavy Oil Prices Versus Brent
U.S. and Canadian Light Crude Oil on Gulf Coast
• | | LLS, WTI, Bakken, Eagle Ford, Permian, etc. |
• | | Plentiful supply and price advantage pushes out foreign imports of similar quality, typically Brent-priced |
Medium Sour Crude Oil on Gulf Coast
• | | Mars, ASCI, Middle Eastern crudes, etc. |
• | | Cost-advantaged light crudes compete for space in refinery, pushing medium sour prices lower |
• | | Key suppliers maintaining volumes to U.S. market |
Heavy Sour Crude Oil on Gulf Coast
• | | Maya, Venezuelan, Columbian, Canadian, etc. |
• | | Cost-advantaged medium crudes compete for space in refinery, pushing heavy sour prices lower |
• | | Key suppliers maintaining volumes to U.S. market |
38
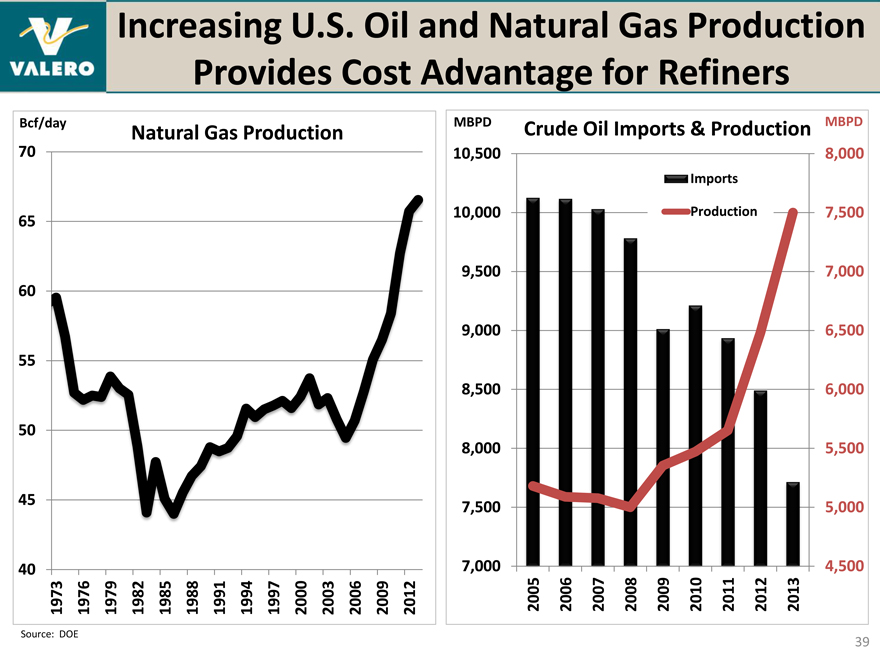
Increasing U.S. Oil and Natural Gas Production Provides Cost Advantage for Refiners
40 45 5055606570
1973 Bcf/day
1976 1979 1982 1985
1988 Natural
1991 Gas 1994 1997 2000
2003 Production
2006 2009 2012
Source: DOE
MBPD Crude Oil Imports & Production MBPD
10,500 8,000
Imports
10,000 Production 7,500 9,500 7,000 9,000 6,500 8,500 6,000 8,000 5,500 7,500 5,000
7,000 4,500 2005 2006 2007 2008 2009 2010 2011 2012 2013
39
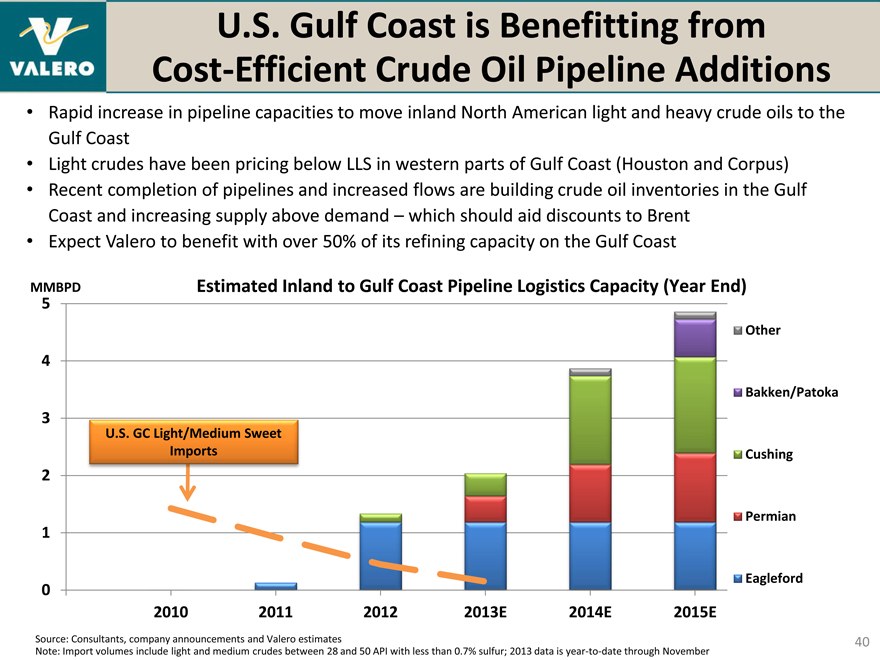
U.S. Gulf Coast is Benefitting from Cost-Efficient Crude Oil Pipeline Additions
• | | Rapid increase in pipeline capacities to move inland North American light and heavy crude oils to the Gulf Coast |
• | | Light crudes have been pricing below LLS in western parts of Gulf Coast (Houston and Corpus) |
• | | Recent completion of pipelines and increased flows are building crude oil inventories in the Gulf Coast and increasing supply above demand – which should aid discounts to Brent |
• | | Expect Valero to benefit with over 50% of its refining capacity on the Gulf Coast |
MMBPD 5 Estimated Inland to Gulf Coast Pipeline Logistics Capacity (Year End)
Other
Bakken/Patoka
3 | | U.S. GC Light/Medium Sweet |
Imports Cushing
0
2010 2011 2012 2013E 2014E 2015E
Source: Consultants, company announcements and Valero estimates
Note: Import volumes include light and medium crudes between 28 and 50 API with less than 0.7% sulfur; 2013 data is year-to-date through November
40
Growth of Crude Oil Pipelines to U.S. Gulf Coast
Year-End Throughput Capacities, ‘000 bpd 2011 2012 2013E 2014E 2015E Announced Start-up
Cushing
Seaway 150 400 850 850 2Q12, 1Q13, 2Q14
Keystone MarketLink ——700 830 1Q14, 2015
Total—150 400 1,550 1,680
Permian
Longhorn 225 275 275 225 4Q13; 275 mid-14
BridgeTex 300 300 Mid-2014
Plains Cactus 200 2015
SXL Permian Express 150 350 350 2Q at 90; 150 by late-13
SXL WTG — 80 80 80 2Q13
Total — 455 1,005 1,205
Eagleford
Harvest 150 150 150 150
Enterprise 350 350 350 350
KinderMorgan 300 300 300 300
Plains 185 185 185 185
NuStar 130 200 200 200 200
Total 130 1,185 1,185 1,185 1,185
Patoka
ETP/Enbridge Trunkline — — 660 2015
Total — — 660
Other
Blueknight Silverado 70 70 2Q14
SXL Eaglebine Express ——60 60 Mid-2014
Total ——130 130
Source: Consultants, company announcements and Valero estimates
41
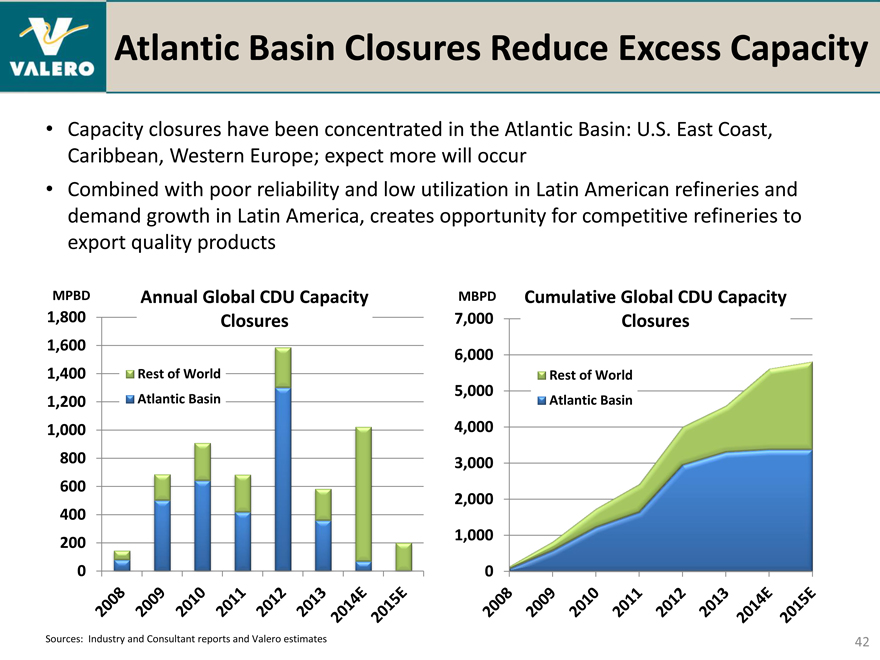
Atlantic Basin Closures Reduce Excess Capacity
• | | Capacity closures have been concentrated in the Atlantic Basin: U.S. East Coast, Caribbean, Western Europe; expect more will occur |
• | | Combined with poor reliability and low utilization in Latin American refineries and demand growth in Latin America, creates opportunity for competitive refineries to export quality products |
MPBD Annual Global CDU Capacity MBPD Cumulative Global CDU Capacity 1,800 Closures 7,000 Closures
1,600
6,000
1,400 Rest of World Rest of World
5,000
1,200 Atlantic Basin Atlantic Basin
1,000 4,000 800 3,000 600 2,000 400 200 1,000
2008 2009 2010 2011 2012 2013 2014E 2015E
2008 2009 2010 2011 2012 2013 2014E 2015E
0 0
Sources: Industry and Consultant reports and Valero estimates
42
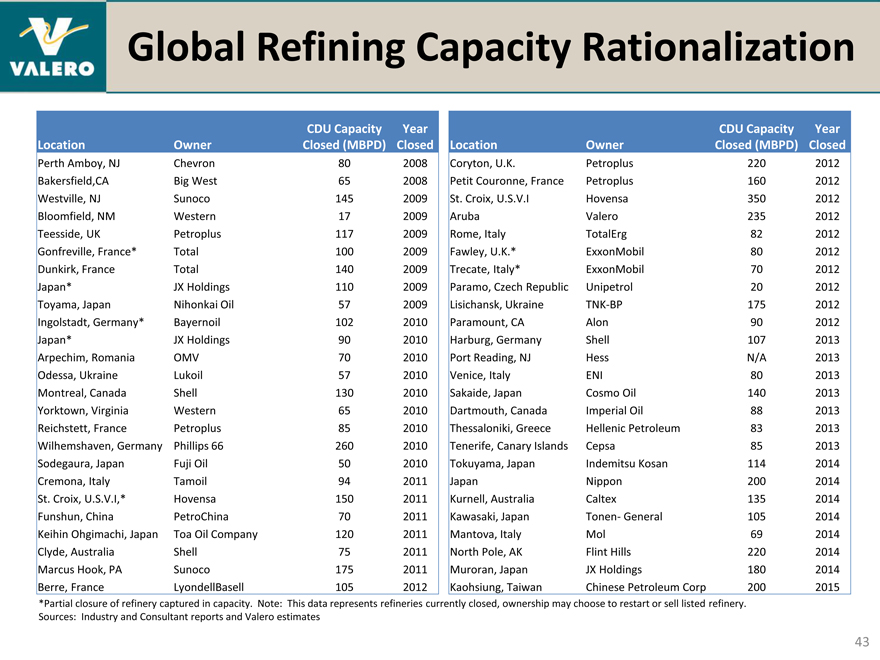
Global Refining Capacity Rationalization
CDU Capacity Year
Location Owner Closed (MBPD) Closed
Perth Amboy, NJ Chevron 80 2008
Bakersfield,CA Big West 65 2008
Westville, NJ Sunoco 145 2009
Bloomfield, NM Western 17 2009
Teesside, UK Petroplus 117 2009
Gonfreville, France* Total 100 2009
Dunkirk, France Total 140 2009
Japan* JX Holdings 110 2009
Toyama, Japan Nihonkai Oil 57 2009
Ingolstadt, Germany* Bayernoil 102 2010
Japan* JX Holdings 90 2010
Arpechim, Romania OMV 70 2010
Odessa, Ukraine Lukoil 57 2010
Montreal, Canada Shell 130 2010
Yorktown, Virginia Western 65 2010
Reichstett, France Petroplus 85 2010
Wilhemshaven, Germany Phillips 66 260 2010
Sodegaura, Japan Fuji Oil 50 2010
Cremona, Italy Tamoil 94 2011
St. Croix, U.S.V.I,* Hovensa 150 2011
Funshun, China PetroChina 70 2011
Keihin Ohgimachi, Japan Toa Oil Company 120 2011
Clyde, Australia Shell 75 2011
Marcus Hook, PA Sunoco 175 2011
Berre, France LyondellBasell 105 2012
CDU Capacity Year
Location Owner Closed (MBPD) Closed
Coryton, U.K. Petroplus 220 2012
Petit Couronne, France Petroplus 160 2012
St. Croix, U.S.V.I Hovensa 350 2012
Aruba Valero 235 2012
Rome, Italy TotalErg 82 2012
Fawley, U.K.* ExxonMobil 80 2012
Trecate, Italy* ExxonMobil 70 2012
Paramo, Czech Republic Unipetrol 20 2012
Lisichansk, Ukraine TNK-BP 175 2012
Paramount, CA Alon 90 2012
Harburg, Germany Shell 107 2013
Port Reading, NJ Hess N/A 2013
Venice, Italy ENI 80 2013
Sakaide, Japan Cosmo Oil 140 2013
Dartmouth, Canada Imperial Oil 88 2013
Thessaloniki, Greece Hellenic Petroleum 83 2013
Tenerife, Canary Islands Cepsa 85 2013
Tokuyama, Japan Indemitsu Kosan 114 2014
Japan Nippon 200 2014
Kurnell, Australia Caltex 135 2014
Kawasaki, Japan Tonen- General 105 2014
Mantova, Italy Mol 69 2014
North Pole, AK Flint Hills 220 2014
Muroran, Japan JX Holdings 180 2014
Kaohsiung, Taiwan Chinese Petroleum Corp 200 2015
*Partial closure of refinery captured in capacity. Note: This data represents refineries currently closed, ownership may choose to restart or sell listed refinery. Sources: Industry and Consultant reports and Valero estimates
43
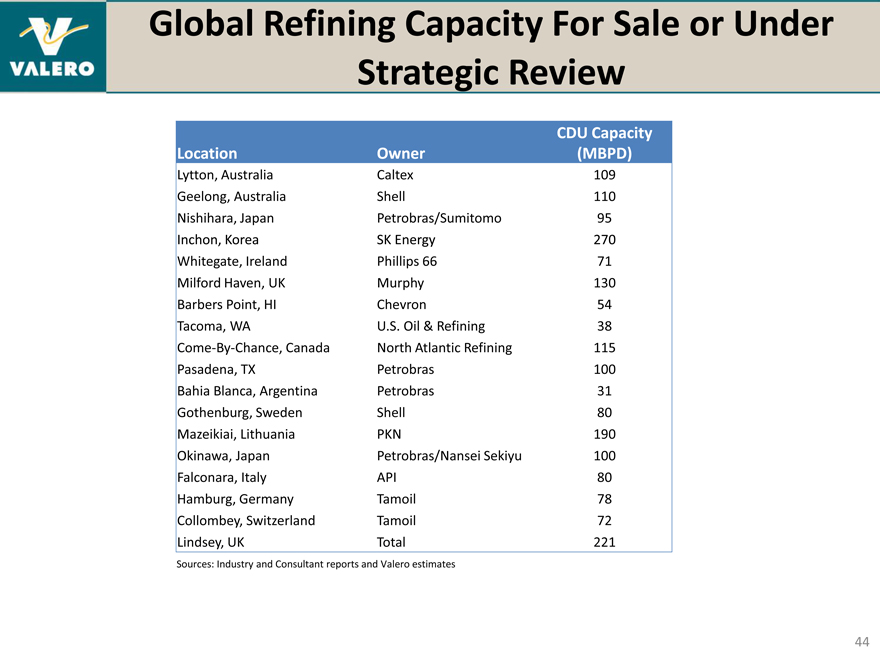
Global Refining Capacity For Sale or Under Strategic Review
CDU Capacity
Location Owner (MBPD)
Lytton, Australia Caltex 109
Geelong, Australia Shell 110
Nishihara, Japan Petrobras/Sumitomo 95
Inchon, Korea SK Energy 270
Whitegate, Ireland Phillips 66 71
Milford Haven, UK Murphy 130
Barbers Point, HI Chevron 54
Tacoma, WA U.S. Oil & Refining 38
Come-By-Chance, Canada North Atlantic Refining 115
Pasadena, TX Petrobras 100
Bahia Blanca, Argentina Petrobras 31
Gothenburg, Sweden Shell 80
Mazeikiai, Lithuania PKN 190
Okinawa, Japan Petrobras/Nansei Sekiyu 100
Falconara, Italy API 80
Hamburg, Germany Tamoil 78
Collombey, Switzerland Tamoil 72
Lindsey, UK Total 221
Sources: Industry and Consultant reports and Valero estimates
44
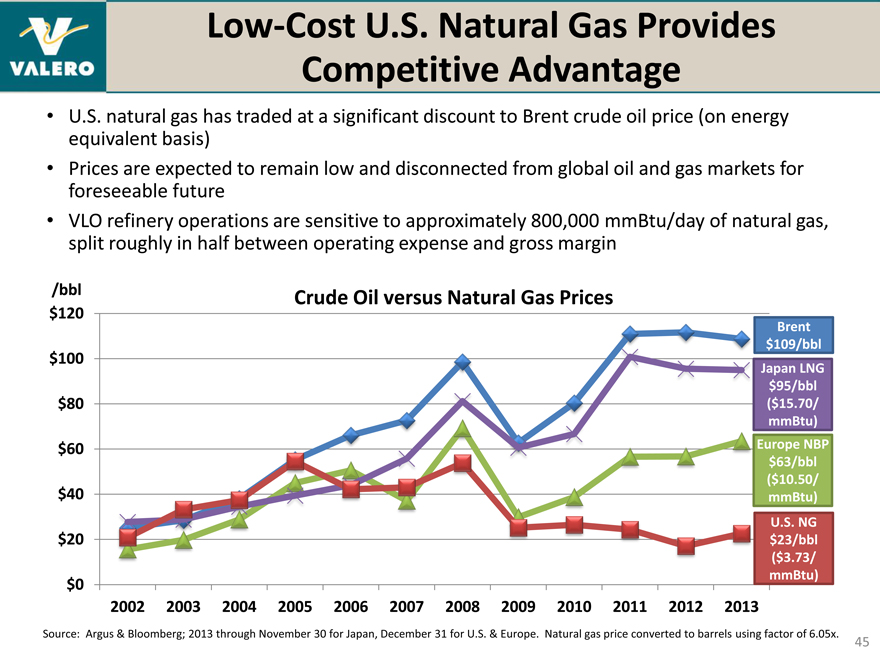
Low-Cost U.S. Natural Gas Provides Competitive Advantage
U.S. natural gas has traded at a significant discount to Brent crude oil price (on energy equivalent basis)
Prices are expected to remain low and disconnected from global oil and gas markets for foreseeable future
VLO refinery operations are sensitive to approximately 800,000 mmBtu/day of natural gas, split roughly in half between operating expense and gross margin
/bbl Crude Oil versus Natural Gas Prices
$120
Brent $109/bbl
$100
Japan LNG $95/bbl
$80 ($15.70/ mmBtu)
$60 Europe NBP $63/bbl
($10.50/ $40 mmBtu) U.S. NG
$20 $23/bbl
($3.73/ mmBtu)
$0
2002 2003 2004 2005 2006 2007 2008 2009 2010 2011 2012 2013
Source: Argus & Bloomberg; 2013 through November 30 for Japan, December 31 for U.S. & Europe. Natural gas price converted to barrels using factor of 6.05x.
45
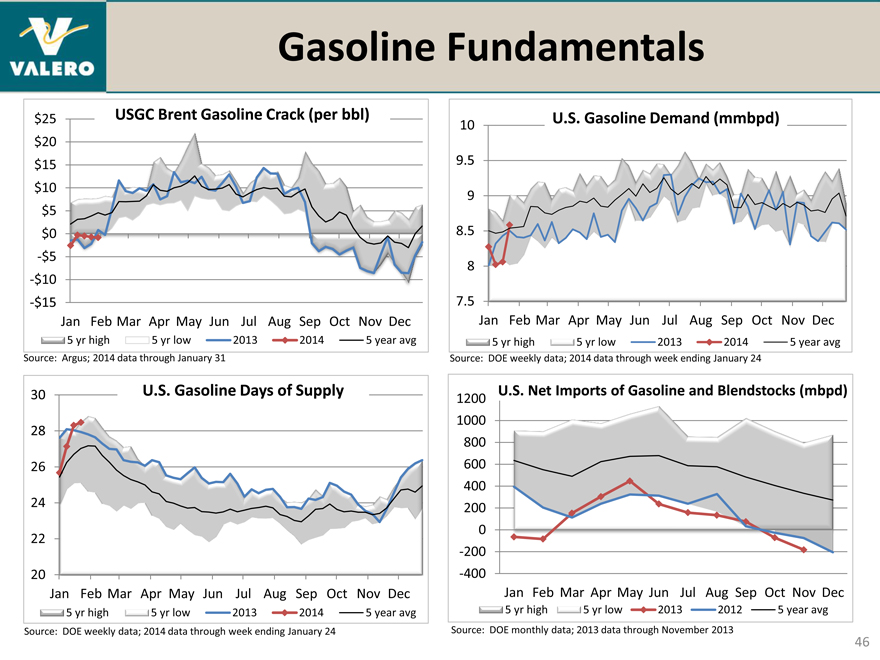
Gasoline Fundamentals
$25 USGC Brent Gasoline Crack (per bbl)
$20 $15 $10 $5 $0
-$5
-$10
-$15
Jan Feb Mar Apr May Jun Jul Aug Sep Oct Nov Dec
5 | | yr high 5 yr low 2013 2014 5 year avg |
Source: Argus; 2014 data through January 31
30 U.S. Gasoline Days of Supply
28 26 24 22
20
Jan Feb Mar Apr May Jun Jul Aug Sep Oct Nov Dec
5 | | yr high 5 yr low 2013 2014 5 year avg |
Source: DOE weekly data; 2014 data through week ending January 24
10 U.S. Gasoline Demand (mmbpd)
9.5 9 8.5 8
7.5
Jan Feb Mar Apr May Jun Jul Aug Sep Oct Nov Dec
5 | | yr high 5 yr low 2013 2014 5 year avg |
Source: DOE weekly data; 2014 data through week ending January 24
U.S. Net Imports of Gasoline and Blendstocks (mbpd)
1200 1000 800 600 400 200 0 -200 -400
Jan Feb Mar Apr May Jun Jul Aug Sep Oct Nov Dec
5 | | yr high 5 yr low 2013 2012 5 year avg |
Source: DOE monthly data; 2013 data through November 2013
46
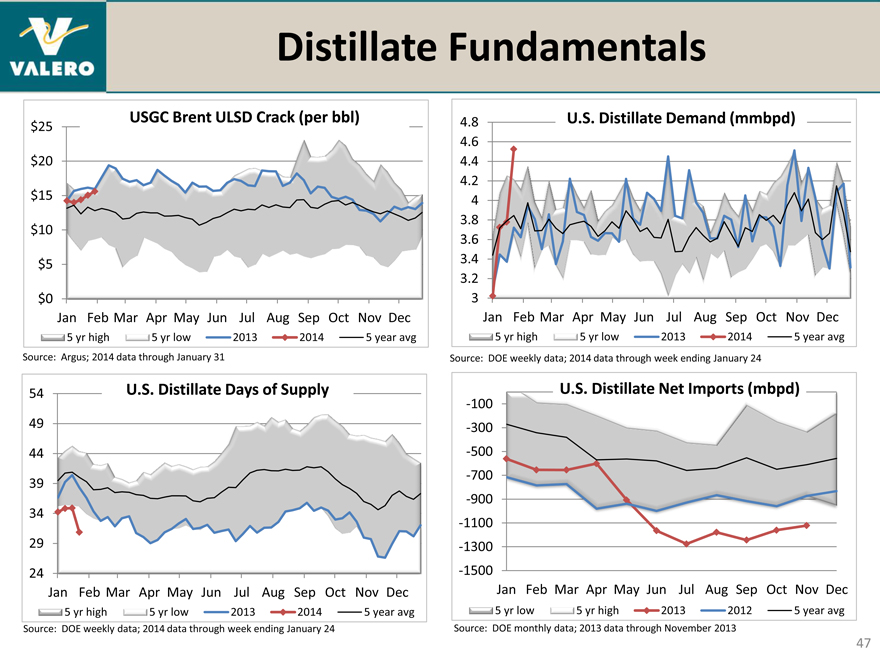
Distillate Fundamentals
USGC Brent ULSD Crack (per bbl)
$25 $20 $15 $10 $5
$0
Jan Feb Mar Apr May Jun Jul Aug Sep Oct Nov Dec
5 | | yr high 5 yr low 2013 2014 5 year avg |
Source: Argus; 2014 data through January 31
54 U.S. Distillate Days of Supply
49 44 39 34 29 24
Jan Feb Mar Apr May Jun Jul Aug Sep Oct Nov Dec
5 | | yr high 5 yr low 2013 2014 5 year avg |
Source: DOE weekly data; 2014 data through week ending January 24
4.8 U.S. Distillate Demand (mmbpd)
4.6 4.4 4.2 4 3.8 3.6 3.4 3.2 3
Jan Feb Mar Apr May Jun Jul Aug Sep Oct Nov Dec
5 | | yr high 5 yr low 2013 2014 5 year avg |
Source: DOE weekly data; 2014 data through week ending January 24
U.S. Distillate Net Imports (mbpd)
-100 -300 -500 -700 -900 -1100 -1300 -1500
Jan Feb Mar Apr May Jun Jul Aug Sep Oct Nov Dec
5 | | yr low 5 yr high 2013 2012 5 year avg |
Source: DOE monthly data; 2013 data through November 2013
47
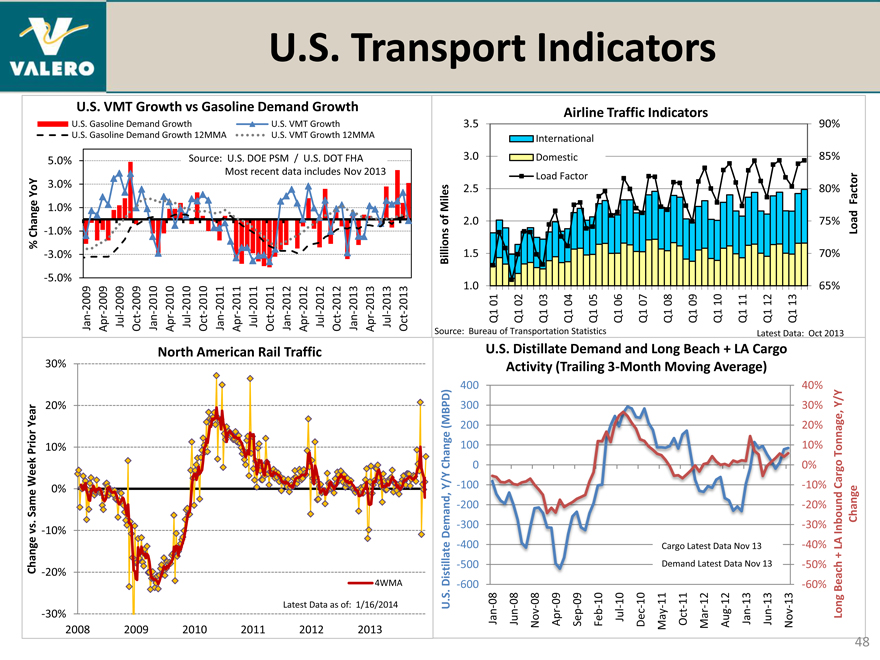
U.S. Transport Indicators
U.S. VMT Growth vs Gasoline Demand Growth
U.S. Gasoline Demand Growth U.S. VMT Growth
U.S. Gasoline Demand Growth 12MMA U.S. VMT Growth 12MMA
5.0% Source: U.S. DOE PSM / U.S. DOT FHA Most recent data includes Nov 2013
YoY 3.0% 1.0%
Change -1.0% %
-3.0% -5.0%
2009 2009 2009 2009 2010 2010 2010 20102011 2011 2011 201120122012 2012 2012 2013 2013 2013 2013 —Jan Apr — Jul—Oct Jan—Apr—Jul — Oct—Jan—Apr—Jul Oct—Jan — Apr—Jul Oct — Jan Apr — Jul Oct -
Source: Billions of Miles
1. 1. 2. 2. 3. 3.
0 5 0 5 05
Bureau Q1 01 of
Q1 02
Q1 03 Load
Transportation
Q1 04 Domestic Factor International
Statistics Q1 05 Airline
Q1 06 Traffic
Q1 07 Q1 08
Q1 09 Indicators
Q1 10 Q1 11
Latest Q1 12 Data: Q1 13 Oct
65% 70% 75% 80% 85% 90%
2013
Load Factor
North American Rail Traffic
30%
Year 20% Prior 10% Week Same 0% . vs -10%
Change -20%
4WMA
Latest Data as of: 1/16/2014
-30%
2008 2009 2010 2011 2012 2013
U.S. Distillate Demand, Y/Y Change (MBPD)
-600-500 -400 -300 -200 -1000100200 300 400 Jan-08 U.
S.
Jun-08
Nov-08 Activity Apr-09 Distillate
Sep-09
Feb-10 (Trailing Demand
Jul-10 Dec-10 and 3-Month
May-11 Long Oct-11 Cargo
Demand
Mar-12 Latest Moving
Latest Beach
Aug-12 Data +
Data
Jan-13 Nov LA
Nov 13
Average)
Jun-13 13
Cargo
Nov-13
0% 10% 20% 30% 40% -60% -50% -40% -30% -20% -10%
Long Beach + LA Inbound Cargo Tonnage, Y/Y Change
48
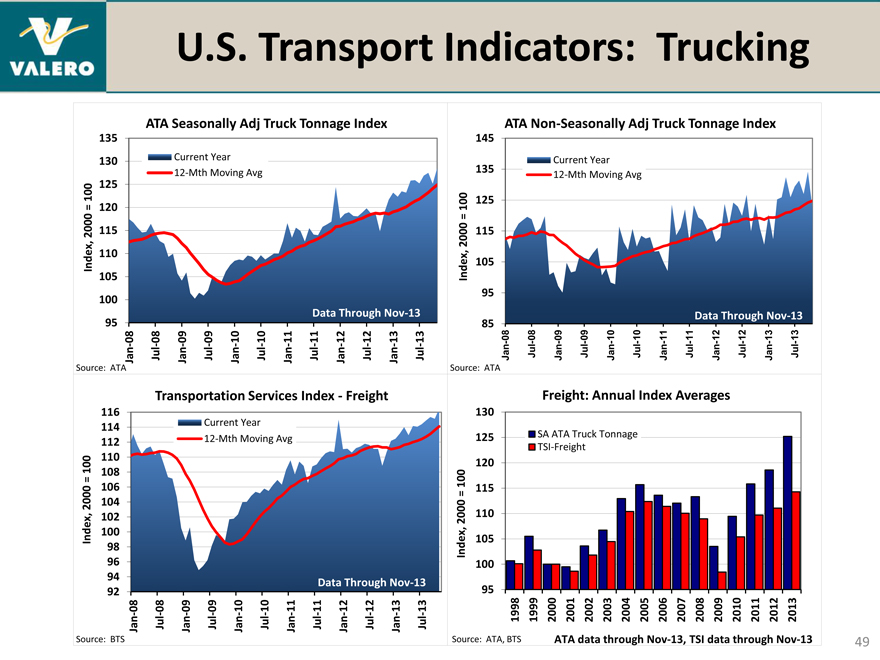
U.S. Transport Indicators: Trucking
Source: Index, 2000 = 100
95 100 105 110 115 120 125 130 135
ATA
Jan-08
Jul-08 ATA
Jan-09 12-Mth Current
Jul-09 Year
Jan-10 Seasonally
Moving Avg Adj
Jul-10 Jan-11 Truck Jul-11 Data Jan-12 Tonnage
Jul-12 Through
Index
Jan-13 Nov-13 Jul-13
Source: Index, 2000 = 100
85 95 105 115 125 135 145
ATA
Jan-08
ATA
Jul-08
Jan-09 12-Mth Current
Jul-09
Year
Jan-10 Moving Non-Seasonally
Jul-10 Avg
Adj
Jan-11 Truck Jul-11
Jan-12 Data Tonnage
Jul-12 Through
Jan-13 Index Jul-13 Nov-13
Source: Index, 2000 = 100
92 94 96 98 100 102 104 106 108 110 112 114 116
BTS
Jan-08 Jul-08 Jan-09
Jul-09 12-Mth Current
Jan-10 Transportation
Year
Jul-10 Moving
Avg
Jan-11 Services
Jul-11 Index Data— Jan-12 Jul-12 Through Freight Jan-13 Jul-13 Nov-13
Freight: Annual Index Averages
130
125 SA ATA Truck Tonnage TSI-Freight
120 100 115 = 2000 110 Index, 105 100 95
1998 1999 20002001 2002 2003 2004 2005 2006 2007 200820092010 2011 2012 2013 Source: ATA, BTS ATA data through Nov-13, TSI data through Nov-13
49
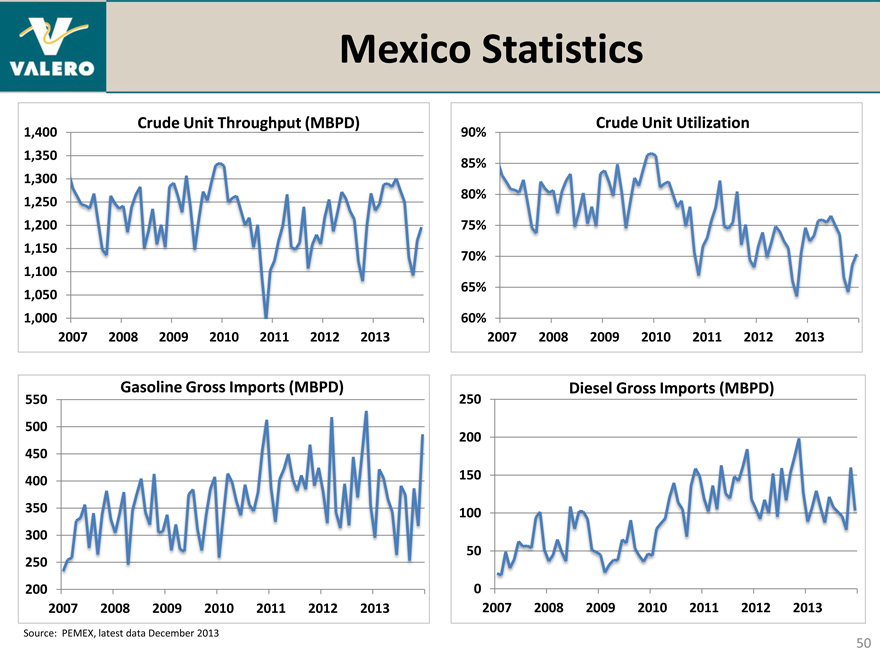
Mexico Statistics
Crude Unit Throughput (MBPD)
1,400 1,350 1,300 1,250 1,200 1,150 1,100 1,050 1,000
2007 2008 2009 2010 2011 2012 2013
Crude Unit Utilization
90% 85% 80% 75% 70% 65% 60%
2007 2008 2009 2010 2011 2012 2013
Gasoline Gross Imports (MBPD)
550 500 450 400 350 300 250 200
2007 2008 2009 2010 2011 2012 2013
Source: PEMEX, latest data December 2013
Diesel Gross Imports (MBPD)
250 200 150 100 50
0
2007 2008 2009 2010 2011 2012 2013
50
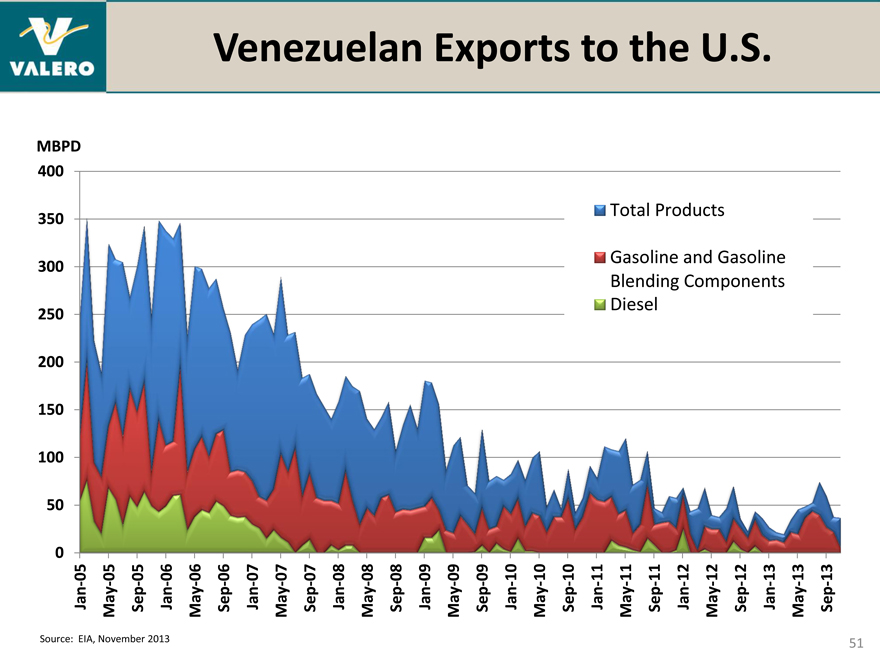
Venezuelan Exports to the U.S.
0 50100 150 200 250 300 350 400 MBPD
Jan-05 May-05 Sep-05 Jan-06 May-06 Sep-06 Jan-07 May-07 Sep-07 Jan-08 May-08 Sep-08 Jan-09 May-09 Sep-09 Jan-10 May-10 Sep-10 Jan-11 May-11 Total
Sep-11 Diesel Blending Gasoline
Jan-12 and
May-12 Products
Sep-12
Jan-13 Components Gasoline
May-13 Sep-13
Source: EIA, November 2013
51
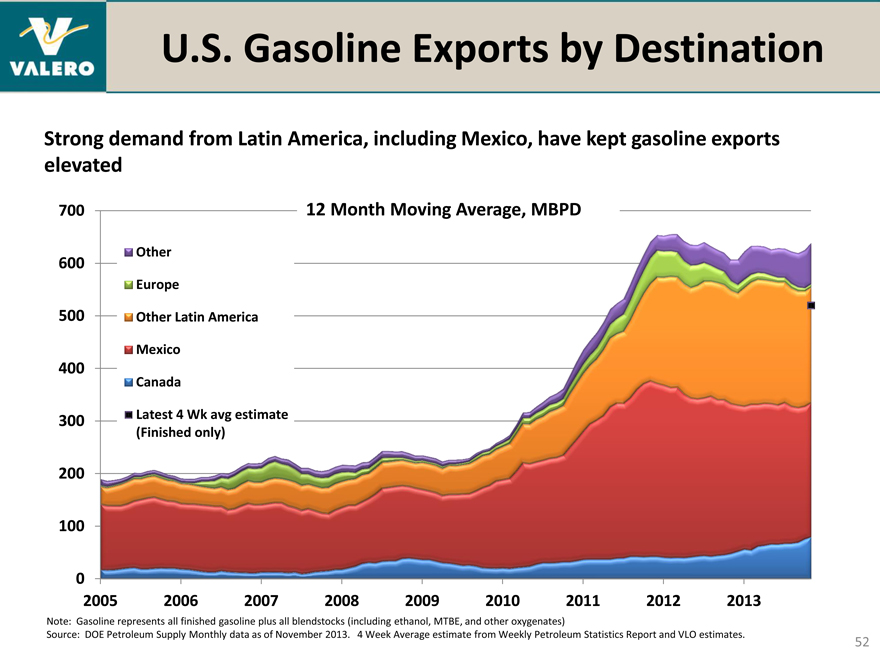
U.S. Gasoline Exports by Destination
Strong demand from Latin America, including Mexico, have kept gasoline exports elevated
700 12 Month Moving Average, MBPD
Other
600
Europe
500 Other Latin America Mexico
400
Canada
300 Latest 4 Wk avg estimate (Finished only)
200
100
0
2005 2006 2007 2008 2009 2010 2011 2012 2013
Note: Gasoline represents all finished gasoline plus all blendstocks (including ethanol, MTBE, and other oxygenates)
Source: DOE Petroleum Supply Monthly data as of November 2013. 4 Week Average estimate from Weekly Petroleum Statistics Report and VLO estimates.
52
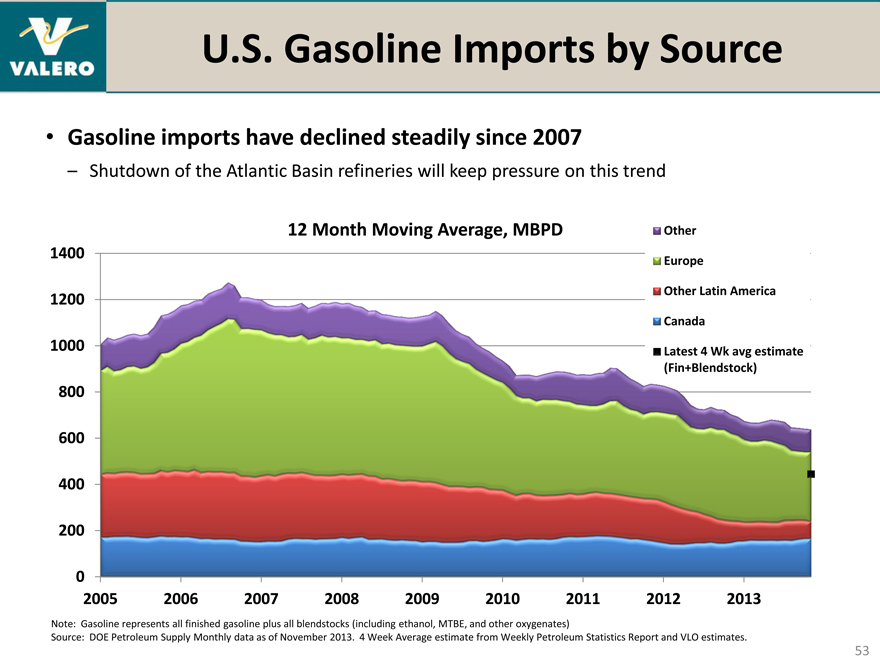
U.S. Gasoline Imports by Source
Gasoline imports have declined steadily since 2007
– Shutdown of the Atlantic Basin refineries will keep pressure on this trend
12 Month Moving Average, MBPD Other
1400 Europe
1200 Other Latin America Canada 1000 Latest 4 Wk avg estimate (Fin+Blendstock)
800 600 400 200
0
2005 2006 2007 2008 2009 2010 2011 2012 2013
Note: Gasoline represents all finished gasoline plus all blendstocks (including ethanol, MTBE, and other oxygenates)
Source: DOE Petroleum Supply Monthly data as of November 2013. 4 Week Average estimate from Weekly Petroleum Statistics Report and VLO estimates.
53
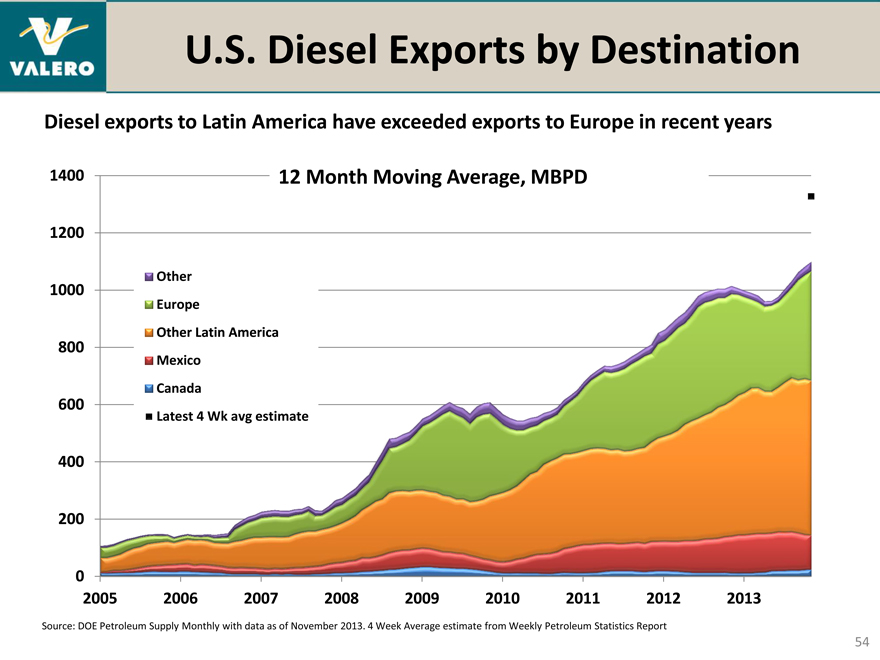
U.S. Diesel Exports by Destination
Diesel exports to Latin America have exceeded exports to Europe in recent years
1400 12 Month Moving Average, MBPD
1200
Other 1000 Europe
Other Latin America
800
Mexico 600 Canada
Latest 4 Wk avg estimate
400
200
0
2005 2006 2007 2008 2009 2010 2011 2012 2013
Source: DOE Petroleum Supply Monthly with data as of November 2013. 4 Week Average estimate from Weekly Petroleum Statistics Report
54
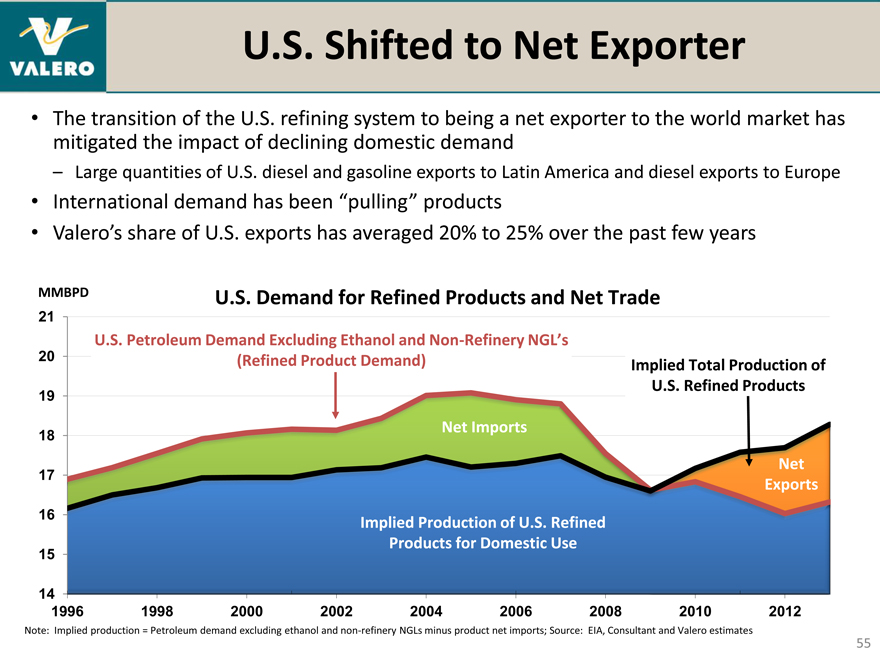
U.S. Shifted to Net Exporter
The transition of the U.S. refining system to being a net exporter to the world market has mitigated the impact of declining domestic demand
– Large quantities of U.S. diesel and gasoline exports to Latin America and diesel exports to Europe
International demand has been “pulling” products
Valero’s share of U.S. exports has averaged 20% to 25% over the past few years
MMBPD U.S. Demand for Refined Products and Net Trade
21
U.S. Petroleum Demand Excluding Ethanol and Non-Refinery NGL’s
20 (Refined Product Demand) Implied Total Production of U.S. Refined Products
19
Net Imports
18
Net
17
Exports
16 Implied Production of U.S. Refined Products for Domestic Use
15
14
1996 1998 2000 2002 2004 2006 2008 2010 2012
Note: Implied production = Petroleum demand excluding ethanol and non-refinery NGLs minus product net imports; Source: EIA, Consultant and Valero estimates
55
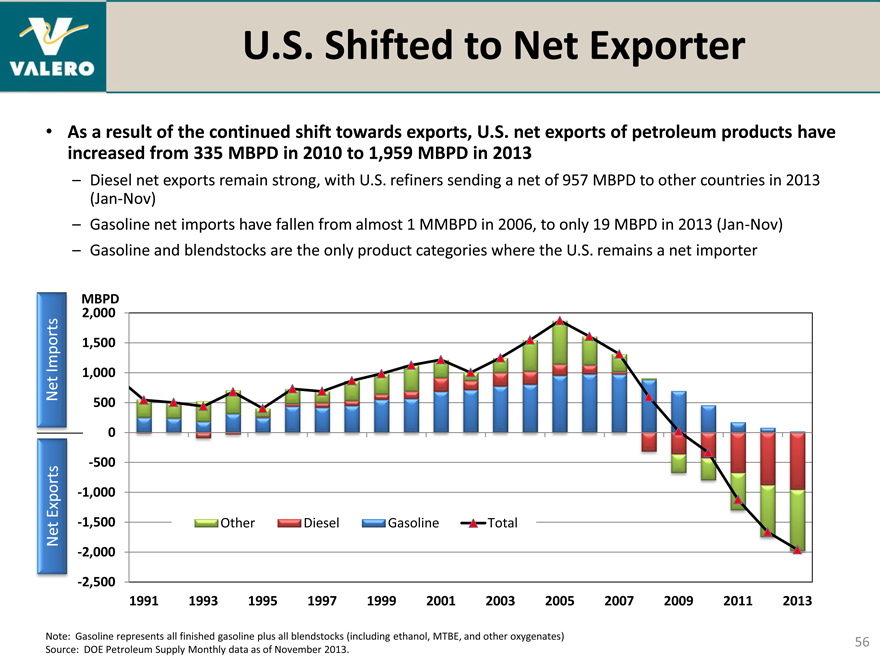
U.S. Shifted to Net Exporter
As a result of the continued shift towards exports, U.S. net exports of petroleum products have increased from 335 MBPD in 2010 to 1,959 MBPD in 2013
– Diesel net exports remain strong, with U.S. refiners sending a net of 957 MBPD to other countries in 2013 (Jan-Nov)
– Gasoline net imports have fallen from almost 1 MMBPD in 2006, to only 19 MBPD in 2013 (Jan-Nov)
– Gasoline and blendstocks are the only product categories where the U.S. remains a net importer
MBPD 2,000
Imports 1,500
Net 1,000 500 0 -500
Exports -1,000
Net -1,500 Other Diesel Gasoline Total
-2,000 -2,500
1991 1993 1995 1997 1999 2001 2003 2005 2007 2009 2011 2013
Note: Gasoline represents all finished gasoline plus all blendstocks (including ethanol, MTBE, and other oxygenates) Source: DOE Petroleum Supply Monthly data as of November 2013.
56
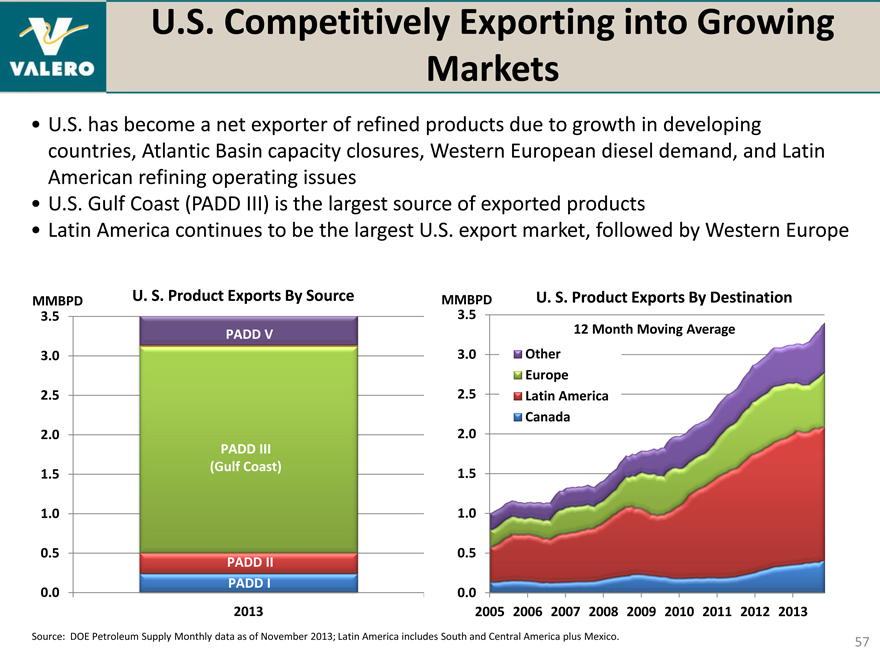
U.S. Competitively Exporting into Growing Markets
U.S. has become a net exporter of refined products due to growth in developing countries, Atlantic Basin capacity closures, Western European diesel demand, and Latin American refining operating issues
U.S. Gulf Coast (PADD III) is the largest source of exported products
Latin America continues to be the largest U.S. export market, followed by Western Europe
MMBPD U. S. Product Exports By Source
3.5
PADD V
3.0
2.5
2.0 PADD III
(Gulf Coast)
1.5
1.0
0.5
PADD II PADD I
0.0
2013
MMBPD U. S. Product Exports By Destination
3.5 12 Month Moving Average 3.0 Other Europe 2.5 Latin America Canada 2.0
1.5 1.0 0.5
0.0
2005 2006 2007 2008 2009 2010 2011 2012 2013
Source: DOE Petroleum Supply Monthly data as of November 2013; Latin America includes South and Central America plus Mexico.
57
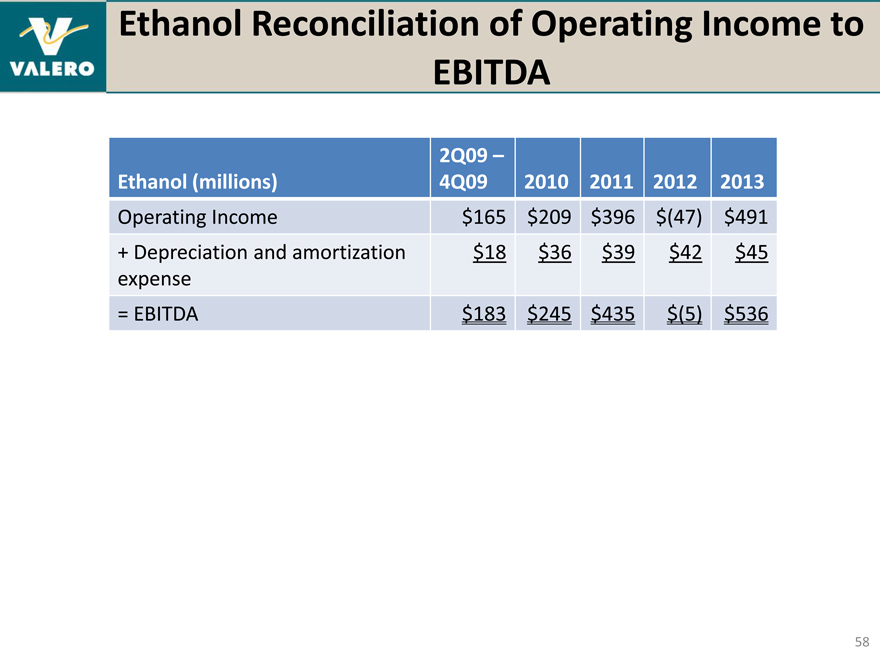
Ethanol Reconciliation of Operating Income to EBITDA
2Q09 –
Ethanol (millions) 4Q09 2010 2011 2012 2013
Operating Income $165 $209 $396 $(47) $491
+ Depreciation and amortization $18 $36 $39 $42 $45
expense
= EBITDA $183 $245 $435 $(5) $536
58
Investor Relations Contacts
For more information, please contact:
Ashley Smith, CFA, CPA
Vice President, Investor Relations 210.345.2744 ashley.smith@valero.com
Karen Ngo
Manager, Investor Relations 210.345.4574 karen.ngo@valero.com
John Locke
Executive Director, Investor Relations – VLP 210-345-3077 john.locke@valero.com
59