   Investor Presentation May 2015 Exhibit 99.01 |
 Statements contained in this presentation that state the company’s or management’s expectations or predictions of the future are forward– looking statements intended to be covered by the safe harbor provisions of the Securities Act of 1933 and the Securities Exchange Act of 1934. The words “believe,” “expect,” “should,” “estimates,” “intend,” and other similar expressions identify forward–looking statements. It is important to note that actual results could differ materially from those projected in such forward–looking statements. For more information concerning factors that could cause actual results to differ from those expressed or forecasted, see Valero’s annual reports on Form 10-K and quarterly reports on Form 10-Q, filed with the Securities and Exchange Commission, and available on Valero’s website at www.valero.com. 2 Safe Harbor Statement |
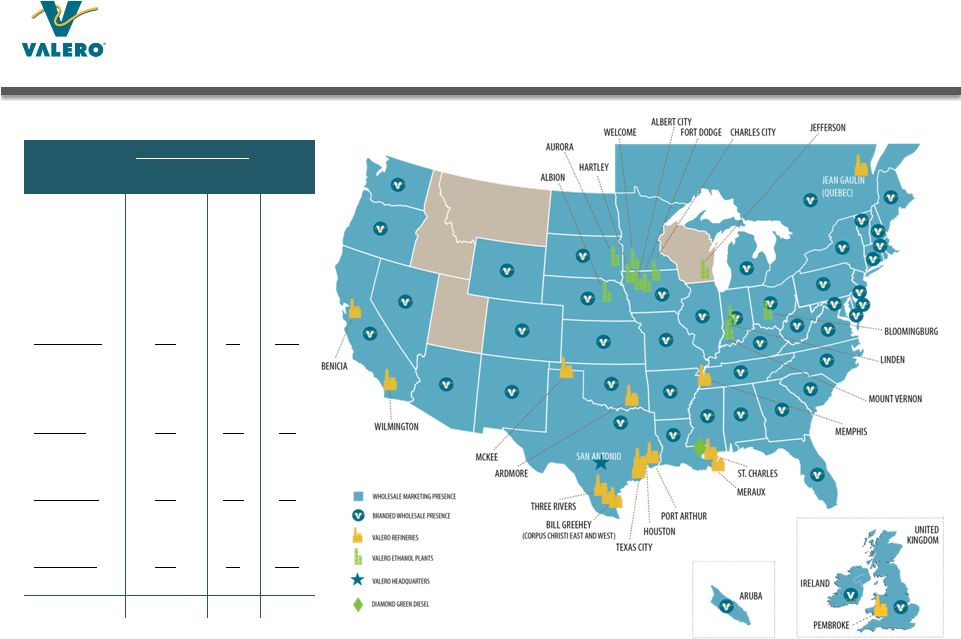
 3 Who We Are World’s Largest Independent Refiner • 15 refineries, 2.9 million barrels per day (BPD) of high-complexity throughput capacity • Greater than 70% of refining capacity located in U.S. Gulf Coast and Mid-Continent • Approximately 10,000 employees Large Logistics Infrastructure with Focus on Growth • General partner and majority owner of Valero Energy Partners LP (NYSE: VLP), a growth-oriented, fee-based master limited partnership (MLP) • Significant inventory of logistics assets within Valero Wholesale Fuels Marketer • Approximately 7,400 marketing sites in U.S., Canada, United Kingdom, and Ireland • Brands include Valero, Ultramar, Texaco, Shamrock, Diamond Shamrock, and Beacon One of North America’s Largest Renewable Fuels Producers • 11 corn ethanol plants, 1.3 billion gallons per year (85,000 BPD) production capacity • Operator and 50% owner of Diamond Green Diesel joint venture – 10,800 BPD renewable diesel production capacity |
 4 Assets Concentrated in Advantaged Locations Refinery Capacities (MBPD) Nelson Index Throughput Crude Corpus Christi 325 205 19.9 Houston 175 90 15.4 Meraux 135 125 9.7 Port Arthur 375 335 12.4 St. Charles 290 215 16.0 Texas City 260 225 11.1 Three Rivers 100 89 13.2 Gulf Coast 1,660 1,284 14.0 Ardmore 90 86 12.1 McKee 180 168 9.5 Memphis 195 180 7.9 Mid-Con 465 434 9.3 Pembroke 270 210 10.1 Quebec City 235 230 7.7 North Atlantic 505 440 8.9 Benicia 170 145 16.1 Wilmington 135 85 15.9 West Coast 305 230 16.0 Total or Avg 2,935 2,388 12.4 |
 5 Key Market Trends U.S. and Canadian crude oil, natural gas, and natural gas liquids (NGLs) production growth is providing cost advantages to North American refiners - Lower crude prices may temporarily constrain production growth rate Location-advantaged refiners in U.S. Gulf Coast, Mid-Continent, and Canada benefit from resource advantages and/or export opportunities Global refined products demand growth is expected to continue - Expect lower prices to consumers will drive product demand growth |
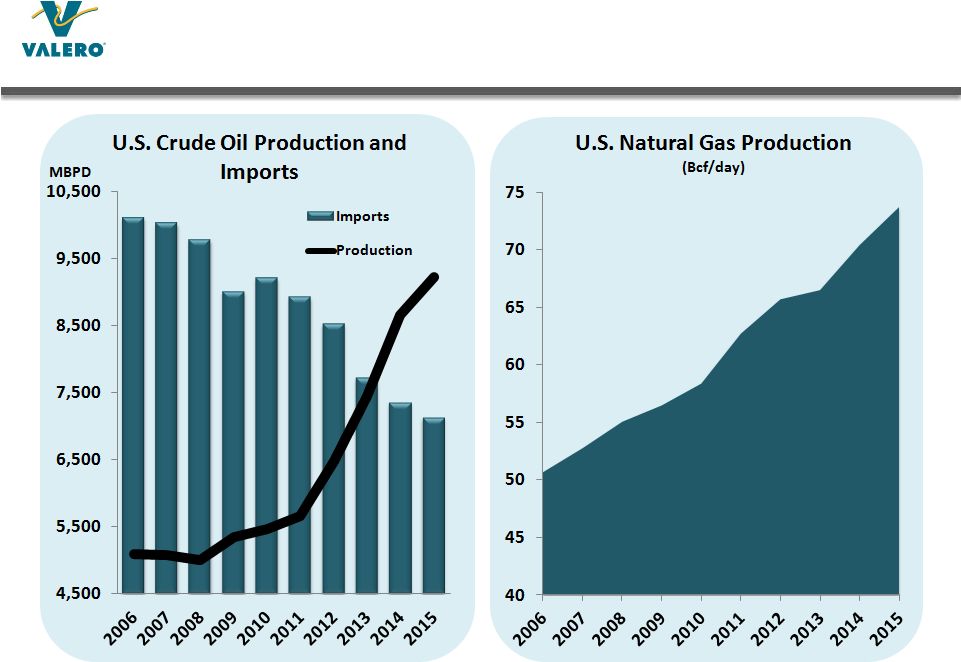 6 Production Growth Provides Resource Advantage to North American Refiners Source: DOE (for 2015, data through February) Source: DOE (for 2015, data through February) |
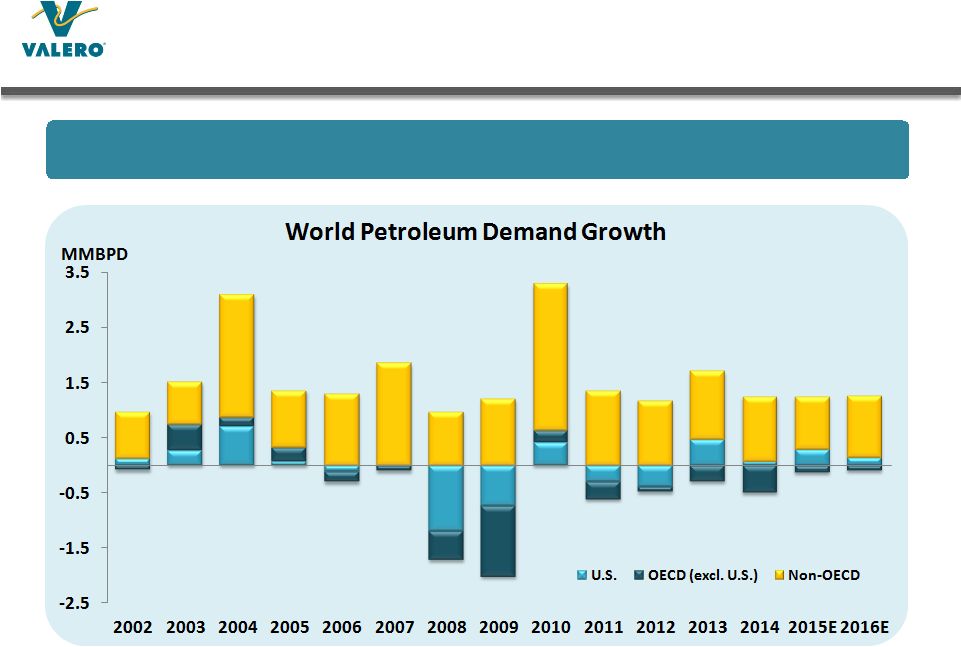 7 Global Petroleum Demand Projected to Grow Source: Consultant (EIA and IEA) and Valero estimates. Consultant annual estimates generally updated 6 to 12 months after year end. Emerging markets in Latin America, Middle East, Africa, and Asia lead demand growth |
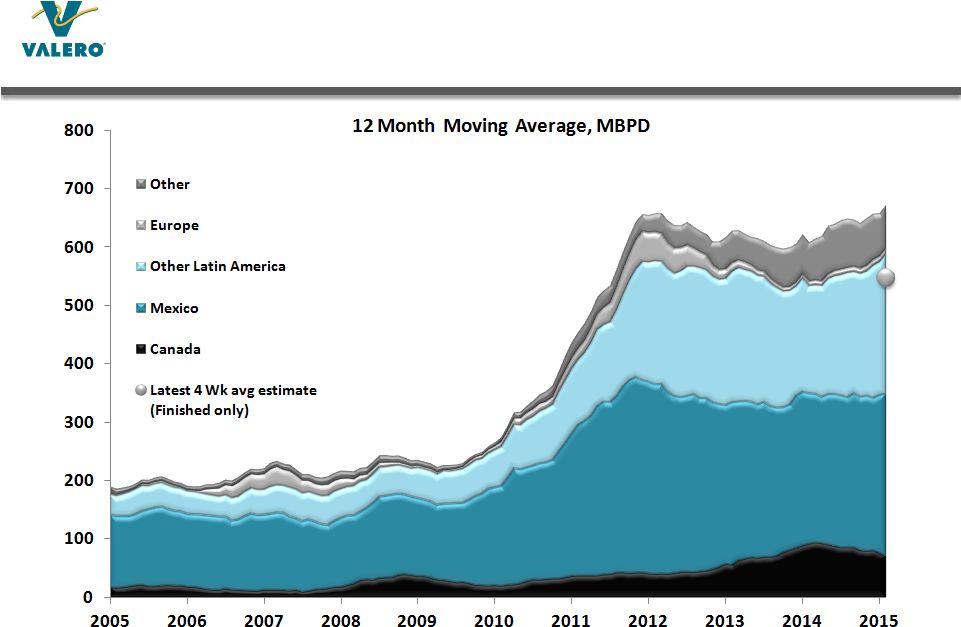
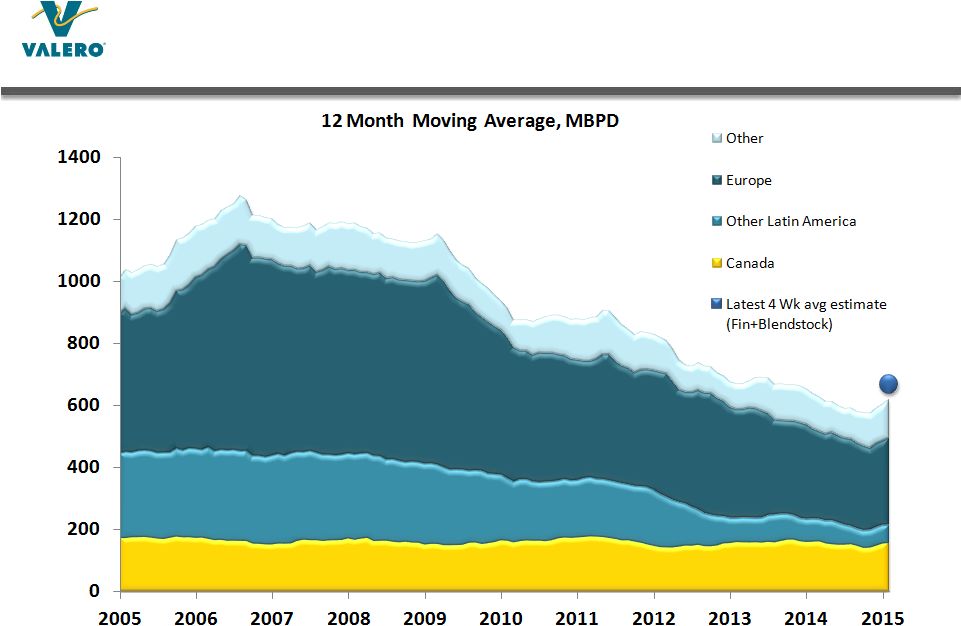
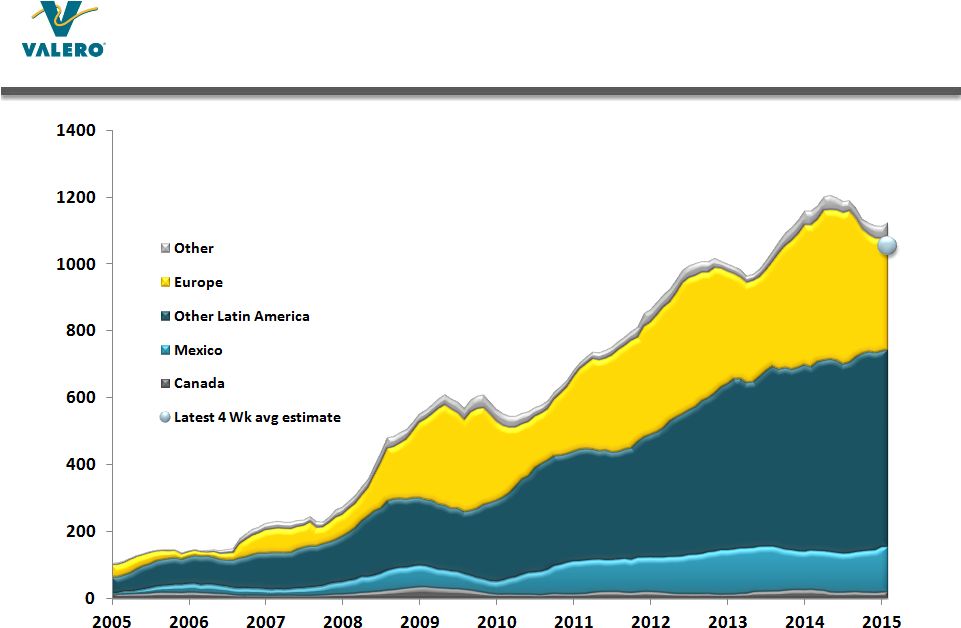
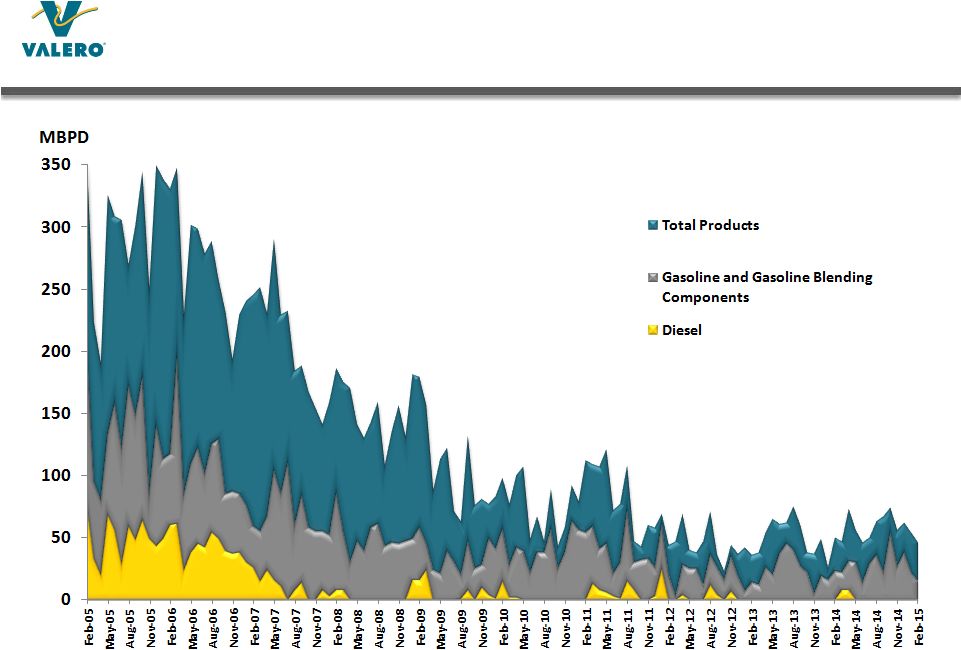
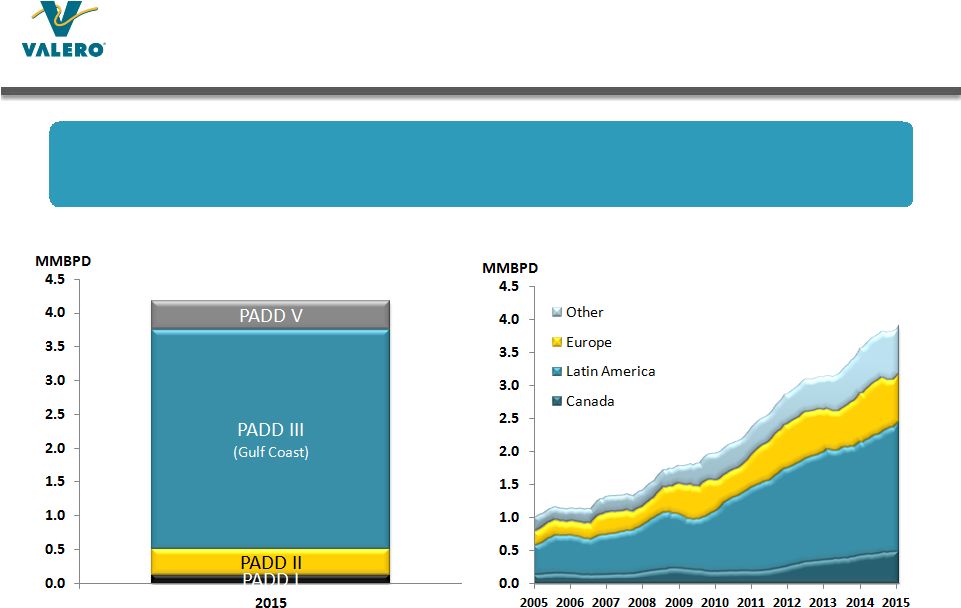 Source: DOE Petroleum Supply Monthly data as of February 2015; Latin America includes South and Central America plus Mexico. U. S. Product Exports By Destination 12 Month Moving Average U. S. Product Exports By Source 8 U.S. Is Growing Product Exports Market Share Refiners in U.S. Gulf Coast are the largest source of products exported to Latin America and countries in the Atlantic Basin |
 Strategy to Enhance Stockholder Returns Operations Excellence Capital Returns to Stockholders Disciplined Capital Investments Unlocking Asset Value • Demonstrate commitment to safe and reliable operations • Continuously improve our excellent operating performance • Optimize margins with refining system’s feedstock and product markets flexibility • Disciplined capital allocation • Seek to increase cash returns through dividend growth • Reduce shares outstanding and concentrate future value per share via stock buybacks • Rigorous investment management and execution process • Invest to grow logistics assets and reduce feedstock costs • Evaluate investments to upgrade natural gas and natural gas liquids • Opportunistic renewable fuels investments • Grow Valero Energy Partners LP and realize value for Valero • Execute accelerated drop-down strategy and evaluate other potential MLP-able earnings streams 9 |
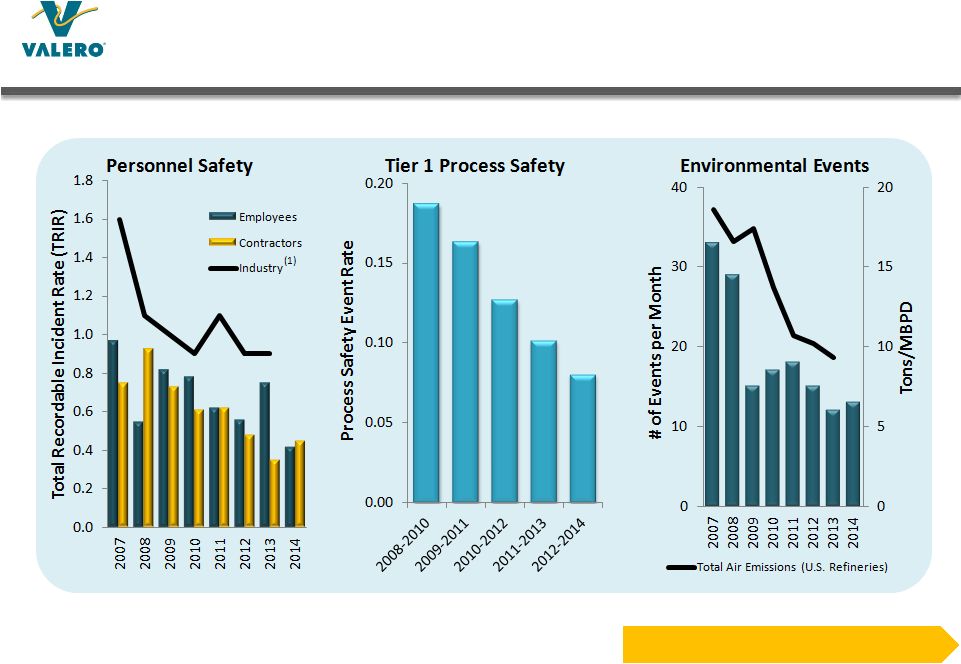 Persistent Focus Drives Results in Safety, Environmental, and Regulatory Compliance Operations Excellence 10 (1)Source: U.S. Bureau of Labor Statistics. All 2014 values are estimates. Statistics are for refining only. |
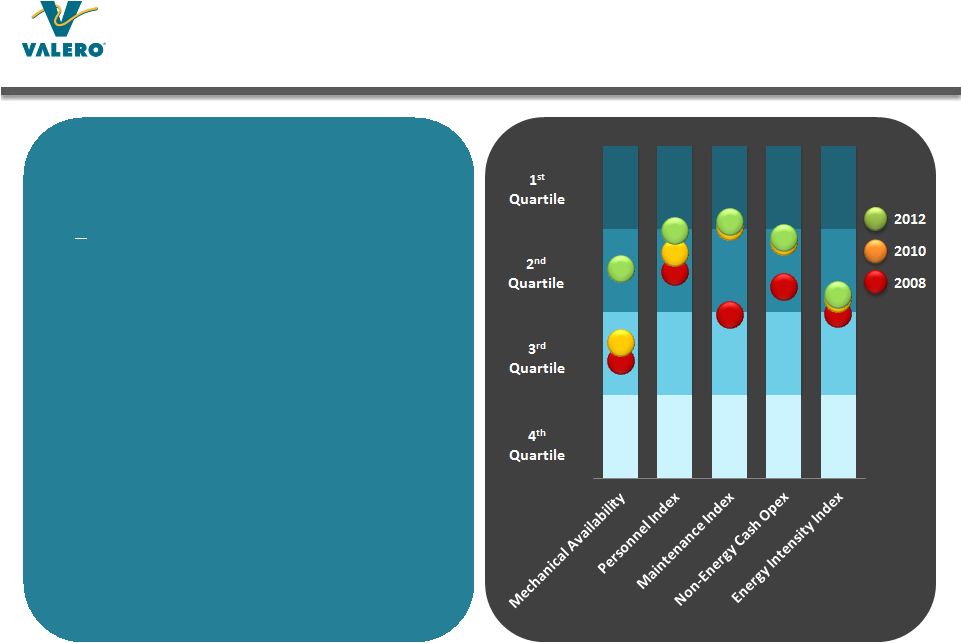 11 Excellent Operating Performance through Continuous Improvements Source: Solomon Associates and Valero Energy, includes Pembroke and Meraux • Reliability drives safe and profitable operations Seven of our refineries are first quartile in mechanical availability • Initiated new reliability programs and investments beginning mid- 2000s • Significant gains made in operations benchmarks since 2008, particularly in mechanical availability • Personnel committed to excellence |
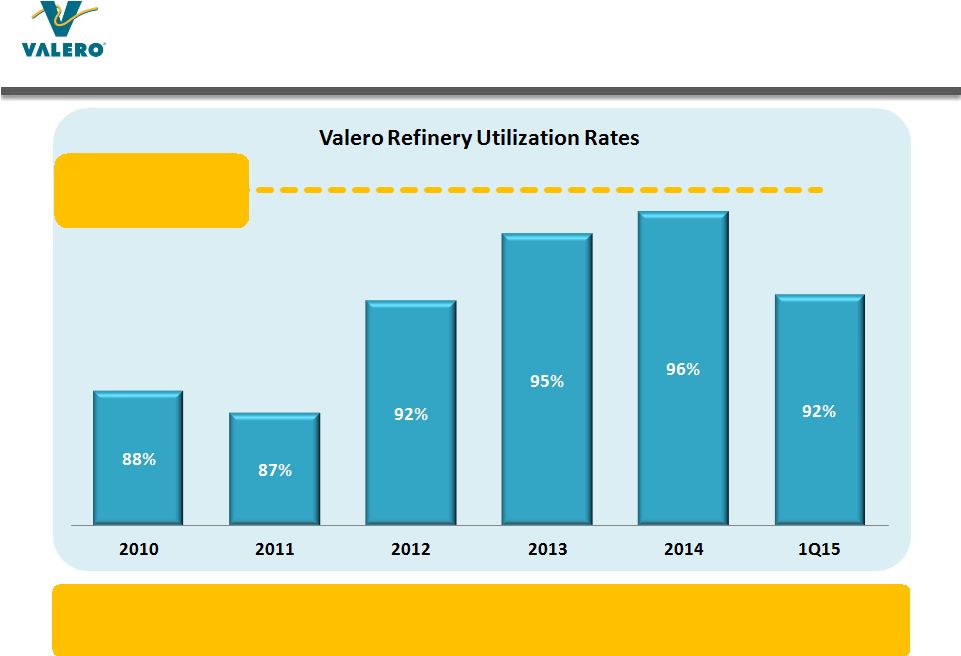 Sustained high availability and favorable margin environment enable higher capacity utilization rates 12 Investments, Operations Excellence, and Commercial Optimization Drive High Utilization System-wide mechanical availability near 1 quartile since 2011 st |
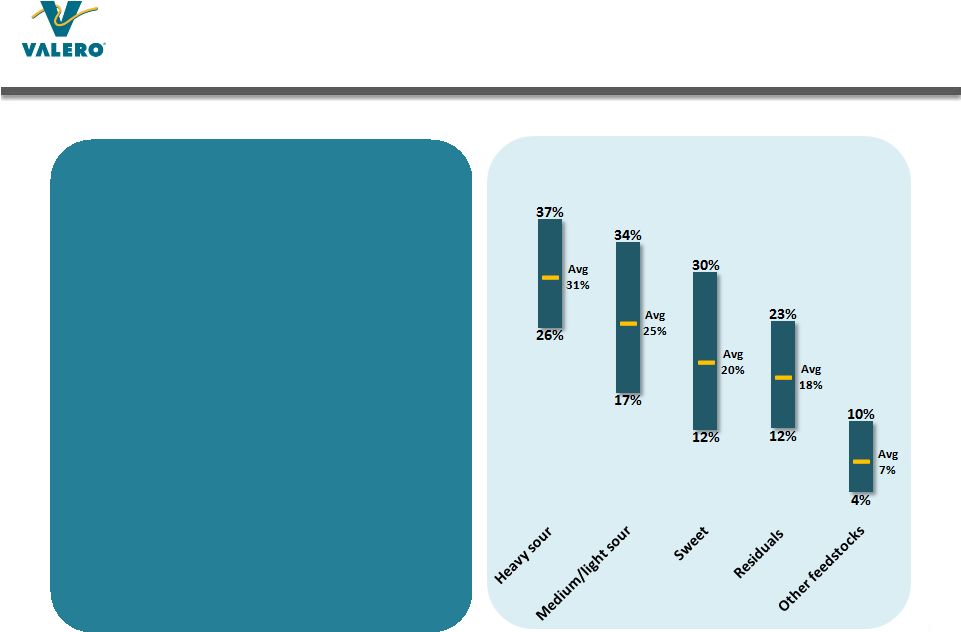 13 Refinery Feedstock Flexibility Enables Margin Optimization • Refining and logistics growth investments enhance our capability to adjust feedstocks and optimize margins • Able to shift feed slate as price environment changes • Expect additional light crude flexibility with completion of Houston and Corpus Christi topper units currently under construction Valero’s Gulf Coast Region Quarterly Feedstock Mix 2010 – 2015 (1) (1) 2015 through March 31. |
 14 Capital Allocation Framework Emphasizes Discipline and Stockholder Returns Dividend Growth • Focus on sustainability • Increase competition for cash flow versus reinvestments (growth capex and acquisitions) Sustaining Capex • Estimate $1.5 billion or lower annual “stay-in- business” spend • Key to safe and reliable operations Debt and Cash • Maintain investment grade credit rating • Target 20% to 30% debt-to-cap ratio (1) Stock Buybacks • Flexibility to return cash, reduce share count, and manage capital employed • Increase competition versus reinvestments Growth Capex • Prioritize higher-value, higher-growth opportunities that enhance future returns Acquisitions • Evaluate accretion versus stock buybacks • Enhance future returns “Non-Discretionary” “Discretionary” Capital Returns to Stockholders (1) Debt-to-cap ratio based on total debt reduced by $2 billion cash balance |
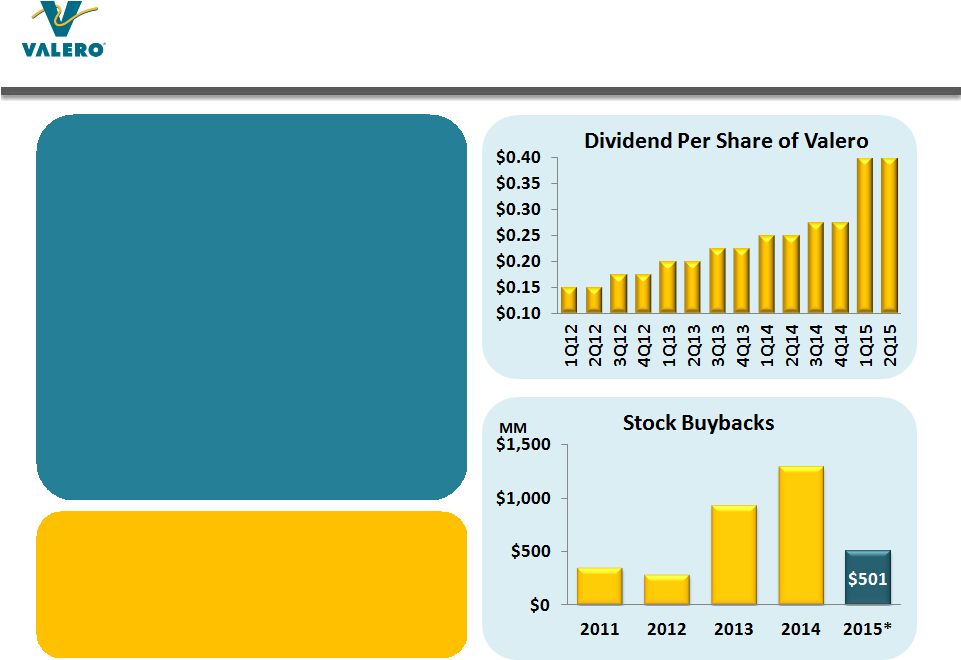 15 Increasing Dividends and Stock Buybacks • Increased dividend by 45% in 1Q15 versus 4Q14 • Regular dividend increases over last three years • Accelerated stock buybacks beginning in 2013 • Approximately $1.2 billion of stock repurchase authorization at end of 1Q15 Targeting >50% total payout ratio of earnings in 2015 via dividends and stock buybacks *2015 through May 11 |
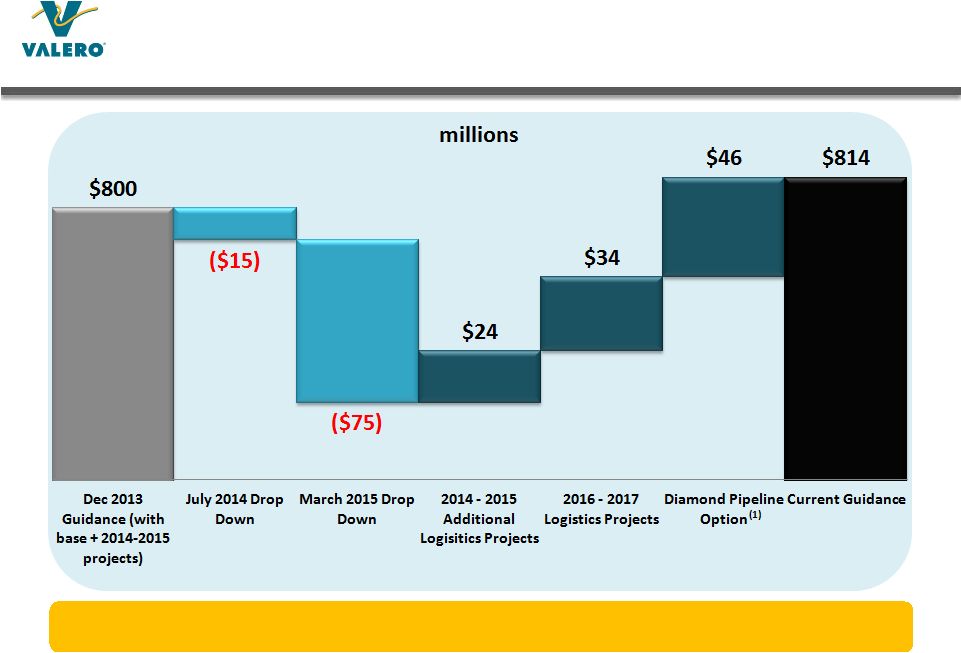
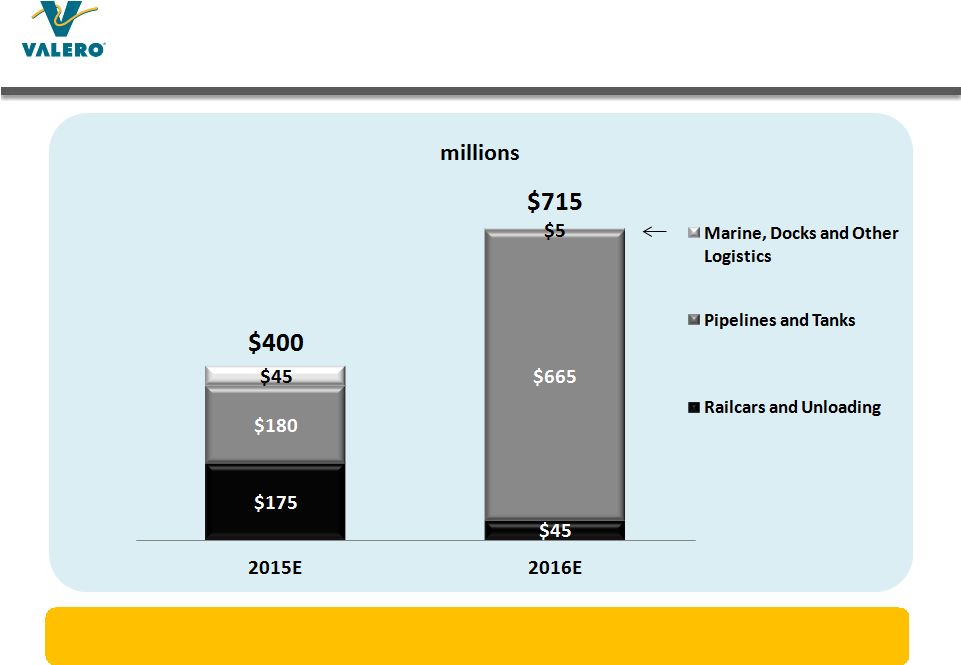
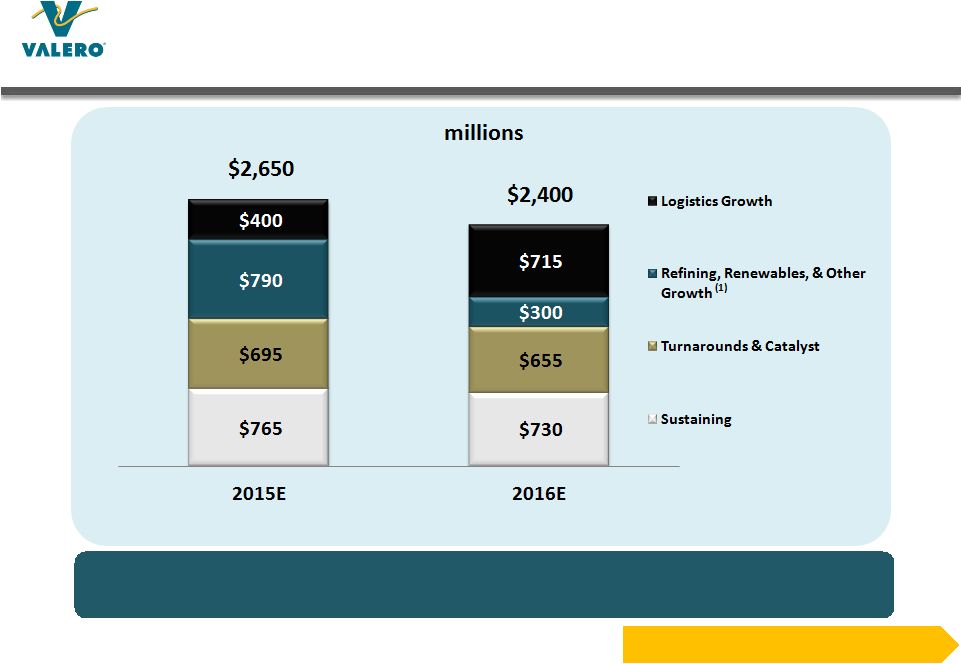 16 Advancing Growth Investments While Managing Capital Spending Lower (1) Excludes estimated placeholder for methanol project of $150 million in 2015 and $300 million in 2016 as evaluation remains in progress • Logistics growth spending increases after completion of crude toppers in 2016 • Expect nearly all logistics growth investments to be eligible for drop-down to VLP Disciplined Capital Investment |
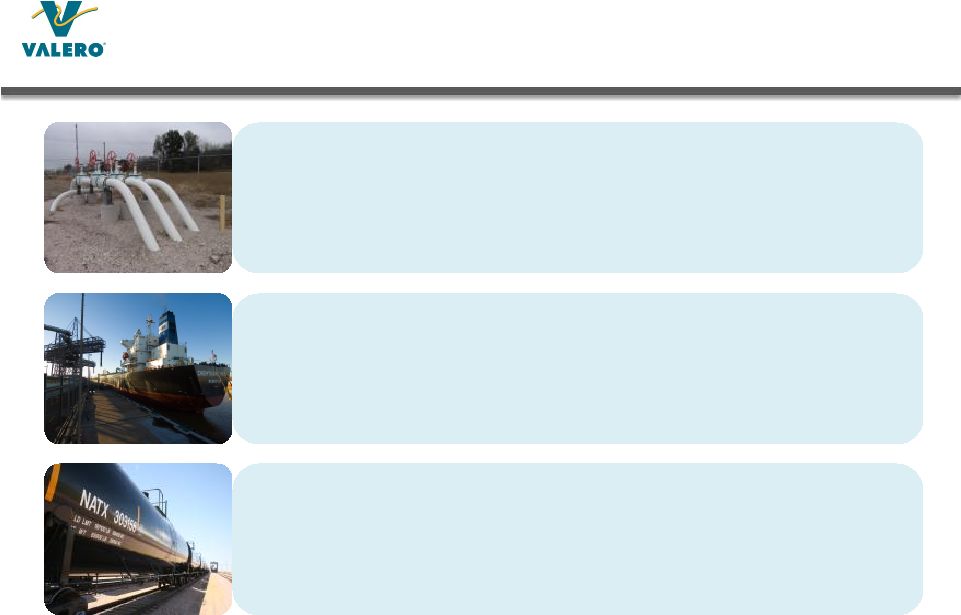    Pipelines • Connection to Centurion pipeline in Childress, TX and incremental 40 to 50 MBPD Midland-priced crude as substitute for Cushing-priced crude primarily at the McKee refinery • Expect Diamond Pipeline to supply Memphis refinery via Cushing, with start up in 1H17 Tanks, Docks, and Vessels • Tanks and vessels to supply crude to Quebec City refinery post-Enbridge Line 9B reversal expected in 2Q15 • Commissioned new Corpus Christi dock in 3Q14 and tanks for crude oil loading in April 2015 17 Logistics Investments Enhance Valero’s Feedstock Flexibility and Export Capability Rail • Purchased 5,320 CPC-1232 railcars; received 4,964 through April 2015 • Expect new railcars to serve long-term needs in ethanol and asphalt • Crude unloading facilities at Quebec City, St. Charles, and Port Arthur |
 18 Crude Topper Investments Very Attractive Estimate $500 million annual EBITDA for combined projects in 2014 price environment • 160 MBPD new topping capacity designed to process up to 50 API domestic sweet crude Should lower feedstock cost by generating 55 MBPD low sulfur resid Expect increase in net throughput capacity of 105 MBPD • Expect startup in 1H16 • Expect 50% IRR on 2014 prices, >25% IRR with Brent and LLS even • Corpus Christi: Estimated $350 MM capex for 70 MBPD capacity • Houston: Estimated $400 MM capex for 90 MBPD capacity Incremental Volume (MBPD) Feeds Eagle Ford crude 160 Low sulfur atmos resid (55) Products LPG 3.3 Propylene 1.3 BTX 0.4 Naphtha (at export prices) 40 Gasoline 12 Jet 39 Diesel 13 Resid (3) Combined Projects Estimates Total investment (1) $750 MM Annual EBITDA contribution (2) $500 MM Unlevered IRR on total spend (2) 50% See Appendix for assumptions. (1) Excluding interest and overhead allocation (2) Estimates based on 2014 full year average prices; EBITDA = operating income before deduction for depreciation and amortization expense |
 19 Investments in Natural Gas and NGLs Upgrading Hydrocracker Expansions Evaluating Methanol Plant at St. Charles Evaluating Houston Alkylation Unit • 1.6 – 1.7 million tonnes per year production (36 – 38 MBPD) • Leverages existing assets to reduce capital requirement compared to grassroots facility • Continuing to evaluate capital costs and project economics • Expect investment decision in 2Q15; startup in 2018 if approved • 12.5 MBPD capacity • Upgrades low-cost NGLs to premium-priced alkylate • Continuing to evaluate capital costs and project economics • Expect investment decision in 2015; startup in 2018 if approved • Increase distillate yield partially from hydrogen via natural gas • Completed Meraux’s 20 MBPD capacity expansion in 4Q14; expect approximately $90 million annual EBITDA contribution at 2014 (1) prices on total investment of approx. $260 million • 30 MBPD total capacity addition at Port Arthur and St. Charles in progress; expect startup in 2H15 (1) 2014 full year average prices; see project details in Appendix |
 20 Sponsored MLP Valero Energy Partners (NYSE:VLP) Growth-oriented logistics MLP with 100% fee-based revenues • Valero owns entire 2% general partner interest, all incentive distribution rights, and 69.6% LP interest • High-quality assets integrated with Valero’s refining system • Primary vehicle to grow Valero’s midstream investments • Provides access to lower cost capital Unlocking Asset Value |
 21 VLP Delivering Growth VLP is on target to acquire $1 billion of assets from VLO in 2015 See Appendix for reconciliation of estimated 2015 EBITDA to net income. • 1 acquisition – Texas Crude Systems Business in July 2014 for $154 million • 2 acquisition – Houston and St. Charles Terminal Services Business in March 2015 for $671 million • Plan to grow VLP’s 4Q15 annualized EBITDA to approximately $200 million • Targeting approximately 25% CAGR for LP distributions through 2017 st nd |
 22 Significant Inventory of Estimated MLP Eligible EBITDA at Valero Fuels distribution would provide incremental EBITDA if selected (1) Assumes total cost of $900 MM and 10x EBITDA multiple on VLO’s share. |
 23 Estimated Inventory of Eligible MLP Assets (1) Includes assets that have other joint venture or minority interests. Pipelines (1) • Over 1,200 miles of active pipelines • Expect start-up of 440-mile Diamond Pipeline from Cushing to Memphis refinery in 1H17 Racks, Terminals, and Storage (1) • Over 100 million barrels of active shell capacity for crude and products • 139 truck rack bays Rail • Three crude unloading facilities with estimated total capacity of 150 MBPD • Purchased CPC-1232 railcars expected to serve long-term needs in ethanol and asphalt Marine (1) • 51 docks • Two Panamax class vessels Fuels Distribution • Evaluating qualifying volumes and commercial structure as potential drop-down candidate |
 24 We Believe VLO Is an Excellent Investment • Majority of capacity has access to cost-advantaged crude, natural gas, NGLs, and corn • Proven operations excellence • Emphasis on capital allocation to stockholders • Discipline and rigor in capital projects and M&A selection and execution • Unlocking value through growth in MLP-able assets and drop- downs to VLP • Excellent ethanol investments and operations • Focus on valuation multiple expansion |
 25 Appendix Topic Pages Valero 2014 Highlights and 2015 Goals 26-27 Ethanol Segment 28 Capital Spending and Key Investment Details 29-39 Valero Energy Partners LP 40-41 Refining Operations Highlights 42-46 Macro Outlook and Key Margin Drivers 47-53 Global Demand and Refining Capacity 54-58 U.S. Fundamentals and DOE Data 59-68 International Fundamentals 69-70 Non-GAAP Reconciliations 71 IR Contacts 72 |
 26 Key 2014 Highlights Operations Excellence • Achieved record annual system refinery capacity utilization of approximately 96% in 2014 • Increased average consumption of price-advantaged North American light sweet crudes in 2014 by approximately 200 MBPD compared to 2013 • Reduced Quebec refinery’s crude costs by $3/bbl versus Brent from premium of approximately $2/bbl in 2013 to discount of approximately $1/bbl in 2014 • Secured attractively priced term-supply of WTI Midland for Mid-Continent refineries • Increased gasoline and diesel exports by 49 MBPD, or approximately 18%, in 2014 versus 2013 • Launched Top Tier gasoline in wholesale marketing system • Achieved record $835 million annual Ethanol segment EBITDA Capital Returns to Stockholders • Increased cash returned to stockholders through dividends and buybacks by $460 million in 2014, or 33%, versus 2013 Disciplined Capital Investments • Completed and started up Meraux hydrocracker conversion project in 4Q14 • Secured capital efficient Diamond Pipeline option and supply to Memphis refinery with crude from Cushing • Started up 90 MBPD of total crude rail unloading capacity at St. Charles and Port Arthur • Acquired idled ethanol plant in Mt. Vernon, Indiana at less than 15% of replacement cost and restarted facility within five months Unlocking Asset Value • Grew VLP via first drop-down acquisition of $154 million purchase price on July 1, 2014 Other • Diamond Green Diesel JV benefitted by approximately $126 million on retroactive reinstatement of Blenders Tax Credit |
 27 Key Goals Expected in 2015 Operations Excellence • Start up Montreal crude terminal with the Enbridge Line 9B reversal and lower Quebec refinery’s crude costs versus Brent compared to 2014 • Grow product export market share and increase branded wholesale fuels volume Capital Returns to Stockholders • Increase total payout ratio of earnings over 2014’s 50% payout level Disciplined Capital Investments • Complete Houston and Corpus Christi toppers on time and on budget • Make final investment decisions on methanol plant at St. Charles refinery and alkylation unit at Houston refinery; if approved, share strategic rationale with investors • Complete 25 MBPD McKee CDU capacity expansion • Complete 30 MBPD total hydrocracker capacity expansions at Port Arthur and St. Charles • Gain permit approval to construct Benicia crude rail unloading facility Unlocking Asset Value • Grow the size of identified MLP-able EBITDA available for drop-downs to VLP • Execute $1 billion of drop-down transactions to VLP |
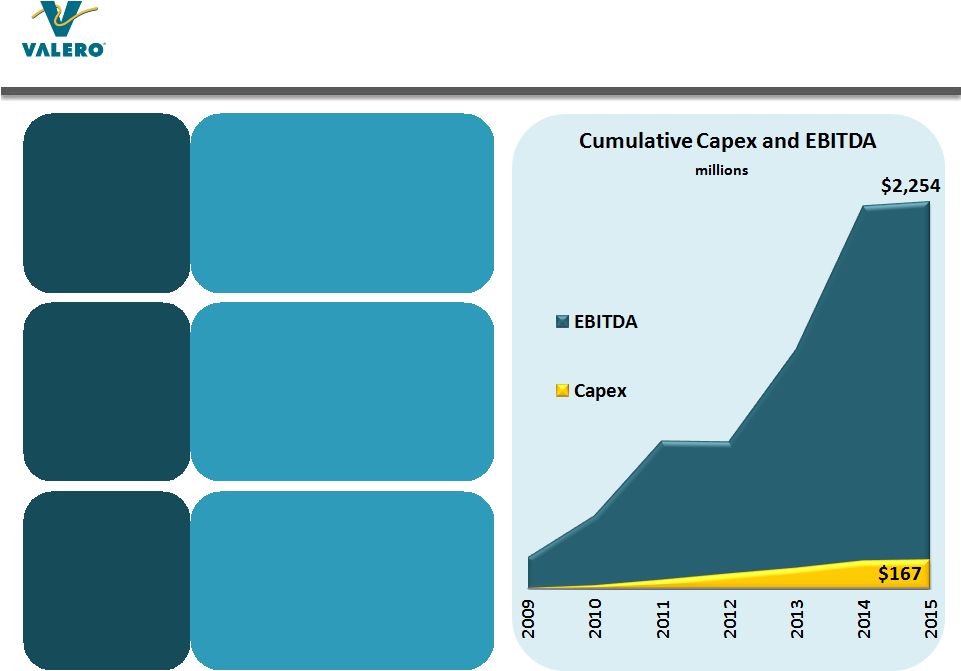 28 Ethanol Investments Have Performed Well Note: See Appendix for reconciliation of EBITDA to GAAP results. Outstanding Cash Generation Excellent Acquisitions Competitive Advantages • 11 plants acquired between 2Q09 and 1Q14 for $794MM, less than 35% of replacement value • 1.3 billion gallons total annual production • Scale and location in corn belt • Operational best practices transferred from refining • Low capital investment • $2.3 billion cumulative EBITDA generated since acquisitions • $167 million cumulative capex excluding acquisition costs |
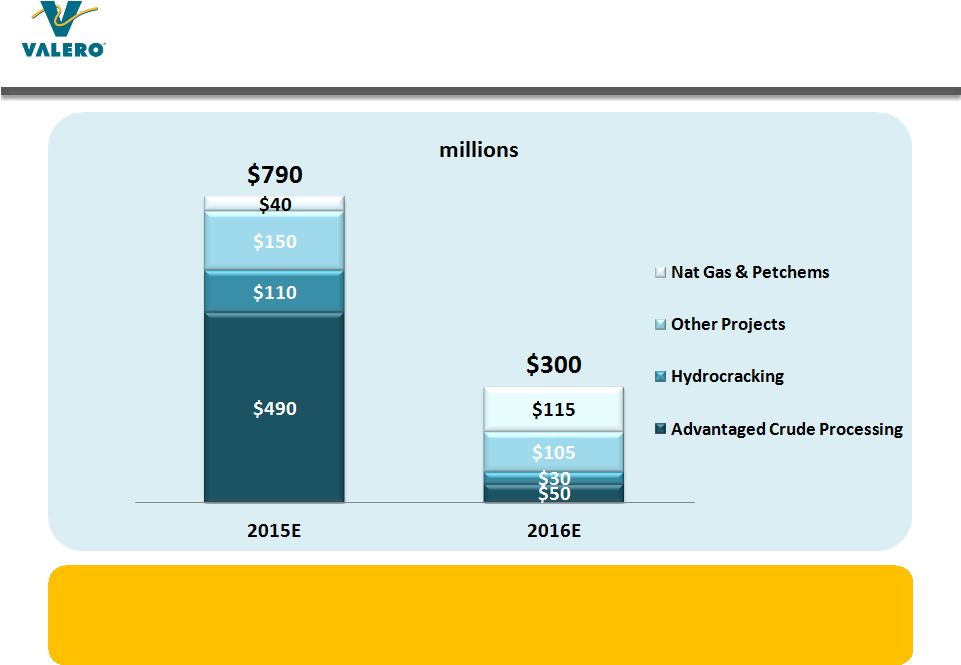 29 Refining & Renewables Capital Focused on Capturing Benefits of Key Long-Term Trends • Advantaged crude processing optimizes feedstock flexibility, mainly for light crudes • Hydrocracking increases production of high-margin distillates • Petchems, methanol, and hydrocracking upgrade natural gas or NGLs to higher value liquids |
 30 Allocating Significant Growth Capital to Logistics • Railcars spending declines as receipt of railcars order concludes • Future spending focuses on pipelines |
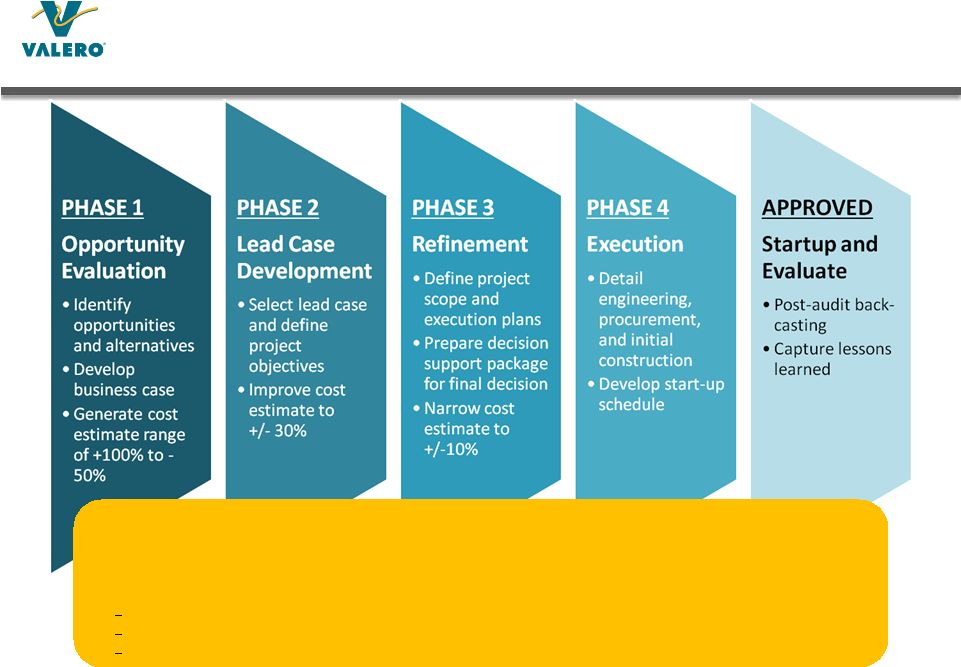 Gated Investment Management Process 31 • Development costs increase as project progresses through the phases • NPV and IRR of future cash flows per price forecasts and operating plans evaluated • “Target” IRR hurdle rate ranges, which can change depending on the project and market conditions: Refining growth projects, target >=50% in Phase 1 to >=30% in Phase 3 Cost savings projects, target >=12% in Phase 3 Logistics projects, target pre-tax >=12% in Phase 3 + refinery benefits |
 32 McKee Diesel Recovery Improvement and CDU Expansion Startup Expected in 2H15 Incremental Volume (MBPD) Feeds WTI 25 Products LPG 0.4 Benzene concentrate 0.3 Gasoline 12 Jet - Diesel 12 Resid 0.6 Project Estimates Total investment $140 MM Annual EBITDA contribution (1) $100 MM Unlevered IRR on total spend (1) 45% Investment Highlights • Adding 25 MBPD crude unit capacity and parallel light ends processing train • Expect to improve yields and volume gain by recovering diesel from FCC and HCU feeds • Expect to increase diesel and gasoline production on price- advantaged crude • Expect to reduce energy consumption via heat integration Status • Diesel recovery and benefits started in mid-2014; expect crude expansion start-up in 2H15 (1) Estimates based on 2014 full year average prices; EBITDA = operating income before deduction for depreciation and amortization expense |
 33 Meraux Hydrocracker Conversion Completed December 2014 Incremental Volume (MBPD) Feeds Purchased hydrogen (MMSCFD) 13 Products (MBPD) Gasoline 5 Jet - Diesel 19 HSVGO 2 Unconverted gasoil (23) Fuel oil - Project Estimates Total investment $260 MM Annual EBITDA contribution (1) $90 MM Unlevered IRR on total spend (1) 25% (1) Estimates based on 2014 full year average prices; EBITDA = operating income before deduction for depreciation and amortization expense Investment Highlights • Converted hydrotreater into high- pressure hydrocracker and repurposed old FCC gas plant for additional LPG recovery • Expect to upgrade 23 MBPD gasoil and low-cost hydrogen (via natural gas) mainly into high quality diesel • Expect to increase refinery distillate yield versus gasoline (Gas/Diesel ratio drops from 0.72 to 0.59) • Expect to increase refinery liquid volume yield by 1.8% • Avoided compliance capex on FCC Status • Project started up in Dec 2014 and is operating well |
 34 Houston and Corpus Christi Crude Topping Units Expected Online in 1st Half of 2016 Project Estimates Total investment $350 MM Annual EBITDA contribution (1) $260 MM Unlevered IRR on total spend (1) 55% Estimates Incremental Volume (MBPD) Feeds Eagle Ford crude 90 Low sulfur atmos resid (29) Distillate (2) Butane (2) Hydrogen (MMSCFD) 3 Products LPG 0.8 Propylene 0.4 Naphtha 24 Gasoline 5 Jet 23 Diesel 4 Slurry 0.2 Project Estimates Total investment $400 MM Annual EBITDA contribution (1) $240 MM Unlevered IRR on total spend (1) 45% Corpus Christi Houston (1) Estimates based on 2014 full year average prices; EBITDA = operating income before deduction for depreciation and amortization expense Estimates Incremental Volume (MBPD) Feeds Eagle Ford crude 70 Low sulfur atmos resid (24) Products LPG 2.5 Propylene 0.9 BTX 0.4 Naphtha 16 Gasoline 7 Jet 16 Diesel 9 Resid (3) |
 35 Diamond Pipeline Project Estimates Total investment (1) $484 MM Cumulative spend through 2014 Zero Annual EBITDA contribution (2) $46 MM Unlevered pre-tax IRR on total spend at least 12% (1) Includes additional Valero cost for pipeline connection at Memphis refinery (2) EBITDA = Operating income before deduction for depreciation and amortization expense Investment Highlights • Valero holds option until January 2016 to acquire 50% interest in pipeline • Increases Memphis refinery’s crude supply flexibility via connection to Cushing and economic crudes • Provides direct control over crude blend quality • Grows Valero’s inventory of assets eligible for VLP drop-down in capital-efficient manner • Expect completion in 1H17 or earlier |
 36 Estimated Key Price Sensitivities on Project Economics Change in Estimated EBITDA (1) Relative to 2014 (2) Prices ($millions/year) McKee Diesel Recovery & CDU Expansion Meraux HCU Expansion Corpus Christi Topper Houston Topper ICE Brent, +$1/bbl none $0.8 $0.4 none ICE Brent – WTI, +$1/bbl $5.5 none None none ICE Brent – LLS, +$1/bbl N/A none $25.6 $32.9 Group 3 CBOB – ICE Brent, +$1/bbl $2.0 N/A N/A N/A Group 3 ULSD – ICE Brent, +$1/bbl $5.5 N/A N/A N/A USGC CBOB – ICE Brent, +$1/bbl N/A $1.7 $2.4 $2.4 USGC ULSD – ICE Brent, +$1/bbl N/A $6.8 $9.0 $9.9 Natural gas (Houston Ship Channel), +$1/mmBtu -$0.7 -$1.9 -$4.3 -$3.2 Naphtha – ICE Brent, +$1/bbl N/A none $5.8 $8.8 LSVGO – ICE Brent, + $1/bbl N/A -$7.3 $3.1 $5.2 Total investment IRR, +10% cost -6% N/A -5% -4% (1) Operating income before deduction for depreciation and amortization expense (2) 2014 full year average Note: Margin drivers shown are not inclusive of all feedstocks and products in economic models. Estimated economic sensitivities can not be accurately interpolated or extrapolated solely from the estimated key price sensitivities shown above. |
 37 Project Price Set Assumptions Driver ($/bbl) 2014 Average ICE Brent 99.49 ICE Brent – WTI 6.35 ICE Brent – LLS 2.75 USGC CBOB – ICE Brent 3.52 G3 CBOB – WTI 12.27 USGC ULSD – ICE Brent 14.25 G3 ULSD – WTI 23.88 Natural gas (Houston Ship Channel, $/mmBtu) 4.34 Naphtha – ICE Brent -0.67 LSVGO – ICE Brent 8.86 |
 • Approximately half of benefits visible in margin capture rate increase of >4% and balance of benefits in 100 MBPD throughput volume increase from feedstocks and new gas plant • Benefits visible in U.S. Gulf Coast region reported results improvement from 4Q12 to 3Q14 38 Port Arthur and St. Charles Hydrocrackers Performing Better Than Expected • 120 MBPD of combined new capacity successfully started end of 2012 and mid-2013 • Designed to produce high-quality distillates from low-quality feedstocks and natural gas • Realized annual EBITDA estimated at $800 million for trailing 4-quarters 3Q14 • Compares to $780 million implied by disclosed guidance model (1) (1) See page 39 for details and assumptions. |
 39 Port Arthur and St. Charles Hydrocrackers Performance Details Benefits Realized in Reported Results Trailing 4 Quarters $mm, except /bbl amounts 4Q12 3Q14 Increase Gulf Coast Capture Rate 58.8% 63.2% 4.4% x Gulf Coast Indicator/bbl, trailing 4Q 3Q14 $19 = Extra margin captured/bbl $0.83 x Gulf Coast volume, trailing 4Q 3Q14 MPBD 1,586 x Annualized Days 365 = Benefit from higher Capture Rate $483 Gulf Coast Throughput Volume MBPD 1,488 1,586 98 x Gulf Coast Indicator/bbl, trailing 4Q 3Q14 $19 x Gulf Coast Capture Rate, trailing 4Q 3Q14 63% x Annualized Days 365 = Benefit from higher Volume $429 Total Benefit from Hydrocracker Projects $912 Less: estimated operating costs before depreciation and amort. exp. -110 = EBITDA (estimated) $802 Key Assumptions • Market prices for trailing 4 quarters as of 3Q14 applied to guidance model disclosed by Valero in February 2012 to estimate $780 million in EBITDA • Gulf Coast capture rate increase based on average of trailing 4 quarters reported margin per barrel (excluding cost of RINs allocated in results at $0.30/bbl for 4Q12 and $0.40/bbl for 4Q13 averages) divided by Gulf Coast indicator margin • Gulf Coast LPGs pricing based on propane • Many factors can influence our reported margins including, but not limited to, charges, yields, pricing, timing and ratability, secondary costs, other allocations, hedging, and GAAP inventory costing methods • EBITDA = operating income before deduction for depreciation and amortization expense |
 40 Drop Down of Houston and St. Charles Terminal Services Business to VLP Operations • Crude oil, intermediates, and refined petroleum product terminaling services in Houston, Texas and Norco, Louisiana 3.6 million barrels of storage capacity on the Houston ship channel 10 million barrels of storage on the Mississippi River • 10-year terminaling agreements with VLO subsidiaries • Over 85% of revenue is contractually obligated by minimum volume commitments • Expected to contribute $75 million of EBITDA annually Financing • $671 million transaction closed on March 1, 2015 • $411 million in cash to VLO $211 million in cash from VLP’s balance sheet $200 million under VLP’s revolving credit facility • $160 million 5-year subordinated loan agreement with VLO • $100 million issuance of VLP units to VLO 1,908,100 million common units 38,941 general partner units Common and general partner units allocated in proportion to allow general partner to maintain its 2 percent interest Transaction puts Valero on track to achieve $1 billion in drop-down transactions in 2015 |
 41 Valero’s GP Interest in VLP Nearing the “High Splits” Target Quarterly Distribution per Unit Marginal Percentage Interest in Distributions Unitholders GP Minimum quarterly $0.2125 98% 2% First target above $0.2125 up to $0.244375 98% 2% Second target above $0.244375 up to $0.265625 85% 15% Third target above $0.265625 up to $0.31875 75% 25% Thereafter $0.31875 50% 50% • 1Q15 distribution at $0.2775 per unit • Valero’s GP interest in VLP expected to reach 50% split in 2015, payable in 2016, based on accelerated drop-down strategy |
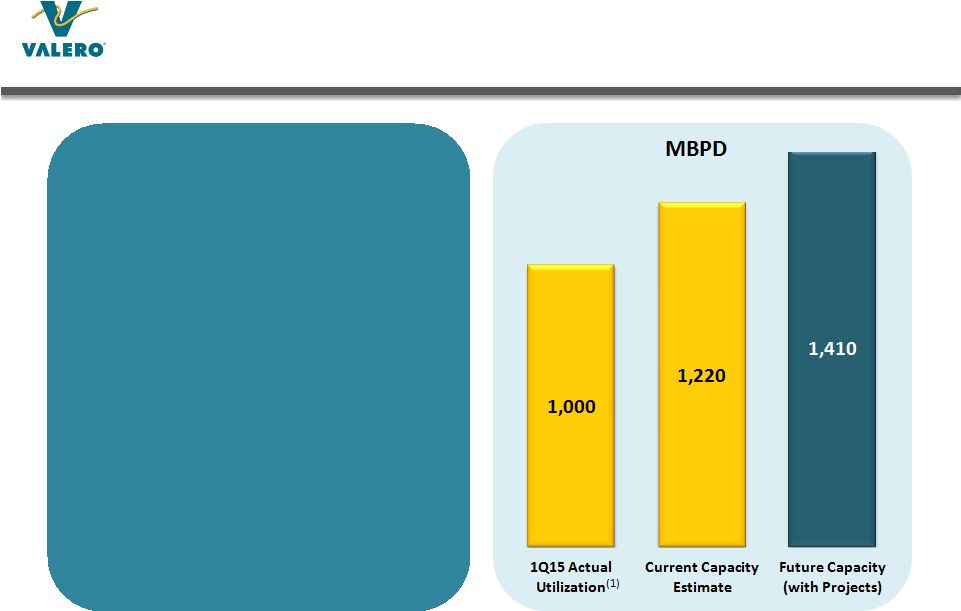 42 Valero’s Light Crude Processing Capacity in North America (1) Actual light crude consumption less than capacity due to turnaround maintenance and economics. Includes imported foreign sweet crudes. McKee Crude Unit Expansion • 25 MBPD additional capacity expected in 2H15 • Distillate recovery improvements Houston Crude Topper • 90 MBPD capacity expected 1H16 • Displaces 30 MBPD intermediate feedstock purchases Corpus Christi Crude Topper • 70 MBPD capacity expected 1H16 • Displaces 25 MBPD intermediate feedstock purchases |
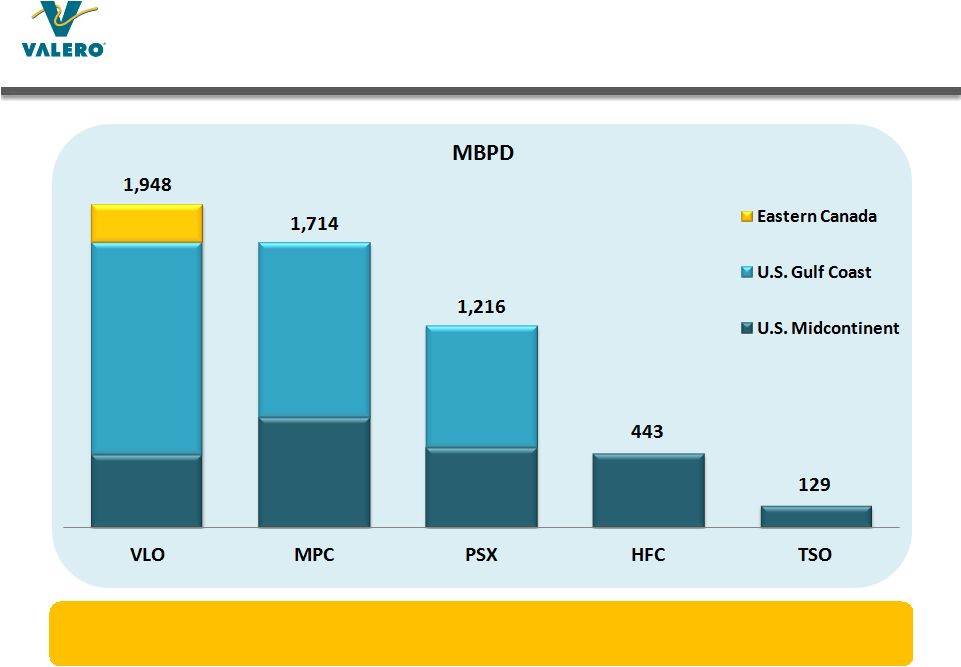 43 Valero Leads Peers in Total Location-Advantaged Crude Capacity Source: Company 10-K reports. Crude distillation capacity based on geographic location. Access to lower cost North American crude benefits refiners in Mid-Continent, Gulf Coast, and Eastern Canada; product export opportunities for Gulf Coast and Canada |
 44 Expect Quebec City Refinery to Have Cost-Advantaged Access to 100% North American Crude in 2015 Shifted to cost-advantaged crudes via rail and foreign flagged ships from USGC, with additional savings expected from deliveries on Enbridge Line 9B beginning in 3Q15 |
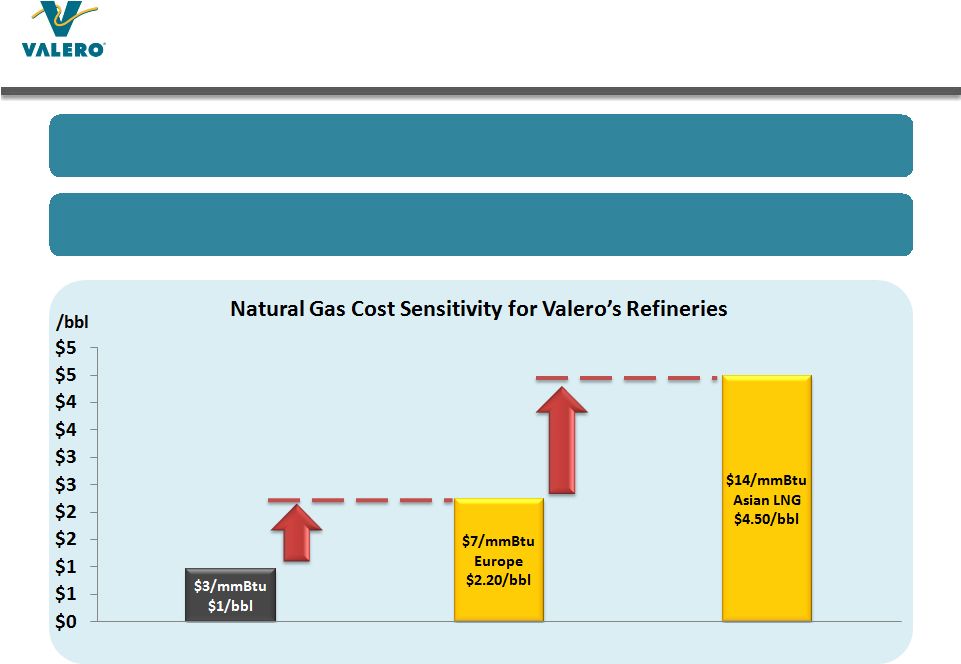 45 U.S. Natural Gas Provides Opex and Feedstock Cost Advantages Note: Estimated per barrel cost of 864,000 mmBtu/day of natural gas consumption at 92% refinery throughput capacity utilization, or 2.7 MMBPD. $1.3 billion higher pre-tax annual costs $2.8 billion higher pre-tax annual costs Valero’s refining operations consume approximately 864,000 mmBtu/day of natural gas, split almost equally between operating expense and cost of goods sold Significant annual pre-tax cost savings compared to refiners in Europe or Asia |
 46 Capacity to Export Additional Product Opportunities to expand U.S. Gulf Coast export capability for gasoline to 308 MBPD and diesel to 472 MBPD Export markets pull volume from U.S., enabling high refinery utilization and improved margins Supported by global refined products demand growth Logistics investments also support segregation |
 Long-Term Macro Market Expectations Global Outlook U.S. Economy and Petroleum Demand North American Resource Advantage International Export Markets • Economic activity and total petroleum demand increases • Transportation fuels demand grows • Refining capacity growth slows after 2015; utilization stabilizes then expected to increase • Refinery rationalization pressure continues in Europe, Japan, and Australia • Economic growth strengthens over next five years, which stimulates refined product demand • Diesel and jet fuel demand continues to strengthen • Gasoline demand continues to recover moderately, expected to strengthen near-term with lower prices • Natural gas production growth still attractive and development continues • Crude production growth continues, but tempered with lower prices • North American refiners maintain competitive advantage • Broad lifting of crude export ban not expected for several years, if ever • U.S. continues to be an advantaged net exporter of products • Atlantic Basin market continues to grow, with increasing demand from Latin America and Africa • U.S. Gulf Coast is strategically positioned with globally competitive assets 47 |
 48 U.S. and Canadian Production Growth Provides Crude Cost Advantage to North American Refiners Source: EIA, Consultants, company announcements and Valero estimates; 2015 U.S. Crude imports as of February 2015 |
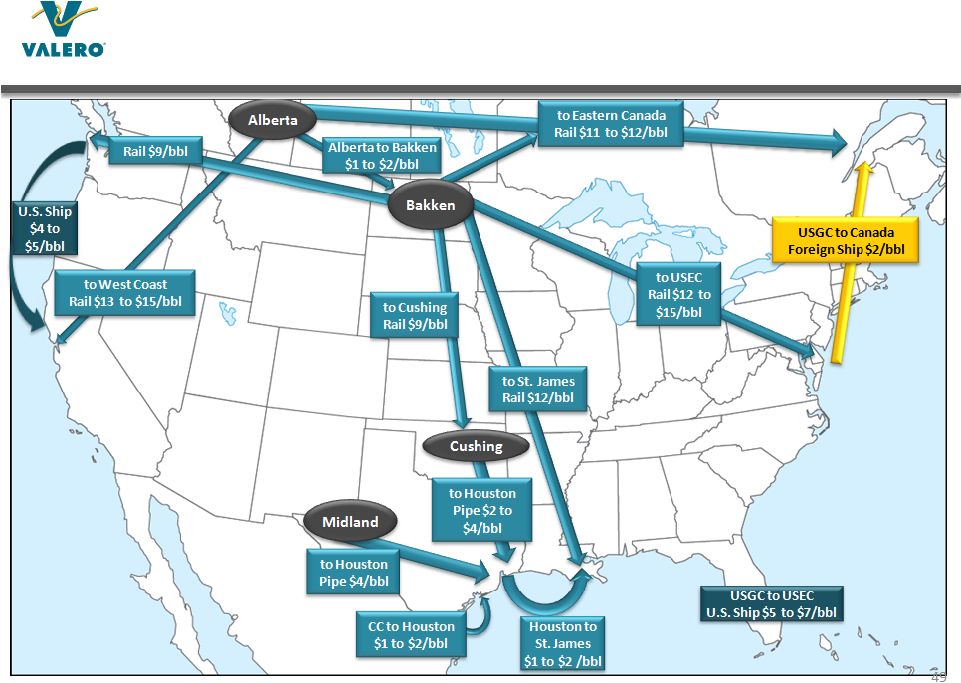 Estimated Crude Oil Transportation Costs |
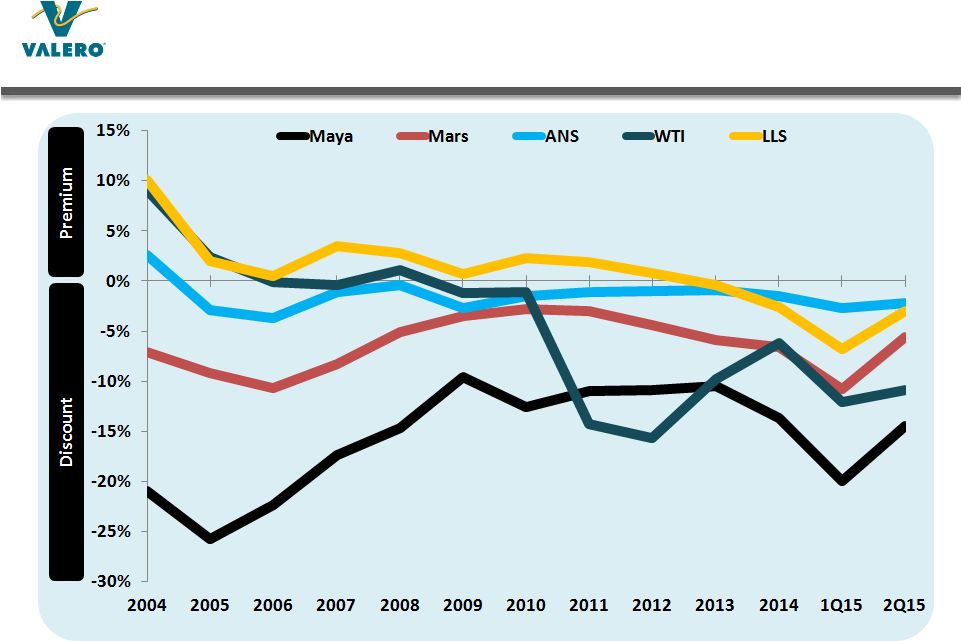 50 Crude Oil Differentials Versus ICE Brent Source: Argus; 2Q15 through May 1. LLS prices are roll adjusted. |
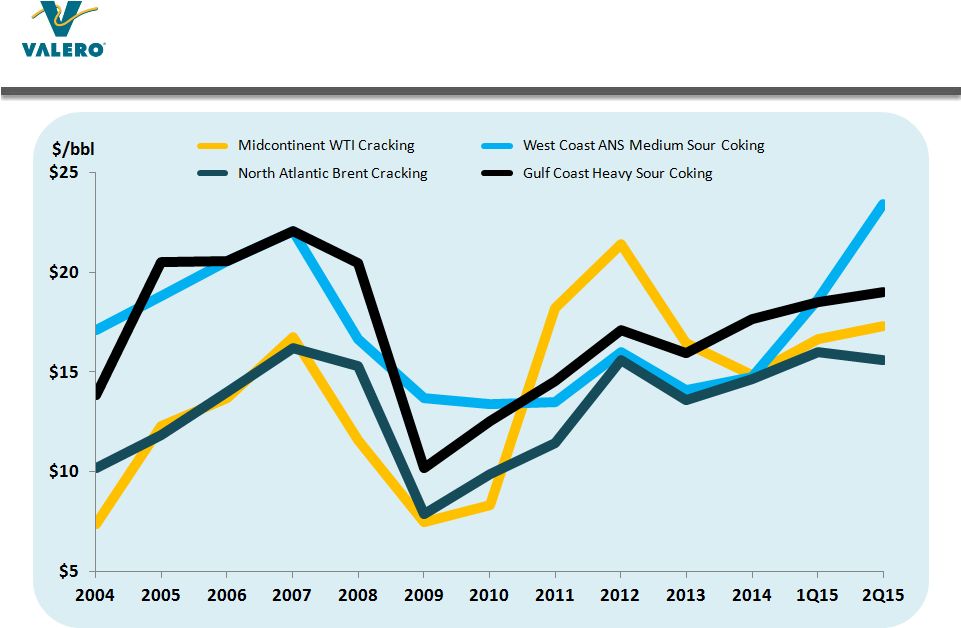 51 Valero’s Regional Refining Indicator Margins Source: Argus; 2Q15 through May 1. |
 • Gulf Coast Indicator: (GC Colonial 85 CBOB A grade- LLS) x 60% + (GC ULSD 10ppm Colonial Pipeline prompt - LLS) x 40% + (LLS - Maya Formula Pricing) x 40% + (LLS - Mars Month 1) x 40% • Midcontinent Indicator: [(Group 3 CBOB prompt - WTI Month 1) x 60% + (Group 3 ULSD 10ppm prompt - WTI Month 1) x 40%] x 60% + [(GC Colonial 85 CBOB A grade prompt - LLS) x 60% + (GC ULSD 10ppm Colonial Pipeline - LLS) x 40%] x 40% • West Coast Indicator: (San Fran CARBOB Gasoline Month 1 - ANS USWC Month 1) x 60% + (San Fran EPA 10 ppm Diesel pipeline - ANS USWC Month 1) x 40% + 10% (ANS – West Coast High Sulfur Vacuum Gasoil cargo prompt) • North Atlantic Indicator: (NYH Conv 87 Gasoline Prompt – ICE Brent) x 50% + (NYH ULSD 15 ppm cargo prompt – ICE Brent) x 50% • LLS prices are Month 1, adjusted for complex roll • Prior to 2010, GC Colonial 85 CBOB is substituted for GC 87 Conventional • Prior to 4Q13, Group 3 Conventional 87 gasoline substituted for Group 3 CBOB 52 Regional Indicator Margins Defined |
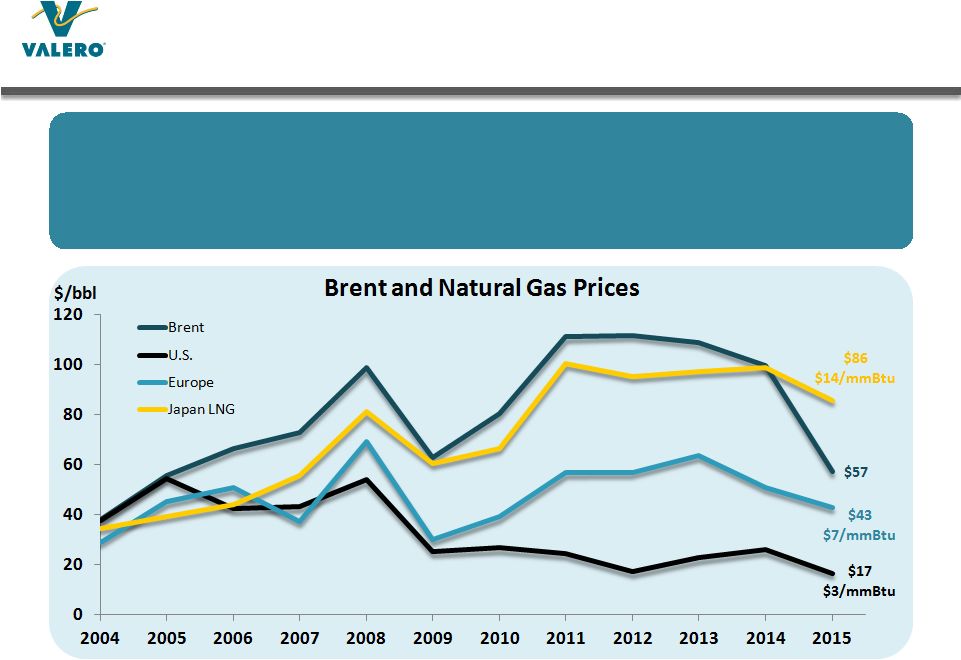 53 Low Cost U.S. Natural Gas Provides Competitive Advantage Sources: Argus and Bloomberg. Japan LNG through Feb 28, 2015; U.S. and Europe through May 5, 2015. Natural gas price converted to barrels using factor of 6.05x • U.S. natural gas is significantly discounted to Brent on an energy equivalent basis • Prices expected to remain low and disconnected from global oil and gas markets for foreseeable future |
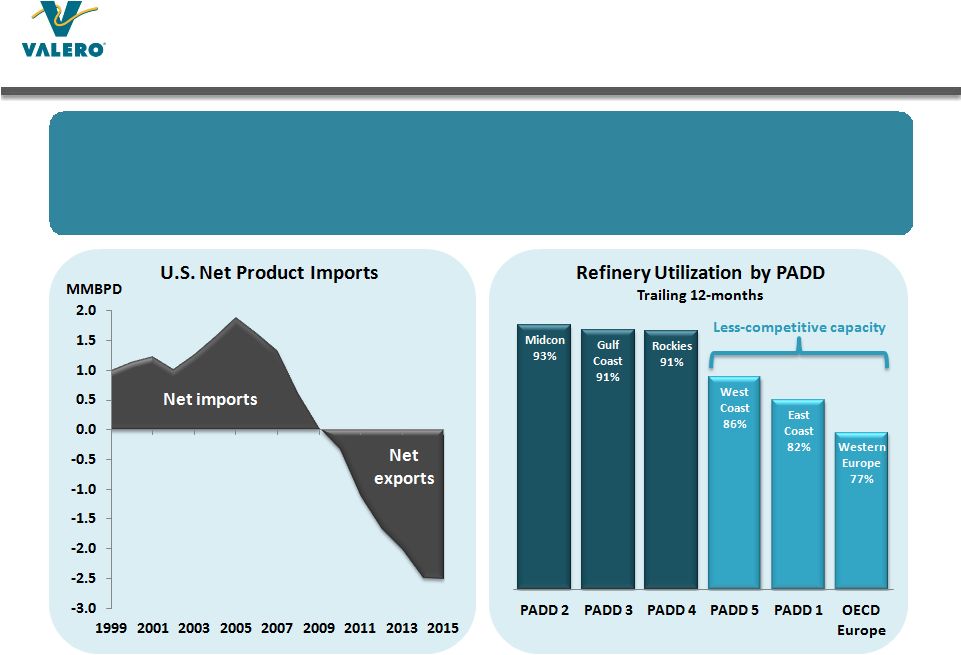 54 U.S. Refining Capacity Is Globally Competitive and Continues to Take Market Share Source: EIA and IEA (U.S. data through February 2015, Europe data through March 2015) Source: EIA (2015 data through February) • U.S. flipped from importer to exporter on lower local product demand and higher refinery utilization, particularly in PADDS 2, 3, and 4, driven by structural cost advantages for crude oil and natural gas • Gulf Coast refineries have gained export market share in the Atlantic Basin |
 55 World Refinery Capacity Growth Source: Consultantand Valero estimates; Net Global Refinery Additions = New Capacity + Restarts – Announced Closures • New capacity additions expected in Asia and the Middle East • Announced new capacity in Latin America likely to be smaller and start later than planned • Capacity rationalization expected to continue in Europe |
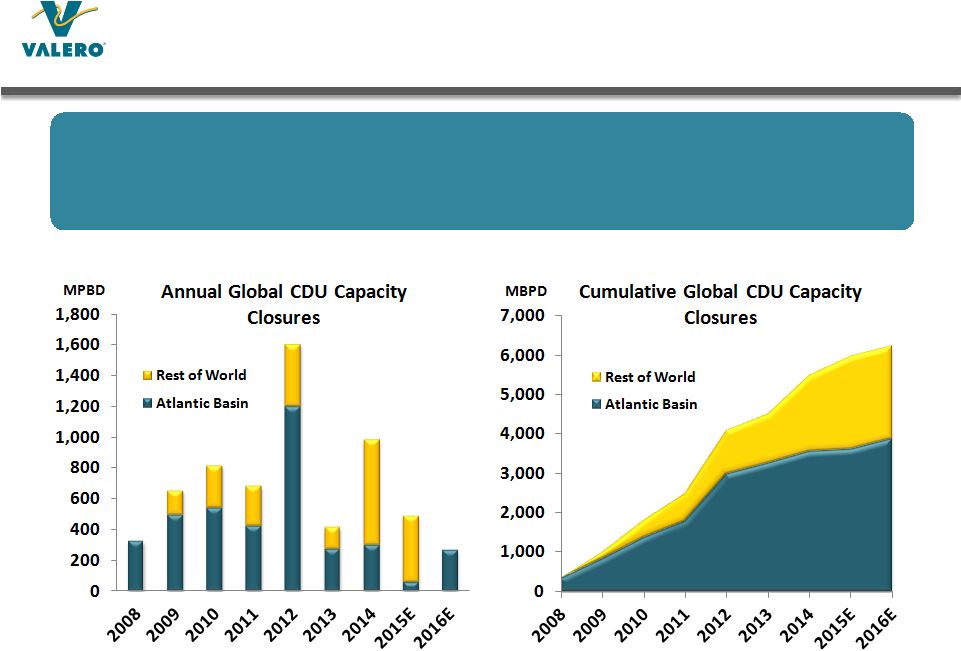 56 Capacity Rationalization in Atlantic Basin Sources: Industry and Consultant reports and Valero estimates • Marginal refiners continue to rationalize capacity • Closures in the last few years have been focused in Japan, Australia, and Europe |
 Location Owner CDU Capacity Closed (MBPD) Year Closed Location Owner CDU Capacity Closed (MBPD) Year Closed Perth Amboy, NJ Chevron 80 2008 Rome, Italy Total/Erg 88 2012 Bakersfield, CA Big West 65 2008 Fawley, U.K.* ExxonMobil 80 2012 Ingolstadt, Germany* Bayernoil 102 2008 Paramo, Czech Republic Unipetrol 20 2012 Yabucoa, Puerto Rico Shell Yabucoa, Inc. 76 2008 St. Croix, USVI Hovensa 350 2012 Westville, NJ Sunoco 145 2009 San Nicholas, Aruba Valero 235 2012 Bloomfield, NM Western 17 2009 Lisichansk, Ukraine TNK-BP 175 2012 North Pole, AK* Flint Hills Resources 85 2009 Clyde, Australia Shell 75 2012 Teesside, UK Petroplus 117 2009 Port Reading, NJ Hess 2013 Gonfreville L'Orcher, France* Total 90 2009 Dartmouth, Canada Imperial Oil 88 2013 Dunkirk, France Total 140 2009 Harburg, Germany Shell 107 2013 Toyama, Japan Nihonkai Oil 57 2009 Porto Marghera, Italy ENI 80 2013 Yorktown, VA Western 65 2010 Sakaide, Japan Cosmo Oil 140 2013 Montreal, Canada Shell 130 2010 North Pole, AK Flint Hills Resources 80 2014 Reichstett, France Petroplus 85 2010 Mantova, Italy MOL 69 2014 Wilhelmshaven, Germany ConocoPhillips 260 2010 Stanlow, U.K.* Essar 101 2014 Sodegaura, Japan* Fuji Oil 50 2010 Milford Haven, U.K. Murphy 130 2014 Oita, Japan* JX Holdings 24 2010 Yokkaichi, Japan* Cosmo Oil 43 2014 Mizushima, Japan* JX Holdings 110 2010 Tokuyama, Japan Idemitsu Kosan 114 2014 Negishi, Japan* JX Holdings 70 2010 Kurnell, Australia Caltex 135 2014 Kashima, Japan* JX Holdings 18 2010 Kawasaki, Japan* Tonen-General 67 2014 Marcus Hook, PA Sunoco 175 2011 Wakayama, Japan* Tonen-General 38 2014 St. Croix, USVI* Hovensa 150 2011 Muroran, Japan JX Holdings 180 2014 Arpechim, Romania OMV Petrom 70 2011 Chiba, Japan* Kyokuto Petroleum Ltd. 23 2014 Cremona, Italy Tamoil 94 2011 Kaohsiung, Taiwan Chinese Petroleum Corp. 200 2015 Ogimachi, Japan Toa/Showa Shell 120 2011 Bulwer Island, Australia BP 102 2015 Fushun, China Fushun Petrochem. 70 2011 Chiba, Japan* Idemitsu Kosan 20 2015 Paramount, CA Alon 90 2012 Kawasaki, Japan* Tonen-General 10 2015 North Pole, AK* Flint Hills Resources 48 2012 Nishirara, Okinawa Petrobras/Nansei Sekiyu 100 2015 Berre L'Etang, France LyondellBasell 105 2012 Collombey, Switzerland Tamoil 55 2015 Coryton, U.K. Petroplus 175 2012 Lindsey, U.K.* Total 110 2016 Petit Couronne, France Petroplus 160 2012 La Mede, France Total 159 2016 57 Global Refining Capacity Rationalization *Partial closure of refinery captured in capacity. Note: This data represents refineries currently closed, ownership may choose to restart or sell listed refinery. Sources: Industry and Consultant reports, Valero estimates, and direct and public disclosure by each owner. |
 58 Global Refining Capacity For Sale or Under Strategic Review Location Owner CDU Capacity (MBPD) Lytton, Australia Caltex 109 Nishihara, Japan Petrobras/Sumitomo 95 Inchon, Korea SK Energy 270 Whitegate, Ireland Phillips 66 71 Barbers Point, HI Chevron 54 Pasadena, TX Petrobras 100 Bahia Blanca, Argentina Petrobras 31 Gothenburg, Sweden Shell 80 Port Dickson, Malaysia Shell 156 Livorno ENI 106 Taranto ENI 120 Mazeikiai, Lithuania PKN 190 Okinawa, Japan Petrobras/Nansei Sekiyu 100 Falconara, Italy API 80 Hamburg, Germany Tamoil 78 Collombey, Switzerland Tamoil 72 Chiba, Japan Cosmo Oil 240 Chiba, Japan TonenGeneral 152 Sources: Direct and public disclosure by each owner |
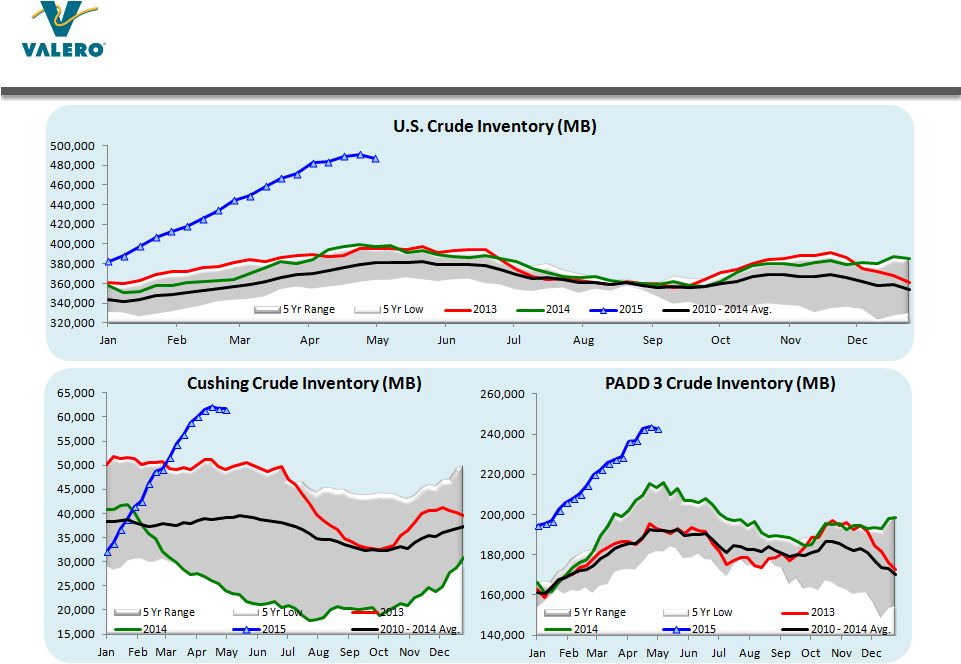 59 U.S. Crude Fundamentals Source: DOE weekly data through May 1, 2015 |
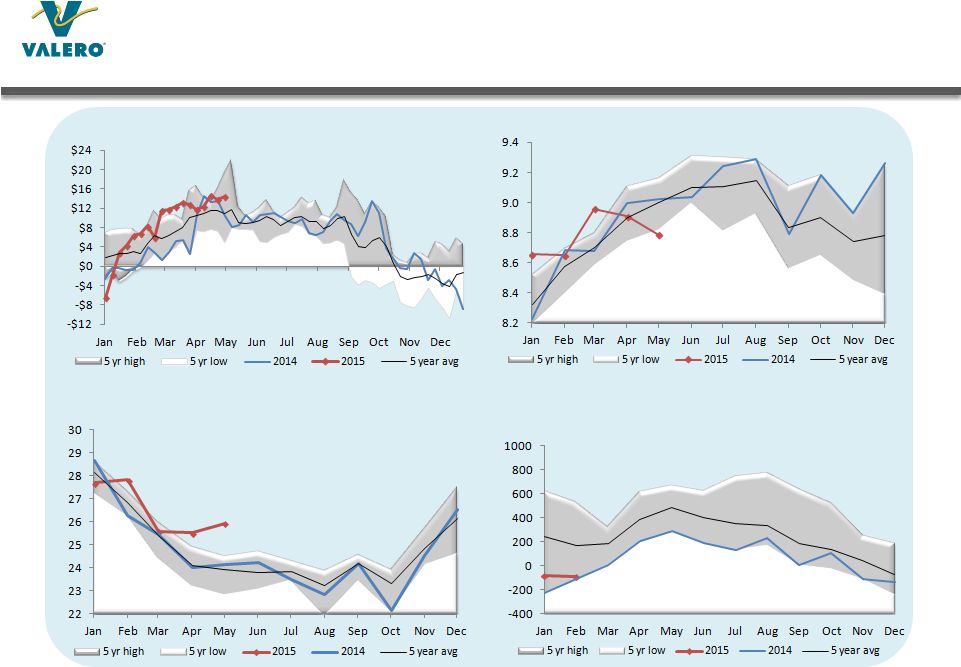 60 U.S. Gasoline Fundamentals USGC Brent Gasoline Crack (per bbl) U.S. Gasoline Demand (mmbpd) Source: Argus; 2015 weekly data through May 1 Source: DOE monthly data through Feb 2015; 2015 weekly data through May 1 Source: DOE monthly data through Feb 2015; 2015 weekly data through May 1 U.S. Net Imports of Gasoline and Blendstocks (mbpd) Source: DOE monthly data through Feb 2015 U.S. Gasoline Days of Supply |
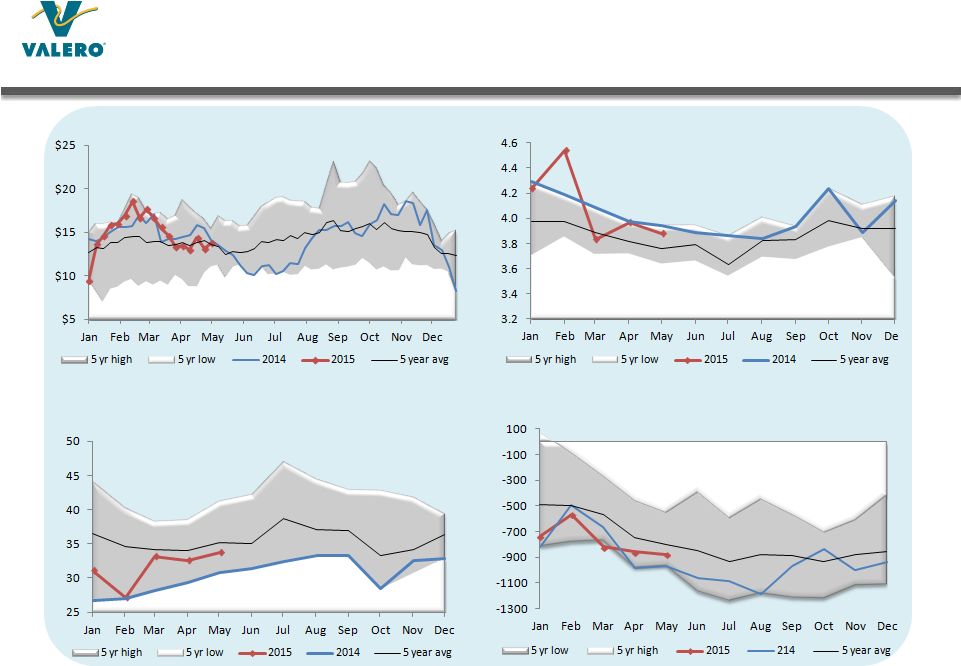 61 U.S. Distillate Fundamentals USGC Brent ULSD Crack (per bbl) U.S. Distillate Demand (mmbpd) Source: Argus; 2015 weekly data through May 1 Source: DOE monthly data through Feb 2015; 2015 weekly data through May 1 Source: DOE monthly data through Feb 2015; 2015 weekly data through May 1 Source: DOE monthly data through Feb 2015; 2015 weekly data through May 1 U.S. Distillate Days of Supply U.S. Distillate Net Imports (mbpd) |
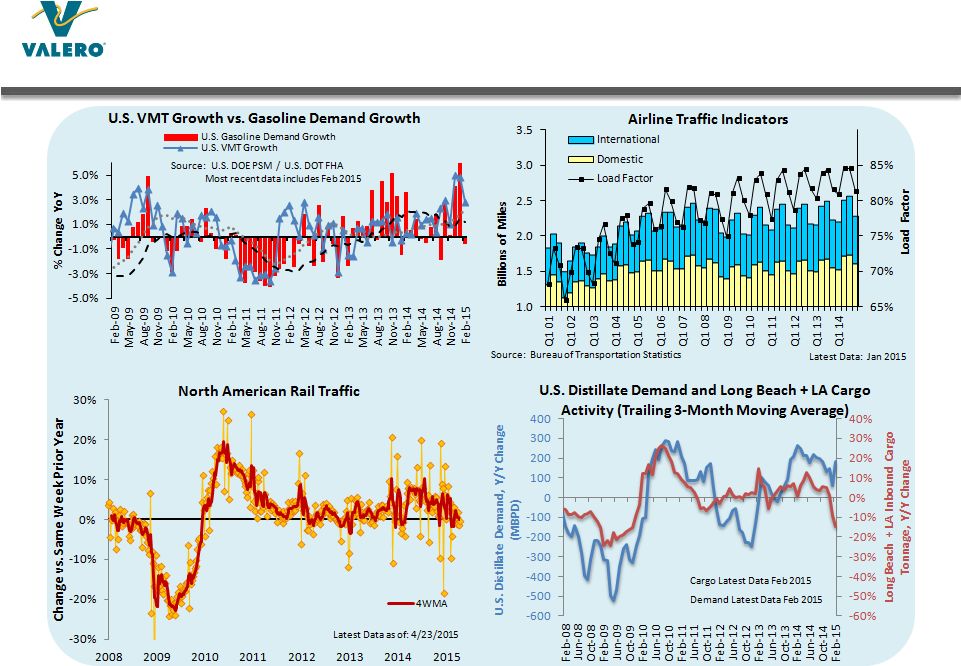 62 U.S. Transport Indicators |
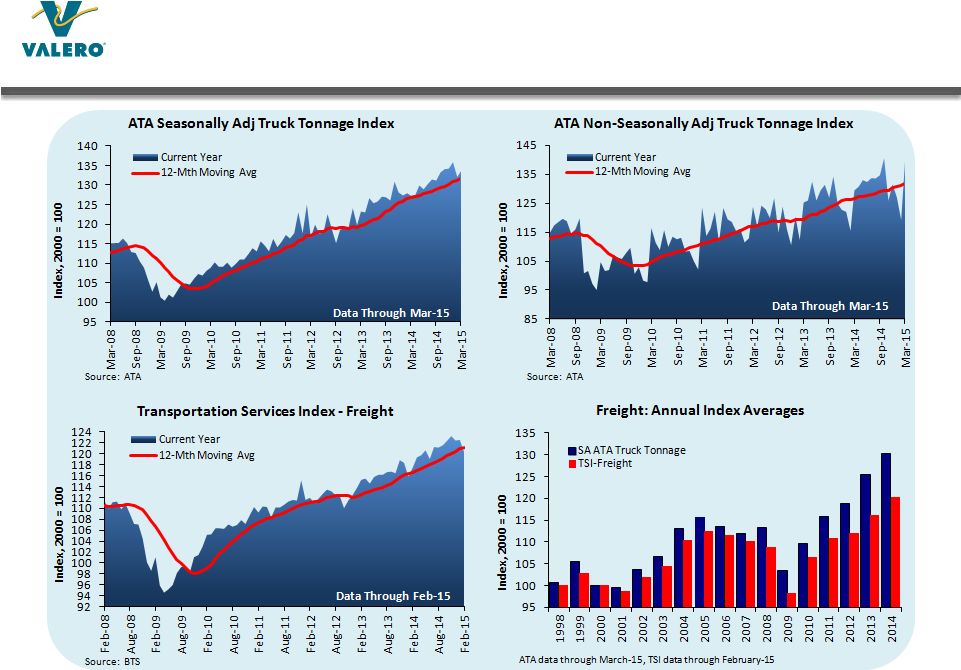 63 U.S. Transport Indicators: Trucking |
 Note: Gasoline represents all finished gasoline plus all blendstocks (including ethanol, MTBE, and other oxygenates) Source: DOE Petroleum Supply Monthly data through February 2015. 4 Week Average estimate from Weekly Petroleum Statistics Report and Valero estimates. 64 Increase in U.S. Gasoline Exports |
 Decrease in U.S. Gasoline Imports Note: Gasoline represents all finished gasoline plus all blendstocks (including ethanol, MTBE, and other oxygenates) Source: DOE Petroleum Supply Monthly data through February 2015. 4 Week Average estimate from Weekly Petroleum Statistics Report and Valero estimates. 65 |
 Source: DOE Petroleum Supply Monthly with data through February 2015. 4 Week Average estimate from Weekly Petroleum Statistics Report 66 Increase in U.S. Diesel Exports 12 Month Moving Average, MBPD |
 67 U.S. Is Net Refined Products Exporter U.S. Demand for Refined Products and Net Trade MMBPD U.S. Petroleum Demand Excluding Ethanol and Non-Refinery NGL’s (Refined Product Demand) Net Imports Net Exports Implied Total Production of U.S. Refined Products Implied Production of U.S. Refined Products for Domestic Use Valero’s share of U.S. exports has averaged 20% to 25% over the past few years Note: Implied production = Petroleum demand excluding ethanol and non-refinery NGLs minus product net imports. Source: EIA, Consultant and Valero estimates; data through February 2015 |
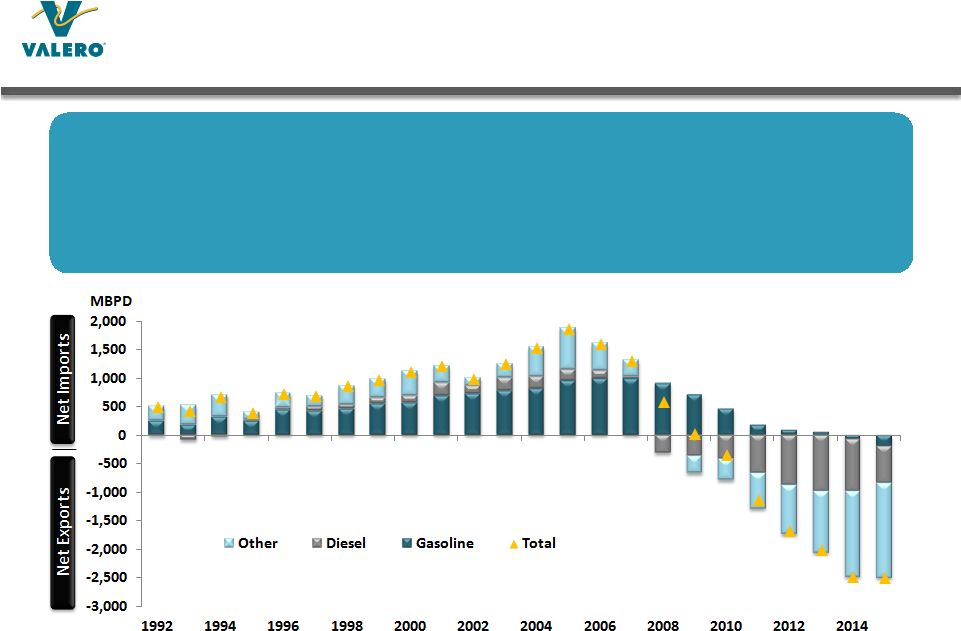 68 U.S. Shifted to Net Exporter Note: Gasoline represents all finished gasoline plus all blendstocks (including ethanol, MTBE, and other oxygenates) Source: DOE Petroleum Supply Monthly data through February 2015 • Net refined products exports increased from 335 MBPD in 2010 to 2,504 MBPD in 2015 • Diesel net exports averaged 919 MBPD in 2014; 651 MBPD in 2015 (Jan-Feb) • Gasoline net exports averaged 66 MBPD in 2014; 199 MBPD in 2015 (Jan – Feb) • Gasoline and blendstocks have shifted to net exports |
 69 Mexico Statistics Diesel Gross Imports (MBPD) Source: PEMEX, latest data February 2015 Gasoline Gross Imports (MBPD) Crude Unit Throughput (MBPD) Crude Unit Utilization |
 70 Decrease in Venezuelan Exports to the U.S. Source: EIA, February 2015 |
 71 Non-GAAP Reconciliations Ethanol (millions) 2Q09 – 4Q09 2010 2011 2012 2013 2014 1Q15 Cumulative Operating income $165 $209 $396 $(47) $491 $786 $12 $2,012 + Depreciation and amortization expense $18 $36 $39 $42 $45 $49 $13 $242 = EBITDA $183 $245 $435 $(5) $536 $835 $25 $2,254 Forecasted (thousands) Full Year Beginning March 1, 2015 Valero Partners Houston and Louisiana Net income $37,300 + Interest expenses 18,100 + Income tax expense 400 + Depreciation expense $20,000 = EBITDA $75,800 Reconciliation of VLO Ethanol Operating Income to EBITDA Reconciliation of VLP Forecasted Net Income to EBITDA Three Months Ended Three Months Ended December 31, 2014 December 31, 2015 (millions) As Reported Annualized (x4) Forecasted Annualized (x4) Net income $19 $76 $32 $128 Plus: Depreciation expense 5 18 11 44 Interest expense (1) - 1 7 28 Income tax expense - - - - EBITDA $24 $95 $50 $200 Reconciliation of VLP Net Income Under GAAP to EBITDA (1) Interest expense and cash interest paid both include commitment fees to be paid on VLP’s revolving credit facility. Interest expense also includes the amortization of estimated deferred issuance costs to be incurred in connection with establishing VLP’s revolving credit facility. |
 Investor Relations Contacts 72 For more information, please contact: John Locke Executive Director, Investor Relations 210-345-3077 john.locke@valero.com Karen Ngo Manager, Investor Relations 210-345-4574 karen.ngo@valero.com |