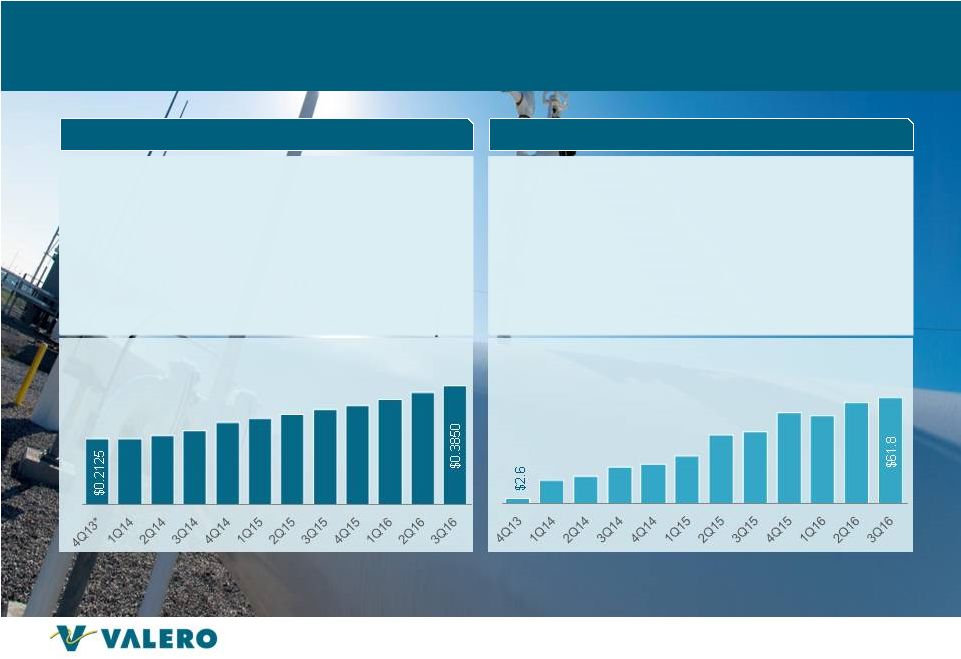
38 1Q2014 2Q2014 3Q2014 4Q2014 1Q2015 2Q2015 3Q2015 4Q2015 1Q2016 2Q2016 3Q2016 Net income $4,520 $6,157 $5,658 ($2,907) $6,936 $23,504 $15,625 $44,667 $43,298 $49,447 $48,707 Plus: Depreciation expense 5,916 6,132 7,178 8,583 8,310 9,904 13,760 9,151 9,388 10,622 11,319 Plus: Interest and debt expense, net of capitalized interest 228 221 214 209 601 1,411 1,353 2,748 2,659 3,251 3,672 Plus: Income tax expense 157 150 129 112 (126) (51) 115 313 242 303 235 EBITDA 10,821 12,660 13,179 5,997 15,721 34,768 30,853 56,879 55,587 63,623 63,933 Less: EBITDA attributable to Predecessor (3,037) (2,905) (9,025) (17,744) (12,089) (7,969) (12,727) — — — (2,395) EBITDA attributable to Partnership 13,858 15,565 22,204 23,741 27,810 42,737 43,580 56,879 55,587 63,623 66,328 Plus: Adjustments related to minimum throughput commitments 32 475 (235) (164) (20) 24 — 18 14 221 865 Plus: Projects prefunded by Valero 775 853 418 865 589 — — — — — — Plus: Other — — — — 384 — — — — — — Less: Cash interest paid 236 229 221 213 172 1,406 1,374 2,415 2,502 2,982 3,204 Less: Income taxes paid — 9 — — — 441 — — — 496 — Less: Maintenance capital expenditures 864 1,005 1,035 1,623 1,139 863 326 1,621 2,002 1,518 2,239 Distributable cash flow $13,565 $15,650 $21,131 $22,606 $27,452 $40,051 $41,880 $52,861 $51,097 $58,848 $61,750 VLP Non-GAAP Disclosures: Quarterly EBITDA and Distributable Cash Flow VALERO ENERGY PARTNERS LP RECONCILIATION OF NON-GAAP MEASURES TO MOST COMPARABLE AMOUNTS REPORTED UNDER U.S. GAAP (Unaudited, in Thousands) |