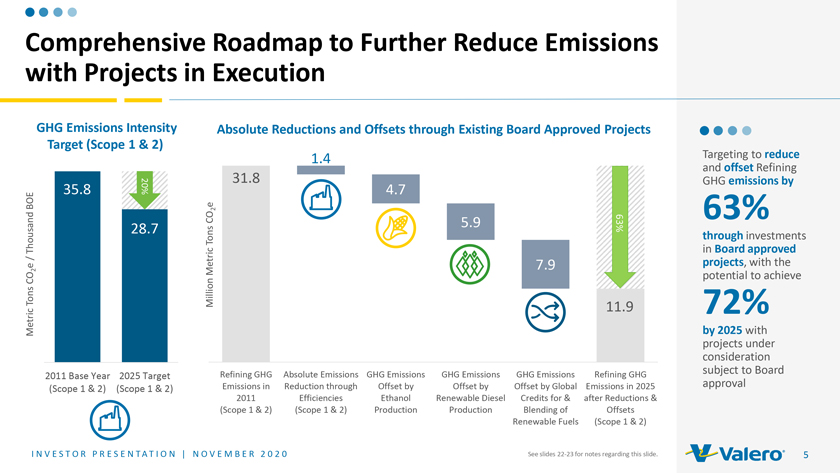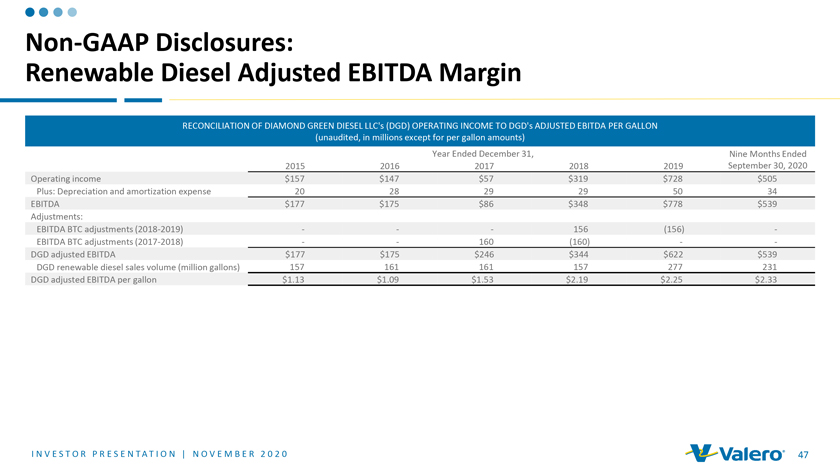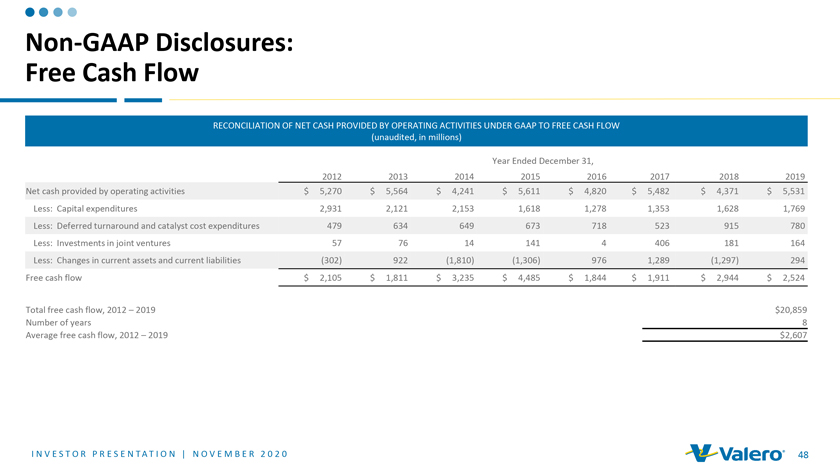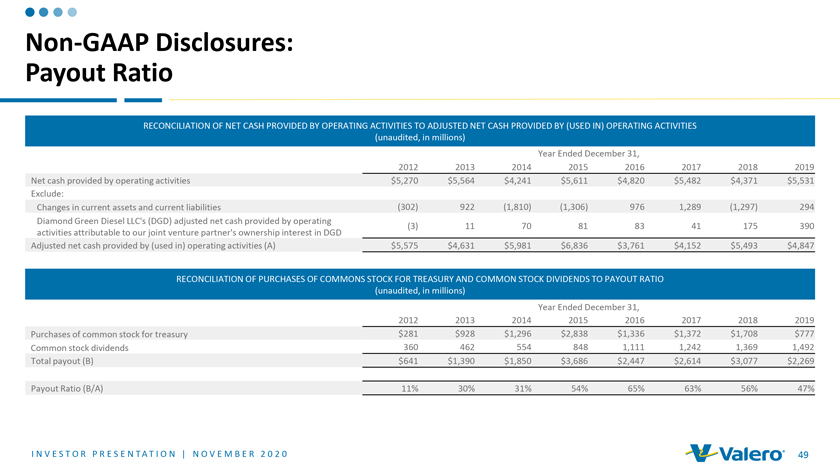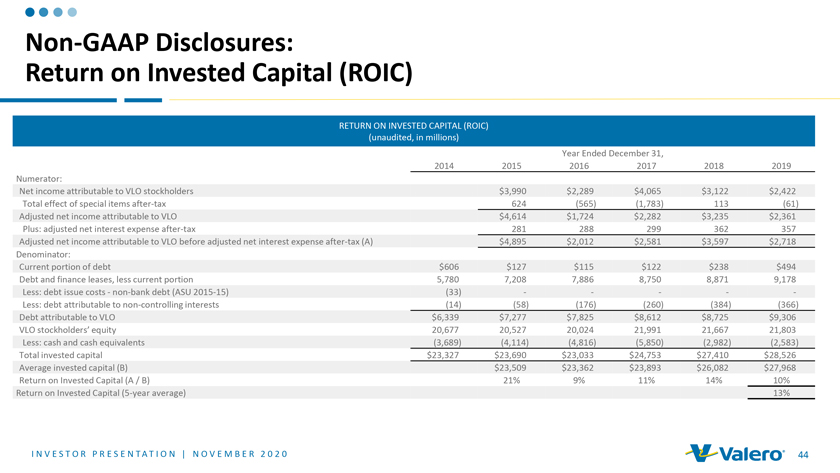
Non-GAAP Disclosures: Return on Invested Capital (ROIC) RETURN ON INVESTED CAPITAL (ROIC) (unaudited, in millions) Year Ended December 31, 2014 2015 2016 2017 2018 2019 Numerator: Net income attributable to VLO stockholders $3,990 $2,289 $4,065 $3,122 $2,422 Total effect of special items after-tax 624 (565) (1,783) 113 (61) Adjusted net income attributable to VLO $4,614 $1,724 $2,282 $3,235 $2,361 Plus: adjusted net interest expense after-tax 281 288 299 362 357 Adjusted net income attributable to VLO before adjusted net interest expense after-tax (A) $4,895 $2,012 $2,581 $3,597 $2,718 Denominator: Current portion of debt $606 $127 $115 $122 $238 $494 Debt and finance leases, less current portion 5,780 7,208 7,886 8,750 8,871 9,178 Less: debt issue costs - non-bank debt (ASU 2015-15) (33) - - - - -Less: debt attributable to non-controlling interests (14) (58) (176) (260) (384) (366) Debt attributable to VLO $6,339 $7,277 $7,825 $8,612 $8,725 $9,306 VLO stockholders’ equity 20,677 20,527 20,024 21,991 21,667 21,803 Less: cash and cash equivalents (3,689) (4,114) (4,816) (5,850) (2,982) (2,583) Total invested capital $23,327 $23,690 $23,033 $24,753 $27,410 $28,526 Average invested capital (B) $23,509 $23,362 $23,893 $26,082 $27,968 Return on Invested Capital (A / B) 21% 9% 11% 14% 10% Return on Invested Capital (5-year average) 13% I N V E S T O R P R E S E N T A T I O N | N O V E M B E R 2 0 2 0 44