UNITED STATES
SECURITIES AND EXCHANGE COMMISSION
Washington, D.C. 20549
FORM N-CSR
CERTIFIED SHAREHOLDER REPORT OF REGISTERED MANAGEMENT
INVESTMENT COMPANIES
| | |
| Investment Company Act file number: | | 811-08085 |
| |
| Exact name of registrant as specified in charter: | | Prudential Investment Portfolios, Inc. 10 |
| |
| Address of principal executive offices: | | 655 Broad Street, 17th Floor |
| | Newark, New Jersey 07102 |
| |
| Name and address of agent for service: | | Andrew R. French |
| | 655 Broad Street, 17th Floor |
| | Newark, New Jersey 07102 |
| |
| Registrant’s telephone number, including area code: | | 800-225-1852 |
| |
| Date of fiscal year end: | | 10/31/2018 |
| |
| Date of reporting period: | | 10/31/2018 |
Item 1 – Reports to Stockholders

PGIM JENNISON EQUITY INCOME FUND
(Formerly known as Prudential Jennison Equity Income Fund)
ANNUAL REPORT
OCTOBER 31, 2018
COMING SOON: PAPERLESS SHAREHOLDER REPORTS
Beginning on January 1, 2021, as permitted by regulations adopted by the Securities and Exchange Commission, paper copies of the Fund’s annual and semi-annual shareholder reports will no longer be sent by mail, unless you specifically request paper copies of the reports. Instead, the reports will be made available on the Fund’s website (www.pgiminvestments.com), and you will be notified by mail each time a report is posted and provided with a website link to access the report.
If you already elected to receive shareholder reports electronically, you will not be affected by this change and you need not take any action. You may elect to receive shareholder reports and other communications from the Fund electronically anytime by contacting your financial intermediary (such as a broker-dealer or bank) or, if you are a direct investor, by calling 1-800-225-1852 or by sending an e-mail request to PGIM Investments at shareholderreports@pgim.com.
Beginning on January 1, 2019, you may elect to receive all future reports in paper free of charge. If you invest through a financial intermediary, you can contact your financial intermediary or follow instructions included with this notice to elect to continue to receive paper copies of your shareholder reports. If you invest directly with the Fund, you can call 1-800-225-1852 or send an email request to shareholderreports@pgim.com to let the Fund know you wish to continue receiving paper copies of your shareholder reports. Your election to receive reports in paper will apply to all funds held in your account if you invest through your financial intermediary or all funds held with the fund complex if you invest directly with the Fund.

To enroll in e-delivery, go to pgiminvestments.com/edelivery
|
| Objective: Income and capital appreciation |
Highlights (unaudited)
| • | | Units of Cheniere Energy Partners LP Holdings performed well in the reporting period after its parent company, Cheniere Energy, Inc., posted solid quarterly results with projects progressing on accelerated schedules. |
| • | | Shares of Microsoft gained as the company posted solid earnings and beat consensus expectations during the past several quarters. |
| • | | The Fund’s performance was negatively affected by the financials and real estate sectors, specifically its holdings within investment banking & brokerage and specialized real estate investment trusts. |
This report is not authorized for distribution to prospective investors unless preceded or accompanied by a current prospectus.
The views expressed in this report and information about the Fund’s portfolio holdings are for the period covered by this report and are subject to change thereafter.
Mutual funds are distributed by Prudential Investment Management Services LLC, member SIPC. Jennison Associates LLC is a registered investment adviser. Both are Prudential Financial companies. © 2018 Prudential Financial, Inc. and its related entities. Jennison Associates, Jennison, PGIM, and the PGIM logo are service marks of Prudential Financial, Inc. and its related entities, registered in many jurisdictions worldwide.
| | |
| 2 | | Visit our website at pgiminvestments.com |
PGIM FUNDS — UPDATE
The Board of Directors/Trustees for the Fund has approved the implementation of an automatic conversion feature for Class C shares, effective as of April 1, 2019. To reflect these changes, effective April 1, 2019, the section of the Fund’s Prospectus entitled “How to Buy, Sell and Exchange Fund Shares—How to Exchange Your Shares—Frequent Purchases and Redemptions of Fund Shares” is restated to read as follows:
This supplement should be read in conjunction with your Summary Prospectus, Statutory Prospectus and Statement of Additional Information, be retained for future reference and is in addition to any existing Fund supplements.
| | 1. | In each Fund’s Statutory Prospectus, the following is added at the end of the section entitled “Fund Distributions And Tax Issues—If You Sell or Exchange Your Shares”: |
Automatic Conversion of Class C Shares
The conversion of Class C shares into Class A shares—which happens automatically approximately 10 years after purchase—is not a taxable event for federal income tax purposes. For more information about the automatic conversion of Class C shares, see Class C Shares Automatically Convert to Class A Shares in How to Buy, Sell and Exchange Fund Shares.
| | 2. | In each Fund’s Statutory Prospectus, the following sentence is added at the end of the section entitled “How to Buy, Sell and Exchange Shares—Closure of Certain Share Classes to New Group Retirement Plans”: |
Shareholders owning Class C shares may continue to hold their Class C shares until the shares automatically convert to Class A shares under the conversion schedule, or until the shareholder redeems their Class C shares.
| | 3. | In each Fund’s Statutory Prospectus, the following disclosure is added immediately following the section entitled “How to Buy, Sell and Exchange Shares—How to Buy Shares—Class B Shares Automatically Convert to Class A Shares”: |
Class C Shares Automatically Convert to Class A Shares
Starting on or about April 1, 2019 (the “Effective Date”), Class C shares will be eligible for automatic conversion into Class A shares on a monthly basis approximately ten years after the original date of purchase (the “Conversion Date”). Conversion will take place based on the relative NAV of the two classes, without the imposition of any sales load, fee or other charge. All such automatic conversions of Class C shares will constitute tax-free exchanges for federal income tax purposes.
For shareholders investing in Class C shares through retirement plans or omnibus accounts, and in certain other instances, the Fund and its agents may not have
| | | | |
| PGIM Jennison Equity Income Fund | | | 3 | |
transparency into how long a shareholder has held Class C shares for purposes of determining whether such Class C shares are eligible for automatic conversion into Class A shares, and the relevant financial intermediary may not have the ability to track purchases in order to credit individual shareholders’ holding periods. In these circumstances, the Fund will not be able to automatically convert Class C shares into Class A shares as described above. In order to determine eligibility for conversion in these circumstances, it is the responsibility of the financial intermediary to notify the Fund that the shareholder is eligible for the conversion of Class C shares to Class A shares, and the financial intermediary may be required to maintain and provide the Fund with records that substantiate the holding period of Class C shares. It is the financial intermediary’s (and not the Fund’s) responsibility to keep records of transactions made in accounts it holds and to ensure that the shareholder is credited with the proper holding period based on such records or those provided to the financial intermediary by the shareholder. Please consult with your financial intermediary for the applicability of this conversion feature to your shares.
A financial intermediary may sponsor and/or control accounts, programs or platforms that impose a different conversion schedule or different eligibility requirements for the exchange of Class C shares for Class A shares (see Appendix A: Waivers and Discounts Available From Certain Financial Intermediaries of the Prospectus). Please consult with your financial intermediary if you have any questions regarding your shares’ conversion from Class C shares to Class A shares.
| | 4. | In Part II of each Fund’s Statement of Additional Information, the following disclosure is added immediately following the section entitled “Purchase, Redemption and Pricing of Fund Shares—Share Classes—Automatic Conversion of Class B Shares”: |
AUTOMATIC CONVERSION OF CLASS C SHARES. Starting on or about April 1, 2019 (the “Effective Date”), Class C shares will be eligible for automatic conversion into Class A shares on a monthly basis approximately ten years after the original date of purchase (the “Conversion Date”). Conversion will take place based on the relative NAV of the two classes, without the imposition of any sales load, fee or other charge. Class C shares of a Fund acquired through automatic reinvestment of dividends or distributions will convert to Class A shares of the Fund on the Conversion Date pro rata with the converting Class C shares of the Fund that were not acquired through reinvestment of dividends or distributions. All such automatic conversions of Class C shares will constitute tax-free exchanges for federal income tax purposes.
For shareholders investing in Class C shares through retirement plans or omnibus accounts, and in certain other instances, the Fund and its agents may not have transparency into how long a shareholder has held Class C shares for purposes of determining whether such Class C shares are eligible for automatic conversion into Class A shares, and the relevant financial intermediary may not have the ability to track purchases in order to credit individual shareholders’ holding periods. In these circumstances, the
| | |
| 4 | | Visit our website at pgiminvestments.com |
Fund will not be able to automatically convert Class C shares into Class A shares as described above. In order to determine eligibility for conversion in these circumstances, it is the responsibility of the financial intermediary to notify the Fund that the shareholder is eligible for the conversion of Class C shares to Class A shares, and the financial intermediary may be required to maintain and provide the Fund with records that substantiate the holding period of Class C shares. It is the financial intermediary’s (and not the Fund’s) responsibility to keep records of transactions made in accounts it holds and to ensure that the shareholder is credited with the proper holding period based on such records or those provided to the financial intermediary by the shareholder. Please consult with your financial intermediary for the applicability of this conversion feature to your shares.
Class C shares were generally closed to investments by new group retirement plans effective June 1, 2018. Group retirement plans (and their successor, related and affiliated plans) that have Class C shares of the Fund available to participants on or before the Effective Date may continue to open accounts for new participants in such share class and purchase additional shares in existing participant accounts.
The Fund has no responsibility for monitoring or implementing a financial intermediary’s process for determining whether a shareholder meets the required holding period for conversion. A financial intermediary may sponsor and/or control accounts, programs or platforms that impose a different conversion schedule or different eligibility requirements for the exchange of Class C shares for Class A shares, as set forth on Appendix A: Waivers and Discounts Available From Certain Financial Intermediaries of the Prospectus. In these cases, Class C shareholders may have their shares exchanged for Class A shares under the policies of the financial intermediary. Financial intermediaries will be responsible for making such exchanges in those circumstances. Please consult with your financial intermediary if you have any questions regarding your shares’ conversion from Class C shares to Class A shares.
LR1094
- Not part of the Annual Report -
| | | | |
| PGIM Jennison Equity Income Fund | | | 5 | |
Table of Contents
| | |
| 6 | | Visit our website at pgiminvestments.com |
Letter from the President

Dear Shareholder:
We hope you find the annual report for PGIM Jennison Equity Income Fund informative and useful. The report covers performance for the 12-month period that ended October 31, 2018.
We have important information to share with you. Effective June 11, 2018, Prudential Mutual Funds were renamed PGIM Funds. This renaming is part of our ongoing effort to further build our reputation and establish our global brand, which began when our firm adopted PGIM Investments as its name in April 2017. Please note that only the Fund’s name has changed. Your Fund’s management and operation, along with its symbols, remained the same.*
During the reporting period, the global economy continued to grow, and central banks gradually tightened monetary policy. In the US, the economy expanded and employment increased. In September, the Federal Reserve hiked interest rates for the eighth time since 2015, based on confidence in the economy.
Equity returns on the whole were strong, due to optimistic earnings expectations and investor sentiment. Global equities, including emerging markets, generally posted positive returns. However, they trailed the performance of US equities, which rose on higher corporate profits, new regulatory policies, and tax reform benefits. Volatility spiked briefly early in the period on inflation concerns, rising interest rates, and a potential global trade war, and again late in the period on worries that profit growth might slow in 2019.
The overall bond market declined modestly during the period, as measured by the Bloomberg Barclays US Aggregate Bond Index. The best performance came from higher-yielding, economically sensitive sectors, such as high yield bonds and bank loans, which posted small gains. US investment-grade corporate bonds and US Treasury bonds both finished the period with negative returns. A major trend during the period was the flattening of the US Treasury yield curve, which increased the yield on fixed income investments with shorter maturities and made them more attractive to investors.
Regarding your investments with PGIM, we believe it is important to maintain a diversified portfolio of funds consistent with your tolerance for risk, time horizon, and financial goals. Your financial advisor can help you create a diversified investment plan that may include funds covering all the basic asset classes and that reflects your personal investor profile and risk tolerance. However, diversification and asset allocation strategies do not assure a profit or protect against loss in declining markets.
At PGIM Investments, we consider it a great privilege and responsibility to help investors
participate in opportunities across global markets while meeting their toughest investment
challenges. PGIM is a top-10 global investment manager with more than $1 trillion in assets under management. This investment expertise allows us to deliver actively managed funds and strategies to meet the needs of investors around the globe.
Thank you for choosing our family of funds.
Sincerely,

Stuart S. Parker, President
PGIM Jennison Equity Income Fund
December 14, 2018
*The Prudential Day One Funds did not change their names.
| | | | |
| PGIM Jennison Equity Income Fund | | | 7 | |
Your Fund’s Performance (unaudited)
Performance data quoted represents past performance. Past performance does not guarantee future results. The investment return and principal value of an investment will fluctuate, so that an investor’s shares, when redeemed, may be worth more or less than their original cost. Current performance may be lower or higher than the past performance data quoted. An investor may obtain performance data as of the most recent month-end by visiting our website at www.pgiminvestments.com or by calling (800) 225-1852.
| | | | | | | | | | | | | | | | |
| | | Average Annual Total Returns as of 10/31/18
(with sales charges) | |
| | | One Year (%) | | | Five Years (%) | | | Ten Years (%) | | | Since Inception (%) | |
| Class A | | | –3.18 | | | | 4.93 | | | | 11.41 | | | | — | |
| Class B | | | –3.13 | | | | 5.18 | | | | 11.20 | | | | — | |
| Class C | | | 0.73 | | | | 5.34 | | | | 11.21 | | | | — | |
| Class R | | | 2.12 | | | | 5.86 | | | | N/A | | | | 7.88 (1/18/11) | |
| Class Z | | | 2.79 | | | | 6.41 | | | | 12.31 | | | | — | |
| Class R6* | | | 2.81 | | | | 6.51 | | | | N/A | | | | 8.54 (1/18/11) | |
| Lipper Equity Income Funds Index** | |
| | | 3.14 | | | | 7.65 | | | | 10.81 | | | | — | |
| S&P 500 Index | |
| | | 7.35 | | | | 11.33 | | | | 13.23 | | | | — | |
| Lipper Equity Income Funds Average | |
| | | | 3.35 | | | | 8.25 | | | | 11.11 | | | | — | |
| | | | | | | | | | | | | | | | |
| | | Average Annual Total Returns as of 10/31/18
(without sales charges) | |
| | | One Year (%) | | | Five Years (%) | | | Ten Years (%) | | | Since Inception (%) | |
| Class A | | | 2.45 | | | | 6.12 | | | | 12.04 | | | | — | |
| Class B | | | 1.68 | | | | 5.34 | | | | 11.20 | | | | — | |
| Class C | | | 1.70 | | | | 5.34 | | | | 11.21 | | | | — | |
| Class R | | | 2.12 | | | | 5.86 | | | | N/A | | | | 7.88 (1/18/11) | |
| Class Z | | | 2.79 | | | | 6.41 | | | | 12.31 | | | | — | |
| Class R6* | | | 2.81 | | | | 6.51 | | | | N/A | | | | 8.54 (1/18/11) | |
| Lipper Equity Income Funds Index** | |
| | | 3.14 | | | | 7.65 | | | | 10.81 | | | | — | |
| S&P 500 Index | |
| | | 7.35 | | | | 11.33 | | | | 13.23 | | | | — | |
| Lipper Equity Income Funds Average | | | | | | | | | | | | | | | | |
| | | | 3.35 | | | | 8.25 | | | | 11.11 | | | | — | |
| | |
| 8 | | Visit our website at pgiminvestments.com |
Growth of a $10,000 Investment (unaudited)
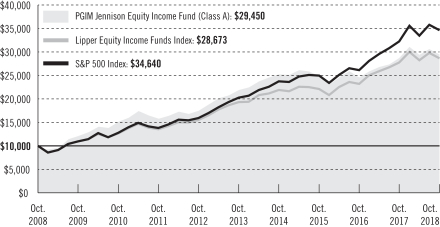
The graph compares a $10,000 investment in the Fund’s Class A shares with a similar investment in the Lipper Equity Income Funds Index and the S&P 500 Index by portraying the initial account values at the beginning of the 10-year period for Class A shares (October 31, 2008) and the account values at the end of the current fiscal year (October 31, 2018) as measured on a quarterly basis. For purposes of the graph, and unless otherwise indicated, it has been assumed that (a) all recurring fees (including management fees) were deducted; and (b) all dividends and distributions were reinvested. The line graph provides information for Class A shares only. As indicated in the tables above, performance for other share classes will vary due to the differing charges and expenses applicable to each share class (as indicated in the following paragraphs). Without waiver of fees and/or expense reimbursements, if any, the Fund’s returns would have been lower.
Past performance does not predict future performance. Total returns and the ending account values in the graph include changes in share price and reinvestment of dividends and capital gains distributions in a hypothetical investment for the periods shown. The Fund’s total returns do not reflect the deduction of income taxes on an individual’s investment. Taxes may reduce your actual investment returns on income or gains paid by the Fund or any gains you may realize if you sell your shares.
Source: PGIM Investments LLC and Lipper Inc.
*Formerly known as Class Q shares.
**Returns for the Lipper Equity Income Funds Index reflect the expenses of the mutual funds included in the Index.
Since Inception returns are provided for any share class with less than 10 fiscal years of returns. Since Inception returns for the Indexes and the Lipper Average are measured from the closest month-end to the class’ inception date.
| | | | |
| PGIM Jennison Equity Income Fund | | | 9 | |
Your Fund’s Performance (continued)
The returns in the tables do not reflect the deduction of taxes that a shareholder would pay on Fund distributions or following the redemption of Fund shares. The average annual total returns take into account applicable sales charges, which are described for each share class in the table below.
| | | | | | | | | | | | |
| | | Class A | | Class B* | | Class C | | Class R | | Class Z | | Class R6** |
| Maximum initial sales charge | | 5.50% of the public offering price | | None | | None | | None | | None | | None |
| Contingent deferred sales charge (CDSC) (as a percentage of the lower of original purchase price or net asset value at redemption) | | 1.00% on sales of $1 million or more made within 12 months of purchase | | 5.00% (Yr. 1) 4.00% (Yr. 2) 3.00% (Yr. 3) 2.00% (Yr. 4) 1.00% (Yr. 5) 1.00% (Yr. 6) 0.00% (Yr. 7) | | 1.00% on sales made within 12 months of purchase | | None | | None | | None |
| Annual distribution and service (12b-1) fees (shown as a percentage of average daily net assets) | | 0.30% (0.25% currently) | | 1.00% | | 1.00% | | 0.75% (0.50% currently) | | None | | None |
*Class B shares are closed to all purchase activity and no additional Class B shares may be purchased or acquired except by exchange from Class B shares of another Fund or through dividend or capital gains reinvestment.
**Formerly known as Class Q shares.
Benchmark Definitions
Lipper Equity Income Funds Index—Funds in the Lipper Equity Income Funds Index seek relatively high current income and growth of income by investing at least 65% of their portfolios in dividend-paying equity securities. These funds’ gross or net yields must be at least 125% of the average gross or net yield of the US diversified equity fund universe. The average annual total return for the Index measured from the month-end closest to the inception date of the Fund’s Class R and Class R6 shares is 9.96%.
S&P 500 Index—The S&P 500 Index is an unmanaged index of over 500 stocks of large US public companies. It gives a broad look at how stock prices in the United States have performed. The average annual total return for the Index measured from the month-end closest to the inception date of the Fund’s Class R and Class R6 shares is 12.43%.
| | |
| 10 | | Visit our website at pgiminvestments.com |
Lipper Equity Income Funds Average—The Lipper Equity Income Funds Average (Lipper Average) is based on the average return of all funds in the Lipper Equity Income Funds universe for the periods noted. Funds in the Lipper Average seek relatively high current income and growth of income through investing 65% or more of their portfolios in dividend-paying equity securities. The average annual total return for the Lipper Average measured from the month-end closest to the inception date of the Fund’s Class R and Class R6 shares is 9.42%.
Investors cannot invest directly in an index or average. The returns for the S&P 500 Index would be lower if it included the effects of sales charges, operating expenses of a mutual fund, or taxes. Returns for the Lipper Average and the Lipper Equity Income Funds Index reflect the deduction of mutual fund operating expenses, but not sales charges or taxes.
Presentation of Fund Holdings
| | | | |
Five Largest Holdings expressed as a
percentage of net assets as of 10/31/18 (%) | |
| JPMorgan Chase & Co., Banks | | | 3.3 | |
| BP PLC, Oil, Gas & Consumable Fuels | | | 3.3 | |
| Microsoft Corp., Software | | | 3.1 | |
| QUALCOMM, Inc., Semiconductors & Semiconductor Equipment | | | 2.9 | |
| AstraZeneca PLC, Pharmaceuticals | | | 2.9 | |
Holdings reflect only long-term investments and are subject to change.
| | | | |
Five Largest Industries expressed as a
percentage of net assets as of 10/31/18 (%) | |
| Pharmaceuticals | | | 11.8 | |
| Banks | | | 9.6 | |
| Oil, Gas & Consumable Fuels | | | 9.2 | |
| Food Products | | | 4.3 | |
| Specialty Retail | | | 4.2 | |
Industry weightings reflect only long-term investments and are subject to change.
| | | | |
| PGIM Jennison Equity Income Fund | | | 11 | |
Strategy and Performance Overview (unaudited)
How did the Fund perform?
The PGIM Jennison Equity Income Fund’s Class A shares returned 2.45% for the 12-month reporting period that ended October 31, 2018. Over the same period, the Lipper Equity Income Funds Index returned 3.14%, the S&P 500 Index advanced 7.35%, and the Lipper Equity Income Funds Average returned 3.35%.
What were the market conditions?
| • | | Equity market returns were strong in the beginning of the reporting period, as global gross domestic product (GDP) advanced at a healthy pace, long-term interest rates remained low, and central banks tightened monetary policy gradually in light of subdued inflation and solid US economic expansion. However, toward the end of the period, trade-related concerns, rising interest rates, and a big run-up in equity prices since the last decline in the first quarter of 2018, along with deteriorating growth prospects for emerging markets, all contributed to increased volatility and a major pullback in US equity markets. |
| • | | West Texas Intermediate crude oil and natural gas prices increased 24.3% and 7.8%, respectively, while ethane prices soared 58.1% during the period. |
| • | | Based on fears stemming from a potential slowdown in Chinese demand for certain industrial metals, prices for zinc, copper, and aluminum declined 15.8%, 8.4%, and 6.5%, respectively. Nickel prices gained slightly, and steel prices rose more than 30.0%. Among the precious metals, silver, gold, and platinum prices declined. |
| • | | In the S&P 500 Index, eight of 11 sectors posted positive returns, with information technology, health care, and consumer discretionary each generating a double-digit return. The materials, industrials, and financials sectors posted declines during the period. Top contributors to the S&P 500 were Apple, Microsoft, and Amazon.com, which together accounted for nearly 40% of the S&P 500’s total return. Top detractors included General Electric, Facebook, and DowDuPont. |
What worked?
From a sector perspective, the Fund’s holdings within the health care and information technology sectors were the primary drivers of absolute performance during the reporting period. Specifically, holdings within life sciences tools & services, pharmaceuticals, communications equipment, and systems software contributed positively. The Fund’s holdings within the movies & entertainment and aerospace & defense industries also helped performance.
In energy:
| | • | | Units of Cheniere Energy Partners LP Holdings (CQP) performed well after its parent company, Cheniere Energy, Inc., posted solid quarterly results with projects progressing |
| | |
| 12 | | Visit our website at pgiminvestments.com |
| | on accelerated schedules. Additionally, natural gas prices rose 2.87% during the reporting period, which benefited the stock. CQP owns 100% of the Sabine Pass LNG terminal in Cameron Parish, LA, where it is developing, constructing, and operating natural gas liquefaction facilities that include existing infrastructure of five liquefied natural gas storage tanks, two marine berths that can accommodate vessels with nominal capacity of up to 266,000 cubic meters, and vaporizers with significant regasification capacity. |
In information technology, specifically within software:
| | • | | Shares of Microsoft Corp. gained in the period, as the company posted solid earnings and beat consensus expectations during the past several quarters. Revenues, earnings per share, and margins improved, driven in part by its Commercial Cloud, Azure, and PC businesses, while Office 365 drove operating income improvements in the company’s productivity and business process segment. |
In consumer discretionary, specifically within movies & entertainment:
| | • | | Media & entertainment firm Twenty-First Century Fox, Inc. gained ground after news of a potential deal to sell most of its assets to Disney, leaving behind its news and sports assets. The company is engaged in the production and licensing of news and sports, the operation of broadcast television stations and network programming in the US, and the production and acquisition of movies for distribution and licensing. |
What didn’t work?
The Fund’s performance was negatively affected by the financials and real estate sectors, specifically its holdings within investment banking & brokerage and specialized real estate investment trusts (REITs). The electronic components industry also negatively weighed on the Fund’s absolute performance.
In real estate:
| | • | | QTS Realty Trust, Inc. is an owner, developer, and operator of carrier-neutral and multi-tenant data centers. Its shares lost ground in the period after the company announced at the beginning of 2018 a strategic realignment that would take place during its fourth-quarter earnings season. The unexpected announcement caused its stock price to slide approximately 23%. While the sell-off was largely company-specific, its shares were under pressure again in September amid the overall underperformance of the real estate sector. Weakness in REITs, often used as a bond proxy, was likely due to the rising interest rate environment. Given QTS’s decelerating trends and organizational changes that could cause further challenges to its revenue over the short term, Jennison reduced the Fund’s exposure in favor of more attractive risk/reward opportunities and fully exited the position in March 2018. |
| | | | |
| PGIM Jennison Equity Income Fund | | | 13 | |
Strategy and Performance Overview (continued)
In health care, specifically within pharmaceuticals:
| | • | | Shares of Bristol-Myers Squibb Co. underperformed despite data from its pivotal Phase 3 trial in first-line, non-small-cell lung carcinoma meeting its co-primary endpoint for the Opdivo plus Yervoy combination. Results demonstrated high, statistically significant, progression-free survival compared with chemotherapy in patients with high levels of an emerging biomarker called tumor mutation burden. However, data from clinical trials of Merck’s competing and already regulator-approved therapy, Keytruda, was better, causing Bristol-Myers Squibb’s shares to struggle. The Fund did not sell its position in this company. |
In financials, specifically within insurance:
| | • | | MetLife provides insurance, annuities, and employee benefit programs in more than 60 countries worldwide. Shares lost ground over the period as the company announced reserve charges in December 2017 that caused earnings to be delayed by two weeks. Then, in May 2018, the company’s chief financial officer resigned, all of which caused the market to react negatively to the announced leadership changes. The Fund did not sell its position in this company. |
Current outlook
| • | | Jennison continues to build the Fund from the bottom up, looking for investment opportunities that should, in aggregate, deliver a premium yield to the broad market. In its view, the best way to achieve this goal is by building diversified portfolios across sectors, market capitalizations, and geography. |
| • | | Jennison’s focus remains on companies with solid fundamentals that can offer incremental capital appreciation in addition to above-average yields. Specifically, Jennison looks to identify companies with improving cash-flow generation that is likely to be returned to shareholders. |
| • | | In Jennison’s view, the tax reform that was passed appears favorable overall for companies doing business in the US, which should, in turn, stimulate the economy as incremental capital expenditures are allocated. As for recent trade rhetoric out of Washington, D.C., Jennison believes any trade war/tariff is equivalent to a tax hike, which could reverse either US and/or global economic growth. Overall, Jennison remained cautiously bullish on the economy at the end of the reporting period. |
| • | | While fiscal policy took a major step with tax reform, Jennison is keeping a close eye on monetary policy, as it believes too much tightening could stifle the US economy. Jennison believes that while US interest rates are likely on an upward trajectory, increases could be episodic—more like a roller coaster in short increments. However, over the longer term, the increase overall may look more gradual. Given the likely rate trajectory, high-dividend-yielding stocks that do not exhibit improving underlying fundamentals could face a challenging period ahead, in Jennison’s view. The focus on a company’s fundamental |
| | |
| 14 | | Visit our website at pgiminvestments.com |
| | improvement is now even more important in this type of environment, and as a result, Jennison has largely repositioned the Fund to adjust for it. |
| • | | Overall, the Fund was fairly diversified across sectors relative to the S&P 500 Index at the end of the reporting period, though it did have a meaningful underweight to information technology, where finding yield is much more challenging, in Jennison’s view. Jennison reduced the Fund’s overall consumer staples exposure, specifically within the beverages industry. Jennison also reduced exposure to financials overall and to regional banks more specifically given its belief that: 1) easing of financial regulations has largely been priced into these names; 2) the market has shifted its focus from earnings to issues around multiples; and 3) potential for a trade war could negatively affect banks. |
| • | | The energy environment has improved in 2018, and Jennison began tactically increasing the Fund’s overall energy exposure, incrementally adding to its integrated oil & gas holdings. Jennison also added exposure to the midstream energy segment given the transformational change that is well underway and Jennison’s belief that a series of positive reforms may help rebuild the segment on a more stable foundation. Additionally, Jennison increased exposure to the Fund’s existing pharmaceutical positions after overall fundamentals improved and the market appeared to be recognizing the steady and improving cash flows of these companies, in Jennison’s view. As such, the Fund’s overall health care sector exposure increased. Lastly, after some concerns about the lowering of barriers-to-entry in the data center space within the real estate sector, Jennison reduced the Fund’s exposure accordingly. Because Jennison focuses on company fundamentals first and foremost, it had yet to find attractive alternatives in the REIT space. This resulted in an underweight in real estate relative to the S&P 500 Index. |
| • | | As Jennison reflects on the Fund’s recent performance, it believes that its goals of establishing a better balance between short-term convictions and long-term risks and also being more nimble have begun to pay off. While it’s early, Jennison is encouraged by the results. |
The percentage points shown in the tables identify each security’s positive or negative contribution to the Fund’s return, which is the sum of all contributions by individual holdings.
| | | | | | |
| Top Contributors (%) | | Top Detractors (%) |
| Cheniere Energy Partners LP Holdings | | 0.87 | | QTS Realty Trust, Inc. | | –0.41 |
| Microsoft Corp. | | 0.62 | | Bristol-Myers Squibb Co. | | –0.34 |
| Twenty-First Century Fox, Inc. | | 0.51 | | MetLife, Inc. | | –0.33 |
| Cisco Systems, Inc. | | 0.48 | | Moelis & Co. | | –0.30 |
| Apple, Inc. | | 0.40 | | Cheniere Energy, Inc. | | –0.29 |
| | | | |
| PGIM Jennison Equity Income Fund | | | 15 | |
Fees and Expenses (unaudited)
As a shareholder of the Fund, you incur two types of costs: (1) transaction costs, including sales charges (loads) on purchase payments and redemptions, as applicable, and (2) ongoing costs, including management fees, distribution and/or service (12b-1) fees, and other Fund expenses, as applicable. This example is intended to help you understand your ongoing costs (in dollars) of investing in the Fund and to compare these costs with the ongoing costs of investing in other mutual funds.
The example is based on an investment of $1,000 held through the six-month period ended October 31, 2018. The example is for illustrative purposes only; you should consult the Prospectus for information on initial and subsequent minimum investment requirements.
Actual Expenses
The first line for each share class in the table on the following page provides information about actual account values and actual expenses. You may use the information on this line, together with the amount you invested, to estimate the expenses that you paid over the period. Simply divide your account value by $1,000 (for example, an $8,600 account value ÷ $1,000 = 8.6), then multiply the result by the number on the first line under the heading “Expenses Paid During the Six-Month Period” to estimate the expenses you paid on your account during this period.
Hypothetical Example for Comparison Purposes
The second line for each share class in the table on the following page provides information about hypothetical account values and hypothetical expenses based on the Fund’s actual expense ratio and an assumed rate of return of 5% per year before expenses, which is not the Fund’s actual return. The hypothetical account values and expenses may not be used to estimate the actual ending account balance or expenses you paid for the period. You may use this information to compare the ongoing costs of investing in the Fund and other funds. To do so, compare this 5% hypothetical example with the 5% hypothetical examples that appear in the shareholder reports of the other funds.
The Fund’s transfer agent may charge additional fees to holders of certain accounts that are not included in the expenses shown in the table on the following page. These fees apply to individual retirement accounts (IRAs) and Section 403(b) accounts. As of the close of the six-month period covered by the table, IRA fees included an annual maintenance fee of $15 per account (subject to a maximum annual maintenance fee of $25 for all accounts held by the same shareholder). Section 403(b) accounts are charged an annual $25 fiduciary maintenance fee. Some of the fees may vary in amount, or may be waived, based on your total account balance or the number of PGIM funds, including the Fund, that you own. You should consider the additional fees that were charged to your Fund account over the six-month period when you estimate the total ongoing expenses paid over the period
| | |
| 16 | | Visit our website at pgiminvestments.com |
and the impact of these fees on your ending account value, as these additional expenses are not reflected in the information provided in the expense table. Additional fees have the effect of reducing investment returns.
Please note that the expenses shown in the table are meant to highlight your ongoing costs only and do not reflect any transactional costs such as sales charges (loads). Therefore, the second line for each share class in the table is useful in comparing ongoing costs only and will not help you determine the relative total costs of owning different funds. In addition, if these transactional costs were included, your costs would have been higher.
| | | | | | | | | | | | | | | | | | |
PGIM Jennison
Equity Income Fund | | Beginning Account
Value
May 1, 2018 | | | Ending Account
Value
October 31, 2018 | | | Annualized
Expense Ratio
Based on the
Six-Month Period | | | Expenses Paid
During the
Six-Month Period* | |
| Class A | | Actual | | $ | 1,000.00 | | | $ | 1,001.70 | | | | 1.13 | % | | $ | 5.70 | |
| | Hypothetical | | $ | 1,000.00 | | | $ | 1,019.51 | | | | 1.13 | % | | $ | 5.75 | |
| Class B | | Actual | | $ | 1,000.00 | | | $ | 998.10 | | | | 1.91 | % | | $ | 9.62 | |
| | Hypothetical | | $ | 1,000.00 | | | $ | 1,015.58 | | | | 1.91 | % | | $ | 9.70 | |
| Class C | | Actual | | $ | 1,000.00 | | | $ | 997.90 | | | | 1.84 | % | | $ | 9.27 | |
| | Hypothetical | | $ | 1,000.00 | | | $ | 1,015.93 | | | | 1.84 | % | | $ | 9.35 | |
| Class R | | Actual | | $ | 1,000.00 | | | $ | 1,000.10 | | | | 1.44 | % | | $ | 7.26 | |
| | Hypothetical | | $ | 1,000.00 | | | $ | 1,017.95 | | | | 1.44 | % | | $ | 7.32 | |
| Class Z | | Actual | | $ | 1,000.00 | | | $ | 1,003.70 | | | | 0.84 | % | | $ | 4.24 | |
| | Hypothetical | | $ | 1,000.00 | | | $ | 1,020.97 | | | | 0.84 | % | | $ | 4.28 | |
| Class R6** | | Actual | | $ | 1,000.00 | | | $ | 1,003.50 | | | | 0.80 | % | | $ | 4.04 | |
| | | Hypothetical | | $ | 1,000.00 | | | $ | 1,021.17 | | | | 0.80 | % | | $ | 4.08 | |
* Fund expenses (net of fee waivers or subsidies, if any) for each share class are equal to the annualized expense ratio for each share class (provided in the table), multiplied by the average account value over the period, multiplied by the 184 days in the six-month period ended October 31, 2018, and divided by the 365 days in the Fund’s fiscal year ended October 31, 2018 (to reflect the six-month period). Expenses presented in the table include the expenses of any underlying portfolios in which the Fund may invest.
**Formerly known as Class Q shares.
| | | | |
| PGIM Jennison Equity Income Fund | | | 17 | |
Schedule of Investments
as of October 31, 2018
| | | | | | | | |
| Description | | Shares | | | Value | |
LONG-TERM INVESTMENTS 97.2% | | | | | | | | |
| | |
COMMON STOCKS 95.5% | | | | | | | | |
| | |
Aerospace & Defense 3.7% | | | | | | | | |
Boeing Co. (The) | | | 95,835 | | | $ | 34,008,008 | |
Safran SA (France) | | | 202,432 | | | | 26,187,311 | |
| | | | | | | | |
| | | | | | | 60,195,319 | |
| | |
Banks 9.6% | | | | | | | | |
Bank of America Corp. | | | 1,212,662 | | | | 33,348,205 | |
BB&T Corp. | | | 499,082 | | | | 24,534,871 | |
JPMorgan Chase & Co. | | | 496,394 | | | | 54,116,874 | |
PNC Financial Services Group, Inc. (The) | | | 126,229 | | | | 16,219,164 | |
SunTrust Banks, Inc. | | | 422,719 | | | | 26,487,573 | |
| | | | | | | | |
| | | | | | | 154,706,687 | |
| | |
Beverages 3.3% | | | | | | | | |
Coca-Cola Co. (The) | | | 729,248 | | | | 34,916,394 | |
Diageo PLC (United Kingdom), ADR | | | 58,610 | | | | 8,097,558 | |
Keurig Dr Pepper, Inc. | | | 388,794 | | | | 10,108,644 | |
| | | | | | | | |
| | | | | | | 53,122,596 | |
| | |
Capital Markets 3.8% | | | | | | | | |
CME Group, Inc.(a) | | | 177,202 | | | | 32,470,494 | |
Moelis & Co. (Class A Stock) | | | 721,202 | | | | 29,107,713 | |
| | | | | | | | |
| | | | | | | 61,578,207 | |
| | |
Chemicals 0.7% | | | | | | | | |
Akzo Nobel NV (Netherlands) | | | 134,368 | | | | 11,298,323 | |
| | |
Communications Equipment 2.4% | | | | | | | | |
Cisco Systems, Inc. | | | 860,647 | | | | 39,374,600 | |
| | |
Diversified Financial Services 0.0% | | | | | | | | |
Gateway Energy & Resource Holdings LLC Private Placement,
(original cost $2,000,000; purchased 12/14/07), 144A*^(f) | | | 100,000 | | | | 576,382 | |
| | |
Diversified Telecommunication Services 1.0% | | | | | | | | |
AT&T, Inc. | | | 148,875 | | | | 4,567,485 | |
Verizon Communications, Inc. | | | 196,988 | | | | 11,246,045 | |
| | | | | | | | |
| | | | | | | 15,813,530 | |
See Notes to Financial Statements.
| | | | |
| PGIM Jennison Equity Income Fund | | | 19 | |
Schedule of Investments (continued)
as of October 31, 2018
| | | | | | | | |
| Description | | Shares | | | Value | |
COMMON STOCKS (Continued) | | | | | | | | |
| | |
Electric Utilities 2.4% | | | | | | | | |
Duke Energy Corp. | | | 152,352 | | | $ | 12,588,846 | |
Exelon Corp. | | | 592,046 | | | | 25,937,535 | |
| | | | | | | | |
| | | | | | | 38,526,381 | |
| | |
Electrical Equipment 1.7% | | | | | | | | |
Emerson Electric Co. | | | 411,844 | | | | 27,955,971 | |
| | |
Entertainment 0.8% | | | | | | | | |
Twenty-First Century Fox, Inc. (Class A Stock) | | | 272,457 | | | | 12,402,243 | |
| | |
Equity Real Estate Investment Trusts (REITs) 1.1% | | | | | | | | |
American Tower Corp. | | | 111,232 | | | | 17,331,058 | |
| | |
Food & Staples Retailing 1.1% | | | | | | | | |
Walmart, Inc. | | | 184,303 | | | | 18,481,905 | |
| | |
Food Products 4.3% | | | | | | | | |
Conagra Brands, Inc.(a) | | | 716,625 | | | | 25,511,850 | |
Hershey Co. (The) | | | 217,759 | | | | 23,332,877 | |
Mondelez International, Inc. (Class A Stock) | | | 495,820 | | | | 20,814,524 | |
| | | | | | | | |
| | | | | | | 69,659,251 | |
| | |
Health Care Equipment & Supplies 3.6% | | | | | | | | |
Abbott Laboratories | | | 406,582 | | | | 28,029,763 | |
Zimmer Biomet Holdings, Inc. | | | 267,344 | | | | 30,367,605 | |
| | | | | | | | |
| | | | | | | 58,397,368 | |
| | |
Health Care Providers & Services 1.1% | | | | | | | | |
UnitedHealth Group, Inc. | | | 68,693 | | | | 17,952,916 | |
| | |
Hotels, Restaurants & Leisure 2.0% | | | | | | | | |
McDonald’s Corp. | | | 180,247 | | | | 31,885,694 | |
| | |
Independent Power & Renewable Electricity Producers 1.4% | | | | | | | | |
NRG Energy, Inc. | | | 645,054 | | | | 23,344,504 | |
| | |
Industrial Conglomerates 1.0% | | | | | | | | |
Honeywell International, Inc. | | | 107,618 | | | | 15,585,239 | |
| | |
Insurance 1.0% | | | | | | | | |
MetLife, Inc. | | | 389,537 | | | | 16,045,029 | |
See Notes to Financial Statements.
| | | | | | | | |
| Description | | Shares | | | Value | |
COMMON STOCKS (Continued) | | | | | | | | |
| | |
IT Services 3.1% | | | | | | | | |
Fidelity National Information Services, Inc. | | | 283,153 | | | $ | 29,476,227 | |
Mastercard, Inc. (Class A Stock) | | | 102,539 | | | | 20,268,884 | |
| | | | | | | | |
| | | | | | | 49,745,111 | |
| | |
Life Sciences Tools & Services 1.5% | | | | | | | | |
Thermo Fisher Scientific, Inc. | | | 102,945 | | | | 24,053,099 | |
| | |
Media 0.8% | | | | | | | | |
CBS Corp. (Class B Stock) | | | 220,047 | | | | 12,619,695 | |
| | |
Metals & Mining 1.3% | | | | | | | | |
BHP Billiton Ltd. (Australia), ADR(a) | | | 461,683 | | | | 21,320,521 | |
| | |
Mortgage Real Estate Investment Trusts (REITs) 1.5% | | | | | | | | |
MFA Financial, Inc. | | | 2,505,233 | | | | 17,361,264 | |
Starwood Property Trust, Inc. | | | 346,851 | | | | 7,533,604 | |
| | | | | | | | |
| | | | | | | 24,894,868 | |
| | |
Multiline Retail 1.5% | | | | | | | | |
Target Corp. | | | 280,062 | | | | 23,421,585 | |
| | |
Multi-Utilities 1.6% | | | | | | | | |
Ameren Corp. | | | 252,877 | | | | 16,330,796 | |
Public Service Enterprise Group, Inc. | | | 173,318 | | | | 9,260,381 | |
| | | | | | | | |
| | | | | | | 25,591,177 | |
| | |
Oil, Gas & Consumable Fuels 9.2% | | | | | | | | |
BP PLC (United Kingdom), ADR | | | 1,220,204 | | | | 52,920,247 | |
Cheniere Energy, Inc.* | | | 483,300 | | | | 29,196,153 | |
Royal Dutch Shell PLC (Netherlands) (Class A Stock), ADR | | | 562,758 | | | | 35,560,678 | |
Targa Resources Corp. | | | 342,680 | | | | 17,706,276 | |
Williams Cos., Inc. (The) | | | 555,820 | | | | 13,523,101 | |
| | | | | | | | |
| | | | | | | 148,906,455 | |
| | |
Pharmaceuticals 11.8% | | | | | | | | |
Allergan PLC | | | 199,585 | | | | 31,536,426 | |
AstraZeneca PLC (United Kingdom), ADR(a) | | | 1,212,972 | | | | 47,039,054 | |
Bristol-Myers Squibb Co. | | | 319,608 | | | | 16,152,988 | |
Elanco Animal Health, Inc.* | | | 196,685 | | | | 5,994,959 | |
Eli Lilly & Co. | | | 180,001 | | | | 19,519,309 | |
See Notes to Financial Statements.
| | | | |
| PGIM Jennison Equity Income Fund | | | 21 | |
Schedule of Investments (continued)
as of October 31, 2018
| | | | | | | | |
| Description | | Shares | | | Value | |
COMMON STOCKS (Continued) | | | | | | | | |
| | |
Pharmaceuticals (cont’d.) | | | | | | | | |
Merck & Co., Inc. | | | 422,657 | | | $ | 31,111,782 | |
Pfizer, Inc. | | | 934,152 | | | | 40,224,585 | |
| | | | | | | | |
| | | | | | | 191,579,103 | |
| | |
Road & Rail 1.8% | | | | | | | | |
CSX Corp. | | | 266,238 | | | | 18,333,149 | |
Union Pacific Corp. | | | 76,978 | | | | 11,255,723 | |
| | | | | | | | |
| | | | | | | 29,588,872 | |
| | |
Semiconductors & Semiconductor Equipment 2.9% | | | | | | | | |
QUALCOMM, Inc.(a) | | | 755,778 | | | | 47,530,878 | |
| | |
Software 3.1% | | | | | | | | |
Microsoft Corp. | | | 467,807 | | | | 49,966,466 | |
| | |
Specialty Retail 4.2% | | | | | | | | |
Home Depot, Inc. (The) | | | 46,293 | | | | 8,142,013 | |
Lowe’s Cos., Inc. | | | 255,980 | | | | 24,374,415 | |
Ross Stores, Inc. | | | 356,123 | | | | 35,256,177 | |
| | | | | | | | |
| | | | | | | 67,772,605 | |
| | |
Technology Hardware, Storage & Peripherals 2.5% | | | | | | | | |
Apple, Inc. | | | 184,147 | | | | 40,302,412 | |
| | |
Textiles, Apparel & Luxury Goods 2.7% | | | | | | | | |
NIKE, Inc. (Class B Stock) | | | 342,464 | | | | 25,698,498 | |
Tapestry, Inc. | | | 428,518 | | | | 18,130,597 | |
| | | | | | | | |
| | | | | | | 43,829,095 | |
| | | | | | | | |
TOTAL COMMON STOCKS
(cost $1,323,851,650) | | | | | | | 1,545,355,145 | |
| | | | | | | | |
| | |
PREFERRED STOCKS 1.0% | | | | | | | | |
| | |
Multi-Utilities | | | | | | | | |
Sempra Energy, Series A, CVT, 6.000% | | | 146,278 | | | | 14,504,927 | |
Sempra Energy, Series B, CVT, 6.750%(a) | | | 14,206 | | | | 1,416,480 | |
| | | | | | | | |
TOTAL PREFERRED STOCKS
(cost $16,048,400) | | | | | | | 15,921,407 | |
| | | | | | | | |
See Notes to Financial Statements.
| | | | | | | | | | | | | | | | |
| Description | | Interest
Rate | | | Maturity
Date | | | Principal
Amount (000)# | | | Value | |
CONVERTIBLE BOND 0.7% | | | | | | | | | | | | | | | | |
| | | | |
Insurance | | | | | | | | | | | | | | | | |
AXA SA (France),
Sr. Unsec’d. Notes, 144A,
(cost $11,191,070) | | | 7.250 | % | | | 05/15/21 | | | | 10,909 | | | $ | 11,198,143 | |
| | | | | | | | | | | | | | | | |
TOTAL LONG-TERM INVESTMENTS
(cost $1,351,091,120) | | | | | | | | | | | | | | | 1,572,474,695 | |
| | | | | | | | | | | | | | | | |
| | | | |
| | | | | | | | | Shares | | | | |
SHORT-TERM INVESTMENTS 10.2% | | | | | | | | | | | | | | | | |
| | | | |
AFFILIATED MUTUAL FUNDS | | | | | | | | | | | | | | | | |
PGIM Core Ultra Short Bond Fund(w) | | | | | | | | | | | 55,291,786 | | | | 55,291,786 | |
PGIM Institutional Money Market Fund
(cost $108,940,521; includes $108,751,877 of cash collateral for securities on loan)(b)(w) | | | | | | | | | | | 108,930,290 | | | | 108,930,290 | |
| | | | | | | | | | | | | | | | |
TOTAL SHORT-TERM INVESTMENTS
(cost $164,232,306) | | | | | | | | | | | | | | | 164,222,076 | |
| | | | | | | | | | | | | | | | |
| | | | |
TOTAL INVESTMENTS 107.4%
(cost $1,515,323,426) | | | | | | | | | | | | | | | 1,736,696,771 | |
Liabilities in excess of other assets (7.4)% | | | | | | | | | | | | | | | (119,168,016 | ) |
| | | | | | | | | | | | | | | | |
| | | | |
NET ASSETS 100.0% | | | | | | | | | | | | | | $ | 1,617,528,755 | |
| | | | | | | | | | | | | | | | |
The following abbreviations are used in the annual report:
144A—Security was purchased pursuant to Rule 144A under the Securities Act of 1933 and may not be resold subject to that rule except to qualified institutional buyers. Unless otherwise noted, 144A securities are deemed to be liquid.
ADR—American Depositary Receipt
CVT—Convertible Security
LIBOR—London Interbank Offered Rate
REITs—Real Estate Investment Trusts
| * | Non-income producing security. |
| # | Principal amount is shown in U.S. dollars unless otherwise stated. |
| ^ | Indicates a Level 3 security. The aggregate value of Level 3 securities is $576,382 and 0.0% of net assets. |
| (a) | All or a portion of security is on loan. The aggregate market value of such securities, including those sold and pending settlement, is $106,975,736; cash collateral of $108,751,877 (included in liabilities) was received with which the Fund purchased highly liquid short-term investments. |
| (b) | Represents security purchased with cash collateral received for securities on loan and includes dividend reinvestment. (f) Indicates a restricted security; the aggregate original cost of such securities is $2,000,000. The aggregate value of $576,382 is 0.0% of net assets. |
| (w) | PGIM Investments LLC, the manager of the Fund, also serves as manager of the PGIM Core Ultra Short Bond Fund and PGIM Institutional Money Market Fund. |
See Notes to Financial Statements.
| | | | |
| PGIM Jennison Equity Income Fund | | | 23 | |
Schedule of Investments (continued)
as of October 31, 2018
Fair Value Measurements:
Various inputs are used in determining the value of the Fund’s investments. These inputs are summarized in the three broad levels listed below.
Level 1—unadjusted quoted prices generally in active markets for identical securities.
Level 2—quoted prices for similar securities, interest rates and yield curves, prepayment speeds, foreign currency exchange rates and other observable inputs.
Level 3—unobservable inputs for securities valued in accordance with Board approved fair valuation procedures.
The following is a summary of the inputs used as of October 31, 2018 in valuing such portfolio securities:
| | | | | | | | | | | | |
| | | Level 1 | | | Level 2 | | | Level 3 | |
Investments in Securities | | | | | | | | | | | | |
Common Stocks | | | | | | | | | | | | |
Aerospace & Defense | | $ | 34,008,008 | | | $ | 26,187,311 | | | $ | — | |
Banks | | | 154,706,687 | | | | — | | | | — | |
Beverages | | | 53,122,596 | | | | — | | | | — | |
Capital Markets | | | 61,578,207 | | | | — | | | | — | |
Chemicals | | | — | | | | 11,298,323 | | | | — | |
Communications Equipment | | | 39,374,600 | | | | — | | | | — | |
Diversified Financial Services | | | — | | | | — | | | | 576,382 | |
Diversified Telecommunication Services | | | 15,813,530 | | | | — | | | | — | |
Electric Utilities | | | 38,526,381 | | | | — | | | | — | |
Electrical Equipment | | | 27,955,971 | | | | — | | | | — | |
Entertainment | | | 12,402,243 | | | | — | | | | — | |
Equity Real Estate Investment Trusts (REITs) | | | 17,331,058 | | | | — | | | | — | |
Food & Staples Retailing | | | 18,481,905 | | | | — | | | | — | |
Food Products | | | 69,659,251 | | | | — | | | | — | |
Health Care Equipment & Supplies | | | 58,397,368 | | | | — | | | | — | |
Health Care Providers & Services | | | 17,952,916 | | | | — | | | | — | |
Hotels, Restaurants & Leisure | | | 31,885,694 | | | | — | | | | — | |
Independent Power & Renewable Electricity Producers | | | 23,344,504 | | | | — | | | | — | |
Industrial Conglomerates | | | 15,585,239 | | | | — | | | | — | |
Insurance | | | 16,045,029 | | | | — | | | | — | |
IT Services | | | 49,745,111 | | | | — | | | | — | |
Life Sciences Tools & Services | | | 24,053,099 | | | | — | | | | — | |
Media | | | 12,619,695 | | | | — | | | | — | |
Metals & Mining | | | 21,320,521 | | | | — | | | | — | |
Mortgage Real Estate Investment Trusts (REITs) | | | 24,894,868 | | | | — | | | | — | |
Multiline Retail | | | 23,421,585 | | | | — | | | | — | |
Multi-Utilities | | | 25,591,177 | | | | — | | | | — | |
Oil, Gas & Consumable Fuels | | | 148,906,455 | | | | — | | | | — | |
Pharmaceuticals | | | 191,579,103 | | | | — | | | | — | |
Road & Rail | | | 29,588,872 | | | | — | | | | — | |
Semiconductors & Semiconductor Equipment | | | 47,530,878 | | | | — | | | | — | |
Software | | | 49,966,466 | | | | — | | | | — | |
Specialty Retail | | | 67,772,605 | | | | — | | | | — | |
Technology Hardware, Storage & Peripherals | | | 40,302,412 | | | | — | | | | — | |
See Notes to Financial Statements.
| | | | | | | | | | | | |
| | | Level 1 | | | Level 2 | | | Level 3 | |
Investments in Securities (continued) | | | | | | | | | | | | |
Common Stocks (continued) | | | | | | | | | | | | |
Textiles, Apparel & Luxury Goods | | $ | 43,829,095 | | | $ | — | | | $ | — | |
Preferred Stocks | | | | | | | | | | | | |
Multi-Utilities | | | 15,921,407 | | | | — | | | | — | |
Convertible Bond | | | — | | | | 11,198,143 | | | | — | |
Affiliated Mutual Funds | | | 164,222,076 | | | | — | | | | — | |
| | | | | | | | | | | | |
Total | | $ | 1,687,436,612 | | | $ | 48,683,777 | | | $ | 576,382 | |
| | | | | | | | | | | | |
The following is a reconciliation of assets in which unobservable inputs (Level 3) were used in determining fair value:
| | | | | | | | |
| | | Common
Stocks | | | Convertible
Bonds | |
Balance as of 10/31/17 | | $ | 707,901 | | | $ | 31,629,373 | |
Realized gain (loss) | | | — | | | | 5,315,787 | |
Change in unrealized appreciation (depreciation) | | | (131,519 | ) | | | (5,050,435 | ) |
Purchases/Exchanges/Issuances | | | — | | | | — | |
Sales/Paydowns | | | — | | | | (31,894,725 | ) |
Accrued discount/premium | | | — | | | | — | |
Transfers into of Level 3 | | | — | | | | — | |
Transfers out of Level 3 | | | — | | | | — | |
| | | | | | | | |
Balance as of 10/31/18 | | $ | 576,382 | | | $ | — | |
| | | | | | | | |
| | |
Change in unrealized appreciation (depreciation) relating to securities still held at reporting period end | | $ | (131,519 | ) | | $ | — | |
| | | | | | | | |
Level 3 securities as presented in the table above are being fair valued using pricing methodologies approved by Board, which contain unobservable inputs as follows:
| | | | | | | | | | | | |
Level 3 Securities | | Fair Value as of
October 31, 2018 | | | Valuation
Methodology | | | Unobservable Inputs | |
Common Stocks | | $ | 576,382 | | | | Mark-to-Market | (Index) | | | Discretionary Adjustment Rate | |
Industry Classification:
The industry classification of investments and liabilities in excess of other assets shown as a percentage of net assets as of October 31, 2018 were as follows (unaudited):
| | | | |
Pharmaceuticals | | | 11.8 | % |
Affiliated Mutual Funds (6.7% represents investments purchased with collateral from securities on loan) | | | 10.2 | |
Banks | | | 9.6 | |
Oil, Gas & Consumable Fuels | | | 9.2 | |
Food Products | | | 4.3 | |
Specialty Retail | | | 4.2 | % |
Capital Markets | | | 3.8 | |
Aerospace & Defense | | | 3.7 | |
Health Care Equipment & Supplies | | | 3.6 | |
Beverages | | | 3.3 | |
Software | | | 3.1 | |
IT Services | | | 3.1 | |
See Notes to Financial Statements.
| | | | |
| PGIM Jennison Equity Income Fund | | | 25 | |
Schedule of Investments (continued)
as of October 31, 2018
Industry Classification (cont’d)
| | | | |
Semiconductors & Semiconductor Equipment | | | 2.9 | % |
Textiles, Apparel & Luxury Goods | | | 2.7 | |
Multi-Utilities | | | 2.6 | |
Technology Hardware, Storage & Peripherals | | | 2.5 | |
Communications Equipment | | | 2.4 | |
Electric Utilities | | | 2.4 | |
Hotels, Restaurants & Leisure | | | 2.0 | |
Road & Rail | | | 1.8 | |
Electrical Equipment | | | 1.7 | |
Insurance | | | 1.7 | |
Mortgage Real Estate Investment Trusts (REITs) | | | 1.5 | |
Life Sciences Tools & Services | | | 1.5 | |
Multiline Retail | | | 1.5 | |
Independent Power & Renewable Electricity Producers | | | 1.4 | |
Metals & Mining | | | 1.3 | |
Food & Staples Retailing | | | 1.1 | |
Health Care Providers & Services | | | 1.1 | % |
Equity Real Estate Investment Trusts (REITs) | | | 1.1 | |
Diversified Telecommunication Services | | | 1.0 | |
Industrial Conglomerates | | | 1.0 | |
Media | | | 0.8 | |
Entertainment | | | 0.8 | |
Chemicals | | | 0.7 | |
Diversified Financial Services | | | 0.0 | * |
| | | | |
| | | 107.4 | |
Liabilities in excess of other assets | | | (7.4 | ) |
| | | | |
| | | 100.0 | % |
| | | | |
Financial Instruments/Transactions—Summary of Offsetting and Netting Arrangements:
The Fund entered into financial instruments/transactions during the reporting period that are either offset in accordance with current requirements or are subject to enforceable master netting arrangements or similar agreements that permit offsetting. The information about offsetting and related netting arrangements for financial instruments/transactions, where the legal right to set-off exists, is presented in the summary below.
Offsetting of financial instrument/transaction assets and liabilities:
| | | | | | | | | | | | |
Description | | Gross Market
Value of
Recognized
Assets/(Liabilities) | | | Collateral
Pledged/(Received)(1) | | | Net Amount | |
Securities on Loan | | $ | 106,975,736 | | | $ | (106,975,736 | ) | | $ | — | |
| | | | | | | | | | | | |
| (1) | Collateral amount disclosed by the Fund is limited to the market value of financial instruments/transactions. |
See Notes to Financial Statements.
Statement of Assets & Liabilities
as of October 31, 2018
| | | | |
Assets | | | | |
Investments at value, including securities on loan of $106,975,736: | | | | |
Unaffiliated investments (cost $1,351,091,120) | | $ | 1,572,474,695 | |
Affiliated investments (cost $164,232,306) | | | 164,222,076 | |
Receivable for investments sold | | | 22,796,549 | |
Dividends and interest receivable | | | 2,072,085 | |
Receivable for Fund shares sold | | | 1,327,742 | |
Tax reclaim receivable | | | 1,158,166 | |
Prepaid expenses | | | 13,918 | |
| | | | |
Total Assets | | | 1,764,065,231 | |
| | | | |
| |
Liabilities | | | | |
Payable to broker for collateral for securities on loan | | | 108,751,877 | |
Payable for investments purchased | | | 32,163,160 | |
Payable for Fund shares reacquired | | | 3,335,929 | |
Management fee payable | | | 1,060,845 | |
Distribution fee payable | | | 630,182 | |
Accrued expenses and other liabilities | | | 515,061 | |
Affiliated transfer agent fee payable | | | 79,422 | |
| | | | |
Total Liabilities | | | 146,536,476 | |
| | | | |
| |
Net Assets | | $ | 1,617,528,755 | |
| | | | |
| | | | | |
Net assets were comprised of: | | | | |
Common stock, at par | | $ | 103,041 | |
Paid-in capital in excess of par | | | 1,167,808,065 | |
Total distributable earnings (loss) | | | 449,617,649 | |
| | | | |
Net assets, October 31, 2018 | | $ | 1,617,528,755 | |
| | | | |
See Notes to Financial Statements.
| | | | |
| PGIM Jennison Equity Income Fund | | | 27 | |
Statement of Assets & Liabilities
as of October 31, 2018
| | | | |
Class A | | | | |
Net asset value and redemption price per share,
($579,961,708 ÷ 35,836,549 shares of common stock issued and outstanding) | | $ | 16.18 | |
Maximum sales charge (5.50% of offering price) | | | 0.94 | |
| | | | |
Maximum offering price to public | | $ | 17.12 | |
| | | | |
| |
Class B | | | | |
Net asset value and redemption price per share, | | | | |
($47,982,787 ÷ 3,223,109 shares of common stock issued and outstanding) | | $ | 14.89 | |
| | | | |
| |
Class C | | | | |
Net asset value and redemption price per share, | | | | |
($505,147,865 ÷ 34,033,650 shares of common stock issued and outstanding) | | $ | 14.84 | |
| | | | |
| |
Class R | | | | |
Net asset value and redemption price per share, | | | | |
($28,190,342 ÷ 1,742,302 shares of common stock issued and outstanding) | | $ | 16.18 | |
| | | | |
| |
Class Z | | | | |
Net asset value and redemption price per share, | | | | |
($452,154,876 ÷ 27,953,219 shares of common stock issued and outstanding) | | $ | 16.18 | |
| | | | |
| |
Class R6 | | | | |
Net asset value and redemption price per share, | | | | |
($4,091,177 ÷ 252,536 shares of common stock issued and outstanding) | | $ | 16.20 | |
| | | | |
See Notes to Financial Statements.
Statement of Operations
Year Ended October 31, 2018
| | | | |
Net Investment Income (Loss) | | | | |
Income | | | | |
Unaffiliated dividend income (net of $726,676 foreign withholding tax) | | $ | 67,847,051 | |
Interest income | | | 499,984 | |
Affiliated dividend income | | | 422,471 | |
Income from securities lending, net (including affiliated income of $44,271) | | | 159,111 | |
| | | | |
Total income | | | 68,928,617 | |
| | | | |
| |
Expenses | | | | |
Management fee | | | 14,204,011 | |
Distribution fee(a) | | | 8,829,646 | |
Transfer agent’s fees and expenses (including affiliated expense of $375,772)(a) | | | 1,842,128 | |
Custodian and accounting fees | | | 156,456 | |
Registration fees(a) | | | 102,188 | |
Shareholders’ reports | | | 65,826 | |
Directors’ fees | | | 43,986 | |
Legal fees and expenses | | | 34,069 | |
Audit fee | | | 27,058 | |
Miscellaneous | | | 57,051 | |
| | | | |
Total expenses | | | 25,362,419 | |
Less: Fee waiver and/or expense reimbursement(a) | | | (14,417 | ) |
Distribution fee waiver(a) | | | (406,950 | ) |
| | | | |
Net expenses | | | 24,941,052 | |
| | | | |
Net investment income (loss) | | | 43,987,565 | |
| | | | |
| |
Realized And Unrealized Gain (Loss) On Investment And Foreign Currency Transactions | | | | |
Net realized gain (loss) on: | | | | |
Investment transactions (including affiliated of $(6,317)) | | | 230,266,840 | |
Foreign currency transactions | | | (172,623 | ) |
| | | | |
| | | 230,094,217 | |
| | | | |
| |
Net change in unrealized appreciation (depreciation) on: | | | | |
Investments (including affiliated of $(10,269)) | | | (219,210,821 | ) |
Foreign currencies | | | 79,432 | |
| | | | |
| | | (219,131,389 | ) |
| | | | |
Net gain (loss) on investment and foreign currency transactions | | | 10,962,828 | |
| | | | |
Net Increase (Decrease) In Net Assets Resulting From Operations | | $ | 54,950,393 | |
| | | | |
| (a) | Class specific expenses and waivers were as follows: |
| | | | | | | | | | | | | | | | | | | | | | | | |
| | | Class A | | | Class B | | | Class C | | | Class R | | | Class Z | | | Class R6 | |
Distribution fee | | | 1,943,730 | | | | 663,317 | | | | 5,973,614 | | | | 248,985 | | | | — | | | | — | |
Transfer agent’s fees and expenses | | | 739,639 | | | | 94,601 | | | | 490,148 | | | | 48,420 | | | | 469,104 | | | | 216 | |
Registration fees | | | 18,566 | | | | 14,679 | | | | 16,046 | | | | 14,637 | | | | 23,476 | | | | 14,784 | |
Fee waiver and/or expense reimbursement | | | — | | | | — | | | | — | | | | — | | | | — | | | | (14,417 | ) |
Distribution fee waiver | | | (323,955 | ) | | | — | | | | — | | | | (82,995 | ) | | | — | | | | — | |
See Notes to Financial Statements.
| | | | |
| PGIM Jennison Equity Income Fund | | | 29 | |
Statements of Changes in Net Assets
| | | | | | | | |
| | | Year Ended October 31, | |
| | | 2018 | | | 2017 | |
Increase (Decrease) in Net Assets | | | | | | | | |
Operations | | | | | | | | |
Net investment income (loss) | | $ | 43,987,565 | | | $ | 52,544,936 | |
Net realized gain (loss) on investment and foreign currency transactions | | | 230,094,217 | | | | 213,115,670 | |
Net change in unrealized appreciation (depreciation) on investments and foreign currencies | | | (219,131,389 | ) | | | 151,974,206 | |
| | | | | | | | |
Net increase (decrease) in net assets resulting from operations | | | 54,950,393 | | | | 417,634,812 | |
| | | | | | | | |
| | |
Dividends and Distributions | | | | | | | | |
Distributions from distributable earnings* | | | | | | | | |
Class A | | | (38,693,618 | ) | | | — | |
Class B | | | (3,987,585 | ) | | | — | |
Class C | | | (35,159,248 | ) | | | — | |
Class R | | | (1,923,875 | ) | | | — | |
Class Z | | | (31,902,165 | ) | | | — | |
Class R6 | | | (222,063 | ) | | | — | |
| | | | | | | | |
| | | (111,888,554 | ) | | | — | |
| | | | | | | | |
| | |
Dividends from net investment income | | | | | | | | |
Class A | | | | | | | (19,379,438 | ) |
Class B | | | | | | | (1,803,533 | ) |
Class C | | | | | | | (14,362,936 | ) |
Class R | | | | | | | (841,494 | ) |
Class Z | | | | | | | (22,404,546 | ) |
Class R6 | | | | | | | (121,274 | ) |
| | | | | | | | |
| | | * | | | | (58,913,221 | ) |
| | | | | | | | |
| | |
Fund share transactions (Net of share conversions) | | | | | | | | |
Net proceeds from shares sold | | | 60,274,663 | | | | 156,201,792 | |
Net asset value of shares issued in reinvestment of dividends and distributions | | | 96,882,217 | | | | 49,868,593 | |
Cost of shares reacquired | | | (511,300,273 | ) | | | (1,895,076,368 | ) |
| | | | | | | | |
Net increase (decrease) in net assets from Fund share transactions | | | (354,143,393 | ) | | | (1,689,005,983 | ) |
| | | | | | | | |
Total increase (decrease) | | | (411,081,554 | ) | | | (1,330,284,392 | ) |
| | |
Net Assets: | | | | | | | | |
Beginning of year | | | 2,028,610,309 | | | | 3,358,894,701 | |
| | | | | | | | |
End of year(a) | | $ | 1,617,528,755 | | | $ | 2,028,610,309 | |
| | | | | | | | |
(a) Includes undistributed/(distributions in excess of) net investment income of: | | $ | | * | | $ | 3,413,565 | |
| | | | | | | | |
| * | For the year ended October 31, 2018, the Fund has adopted amendments to Regulation S-X (refer to Note 9). |
See Notes to Financial Statements.
Notes to Financial Statements
Prudential Investment Portfolios, Inc. 10 (the “Company”) is registered under the Investment Company Act of 1940, as amended (“1940 Act”), as an open-end management investment company. The Company was organized on March 5, 1997, as a Maryland Corporation and operates as a series company. The Company consists of two funds: PGIM Jennison Equity Income Fund and PGIM QMA Mid-Cap Value Fund, each of which are diversified funds. These financial statements relate only to the PGIM Jennison Equity Income Fund (the “Fund”). Effective June 11, 2018, the names of the Fund and the other funds which comprise the Company were changed by replacing “Prudential” with “PGIM” and each fund’s Class Q shares were renamed Class R6 shares.
The investment objective of the Fund is income and capital appreciation.
1. Accounting Policies
The Fund follows the investment company accounting and reporting guidance of the Financial Accounting Standards Board (“FASB”) Accounting Standard Codification (“ASC”) Topic 946 Financial Services—Investment Companies. The following accounting policies conform to U.S. generally accepted accounting principles. The Fund consistently follows such policies in the preparation of its financial statements.
Securities Valuation: The Fund holds securities and other assets and liabilities that are fair valued at the close of each day (generally, 4:00 PM Eastern time) the New York Stock Exchange (“NYSE”) is open for trading. Fair value is the price that would be received to sell an asset or paid to transfer a liability in an orderly transaction between market participants on the measurement date. The Company’s Board of Directors (the “Board”) has adopted valuation procedures for security valuation under which fair valuation responsibilities have been delegated to PGIM Investments LLC (“PGIM Investments” or the “Manager”). Pursuant to the Board’s delegation, a Valuation Committee has been established as two persons, being one or more officers of the Company, including: the Company’s Treasurer (or the Treasurer’s direct reports); and the Company’s Chief or Deputy Chief Compliance Officer (or Vice-President-level direct reports of the Chief or Deputy Chief Compliance Officer). Under the current valuation procedures, the Valuation Committee of the Board is responsible for supervising the valuation of portfolio securities and other assets and liabilities. The valuation procedures permit the Fund to utilize independent pricing vendor services, quotations from market makers, and alternative valuation methods when market quotations are either not readily available or not deemed representative of fair value. A record of the Valuation Committee’s actions is subject to the Board’s review, approval, and ratification at its next regularly scheduled quarterly meeting.
For the fiscal reporting period-end, securities and other assets and liabilities were fair valued at the close of the last U.S. business day. Trading in certain foreign securities may occur
| | | | |
| PGIM Jennison Equity Income Fund | | | 31 | |
Notes to Financial Statements (continued)
when the NYSE is closed (including weekends and holidays). Because such foreign securities trade in markets that are open on weekends and U.S. holidays, the values of some of the Fund’s foreign investments may change on days when investors cannot purchase or redeem Fund shares.
Various inputs determine how the Fund’s investments are valued, all of which are categorized according to the three broad levels (Level 1, 2, or 3) detailed in the Schedule of Investments and referred to herein as the “fair value hierarchy” in accordance with FASB ASC Topic 820—Fair Value Measurements and Disclosures.
Common and preferred stocks, exchange-traded funds, and derivative instruments, such as futures or options, that are traded on a national securities exchange are valued at the last sale price as of the close of trading on the applicable exchange where the security principally trades. Securities traded via NASDAQ are valued at the NASDAQ official closing price. To the extent these securities are valued at the last sale price or NASDAQ official closing price, they are classified as Level 1 in the fair value hierarchy. In the event that no sale or official closing price on valuation date exists, these securities are generally valued at the mean between the last reported bid and ask prices, or at the last bid price in the absence of an ask price. These securities are classified as Level 2 in the fair value hierarchy.
Foreign equities traded on foreign securities exchanges are generally valued using pricing vendor services that provide model prices derived using adjustment factors based on information such as local closing price, relevant general and sector indices, currency fluctuations, depositary receipts, and futures, as applicable. Securities valued using such model prices are classified as Level 2 in the fair value hierarchy. The models generate an evaluated adjustment factor for each security, which is applied to the local closing price to adjust it for post closing market movements up to the time the Fund is valued. Utilizing that evaluated adjustment factor, the vendor provides an evaluated price for each security. If the vendor does not provide an evaluated price, securities are valued in accordance with exchange-traded common and preferred stock valuation policies discussed above.
Investments in open-end, non-exchange-traded mutual funds are valued at their net asset values as of the close of the NYSE on the date of valuation. These securities are classified as Level 1 in the fair value hierarchy since they may be purchased or sold at their net asset values on the date of valuation.
Securities and other assets that cannot be priced according to the methods described above are valued based on pricing methodologies approved by the Board. In the event that unobservable inputs are used when determining such valuations, the securities will be classified as Level 3 in the fair value hierarchy.
When determining the fair value of securities, some of the factors influencing the valuation include: the nature of any restrictions on disposition of the securities; assessment of the general liquidity of the securities; the issuer’s financial condition and the markets in which it does business; the cost of the investment; the size of the holding and the capitalization of the issuer; the prices of any recent transactions or bids/offers for such securities or any comparable securities; any available analyst media or other reports or information deemed reliable by the Manager regarding the issuer or the markets or industry in which it operates. Using fair value to price securities may result in a value that is different from a security’s most recent closing price and from the price used by other unaffiliated mutual funds to calculate their net asset values.
Restricted and Illiquid Securities: Subject to guidelines adopted by the Board, the Fund may invest up to 15% of its net assets in illiquid securities, including those which are restricted as to disposition under securities law (“restricted securities”). Restricted securities are valued pursuant to the valuation procedures noted above. Illiquid securities are those that, because of the absence of a readily available market or due to legal or contractual restrictions on resale, cannot be sold within seven days in the ordinary course of business at approximately the amount at which the Fund has valued the investment. Therefore, the Fund may find it difficult to sell illiquid securities at the time considered most advantageous by its subadviser and may incur transaction costs that would not be incurred in the sale of securities that were freely marketable. Certain securities that would otherwise be considered illiquid because of legal restrictions on resale to the general public may be traded among qualified institutional buyers under Rule 144A of the Securities Act of 1933. These Rule 144A securities, as well as commercial paper that is sold in private placements under Section 4(2) of the Securities Act, may be deemed liquid by the Fund’s subadviser under the guidelines adopted by the Board of the Company. However, the liquidity of the Fund’s investments in Rule 144A securities could be impaired if trading does not develop or declines.
Foreign Currency Translation: The books and records of the Fund are maintained in U.S. dollars. Foreign currency amounts are translated into U.S. dollars on the following basis:
(i) market value of investment securities, other assets and liabilities—at the current rates of exchange;
(ii) purchases and sales of investment securities, income and expenses—at the rates of exchange prevailing on the respective dates of such transactions.
Although the net assets of the Fund are presented at the foreign exchange rates and market values at the close of the period, the Fund does not generally isolate that portion of the results of operations arising as a result of changes in the foreign exchange rates from the fluctuations arising from changes in the market prices of long-term portfolio securities held at the end of the period. Similarly, the Fund does not isolate the effect of changes in foreign exchange rates from the fluctuations arising from changes in the market prices of long-term portfolio securities sold during the period. Accordingly, holding period realized foreign
| | | | |
| PGIM Jennison Equity Income Fund | | | 33 | |
Notes to Financial Statements (continued)
currency gains (losses) are included in the reported net realized gains (losses) on investment transactions.
Net realized gains (losses) on foreign currency transactions represent net foreign exchange gains (losses) from the disposition of holdings of foreign currencies, currency gains (losses) realized between the trade and settlement dates on securities transactions, and the difference between the amounts of interest, dividends and foreign withholding taxes recorded on the Fund’s books and the U.S. dollar equivalent amounts actually received or paid. Net unrealized currency gains (losses) arise from valuing foreign currency denominated assets and liabilities (other than investments) at period end exchange rates.
Master Netting Arrangements: The Company, on behalf of the Fund, is subject to various Master Agreements, or netting arrangements, with select counterparties. These are agreements which a subadviser may have negotiated and entered into on behalf of the Fund. A master netting arrangement between the Fund and the counterparty permits the Fund to offset amounts payable by the Fund to the same counterparty against amounts to be received; and by the receipt of collateral from the counterparty by the Fund to cover the Fund’s exposure to the counterparty. However, there is no assurance that such mitigating factors are easily enforceable. In addition to master netting arrangements, the right to set-off exists when all the conditions are met such that each of the parties owes the other determinable amounts, the reporting party has the right to set-off the amount owed with the amount owed by the other party, the reporting party intends to set-off and the right of set-off is enforceable by law. During the reporting period, there was no intention to settle on a net basis and all amounts are presented on a gross basis on the Statement of Assets and Liabilities.
Securities Lending: The Fund lends its portfolio securities to banks and broker-dealers. The loans are secured by collateral at least equal to the market value of the securities loaned. Collateral pledged by each borrower is invested in an affiliated money market fund and is marked to market daily, based on the previous day’s market value, such that the value of the collateral exceeds the value of the loaned securities. In the event of significant appreciation in value of securities on loan on the last business day of the reporting period, the financial statements may reflect a collateral value that is less than the market value of the loaned securities. Such shortfall is remedied as described above. Loans are subject to termination at the option of the borrower or the Fund. Upon termination of the loan, the borrower will return to the Fund securities identical to the loaned securities. Should the borrower of the securities fail financially, the Fund has the right to repurchase the securities in the open market using the collateral.
The Fund recognizes income, net of any rebate and securities lending agent fees, for lending its securities in the form of fees or interest on the investment of any cash received as
collateral. The borrower receives all interest and dividends from the securities loaned and such payments are passed back to the lender in amounts equivalent thereto. The Fund also continues to recognize any unrealized gain (loss) in the market price of the securities loaned and on the change in the value of the collateral invested that may occur during the term of the loan. In addition, realized gain (loss) is recognized on changes in the value of the collateral invested upon liquidation of the collateral. Net earnings from securities lending are disclosed on the Statement of Operations as “Income from securities lending, net”.
Equity and Mortgage Real Estate Investment Trusts (collectively equity REITs): The Fund invests in equity REITs, which report information on the source of their distributions annually. Based on current and historical information, a portion of distributions received from equity REITs during the period is estimated to be dividend income, capital gain or return of capital and recorded accordingly. When material, these estimates are adjusted periodically when the actual source of distributions is disclosed by the equity REITs.
Securities Transactions and Net Investment Income: Securities transactions are recorded on the trade date. Realized gains (losses) from investment and currency transactions are calculated on the specific identification method. Dividend income is recorded on the ex-date. Expenses are recorded on an accrual basis, which may require the use of certain estimates by management that may differ from actual. Net investment income or loss (other than class specific expenses and waivers, which are allocated as noted below) and unrealized and realized gains (losses) are allocated daily to each class of shares based upon the relative proportion of adjusted net assets of each class at the beginning of the day. Class specific expenses and waivers, where applicable, are charged to the respective share classes. Class specific expenses include distribution fees and distribution fee waivers, shareholder servicing fees, transfer agent’s fees and expenses, registration fees and fee waivers and/or expense reimbursements, as applicable.
Taxes: It is the Fund’s policy to continue to meet the requirements of the Internal Revenue Code applicable to regulated investment companies and to distribute all of its taxable net investment income and capital gains, if any, to its shareholders. Therefore, no federal income tax provision is required. Withholding taxes on foreign dividends, interest and capital gains, if any, are recorded, net of reclaimable amounts, at the time the related income is earned.
Dividends and Distributions: The Fund expects to pay dividends from net investment income quarterly. Distributions from net realized capital and currency gains, if any, are declared and paid annually. Dividends and distributions to shareholders, which are determined in accordance with federal income tax regulations and which may differ from generally accepted accounting principles, are recorded on the ex-date. Permanent book/tax differences relating to income and gain (loss) are reclassified amongst total distributable earnings (loss) and paid-in capital in excess of par, as appropriate.
Estimates: The preparation of financial statements requires management to make estimates and assumptions that affect the reported amounts and disclosures in the financial
| | | | |
| PGIM Jennison Equity Income Fund | | | 35 | |
Notes to Financial Statements (continued)
statements. Actual results could differ from those estimates.
2. Agreements
The Company, on behalf of the Fund, has a management agreement with PGIM Investments. Pursuant to this agreement, PGIM Investments has responsibility for all investment advisory services and supervises the subadviser’s performance of such services. In addition, under the management agreement, PGIM Investments provides all of the administrative functions necessary for the organization, operation and management of the Fund. PGIM Investments administers the corporate affairs of the Fund and, in connection therewith, furnishes the Fund with office facilities, together with those ordinary clerical and bookkeeping services which are not being furnished by the Fund’s custodian and the Fund’s transfer agent. PGIM Investments is also responsible for the staffing and management of dedicated groups of legal, marketing, compliance and related personnel necessary for the operation of the Fund. The legal, marketing, compliance and related personnel are also responsible for the management and oversight of the various service providers to the Fund, including, but not limited to, the custodian, transfer agent, and accounting agent.
PGIM Investments has entered into a subadvisory agreement with Jennison Associates LLC (“Jennison”). The subadvisory agreement provides that Jennison will furnish investment advisory services in connection with the management of the Fund. In connection therewith, Jennison is obligated to keep certain books and records of the Fund. PGIM Investments pays for the services of Jennison, the cost of compensation of officers of the Fund, occupancy and certain clerical and bookkeeping costs of the Fund. The Fund bears all other costs and expenses.
Effective July 1, 2018, the management fee paid to PGIM Investments was accrued daily and payable monthly at an annual rate of 0.77% of the Fund’s average daily net assets up to and including $500 million, 0.74% on the next $500 million, 0.725% on the next $1.5 billion, 0.70% on the next $5 billion, 0.675% on the next $2.5 billion and 0.650% of the Fund’s average daily net assets in excess of $10 billion. Prior to July 1, 2018, the management fee paid to PGIM Investments was accrued daily and payable monthly at an annual rate of 0.825% of the Fund’s average daily net assets up to and including $500 million, 0.775% on the next $500 million, 0.75% on the next $1.5 billion, 0.70% on the next $5 billion, 0.675% on the next $2.5 billion and 0.650% of the Fund’s average daily net assets in excess of $10 billion. The effective management fee rate before any waivers and/or expense reimbursements was 0.770% for the year ended October 31, 2018.
PGIM Investments has contractually agreed, through February 28, 2019, to limit transfer agency, shareholder servicing, sub-transfer agency, and blue sky fees, as applicable, to the extent that such fees cause the total annual operating expenses to exceed 0.80% of average
daily net assets for Class R6 shares. This contractual waiver excludes interest, brokerage, taxes (such as income and foreign withholding taxes, stamp duty and deferred tax expenses), acquired fund fees and expenses, extraordinary expenses, and certain other Fund expenses such as dividend and interest expense and broker charges on short sales. Expenses waived/reimbursed by the Manager in accordance with this agreement may be recouped by the Manager within the same fiscal year during which such waiver/reimbursement is made if such recoupment can be realized without exceeding the expense limit in effect at the time of the recoupment for that fiscal year. Effective November 1, 2018 this waiver agreement was extended through February 29, 2020.
Where applicable, PGIM Investments voluntarily agreed through June 30, 2018, to waive management fees or shared operating expenses on any share class to the same extent that it waives similar expenses on any other share class and, in addition, total annual operating expenses for Class R6 shares will not exceed total annual operating expenses for Class Z shares. Effective July 1, 2018 this voluntary agreement became part of the Fund’s contractual waiver agreement through February 29, 2020 and is subject to recoupment by the Manager within the same fiscal year during which such wavier/reimbursement is made if such recoupment can be realized without exceeding the expense limit in effect at the time of the recoupment for that fiscal year.
The Company, on behalf of the Fund, has a distribution agreement with Prudential Investment Management Services LLC (“PIMS”), which acts as the distributor of the Class A, Class B, Class C, Class R, Class Z and Class R6 shares of the Fund. The Fund compensates PIMS for distributing and servicing the Fund’s Class A, Class B, Class C and Class R shares, pursuant to the plans of distribution (the “Distribution Plans”), regardless of expenses actually incurred by PIMS. The distribution fees are accrued daily and payable monthly. No distribution or service fees are paid to PIMS as distributor of the Class Z and Class R6 shares of the Fund.
Pursuant to the Distribution Plans, the Fund compensates PIMS for distribution related activities at an annual rate of up to 0.30%, 1%, 1% and 0.75% of the average daily net assets of the Class A, Class B, Class C and Class R shares, respectively. PIMS has contractually agreed to limit such fees to 0.25% and 0.50% of the average daily net assets of the Class A and Class R shares, respectively, through February 29, 2020.
PIMS has advised the Fund that it received $395,489 in front-end sales charges resulting from sales of Class A shares during the year ended October 31, 2018. From these fees, PIMS paid such sales charges to broker-dealers, who in turn paid commissions to salespersons and incurred other distribution costs.
PIMS has advised the Fund that for the year ended October 31, 2018, it received $58,017 and $8,601 in contingent deferred sales charges imposed upon redemptions by certain Class B and Class C shareholders, respectively.
PGIM Investments, PIMS and Jennison are indirect, wholly-owned subsidiaries of Prudential
| | | | |
| PGIM Jennison Equity Income Fund | | | 37 | |
Notes to Financial Statements (continued)
Financial, Inc. (“Prudential”).
3. Other Transactions with Affiliates
Prudential Mutual Fund Services LLC (“PMFS”), an affiliate of PGIM Investments and an indirect, wholly-owned subsidiary of Prudential, serves as the Fund’s transfer agent. Transfer agent’s fees and expenses in the Statement of Operations include certain out-of-pocket expenses paid to non-affiliates, where applicable.
The Fund may enter into certain securities purchase or sale transactions under Board approved Rule 17a-7 procedures. Rule 17a-7 is an exemptive rule under the 1940 Act, that, subject to certain conditions, permits purchase and sale transactions among affiliated investment companies, or between an investment company and a person that is affiliated solely by reason of having a common (or affiliated) investment adviser, common directors, and/or common officers. Such transactions are subject to ratification by the Board. For the reporting period ended October 31, 2018, no such transactions were entered into by the Fund.
The Fund may invest its overnight sweep cash in the PGIM Core Ultra Short Bond Fund (the “Core Fund”), and its securities lending cash collateral in the PGIM Institutional Money Market Fund (the “Money Market Fund”), each a series of Prudential Investment Portfolios 2, registered under the 1940 Act and managed by PGIM Investments. For the reporting period ended October 31, 2018, PGIM, Inc. was compensated $26,440 by PGIM Investments for managing the Fund’s securities lending cash collateral as subadviser to the Money Market Fund. Earnings from the Core Fund and Money Market Fund are disclosed on the Statement of Operations as “Affiliated dividend income” and “Income from securities lending, net”, respectively.
4. Portfolio Securities
The aggregate cost of purchases and proceeds from sales of portfolio securities (excluding short-term investments and U.S. Government securities) for the year ended October 31, 2018, were $1,595,478,499 and $1,979,476,508, respectively.
A summary of the cost of purchases and proceeds from sales of shares of affiliated mutual funds for the year ended October 31, 2018, is presented as follows:
| | | | | | | | | | | | | | | | | | | | | | | | | | | | | | |
Value,
Beginning
of Year | | | Cost of
Purchases | | | Proceeds
from Sales | | | Change in
Unrealized
Gain
(Loss) | | | Realized
Gain
(Loss) | | | Value,
End of
Year | | | Shares,
End of
Year | | | Income | |
| | PGIM Core Ultra Short Bond Fund* | | | | | | | | | | | | | | | | | |
| $ | 5,977,165 | | | $ | 1,205,880,407 | | | $ | 1,156,565,786 | | | $ | — | | | $ | — | | | $ | 55,291,786 | | | | 55,291,786 | | | $ | 422,471 | |
| | PGIM Institutional Money Market Fund* | |
| | 21,712,580 | | | | 493,126,260 | | | | 405,891,964 | | | | (10,269 | ) | | | (6,317 | ) | | | 108,930,290 | | | | 108,930,290 | | | | 44,271 | ** |
| | | | | | | | | | | | | | | | | | | | | | | | | | | | | | |
| $ | 27,689,745 | | | $ | 1,699,006,667 | | | $ | 1,562,457,750 | | | $ | (10,269 | ) | | $ | (6,317 | ) | | $ | 164,222,076 | | | | | | | $ | 466,742 | |
| | | | | | | | | | | | | | | | | | | | | | | | | | | | | | |
| * | The Fund did not have any capital gain distributions during the reporting period. |
| ** | This amount is included in “Income from securities lending, net” on the Statement of Operations. |
5. Distributions and Tax Information
Distributions to shareholders, which are determined in accordance with federal income tax regulations and which may differ from generally accepted accounting principles, are recorded on the ex-date. In order to present total distributable earnings (loss) and paid-in capital in excess of par on the Statement of Assets and Liabilities that more closely represent their tax character, certain adjustments have been made to total distributable earnings (loss) and paid-in capital in excess of par. For the year ended October 31, 2018, the adjustments were to increase total distributable earnings and decrease paid-in capital in excess of par by $6 due to investments in partnerships. Net investment income, net realized gain (loss) on investments and foreign currency transactions and net assets were not affected by this change.
For the year ended October 31, 2018, the tax character of dividends paid by the Fund were $44,046,938 of ordinary income and $67,841,616 of long-term capital gains. For the year ended October 31, 2017, the tax character of dividends paid by the Fund was $58,913,221 of ordinary income.
As of October 31, 2018, the accumulated undistributed earnings on a tax basis were $3,136,629 of ordinary income and $233,640,915 of long-term capital gains.
The United States federal income tax basis of the Fund’s investments and the net unrealized appreciation as of October 31, 2018 were as follows:
| | | | | | |
Tax Basis | | Gross Unrealized Appreciation | | Gross Unrealized Depreciation | | Net Unrealized Appreciation |
| $1,523,856,666 | | $262,385,239 | | $(49,545,134) | | $212,840,105 |
The book basis differs from tax basis primarily due to deferred losses on wash sales and other cost basis differences.
| | | | |
| PGIM Jennison Equity Income Fund | | | 39 | |
Notes to Financial Statements (continued)
Management has analyzed the Fund’s tax positions taken on federal, state and local income tax returns for all open tax years and has concluded that no provision for income tax is required in the Fund’s financial statements for the current reporting period. The Fund’s federal, state and local income and federal excise tax returns for tax years for which the applicable statutes of limitations have not expired are subject to examination by the Internal Revenue Service and state departments of revenue.
6. Capital and Ownership
The Fund offers Class A, Class B, Class C, Class R, Class Z and Class R6 shares. Class A shares are sold with a maximum front-end sales charge of 5.50%. Investors who purchase $1 million or more of Class A shares and sell these shares within 12 months of purchase are subject to a contingent deferred sales charge (“CDSC”) of 1%, although they are not subject to an initial sales charge. The Class A CDSC is waived for certain retirement and/or benefit plans. A special exchange privilege is also available for shareholders who qualified to purchase Class A shares at net asset value. Class B shares are sold with a CDSC which declines from 5% to zero depending on the period of time the shares are held. Class B shares will automatically convert to Class A shares on a quarterly basis approximately seven years after purchase. Class B shares are closed to new purchases. Class C shares are sold with a CDSC of 1% on sales made within 12 months of purchase. Class R, Class Z and Class R6 shares are not subject to any sales or redemption charge and are available exclusively for sale to a limited group of investors.
Under certain circumstances, an exchange may be made from specified share classes of the Fund to one or more other share classes of the Fund as presented in the table of transactions in shares of common stock.
The authorized capital stock of the Company is 5.5 billion shares, with a par value of $0.001 per share. Of the Company’s authorized capital stock, 2.770 billion authorized shares have been allocated to the Fund and divided into seven classes, designated Class A, Class B, Class C, Class R, Class Z, Class T and Class R6 common stock, each of which consists of 400 million, 20 million, 300 million, 75 million, 1,250 million, 650 million and 75 million authorized shares, respectively. The Fund currently does not have any Class T shares outstanding.
At reporting period end, eight shareholders of record held 69% of the Fund’s outstanding shares on behalf of multiple beneficial owners.
Transactions in shares of common stock were as follows:
| | | | | | | | |
Class A | | Shares | | | Amount | |
Year ended October 31, 2018: | | | | | | | | |
Shares sold | | | 1,391,935 | | | $ | 23,564,904 | |
Shares issued in reinvestment of dividends and distributions | | | 2,135,094 | | | | 35,824,946 | |
Shares reacquired | | | (8,004,478 | ) | | | (135,037,083 | ) |
| | | | | | | | |
Net increase (decrease) in shares outstanding before conversion | | | (4,477,449 | ) | | | (75,647,233 | ) |
Shares issued upon conversion from other share class(es) | | | 1,507,745 | | | | 25,810,965 | |
Shares reacquired upon conversion into other share class(es) | | | (1,787,241 | ) | | | (30,332,570 | ) |
| | | | | | | | |
Net increase (decrease) in shares outstanding | | | (4,756,945 | ) | | $ | (80,168,838 | ) |
| | | | | | | | |
Year ended October 31, 2017: | | | | | | | | |
Shares sold | | | 2,609,211 | | | $ | 40,491,177 | |
Shares issued in reinvestment of dividends and distributions | | | 1,109,269 | | | | 17,456,780 | |
Shares reacquired | | | (21,330,088 | ) | | | (332,581,496 | ) |
| | | | | | | | |
Net increase (decrease) in shares outstanding before conversion | | | (17,611,608 | ) | | | (274,633,539 | ) |
Shares issued upon conversion from other share class(es) | | | 859,274 | | | | 13,626,451 | |
Shares reacquired upon conversion into other share class(es) | | | (14,039,855 | ) | | | (218,923,813 | ) |
| | | | | | | | |
Net increase (decrease) in shares outstanding | | | (30,792,189 | ) | | $ | (479,930,901 | ) |
| | | | | | | | |
Class B | | | | | | |
Year ended October 31, 2018: | | | | | | | | |
Shares sold | | | 53,945 | | | $ | 838,977 | |
Shares issued in reinvestment of dividends and distributions | | | 209,850 | | | | 3,242,469 | |
Shares reacquired | | | (1,252,953 | ) | | | (19,510,599 | ) |
| | | | | | | | |
Net increase (decrease) in shares outstanding before conversion | | | (989,158 | ) | | | (15,429,153 | ) |
Shares reacquired upon conversion into other share class(es) | | | (1,263,055 | ) | | | (20,005,435 | ) |
| | | | | | | | |
Net increase (decrease) in shares outstanding | | | (2,252,213 | ) | | $ | (35,434,588 | ) |
| | | | | | | | |
Year ended October 31, 2017: | | | | | | | | |
Shares sold | | | 104,937 | | | $ | 1,519,662 | |
Shares issued in reinvestment of dividends and distributions | | | 93,236 | | | | 1,365,362 | |
Shares reacquired | | | (2,325,197 | ) | | | (33,983,697 | ) |
| | | | | | | | |
Net increase (decrease) in shares outstanding before conversion | | | (2,127,024 | ) | | | (31,098,673 | ) |
Shares reacquired upon conversion into other share class(es) | | | (526,889 | ) | | | (7,738,780 | ) |
| | | | | | | | |
Net increase (decrease) in shares outstanding | | | (2,653,913 | ) | | $ | (38,837,453 | ) |
| | | | | | | | |
| | | | |
| PGIM Jennison Equity Income Fund | | | 41 | |
Notes to Financial Statements (continued)
| | | | | | | | |
Class C | | Shares | | | Amount | |
Year ended October 31, 2018: | | | | | | | | |
Shares sold | | | 880,850 | | | $ | 13,666,684 | |
Shares issued in reinvestment of dividends and distributions | | | 1,963,882 | | | | 30,299,159 | |
Shares reacquired | | | (9,089,353 | ) | | | (140,986,551 | ) |
| | | | | | | | |
Net increase (decrease) in shares outstanding before conversion | | | (6,244,621 | ) | | | (97,020,708 | ) |
Shares issued upon conversion from other share class(es) | | | 1,386 | | | | 21,965 | |
Shares reacquired upon conversion into other share class(es) | | | (2,337,504 | ) | | | (36,380,958 | ) |
| | | | | | | | |
Net increase (decrease) in shares outstanding | | | (8,580,739 | ) | | $ | (133,379,701 | ) |
| | | | | | | | |
Year ended October 31, 2017: | | | | | | | | |
Shares sold | | | 1,164,967 | | | $ | 16,744,026 | |
Shares issued in reinvestment of dividends and distributions | | | 818,973 | | | | 11,940,476 | |
Shares reacquired | | | (22,398,025 | ) | | | (324,557,860 | ) |
| | | | | | | | |
Net increase (decrease) in shares outstanding before conversion | | | (20,414,085 | ) | | | (295,873,358 | ) |
Shares reacquired upon conversion into other share class(es) | | | (5,009,805 | ) | | | (72,754,069 | ) |
| | | | | | | | |
Net increase (decrease) in shares outstanding | | | (25,423,890 | ) | | $ | (368,627,427 | ) |
| | | | | | | | |
Class R | | | | | | |
Year ended October 31, 2018: | | | | | | | | |
Shares sold | | | 104,615 | | | $ | 1,767,710 | |
Shares issued in reinvestment of dividends and distributions | | | 114,609 | | | | 1,923,221 | |
Shares reacquired | | | (682,134 | ) | | | (11,561,794 | ) |
| | | | | | | | |
Net increase (decrease) in shares outstanding before conversion | | | (462,910 | ) | | | (7,870,863 | ) |
Shares reacquired upon conversion into other share class(es) | | | (861 | ) | | | (14,245 | ) |
| | | | | | | | |
Net increase (decrease) in shares outstanding | | | (463,771 | ) | | $ | (7,885,108 | ) |
| | | | | | | | |
Year ended October 31, 2017: | | | | | | | | |
Shares sold | | | 263,332 | | | $ | 4,123,870 | |
Shares issued in reinvestment of dividends and distributions | | | 53,220 | | | | 841,235 | |
Shares reacquired | | | (853,039 | ) | | | (13,479,022 | ) |
| | | | | | | | |
Net increase (decrease) in shares outstanding before conversion | | | (536,487 | ) | | | (8,513,917 | ) |
Shares reacquired upon conversion into other share class(es) | | | (681 | ) | | | (10,786 | ) |
| | | | | | | | |
Net increase (decrease) in shares outstanding | | | (537,168 | ) | | $ | (8,524,703 | ) |
| | | | | | | | |
| | | | | | | | |
Class Z | | Shares | | | Amount | |
Year ended October 31, 2018: | | | | | | | | |
Shares sold | | | 1,187,630 | | | $ | 19,983,469 | |
Shares issued in reinvestment of dividends and distributions | | | 1,514,288 | | | | 25,384,558 | |
Shares reacquired | | | (11,978,925 | ) | | | (202,379,402 | ) |
| | | | | | | | |
Net increase (decrease) in shares outstanding before conversion | | | (9,277,007 | ) | | | (157,011,375 | ) |
Shares issued upon conversion from other share class(es) | | | 3,827,286 | | | | 64,837,972 | |
Shares reacquired upon conversion into other share class(es) | | | (371,625 | ) | | | (6,243,532 | ) |
| | | | | | | | |
Net increase (decrease) in shares outstanding | | | (5,821,346 | ) | | $ | (98,416,935 | ) |
| | | | | | | | |
Year ended October 31, 2017: | | | | | | | | |
Shares sold | | | 6,017,080 | | | $ | 92,026,614 | |
Shares issued in reinvestment of dividends and distributions | | | 1,162,565 | | | | 18,165,242 | |
Shares reacquired | | | (75,394,537 | ) | | | (1,182,837,487 | ) |
| | | | | | | | |
Net increase (decrease) in shares outstanding before conversion | | | (68,214,892 | ) | | | (1,072,645,631 | ) |
Shares issued upon conversion from other share class(es) | | | 18,408,360 | | | | 287,529,506 | |
Shares reacquired upon conversion into other share class(es) | | | (142,248 | ) | | | (2,240,211 | ) |
| | | | | | | | |
Net increase (decrease) in shares outstanding | | | (49,948,780 | ) | | $ | (787,356,336 | ) |
| | | | | | | | |
Class R6 | | | | | | |
Year ended October 31, 2018: | | | | | | | | |
Shares sold | | | 26,767 | | | $ | 452,919 | |
Shares issued in reinvestment of dividends and distributions | | | 12,337 | | | | 207,864 | |
Shares reacquired | | | (108,238 | ) | | | (1,824,844 | ) |
| | | | | | | | |
Net increase (decrease) in shares outstanding before conversion | | | (69,134 | ) | | | (1,164,061 | ) |
Shares issued upon conversion from other share class(es) | | | 137,073 | | | | 2,305,838 | |
| | | | | | | | |
Net increase (decrease) in shares outstanding | | | 67,939 | | | $ | 1,141,777 | |
| | | | | | | | |
Year ended October 31, 2017: | | | | | | | | |
Shares sold | | | 81,981 | | | $ | 1,296,443 | |
Shares issued in reinvestment of dividends and distributions | | | 6,322 | | | | 99,498 | |
Shares reacquired | | | (492,877 | ) | | | (7,636,806 | ) |
| | | | | | | | |
Net increase (decrease) in shares outstanding before conversion | | | (404,574 | ) | | | (6,240,865 | ) |
Shares issued upon conversion from other share class(es) | | | 33,258 | | | | 533,116 | |
Shares reacquired upon conversion into other share class(es) | | | (1,342 | ) | | | (21,414 | ) |
| | | | | | | | |
Net increase (decrease) in shares outstanding | | | (372,658 | ) | | $ | (5,729,163 | ) |
| | | | | | | | |
7. Borrowings
The Company, on behalf of the Fund, along with other affiliated registered investment companies (the “Funds”), is a party to a Syndicated Credit Agreement (“SCA”) with a group of banks. The purpose of the SCA is to provide an alternative source of temporary funding for capital share redemptions. The SCA provides for a commitment of $900 million for the period October 4, 2018 through October 3, 2019. The Funds pay an annualized commitment fee of 0.15% of the unused portion of the SCA. The Fund’s portion of the commitment fee for the unused amount, allocated based upon a method approved by the Board, is accrued daily and paid quarterly. Prior to October 4, 2018, the Funds had another SCA that provided a commitment of $900 million and the Funds paid an annualized commitment fee of 0.15% of the unused portion of the SCA. The interest on borrowings under both SCAs is paid monthly and at a per annum interest rate based upon a contractual spread plus the higher of (1) the effective federal funds rate, (2) the 1-month LIBOR rate or (3) zero percent.
| | | | |
| PGIM Jennison Equity Income Fund | | | 43 | |
Notes to Financial Statements (continued)
Other affiliated registered investment companies that are parties to the SCA include portfolios that are subject to a predetermined mathematical formula used to manage certain benefit guarantees offered under variable annuity contracts. The formula may result in large scale asset flows into and out of these portfolios. Consequently, these portfolios may be more likely to utilize the SCA for purposes of funding redemptions. It may be possible for those portfolios to fully exhaust the committed amount of the SCA, thereby requiring the Manager to allocate available funding per a Board-approved methodology designed to treat the Funds in the SCA equitably.
The Fund utilized the SCA during the reporting period ended October 31, 2018. The average daily balance for the 1 day that the Fund had loans outstanding during the period was $944,000, borrowed at a weighted average interest rate of 2.52%. The maximum loan balance outstanding during the period was $944,000. At October 31, 2018, the Fund did not have an outstanding loan balance.
8. Risks of Investing in the Fund
The Fund’s risks include, but are not limited to, some or all of the risks discussed below:
Equity and Equity-Related Securities Risks: The value of a particular security could go down and you could lose money. In addition to an individual security losing value, the value of the equity markets or a sector in which the Fund invests could go down. The Fund’s holdings can vary significantly from broad market indexes and the performance of the Fund can deviate from the performance of these indexes. Different parts of a market can react differently to adverse issuer, market, regulatory, political and economic developments.
9. Recent Accounting Pronouncements and Reporting Updates
In August 2018, the Securities and Exchange Commission (the “SEC”) adopted amendments to Regulation S-X to update and simplify the disclosure requirements for registered investment companies by eliminating requirements that are redundant or duplicative of US GAAP requirements or other SEC disclosure requirements. The new amendments require the presentation of the total, rather than the components, of distributable earnings on the Statement of Assets and Liabilities and the total, rather than the components, of dividends from net investment income and distributions from net realized gains on the Statements of Changes in Net Assets. The amendments also removed the requirement for the parenthetical disclosure of undistributed net investment income on the Statements of Changes in Net Assets and certain tax adjustments that were reflected in the Notes to Financial Statements. All of these have been reflected in the Fund’s financial statements.
In August 2018, the FASB issued Accounting Standards Update (“ASU”) No. 2018-13, which changes certain fair value measurement disclosure requirements. The new ASU, in addition to other modifications and additions, removes the requirement to disclose the amount and reasons for transfers between Level 1 and Level 2 of the fair value hierarchy, and the Fund’s policy for the timing of transfers between levels. The amendments are effective for financial statements issued for fiscal years beginning after December 15, 2019, and interim periods within those fiscal years. Management has evaluated the implications of certain provisions of the ASU and has determined to early adopt aspects related to the removal and modification of certain fair value measurement disclosures under the ASU effective immediately. At this time, management is evaluating the implications of certain other provisions of the ASU related to new disclosure requirements and any impact on the financial statement disclosures has not yet been determined.
| | | | |
| PGIM Jennison Equity Income Fund | | | 45 | |
Financial Highlights
| | | | | | | | | | | | | | | | | | | | |
| Class A Shares | |
| | | Year Ended October 31, | |
| | | 2018 | | | 2017 | | | 2016 | | | 2015 | | | 2014 | |
| Per Share Operating Performance(a): | | | | | | | | | | | | | | | | | | | | |
| Net Asset Value, Beginning of Year | | | $16.75 | | | | $14.68 | | | | $16.59 | | | | $17.88 | | | | $16.84 | |
| Income (loss) from investment operations: | | | | | | | | | | | | | | | | | | | | |
| Net investment income (loss) | | | 0.44 | | | | 0.34 | | | | 0.42 | | | | 0.40 | | | | 0.70 | |
| Net realized and unrealized gain (loss) on investment and foreign currency transactions | | | (0.01 | ) | | | 2.11 | | | | (0.66 | ) | | | (0.65 | ) | | | 1.77 | |
| Total from investment operations | | | 0.43 | | | | 2.45 | | | | (0.24 | ) | | | (0.25 | ) | | | 2.47 | |
| Less Dividends and Distributions: | | | | | | | | | | | | | | | | | | | | |
| Dividends from net investment income | | | (0.43 | ) | | | (0.38 | ) | | | (0.44 | ) | | | (0.34 | ) | | | (0.70 | ) |
| Distributions from net realized gains | | | (0.57 | ) | | | - | | | | (1.23 | ) | | | (0.70 | ) | | | (0.73 | ) |
| Total dividends and distributions | | | (1.00 | ) | | | (0.38 | ) | | | (1.67 | ) | | | (1.04 | ) | | | (1.43 | ) |
| Net asset value, end of year | | | $16.18 | | | | $16.75 | | | | $14.68 | | | | $16.59 | | | | $17.88 | |
| Total Return(b): | | | 2.45% | | | | 16.88% | | | | (1.00)% | | | | (1.53)% | | | | 15.36% | |
| |
| Ratios/Supplemental Data: | |
| Net assets, end of year (in millions) | | | $580 | | | | $680 | | | | $1,048 | | | | $1,585 | | | | $1,752 | |
| Average net assets (in millions) | | | $648 | | | | $809 | | | | $1,253 | | | | $1,745 | | | | $1,807 | |
| Ratios to average net assets(c): | | | | | | | | | | | | | | | | | | | | |
| Expenses after waivers and/or expense reimbursement | | | 1.15% | | | | 1.14% | | | | 1.16% | | | | 1.13% | | | | 1.13% | |
| Expenses before waivers and/or expense reimbursement | | | 1.20% | (d) | | | 1.19% | | | | 1.21% | | | | 1.18% | | | | 1.18% | |
| Net investment income (loss) | | | 2.58% | | | | 2.18% | | | | 2.84% | | | | 2.31% | | | | 4.04% | |
| Portfolio turnover rate(e) | | | 88% | | | | 75% | | | | 48% | | | | 76% | | | | 57% | |
| (a) | Calculated based on average shares outstanding during the year. |
| (b) | Total return does not consider the effects of sales loads. Total return is calculated assuming a purchase of a share on the first day and a sale on the last day of each year reported and includes reinvestment of dividends and distributions, if any. Total returns may reflect adjustments to conform to generally accepted accounting principles. |
| (c) | Does not include expenses of the underlying funds in which the Fund invests. |
| (d) | Effective November 1, 2017, class specific expenses include transfer agent fees and expenses and registration fees, which are charged to their respective share class. |
| (e) | The Fund’s portfolio turnover rate is calculated in accordance with regulatory requirements, without regard to transactions involving short term investments and certain derivatives. If such transactions were included, the Fund’s portfolio turnover rate may be higher. |
See Notes to Financial Statements.
| | | | | | | | | | | | | | | | | | | | |
| Class B Shares | |
| | | Year Ended October 31, | |
| | | 2018 | | | 2017 | | | 2016 | | | 2015 | | | 2014 | |
| Per Share Operating Performance(a): | | | | | | | | | | | | | | | | | | | | |
| Net Asset Value, Beginning of Year | | | $15.49 | | | | $13.61 | | | | $15.51 | | | | $16.79 | | | | $15.90 | |
| Income (loss) from investment operations: | | | | | | | | | | | | | | | | | | | | |
| Net investment income (loss) | | | 0.27 | | | | 0.21 | | | | 0.28 | | | | 0.25 | | | | 0.53 | |
| Net realized and unrealized gain (loss) on investment and foreign currency transactions | | | 0.01 | | | | 1.95 | | | | (0.61 | ) | | | (0.61 | ) | | | 1.67 | |
| Total from investment operations | | | 0.28 | | | | 2.16 | | | | (0.33 | ) | | | (0.36 | ) | | | 2.20 | |
| Less Dividends and Distributions: | | | | | | | | | | | | | | | | | | | | |
| Dividends from net investment income | | | (0.31 | ) | | | (0.28 | ) | | | (0.34 | ) | | | (0.22 | ) | | | (0.58 | ) |
| Distributions from net realized gains | | | (0.57 | ) | | | - | | | | (1.23 | ) | | | (0.70 | ) | | | (0.73 | ) |
| Total dividends and distributions | | | (0.88 | ) | | | (0.28 | ) | | | (1.57 | ) | | | (0.92 | ) | | | (1.31 | ) |
| Net asset value, end of year | | | $14.89 | | | | $15.49 | | | | $13.61 | | | | $15.51 | | | | $16.79 | |
| Total Return(b): | | | 1.68% | | | | 15.98% | | | | (1.73)% | | | | (2.28)% | | | | 14.52% | |
| |
| Ratios/Supplemental Data: | |
| Net assets, end of year (in millions) | | | $48 | | | | $85 | | | | $111 | | | | $147 | | | | $174 | |
| Average net assets (in millions) | | | $66 | | | | $100 | | | | $126 | | | | $165 | | | | $172 | |
| Ratios to average net assets(c): | | | | | | | | | | | | | | | | | | | | |
| Expenses after waivers and/or expense reimbursement | | | 1.95% | | | | 1.89% | | | | 1.91% | | | | 1.88% | | | | 1.88% | |
| Expenses before waivers and/or expense reimbursement | | | 1.95% | (d) | | | 1.89% | | | | 1.91% | | | | 1.88% | | | | 1.88% | |
| Net investment income (loss) | | | 1.70% | | | | 1.45% | | | | 2.04% | | | | 1.56% | | | | 3.25% | |
| Portfolio turnover rate(e) | | | 88% | | | | 75% | | | | 48% | | | | 76% | | | | 57% | |
| (a) | Calculated based on average shares outstanding during the year. |
| (b) | Total return does not consider the effects of sales loads. Total return is calculated assuming a purchase of a share on the first day and a sale on the last day of each year reported and includes reinvestment of dividends and distributions, if any. Total returns may reflect adjustments to conform to generally accepted accounting principles. |
| (c) | Does not include expenses of the underlying funds in which the Fund invests. |
| (d) | Effective November 1, 2017, class specific expenses include transfer agent fees and expenses and registration fees, which are charged to their respective share class. |
| (e) | The Fund’s portfolio turnover rate is calculated in accordance with regulatory requirements, without regard to transactions involving short term investments and certain derivatives. If such transactions were included, the Fund’s portfolio turnover rate may be higher. |
See Notes to Financial Statements.
| | | | |
| PGIM Jennison Equity Income Fund | | | 47 | |
Financial Highlights (continued)
| | | | | | | | | | | | | | | | | | | | |
| Class C Shares | |
| | | Year Ended October 31, | |
| | | 2018 | | | 2017 | | | 2016 | | | 2015 | | | 2014 | |
| Per Share Operating Performance(a): | | | | | | | | | | | | | | | | | | | | |
| Net Asset Value, Beginning of Year | | | $15.45 | | | | $13.57 | | | | $15.47 | | | | $16.75 | | | | $15.87 | |
| Income (loss) from investment operations: | | | | | | | | | | | | | | | | | | | | |
| Net investment income (loss) | | | 0.29 | | | | 0.21 | | | | 0.28 | | | | 0.25 | | | | 0.51 | |
| Net realized and unrealized gain (loss) on investment and foreign currency transactions | | | - | (b) | | | 1.95 | | | | (0.61 | ) | | | (0.61 | ) | | | 1.68 | |
| Total from investment operations | | | 0.29 | | | | 2.16 | | | | (0.33 | ) | | | (0.36 | ) | | | 2.19 | |
| Less Dividends and Distributions: | | | | | | | | | | | | | | | | | | | | |
| Dividends from net investment income | | | (0.33 | ) | | | (0.28 | ) | | | (0.34 | ) | | | (0.22 | ) | | | (0.58 | ) |
| Distributions from net realized gains | | | (0.57 | ) | | | - | | | | (1.23 | ) | | | (0.70 | ) | | | (0.73 | ) |
| Total dividends and distributions | | | (0.90 | ) | | | (0.28 | ) | | | (1.57 | ) | | | (0.92 | ) | | | (1.31 | ) |
| Net asset value, end of year | | | $14.84 | | | | $15.45 | | | | $13.57 | | | | $15.47 | | | | $16.75 | |
| Total Return(c): | | | 1.70% | | | | 16.03% | | | | (1.73)% | | | | (2.29)% | | | | 14.48% | |
| |
| Ratios/Supplemental Data: | |
| Net assets, end of year (in millions) | | | $505 | | | | $658 | | | | $923 | | | | $1,285 | | | | $1,302 | |
| Average net assets (in millions) | | | $597 | | | | $786 | | | | $1,075 | | | | $1,353 | | | | $1,196 | |
| Ratios to average net assets(d): | | | | | | | | | | | | | | | | | | | | |
| Expenses after waivers and/or expense reimbursement | | | 1.87% | | | | 1.89% | | | | 1.91% | | | | 1.88% | | | | 1.88% | |
| Expenses before waivers and/or expense reimbursement | | | 1.87% | (e) | | | 1.89% | | | | 1.91% | | | | 1.88% | | | | 1.88% | |
| Net investment income (loss) | | | 1.84% | | | | 1.45% | | | | 2.06% | | | | 1.56% | | | | 3.16% | |
| Portfolio turnover rate(f) | | | 88% | | | | 75% | | | | 48% | | | | 76% | | | | 57% | |
| (a) | Calculated based on average shares outstanding during the year. (b) Less than $0.005 per share. |
| (c) | Total return does not consider the effects of sales loads. Total return is calculated assuming a purchase of a share on the first day and a sale on the last day of each year reported and includes reinvestment of dividends and distributions, if any. Total returns may reflect adjustments to conform to generally accepted accounting principles. |
| (d) | Does not include expenses of the underlying funds in which the Fund invests. |
| (e) | Effective November 1, 2017, class specific expenses include transfer agent fees and expenses and registration fees, which are charged to their respective share class. |
| (f) | The Fund’s portfolio turnover rate is calculated in accordance with regulatory requirements, without regard to transactions involving short term investments and certain derivatives. If such transactions were included, the Fund’s portfolio turnover rate may be higher. |
See Notes to Financial Statements.
| | | | | | | | | | | | | | | | | | | | |
| Class R Shares | |
| | | Year Ended October 31, | |
| | | 2018 | | | 2017 | | | 2016 | | | 2015 | | | 2014 | |
| Per Share Operating Performance(a): | | | | | | | | | | | | | | | | | | | | |
| Net Asset Value, Beginning of Year | | | $16.75 | | | | $14.68 | | | | $16.58 | | | | $17.88 | | | | $16.84 | |
| Income (loss) from investment operations: | | | | | | | | | | | | | | | | | | | | |
| Net investment income (loss) | | | 0.38 | | | | 0.31 | | | | 0.37 | | | | 0.36 | | | | 0.59 | |
| Net realized and unrealized gain (loss) on investment and foreign currency transactions | | | - | (b) | | | 2.10 | | | | (0.64 | ) | | | (0.67 | ) | | | 1.84 | |
| Total from investment operations | | | 0.38 | | | | 2.41 | | | | (0.27 | ) | | | (0.31 | ) | | | 2.43 | |
| Less Dividends and Distributions: | | | | | | | | | | | | | | | | | | | | |
| Dividends from net investment income | | | (0.38 | ) | | | (0.34 | ) | | | (0.40 | ) | | | (0.29 | ) | | | (0.66 | ) |
| Distributions from net realized gains | | | (0.57 | ) | | | - | | | | (1.23 | ) | | | (0.70 | ) | | | (0.73 | ) |
| Total dividends and distributions | | | (0.95 | ) | | | (0.34 | ) | | | (1.63 | ) | | | (0.99 | ) | | | (1.39 | ) |
| Net asset value, end of year | | | $16.18 | | | | $16.75 | | | | $14.68 | | | | $16.58 | | | | $17.88 | |
| Total Return(c): | | | 2.12% | | | | 16.59% | | | | (1.19)% | | | | (1.83)% | | | | 15.08% | |
| |
| Ratios/Supplemental Data: | |
| Net assets, end of year (in millions) | | | $28 | | | | $37 | | | | $40 | | | | $44 | | | | $40 | |
| Average net assets (in millions) | | | $33 | | | | $40 | | | | $42 | | | | $45 | | | | $33 | |
| Ratios to average net assets(d): | | | | | | | | | | | | | | | | | | | | |
| Expenses after waivers and/or expense reimbursement | | | 1.48% | | | | 1.39% | | | | 1.41% | | | | 1.38% | | | | 1.38% | |
| Expenses before waivers and/or expense reimbursement | | | 1.73% | (e) | | | 1.64% | | | | 1.66% | | | | 1.63% | | | | 1.63% | |
| Net investment income (loss) | | | 2.24% | | | | 1.95% | | | | 2.48% | | | | 2.07% | | | | 3.40% | |
| Portfolio turnover rate(f) | | | 88% | | | | 75% | | | | 48% | | | | 76% | | | | 57% | |
| (a) | Calculated based on average shares outstanding during the year. (b) Less than $0.005 per share. |
| (c) | Total return is calculated assuming a purchase of a share on the first day and a sale on the last day of each year reported and includes reinvestment of dividends and distributions, if any. Total returns may reflect adjustments to conform to generally accepted accounting principles. |
| (d) | Does not include expenses of the underlying funds in which the Fund invests. |
| (e) | Effective November 1, 2017, class specific expenses include transfer agent fees and expenses and registration fees, which are charged to their respective share class. |
| (f) | The Fund’s portfolio turnover rate is calculated in accordance with regulatory requirements, without regard to transactions involving short term investments and certain derivatives. If such transactions were included, the Fund’s portfolio turnover rate may be higher. |
See Notes to Financial Statements.
| | | | |
| PGIM Jennison Equity Income Fund | | | 49 | |
Financial Highlights (continued)
| | | | | | | | | | | | | | | | | | | | |
| Class Z Shares | |
| | | Year Ended October 31, | |
| | | 2018 | | | 2017 | | | 2016 | | | 2015 | | | 2014 | |
| Per Share Operating Performance(a): | | | | | | | | | | | | | | | | | | | | |
| Net Asset Value, Beginning of Year | | | $16.74 | | | | $14.67 | | | | $16.58 | | | | $17.88 | | | | $16.84 | |
| Income (loss) from investment operations: | | | | | | | | | | | | | | | | | | | | |
| Net investment income (loss) | | | 0.48 | | | | 0.38 | | | | 0.46 | | | | 0.44 | | | | 0.69 | |
| Net realized and unrealized gain (loss) on investment and foreign currency transactions | | | 0.01 | | | | 2.11 | | | | (0.66 | ) | | | (0.66 | ) | | | 1.82 | |
| Total from investment operations | | | 0.49 | | | | 2.49 | | | | (0.20 | ) | | | (0.22 | ) | | | 2.51 | |
| Less Dividends and Distributions: | | | | | | | | | | | | | | | | | | | | |
| Dividends from net investment income | | | (0.48 | ) | | | (0.42 | ) | | | (0.48 | ) | | | (0.38 | ) | | | (0.74 | ) |
| Distributions from net realized gains | | | (0.57 | ) | | | - | | | | (1.23 | ) | | | (0.70 | ) | | | (0.73 | ) |
| Total dividends and distributions | | | (1.05 | ) | | | (0.42 | ) | | | (1.71 | ) | | | (1.08 | ) | | | (1.47 | ) |
| Net asset value, end of year | | | $16.18 | | | | $16.74 | | | | $14.67 | | | | $16.58 | | | | $17.88 | |
| Total Return(b): | | | 2.79% | | | | 17.18% | | | | (0.75)% | | | | (1.33)% | | | | 15.65% | |
| |
| Ratios/Supplemental Data: | |
| Net assets, end of year (in millions) | | | $452 | | | | $566 | | | | $1,229 | | | | $1,628 | | | | $1,778 | |
| Average net assets (in millions) | | | $507 | | | | $861 | | | | $1,338 | | | | $1,780 | | | | $1,457 | |
| Ratios to average net assets(c): | | | | | | | | | | | | | | | | | | | | |
| Expenses after waivers and/or expense reimbursement | | | 0.88% | | | | 0.90% | | | | 0.91% | | | | 0.88% | | | | 0.88% | |
| Expenses before waivers and/or expense reimbursement | | | 0.88% | (d) | | | 0.90% | | | | 0.91% | | | | 0.88% | | | | 0.88% | |
| Net investment income (loss) | | | 2.82% | | | | 2.46% | | | | 3.08% | | | | 2.56% | | | | 4.00% | |
| Portfolio turnover rate(e) | | | 88% | | | | 75% | | | | 48% | | | | 76% | | | | 57% | |
| (a) | Calculated based on average shares outstanding during the year. |
| (b) | Total return is calculated assuming a purchase of a share on the first day and a sale on the last day of each year reported and includes reinvestment of dividends and distributions, if any. Total returns may reflect adjustments to conform to generally accepted accounting principles. |
| (c) | Does not include expenses of the underlying funds in which the Fund invests. |
| (d) | Effective November 1, 2017, class specific expenses include transfer agent fees and expenses and registration fees, which are charged to their respective share class. |
| (e) | The Fund’s portfolio turnover rate is calculated in accordance with regulatory requirements, without regard to transactions involving short term investments and certain derivatives. If such transactions were included, the Fund’s portfolio turnover rate may be higher. |
See Notes to Financial Statements.
| | | | | | | | | | | | | | | | | | | | |
| Class R6 Shares | |
| | | Year Ended October 31, | |
| | | 2018 | | | 2017 | | | 2016 | | | 2015 | | | 2014 | |
| Per Share Operating Performance(a): | | | | | | | | | | | | | | | | | | | | |
| Net Asset Value, Beginning of Year | | | $16.77 | | | | $14.69 | | | | $16.60 | | | | $17.90 | | | | $16.85 | |
| Income (loss) from investment operations: | | | | | | | | | | | | | | | | | | | | |
| Net investment income (loss) | | | 0.52 | | | | 0.42 | | | | 0.51 | | | | 0.47 | | | | 0.74 | |
| Net realized and unrealized gain (loss) on investment and foreign currency transactions | | | (0.03 | ) | | | 2.09 | | | | (0.69 | ) | | | (0.67 | ) | | | 1.80 | |
| Total from investment operations | | | 0.49 | | | | 2.51 | | | | (0.18 | ) | | | (0.20 | ) | | | 2.54 | |
| Less Dividends and Distributions: | | | | | | | | | | | | | | | | | | | | |
| Dividends from net investment income | | | (0.49 | ) | | | (0.43 | ) | | | (0.50 | ) | | | (0.40 | ) | | | (0.76 | ) |
| Distributions from net realized gains | | | (0.57 | ) | | | - | | | | (1.23 | ) | | | (0.70 | ) | | | (0.73 | ) |
| Total dividends and distributions | | | (1.06 | ) | | | (0.43 | ) | | | (1.73 | ) | | | (1.10 | ) | | | (1.49 | ) |
| Net asset value, end of year | | | $16.20 | | | | $16.77 | | | | $14.69 | | | | $16.60 | | | | $17.90 | |
| Total Return(b): | | | 2.81% | | | | 17.32% | | | | (0.62)% | | | | (1.23)% | | | | 15.81% | |
| |
| Ratios/Supplemental Data: | |
| Net assets, end of year (in millions) | | | $4 | | | | $3 | | | | $8 | | | | $27 | | | | $6 | |
| Average net assets (in millions) | | | $4 | | | | $4 | | | | $20 | | | | $16 | | | | $3 | |
| Ratios to average net assets(c): | | | | | | | | | | | | | | | | | | | | |
| Expenses after waivers and/or expense reimbursement | | | 0.80% | | | | 0.80% | | | | 0.79% | | | | 0.78% | | | | 0.78% | |
| Expenses before waivers and/or expense reimbursement | | | 1.19% | (d) | | | 0.80% | | | | 0.79% | | | | 0.78% | | | | 0.78% | |
| Net investment income (loss) | | | 3.08% | | | | 2.68% | | | | 3.43% | | | | 2.77% | | | | 4.30% | |
| Portfolio turnover rate(e) | | | 88% | | | | 75% | | | | 48% | | | | 76% | | | | 57% | |
| (a) | Calculated based on average shares outstanding during the year. |
| (b) | Total return is calculated assuming a purchase of a share on the first day and a sale on the last day of each year reported and includes reinvestment of dividends and distributions, if any. Total returns may reflect adjustments to conform to generally accepted accounting principles. |
| (c) | Does not include expenses of the underlying funds in which the Fund invests. |
| (d) | Effective November 1, 2017, class specific expenses include transfer agent fees and expenses and registration fees, which are charged to their respective share class. |
| (e) | The Fund’s portfolio turnover rate is calculated in accordance with regulatory requirements, without regard to transactions involving short term investments and certain derivatives. If such transactions were included, the Fund’s portfolio turnover rate may be higher. |
See Notes to Financial Statements.
| | | | |
| PGIM Jennison Equity Income Fund | | | 51 | |
Report of Independent Registered Public Accounting Firm
The Board of Directors and Shareholders
Prudential Investment Portfolios, Inc. 10:
Opinion on the Financial Statements
We have audited the accompanying statement of assets and liabilities of PGIM Jennison Equity Income Fund (formerly Prudential Jennison Equity Income Fund) (the “Fund”), a series of Prudential Investment Portfolios, Inc. 10, including the schedule of investments, as of October 31, 2018, the related statement of operations for the year then ended, the statements of changes in net assets for each of the years in the two-year period then ended, and the related notes (collectively, the financial statements) and the financial highlights for the years indicated therein. In our opinion, the financial statements and financial highlights present fairly, in all material respects, the financial position of the Fund as of October 31, 2018, the results of its operations for the year then ended, the changes in its net assets for each of the years in the two-year period then ended, and the financial highlights for the years indicated therein, in conformity with U.S. generally accepted accounting principles.
Basis for Opinion
These financial statements and financial highlights are the responsibility of the Fund’s management. Our responsibility is to express an opinion on these financial statements and financial highlights based on our audits. We are a public accounting firm registered with the Public Company Accounting Oversight Board (United States) (“PCAOB”) and are required to be independent with respect to the Fund in accordance with the U.S. federal securities laws and the applicable rules and regulations of the Securities and Exchange Commission and the PCAOB.
We conducted our audits in accordance with the standards of the PCAOB. Those standards require that we plan and perform the audit to obtain reasonable assurance about whether the financial statements and financial highlights are free of material misstatement, whether due to error or fraud. Our audits included performing procedures to assess the risks of material misstatement of the financial statements and financial highlights, whether due to error or fraud, and performing procedures that respond to those risks. Such procedures included examining, on a test basis, evidence regarding the amounts and disclosures in the financial statements and financial highlights. Such procedures also included confirmation of securities owned as of October 31, 2018, by correspondence with the custodians, transfer agents and brokers or by other appropriate auditing procedures when replies from brokers were not received. Our audits also included evaluating the accounting principles used and significant estimates made by management, as well as evaluating the overall presentation of the financial statements and financial highlights. We believe that our audits provide a reasonable basis for our opinion.

We have served as the auditor of one or more PGIM and/or Prudential Retail investment companies since 2003.
New York, New York
December 17, 2018
Federal Income Tax Information (unaudited)
We are advising you that during the fiscal year ended October 31, 2018, the Fund reports the maximum amount allowed per share but not less than $0.57 for Class A, B, C, R, Z and R6 shares as a capital gain distribution in accordance with Section 852(b)(3)(C) of the Internal Revenue Code.
For the year ended October 31, 2018, the Fund reports the maximum amount allowable under Section 854 of the Internal Revenue Code, but not less than, the following percentages of the ordinary income dividends paid as: 1) qualified dividend income (QDI); 2) eligible for corporate dividend received deduction (DRD):
| | | | | | | | |
| | | QDI | | | DRD | |
PGIM Jennison Equity Income Fund | | | 100.00 | % | | | 100.00 | % |
In January 2019 you will be advised on IRS Form 1099-DIV or substitute 1099-DIV as to the federal tax status of the dividends and distributions received by you in calendar year 2018.
| | | | |
| PGIM Jennison Equity Income Fund | | | 53 | |
INFORMATION ABOUT BOARD MEMBERS AND OFFICERS (unaudited)
Information about Board Members and Officers of the Fund is set forth below. Board Members who are not deemed to be “interested persons” of the Fund, as defined in the 1940 Act, are referred to as “Independent Board Members.” Board Members who are deemed to be “interested persons” of the Fund are referred to as “Interested Board Members.” The Board Members are responsible for the overall supervision of the operations of the Fund and perform the various duties imposed on the directors of investment companies by the 1940 Act. The Board in turn elects the Officers, who are responsible for administering the day-to-day operations of the Fund.
| | | | | | |
| Independent Board Members | | | | |
| | | | |
Name, Address, Age Position(s) Portfolios Overseen | | Principal Occupation(s) During Past Five Years | | Other Directorships Held During Past Five Years | | Length of Board Service |
| | | | |
Ellen S. Alberding (60) Board Member Portfolios Overseen: 93 | | President and Board Member, The Joyce Foundation (charitable foundation) (since 2002); Vice Chair, City Colleges of Chicago (community college system) (2011-2015); Trustee, National Park Foundation (charitable foundation for national park system) (2009-2018); Trustee, Economic Club of Chicago (since 2009); Trustee, Loyola University (since 2018). | | None. | | Since September 2013 |
| | | | |
Kevin J. Bannon (66) Board Member Portfolios Overseen: 93 | | Retired; Managing Director (April 2008-May 2015) and Chief Investment Officer (October 2008-November 2013) of Highmount Capital LLC (registered investment adviser); formerly Executive Vice President and Chief Investment Officer (April 1993-August 2007) of Bank of New York Company; President (May 2003-May 2007) of BNY Hamilton Family of Mutual Funds. | | Director of Urstadt Biddle Properties (equity real estate investment trust) (since September 2008). | | Since July 2008 |
| | | | |
Linda W. Bynoe (66) Board Member Portfolios Overseen: 93 | | President and Chief Executive Officer (since March 1995) and formerly Chief Operating Officer (December 1989-February 1995) of Telemat Ltd. (management consulting); formerly Vice President (January 1985-June 1989) at Morgan Stanley & Co. (broker-dealer). | | Director of Anixter International, Inc. (communication products distributor) (since January 2006); Director of Northern Trust Corporation (financial services) (since April 2006); Trustee of Equity Residential (residential real estate) (since December 2009). | | Since March 2005 |
PGIM Jennison Equity Income Fund
| | | | | | |
Independent Board Members | | | | |
| | | | |
Name, Address, Age Position(s) Portfolios Overseen | | Principal Occupation(s) During Past Five Years | | Other Directorships Held During Past Five Years | | Length of Board Service |
| | | | |
Barry H. Evans (58) Board Member Portfolios Overseen: 92 | | Retired; formerly President (2005 – 2016), Global Chief Operating Officer (2014– 2016), Chief Investment Officer – Global Head of Fixed Income (1998-2014), and various portfolio manager roles (1986-2006), Manulife Asset Management U.S. | | Director, Manulife Trust Company (since 2011); formerly Director, Manulife Asset Management Limited (2015-2017); formerly Chairman of the Board of Directors of Manulife Asset Management U.S. (2005-2016); formerly Chairman of the Board, Declaration Investment Management and Research (2008-2016). | | Since September 2017 |
| | | | |
Keith F. Hartstein (62) Board Member & Independent Chair Portfolios Overseen: 93 | | Retired; Member (since November 2014) of the Governing Council of the Independent Directors Council (organization of independent mutual fund directors); formerly President and Chief Executive Officer (2005-2012), Senior Vice President (2004-2005), Senior Vice President of Sales and Marketing (1997-2004), and various executive management positions (1990-1997), John Hancock Funds, LLC (asset management); Chairman, Investment Company Institute’s Sales Force Marketing Committee (2003-2008). | | None. | | Since September 2013 |
Visit our website at pgiminvestments.com
| | | | | | |
| Independent Board Members | | | | |
| | | | |
Name, Address, Age Position(s) Portfolios Overseen | | Principal Occupation(s) During Past Five Years | | Other Directorships Held During Past Five Years | | Length of Board Service |
| | | | |
Laurie Simon Hodrick (56) Board Member Portfolios Overseen: 92 | | A. Barton Hepburn Professor Emerita of Economics in the Faculty of Business, Columbia Business School (since 2018); Visiting Professor of Law, Stanford Law School (since 2015); Visiting Fellow at the Hoover Institution, Stanford University (since 2015); Sole Member, ReidCourt LLC (since 2008) (a consulting firm); formerly A. Barton Hepburn Professor of Economics in the Faculty of Business, Columbia Business School (1996-2017); formerly Managing Director, Global Head of Alternative Investment Strategies, Deutsche Bank (2006-2008). | | Independent Director, Corporate Capital Trust (since April 2017) (a business development company); Independent Director, Kabbage, Inc. (since July 2018) (financial services). | | Since September 2017 |
| | | | |
Michael S. Hyland, CFA (73) Board Member Portfolios Overseen: 93 | | Retired (since February 2005); formerly Senior Managing Director (July 2001-February 2005) of Bear Stearns & Co, Inc.; Global Partner, INVESCO (1999-2001); Managing Director and President of Salomon Brothers Asset Management (1989-1999). | | None. | | Since July 2008 |
| | | | |
Richard A. Redeker (75) Board Member Portfolios Overseen: 93 | | Retired Mutual Fund Senior Executive (50 years); Management Consultant; Director, Mutual Fund Directors Forum (since 2014); Independent Directors Council (organization of independent mutual fund directors)-Executive Committee, Chair of Policy Steering Committee, Governing Council. | | None. | | Since October 1993 |
PGIM Jennison Equity Income Fund
| | | | | | |
| Independent Board Members | | | | |
| | | | |
Name, Address, Age Position(s) Portfolios Overseen | | Principal Occupation(s) During Past Five Years | | Other Directorships Held During Past Five Years | | Length of Board Service |
| | | | |
Brian K. Reid (56)# Board Member Portfolios Overseen: 92 | | Retired; formerly Chief Economist for the Investment Company Institute (ICI) (2005-2017); formerly Senior Economist and Director of Industry and Financial Analysis at the ICI (1998-2004); formerly Senior Economist, Industry and Financial Analysis at the ICI (1996-1998); formerly Staff Economist at the Federal Reserve Board (1989-1996); Director, ICI Mutual Insurance Company (2012-2017). | | None. | | Since March 2018 |
| # | Mr. Reid joined the Board effective as of March 1, 2018. |
| | | | | | |
| Interested Board Members | | | | |
| | | | |
Name, Address, Age Position(s) Portfolios Overseen | | Principal Occupation(s) During Past Five Years | | Other Directorships Held During Past Five Years | | Length of
Board Service |
| | | | |
Stuart S. Parker (56) Board Member & President Portfolios Overseen: 93 | | President of PGIM Investments LLC (formerly known as Prudential Investments LLC) (since January 2012); Executive Vice President of Prudential Investment Management Services LLC (since December 2012); formerly Executive Vice President of Jennison Associates LLC and Head of Retail Distribution of PGIM Investments LLC (June 2005-December 2011). | | None. | | Since January 2012 |
Visit our website at pgiminvestments.com
| | | | | | |
| Interested Board Members | | | | |
| | | | |
Name, Address, Age Position(s) Portfolios Overseen | | Principal Occupation(s) During Past Five Years | | Other Directorships Held During Past Five Years | | Length of Board Service |
| | | | |
Scott E. Benjamin (45) Board Member & Vice President Portfolios Overseen:93 | | Executive Vice President (since June 2009) of PGIM Investments LLC; Executive Vice President (June 2009-June 2012) and Vice President (since June 2012) of Prudential Investment Management Services LLC; Executive Vice President (since September 2009) of AST Investment Services, Inc.; Senior Vice President of Product Development and Marketing, PGIM Investments (since February 2006); formerly Vice President of Product Development and Product Management, PGIM Investments LLC (2003-2006). | | None. | | Since March 2010 |
| | | | |
Grace C. Torres* (59) Board Member Portfolios Overseen: 92 | | Retired; formerly Treasurer and Principal Financial and Accounting Officer of the PGIM Funds, Target Funds, Advanced Series Trust, Prudential Variable Contract Accounts and The Prudential Series Fund (1998-June 2014); Assistant Treasurer (March 1999-June 2014) and Senior Vice President (September 1999-June 2014) of PGIM Investments LLC; Assistant Treasurer (May 2003-June 2014) and Vice President (June 2005-June 2014) of AST Investment Services, Inc.; Senior Vice President and Assistant Treasurer (May 2003-June 2014) of Prudential Annuities Advisory Services, Inc. | | Formerly Director (July 2015-January 2018) of Sun Bancorp, Inc. N.A. and Sun National Bank; Director (since January 2018) of OceanFirst Financial Corp. and OceanFirst Bank. | | Since November 2014 |
* Note: Prior to her retirement in 2014, Ms. Torres was employed by PGIM Investments LLC. Due to her prior employment, she is considered to be an “interested person” under the 1940 Act. Ms. Torres is a Non-Management Interested Board Member.
PGIM Jennison Equity Income Fund
| | | | |
| Fund Officers(a) | | | | |
| | | |
Name, Address and Age Position with Fund | | Principal Occupation(s) During Past Five Years | | Length of Service as Fund Officer |
| | | |
Raymond A. O’Hara (63) Chief Legal Officer | | Vice President and Corporate Counsel (since July 2010) of Prudential Insurance Company of America (Prudential); Vice President (March 2011-Present) of Pruco Life Insurance Company and Pruco Life Insurance Company of New Jersey; Vice President and Corporate Counsel (March 2011-Present) of Prudential Annuities Life Assurance Corporation; Chief Legal Officer of PGIM Investments LLC (since June 2012); Chief Legal Officer of Prudential Mutual Fund Services LLC (since June 2012) and Corporate Counsel of AST Investment Services, Inc. (since June 2012); formerly Assistant Vice President and Corporate Counsel (September 2008-July 2010) of The Hartford Financial Services Group, Inc.; formerly Associate (September 1980-December 1987) and Partner (January 1988–August 2008) of Blazzard & Hasenauer, P.C. (formerly, Blazzard, Grodd & Hasenauer, P.C.). | | Since June 2012 |
| | | |
Chad A. Earnst (43) Chief Compliance Officer | | Chief Compliance Officer (September 2014-Present) of PGIM Investments LLC; Chief Compliance Officer (September 2014-Present) of the PGIM Funds, Target Funds, Advanced Series Trust, The Prudential Series Fund, Prudential’s Gibraltar Fund, Inc., PGIM Global Short Duration High Yield Income Fund, Inc., PGIM Short Duration High Yield Fund, Inc. and PGIM Jennison MLP Income Fund, Inc.; formerly Assistant Director (March 2010-August 2014) of the Asset Management Unit, Division of Enforcement, US Securities & Exchange Commission; Assistant Regional Director (January 2010-August 2014), Branch Chief (June 2006–December 2009) and Senior Counsel (April 2003-May 2006) of the Miami Regional Office, Division of Enforcement, US Securities & Exchange Commission. | | Since September 2014 |
| | | |
Dino Capasso (44) Deputy Chief Compliance Officer | | Vice President and Deputy Chief Compliance Officer (June 2017-Present) of PGIM Investments LLC; formerly, Senior Vice President and Senior Counsel (January 2016-June 2017), and Vice President and Counsel (February 2012-December 2015) of Pacific Investment Management Company LLC. | | Since March 2018 |
| | | |
Andrew R. French (56) Secretary | | Vice President and Corporate Counsel (since February 2010) of Prudential; formerly Director and Corporate Counsel (2006-2010) of Prudential; Vice President and Assistant Secretary (since January 2007) of PGIM Investments LLC; Vice President and Assistant Secretary (since January 2007) of Prudential Mutual Fund Services LLC. | | Since October 2006 |
Visit our website at pgiminvestments.com
| | | | |
| Fund Officers(a) | | | | |
| | | |
Name, Address and Age Position with Fund | | Principal Occupation(s) During Past Five Years | | Length of Service as Fund Officer |
| | | |
Jonathan D. Shain (60) Assistant Secretary | | Vice President and Corporate Counsel (since August 1998) of Prudential; Vice President and Assistant Secretary (since May 2001) of PGIM Investments LLC; Vice President and Assistant Secretary (since February 2001) of Prudential Mutual Fund Services LLC; formerly Vice President and Assistant Secretary (May 2003-June 2005) of AST Investment Services, Inc. | | Since May 2005 |
| | | |
Claudia DiGiacomo (44) Assistant Secretary | | Vice President and Corporate Counsel (since January 2005) of Prudential; Vice President and Assistant Secretary of PGIM Investments LLC (since December 2005); formerly Associate at Sidley Austin Brown & Wood LLP (1999-2004). | | Since December 2005 |
| | | |
Charles H. Smith (45) Anti-Money Laundering Compliance Officer | | Vice President, Corporate Compliance, Anti-Money Laundering Unit (since January 2015) of Prudential; committee member of the American Council of Life Insurers Anti-Money Laundering and Critical Infrastructure Committee (since January 2016); formerly Global Head of Economic Sanctions Compliance at AIG Property Casualty (February 2007 – December 2014); Assistant Attorney General at the New York State Attorney General’s Office, Division of Public Advocacy. (August 1998 —January 2007). | | Since January 2017 |
| | | |
Brian D. Nee (52) Treasurer and Principal Financial and Accounting Officer | | Vice President and Head of Finance of PGIM Investments LLC (since August 2015) and PGIM Global Partners (since February 2017); formerly, Vice President, Treasurer’s Department of Prudential (September 2007-August 2015). | | Since July 2018 |
| | | |
Peter Parrella (60) Assistant Treasurer | | Vice President (since 2007) and Director (2004-2007) within Prudential Mutual Fund Administration; formerly Tax Manager at SSB Citi Fund Management LLC (1997-2004). | | Since June 2007 |
| | | |
Lana Lomuti (51) Assistant Treasurer | | Vice President (since 2007) and Director (2005-2007), within Prudential Mutual Fund Administration; formerly Assistant Treasurer (December 2007-February 2014) of The Greater China Fund, Inc. | | Since April 2014 |
| | | |
Linda McMullin (57) Assistant Treasurer | | Vice President (since 2011) and Director (2008-2011) within Prudential Mutual Fund Administration. | | Since April 2014 |
| | | |
Kelly A. Coyne (50) Assistant Treasurer | | Director, Investment Operations of Prudential Mutual Fund Services LLC (since 2010). | | Since March 2015 |
(a) Excludes Mr. Parker and Mr. Benjamin, interested Board Members who also serve as President and Vice President, respectively.
Explanatory Notes to Tables:
| ∎ | | Board Members are deemed to be “Interested,” as defined in the 1940 Act, by reason of their affiliation with PGIM Investments LLC and/or an affiliate of PGIM Investments LLC. |
| ∎ | | Unless otherwise noted, the address of all Board Members and Officers is c/o PGIM Investments LLC, 655 Broad Street, Newark, New Jersey 07102-4410. |
| ∎ | | There is no set term of office for Board Members or Officers. The Board Members have adopted a retirement policy, which calls for the retirement of Board Members on December 31 of the year in which they reach the age of 75. |
PGIM Jennison Equity Income Fund
| ∎ | | “Other Directorships Held” includes only directorships of companies required to register or file reports with the SEC under the 1934 Act (that is, “public companies”) or other investment companies registered under the 1940 Act. |
| ∎ | | “Portfolios Overseen” includes all investment companies managed by PGIM Investments LLC. The investment companies for which PGIM Investments LLC serves as manager include the PGIM Funds, The Prudential Variable Contract Accounts, PGIM ETF Trust, PGIM Short Duration High Yield Fund, Inc., PGIM Global Short Duration High Yield Fund, Inc., The Prudential Series Fund, Prudential’s Gibraltar Fund, Inc. and the Advanced Series Trust. |
Visit our website at pgiminvestments.com
Approval of Advisory Agreements (unaudited)
The Fund’s Board of Directors
The Board of Directors (the “Board”) of PGIM Jennison Equity Income Fund (the “Fund”)1 consists of twelve individuals, nine of whom are not “interested persons” of the Fund, as defined in the Investment Company Act of 1940, as amended (the “1940 Act”) (the “Independent Directors”). The Board is responsible for the oversight of the Fund and its operations, and performs the various duties imposed on the directors of investment companies by the 1940 Act. The Independent Directors have retained independent legal counsel to assist them in connection with their duties. The Chair of the Board is an Independent Director. The Board has established four standing committees: the Audit Committee, the Nominating and Governance Committee, and two Investment Committees. Each committee is chaired by, and composed of, Independent Directors.
Annual Approval of the Fund’s Advisory Agreements
As required under the 1940 Act, the Board determines annually whether to renew the Fund’s management agreement with PGIM Investments LLC (“PGIM Investments”) and the Fund’s subadvisory agreement with Jennison Associates LLC (“Jennison”). In considering the renewal of the agreements, the Board, including all of the Independent Directors, met on June 7, 2018 and on June 19-21, 2018 and approved the renewal of the agreements through July 31, 2019 after concluding that the renewal of the agreements was in the best interests of the Fund and its shareholders.
In advance of the meetings, the Board requested and received materials relating to the agreements, and had the opportunity to ask questions and request further information in connection with its consideration. Among other things, the Board considered comparative fee information from PGIM Investments and Jennison. Also, the Board considered comparisons with other mutual funds in relevant Peer Universes and Peer Groups, as is further discussed below.
In approving the agreements, the Board, including the Independent Directors advised by independent legal counsel, considered the factors it deemed relevant, including the nature, quality and extent of services provided by PGIM Investments and the subadviser, the performance of the Fund, the profitability of PGIM Investments and its affiliates, expenses and fees, and the potential for economies of scale that may be shared with the Fund and its shareholders as the Fund’s assets grow. In their deliberations, the Directors did not identify any single factor which alone was responsible for the Board’s decision to approve the agreements with respect to the Fund. In connection with its deliberations, the Board considered information provided by PGIM Investments throughout the year at regular Board
| 1 | PGIM Jennison Equity Income Fund is a series of Prudential Investment Portfolios, Inc. 10. |
| | |
| PGIM Jennison Equity Income Fund |
Approval of Advisory Agreements (continued)
meetings, presentations from portfolio managers and other information, as well as information furnished at or in advance of the meetings on June 7, 2018 and on June 19-21, 2018.
The Directors determined that the overall arrangements between the Fund and PGIM Investments, which serves as the Fund’s investment manager pursuant to a management agreement, and between PGIM Investments and Jennison, which serves as the Fund’s subadviser pursuant to the terms of a subadvisory agreement with PGIM Investments, are in the best interests of the Fund and its shareholders in light of the services performed, fees charged and such other matters as the Directors considered relevant in the exercise of their business judgment.
The material factors and conclusions that formed the basis for the Directors’ reaching their determinations to approve the continuance of the agreements are separately discussed below.
Nature, Quality and Extent of Services
The Board received and considered information regarding the nature, quality and extent of services provided to the Fund by PGIM Investments and Jennison. The Board considered the services provided by PGIM Investments, including but not limited to the oversight of the subadviser for the Fund, as well as the provision of fund recordkeeping, compliance, and other services to the Fund. With respect to PGIM Investments’ oversight of the subadviser, the Board noted that PGIM Investments’ Strategic Investment Research Group (“SIRG”), which is a business unit of PGIM Investments, is responsible for monitoring and reporting to PGIM Investments’ senior management on the performance and operations of the subadviser. The Board also considered that PGIM Investments pays the salaries of all of the officers and interested Directors of the Fund who are part of Fund management. The Board also considered the investment subadvisory services provided by Jennison, including investment research and security selection, as well as adherence to the Fund’s investment restrictions and compliance with applicable Fund policies and procedures. The Board considered PGIM Investments’ evaluation of the subadviser, as well as PGIM Investments’ recommendation, based on its review of the subadviser, to renew the subadvisory agreement.
The Board considered the qualifications, backgrounds and responsibilities of PGIM Investments’ senior management responsible for the oversight of the Fund and Jennison, and also considered the qualifications, backgrounds and responsibilities of the Jennison portfolio managers who are responsible for the day-to-day management of the Fund’s portfolio. The Board was provided with information pertaining to PGIM Investments’ and Jennison’s organizational structure, senior management, investment operations, and other relevant information pertaining to PGIM Investments and Jennison. The Board also noted that it received favorable compliance reports from the Fund’s Chief Compliance Officer (“CCO”) as to each of PGIM Investments and Jennison. The Board noted that Jennison is affiliated with PGIM Investments.
| | |
| Visit our website at pgiminvestments.com | | |
The Board concluded that it was satisfied with the nature, extent and quality of the investment management services provided by PGIM Investments and the subadvisory services provided to the Fund by Jennison, and that there was a reasonable basis on which to conclude that the Fund benefits from the services provided by PGIM Investments and Jennison under the management and subadvisory agreements.
Costs of Services and Profits Realized by PGIM Investments
The Board was provided with information on the profitability of PGIM Investments and its affiliates in serving as the Fund’s investment manager. The Board discussed with PGIM Investments the methodology utilized in assembling the information regarding profitability and considered its reasonableness. The Board recognized that it is difficult to make comparisons of profitability from fund management contracts because comparative information is not generally publicly available and is affected by numerous factors, including the structure of the particular adviser, the types of funds it manages, its business mix, numerous assumptions regarding allocations and the adviser’s capital structure and cost of capital. Taking these factors into account, the Board concluded that the profitability of PGIM Investments and its affiliates in relation to the services rendered was not unreasonable.
Economies of Scale
The Board received and discussed information concerning economies of scale that PGIM Investments may realize as the Fund’s assets grow beyond current levels. The Board noted that the management fee schedule for the Fund includes breakpoints, which have the effect of decreasing the fee rate as assets increase. During the course of time, the Board has considered information regarding the launch date of the Fund, the management fees of the Fund compared to those of similarly managed funds and PGIM Investments’ investment in the Fund over time .The Board noted that economies of scale can be shared with the Fund in other ways, including low management fees from inception, additional technological and personnel investments to enhance shareholder services, and maintaining existing expense structures in the face of a rising cost environment. The Board also considered PGIM Investments’ assertion that it continually evaluates the management fee schedule of the Fund and the potential to share economies of scale through breakpoints or fee waivers as asset levels increase.
The Board recognized the inherent limitations of any analysis of economies of scale, stemming largely from the Board’s understanding that most of PGIM Investments’ costs are not specific to individual funds, but rather are incurred across a variety of products and services.
| | |
| PGIM Jennison Equity Income Fund |
Approval of Advisory Agreements (continued)
Other Benefits to PGIM Investments and Jennison
The Board considered potential ancillary benefits that might be received by PGIM Investments and Jennison and their affiliates as a result of their relationship with the Fund. The Board concluded that potential benefits to be derived by PGIM Investments included transfer agency fees received by the Fund’s transfer agent (which is affiliated with PGIM Investments), and benefits to its reputation as well as other intangible benefits resulting from PGIM Investments’ association with the Fund. The Board concluded that the potential benefits to be derived by Jennison included its ability to use soft dollar credits, as well as the potential benefits consistent with those generally resulting from an increase in assets under management, specifically, potential access to additional research resources and benefits to its reputation. The Board concluded that the benefits derived by PGIM Investments and Jennison were consistent with the types of benefits generally derived by investment managers and subadvisers to mutual funds.
Performance of the Fund / Fees and Expenses
The Board considered certain additional specific factors and made related conclusions relating to the historical performance of the Fund for the one-, three- and five-year periods ended December 31, 2017.
The Board also considered the Fund’s actual management fee, as well as the Fund’s net total expense ratio, for the fiscal year ended October 31, 2017. The Board considered the management fee for the Fund as compared to the management fee charged by PGIM Investments to other funds and the fee charged by other advisers to comparable mutual funds in a Peer Group. The actual management fee represents the fee rate actually paid by Fund shareholders and includes any fee waivers or reimbursements. The net total expense ratio for the Fund represents the actual expense ratio incurred by Fund shareholders.
The mutual funds included in the Peer Universe, which was used to consider performance, and the Peer Group, which was used to consider fees and expenses, were objectively determined by Broadridge, an independent provider of mutual fund data. In certain circumstances, PGIM Investments also may have provided supplemental Peer Universe or Peer Group information, for reasons addressed with the Board. The comparisons placed the Fund in various quartiles, with the first quartile being the best 25% of the mutual funds (for performance, the best performing mutual funds and, for expenses, the lowest cost mutual funds).
The section below summarizes key factors considered by the Board and the Board’s conclusions regarding the Fund’s performance, fees and overall expenses. The table sets forth gross performance comparisons (which do not reflect the impact on performance of fund expenses, or any subsidies, expense caps or waivers that may be applicable) with the
| | |
| Visit our website at pgiminvestments.com | | |
Peer Universe, actual management fees with the Peer Group (which reflect the impact of any subsidies or fee waivers), and net total expenses with the Peer Group, each of which were key factors considered by the Board.
| | | | | | | | |
| Gross Performance | | 1 Year | | 3 Years | | 5 Years | | 10 Years |
| | | 3rd Quartile | | 4th Quartile | | 4th Quartile | | N/A |
| Actual Management Fees: 4th Quartile |
| Net Total Expenses: 4th Quartile |
| | • | | The Board noted that the Fund outperformed its benchmark index over the one-year period, though it underperformed over the remaining periods. |
| | • | | The Board considered PGIM Investments’ assertion that the Fund would be expected to outperform in periods when growth outperformed value. In this regard, the Board considered that in periods where growth outperformed value, the Fund has outperformed its peer median over 60% of the time from September 2008 through the end of December 2017. |
| | • | | The Board further noted that the Fund has outperformed its benchmark index and ranked in the first quartile and second quartile, respectively, of its peers over the first quarter of 2018 and the one-year period ended March 31, 2018. |
| | • | | Although the Fund’s net total expense ratio ranked in the fourth quartile in its Peer Group, the Board noted that effective July 1, 2017 PGIM Investments had agreed to permanently reduce the Fund’s management fee schedule. |
| | • | | The Board and PGIM Investments agreed to retain the existing contractual expense cap, which (exclusive of certain fees and expenses) limits transfer agency, shareholder servicing, sub transfer agency and blue sky fees to the extent that such fees cause the annual fund operating expenses for the Fund’s Class R6 shares to exceed 0.80% through February 29, 2020. |
| | • | | At the Board’s request, PGIM Investments agreed to permanently reduce the Fund’s management fee schedule such that, effective July 1, 2018, the new management fee schedule is 0.77% on average daily net assets to $500 million, 0.74% on average daily net assets from $500 million to $1 billion, 0.725% on average daily net assets from $1 billion to $2.5 billion, 0.70% on average daily net assets from $2.5 billion to $7.5 billion, 0.675% on average daily net assets from $7.5 billion to $10 billion and 0.65% on average daily net assets over $10 billion. |
| | • | | The Board and PGIM Investments also agreed to contractually reduce the Fund’s subadvisory fee schedule, such that effective July 1, 2018, the new subadvisory fee is 0.385% on average daily net assets to $500 million, 0.36% on average daily net assets from $500 million to $1 billion, 0.34% on average daily net assets from $1 billion to $3 billion, 0.33% on average daily net assets from $3 billion to $5 billion and 0.32% on average daily net assets over $5 billion. |
| | |
| PGIM Jennison Equity Income Fund |
Approval of Advisory Agreements (continued)
| | • | | The Board concluded that, in light of the above, it would be in the best interests of the Fund and its shareholders to continue to monitor performance and to renew the agreements. |
| | • | | The Board concluded that the management fees (including subadvisory fees) and total expenses were reasonable in light of the services provided. |
* * *
After full consideration of these factors, the Board concluded that approval of the agreements was in the best interests of the Fund and its shareholders.
| | |
| Visit our website at pgiminvestments.com | | |
| | | | |
| ∎ MAIL | | ∎ TELEPHONE | | ∎ WEBSITE |
655 Broad Street Newark, NJ 07102 | | (800) 225-1852 | | www.pgiminvestments.com |
|
| PROXY VOTING |
| The Board of Directors of the Fund has delegated to the Fund’s subadviser the responsibility for voting any proxies and maintaining proxy recordkeeping with respect to the Fund. A description of these proxy voting policies and procedures is available without charge, upon request, by calling (800) 225-1852. Information regarding how the Fund voted proxies relating to portfolio securities during the most recent 12-month period ended June 30 is available on the Fund’s website and on the Securities and Exchange Commission’s website. |
|
| DIRECTORS |
| Ellen S. Alberding • Kevin J. Bannon • Scott E. Benjamin • Linda W. Bynoe • Barry H. Evans • Keith F. Hartstein • Laurie Simon Hodrick • Michael S. Hyland • Stuart S. Parker • Richard A. Redeker • Brian K. Reid • Grace C. Torres |
|
| OFFICERS |
| Stuart S. Parker, President • Scott E. Benjamin, Vice President • Brian D. Nee, Treasurer and Principal Financial and Accounting Officer • Raymond A. O’Hara, Chief Legal Officer • Andrew R. French, Secretary • Chad A. Earnst, Chief Compliance Officer • Dino Capasso, Vice President and Deputy Chief Compliance Officer • Charles H. Smith, Anti-Money Laundering Compliance Officer • Jonathan D. Shain, Assistant Secretary • Claudia DiGiacomo, Assistant Secretary • Peter Parrella, Assistant Treasurer • Lana Lomuti, Assistant Treasurer • Linda McMullin, Assistant Treasurer • Kelly A. Coyne, Assistant Treasurer |
| | | | |
| MANAGER | | PGIM Investments LLC | | 655 Broad Street
Newark, NJ 07102 |
|
| SUBADVISER | | Jennison Associates LLC | | 466 Lexington Avenue
New York, NY 10017 |
|
| DISTRIBUTOR | | Prudential Investment Management Services LLC | | 655 Broad Street
Newark, NJ 07102 |
|
| CUSTODIAN | | The Bank of New York Mellon | | 225 Liberty Street New York, NY 10286 |
|
| TRANSFER AGENT | | Prudential Mutual Fund Services LLC | | PO Box 9658 Providence, RI 02940 |
|
| INDEPENDENT REGISTERED PUBLIC ACCOUNTING FIRM | | KPMG LLP | | 345 Park Avenue New York, NY 10154 |
|
| FUND COUNSEL | | Willkie Farr & Gallagher LLP | | 787 Seventh Avenue New York, NY 10019 |
|
|
| An investor should consider the investment objectives, risks, charges, and expenses of the Fund carefully before investing. The prospectus and summary prospectus contain this and other information about the Fund. An investor may obtain a prospectus and summary prospectus by visiting our website at www.pgiminvestments.com or by calling (800) 225-1852. The prospectus and summary prospectus should be read carefully before investing. |
|
| E-DELIVERY |
| To receive your mutual fund documents online, go to www.pgiminvestments.com/edelivery and enroll. Instead of receiving printed documents by mail, you will receive notification via email when new materials are available. You can cancel your enrollment or change your email address at any time by visiting the website address above. |
|
| SHAREHOLDER COMMUNICATIONS WITH DIRECTORS |
| Shareholders can communicate directly with the Board of Directors by writing to the Chair of the Board, PGIM Jennison Equity Income Fund, PGIM Investments, Attn: Board of Directors, 655 Broad Street, Newark, NJ 07102. Shareholders can communicate directly with an individual Director by writing to the same address. Communications are not screened before being delivered to the addressee. |
|
| AVAILABILITY OF PORTFOLIO SCHEDULE |
| The Fund files its complete schedule of portfolio holdings with the Securities and Exchange Commission for the first and third quarters of each fiscal year on Form N-Q. The Fund’s Forms N-Q are available on the Commission’s website at www.sec.gov. The Fund’s schedule of portfolio holdings is also available on the Fund’s website as of the end of each month no sooner than 15 days after the end of the month. |
|
| The Fund’s Statement of Additional Information contains additional information about the Fund’s Directors and is available without charge, upon request, by calling (800) 225-1852. |
Mutual Funds:
| | | | |
ARE NOT INSURED BY THE FDIC OR ANY
FEDERAL GOVERNMENT AGENCY | | MAY LOSE VALUE | | ARE NOT A DEPOSIT OF OR GUARANTEED BY ANY BANK OR ANY BANK AFFILIATE |
PGIM JENNISON EQUITY INCOME FUND
| | | | | | | | | | | | |
| SHARE CLASS | | A | | B | | C | | R | | Z | | R6* |
| NASDAQ | | SPQAX | | JEIBX | | AGOCX | | PJERX | | JDEZX | | PJIQX |
| CUSIP | | 74441L808 | | 74441L881 | | 74441L873 | | 74441L790 | | 74441L832 | | 74441L816 |
*Formerly known as Class Q shares.
MF203E

PGIM QMA MID-CAP VALUE FUND
(Formerly known as Prudential QMA Mid-Cap Value Fund)
ANNUAL REPORT
OCTOBER 31, 2018
COMING SOON: PAPERLESS SHAREHOLDER REPORTS
Beginning on January 1, 2021, as permitted by regulations adopted by the Securities and Exchange Commission, paper copies of the Fund’s annual and semi-annual shareholder reports will no longer be sent by mail, unless you specifically request paper copies of the reports. Instead, the reports will be made available on the Fund’s website (www.pgiminvestments.com), and you will be notified by mail each time a report is posted and provided with a website link to access the report.
If you already elected to receive shareholder reports electronically, you will not be affected by this change and you need not take any action. You may elect to receive shareholder reports and other communications from the Fund electronically anytime by contacting your financial intermediary (such as a broker-dealer or bank) or, if you are a direct investor, by calling 1-800-225-1852 or by sending an e-mail request to PGIM Investments at shareholderreports@pgim.com.
Beginning on January 1, 2019, you may elect to receive all future reports in paper free of charge. If you invest through a financial intermediary, you can contact your financial intermediary or follow instructions included with this notice to elect to continue to receive paper copies of your shareholder reports. If you invest directly with the Fund, you can call 1-800-225-1852 or send an email request to shareholderreports@pgim.com to let the Fund know you wish to continue receiving paper copies of your shareholder reports. Your election to receive reports in paper will apply to all funds held in your account if you invest through your financial intermediary or all funds held with the fund complex if you invest directly with the Fund.

To enroll in e-delivery, go to pgiminvestments.com/edelivery
|
| Objective: Capital growth |
Highlights (unaudited)
| • | | The Fund’s relative performance was helped by favorable security selection in the real estate, utilities, health care, and consumer discretionary sectors. |
| • | | The Fund’s relative performance was hurt by unfavorable security selection in the information technology, financials, and materials sectors. |
This report is not authorized for distribution to prospective investors unless preceded or accompanied by a current prospectus.
The views expressed in this report and information about the Fund’s portfolio holdings are for the period covered by this report and are subject to change thereafter.
Mutual funds are distributed by Prudential Investment Management Services LLC, a Prudential Financial company and member SIPC. QMA is the primary business name of Quantitative Management Associates LLC, a registered investment adviser and a wholly owned subsidiary of PGIM, Inc., a Prudential Financial company. © 2018 Prudential Financial, Inc. and its related entities. PGIM and the PGIM logo are service marks of Prudential Financial, Inc. and its related entities, registered in many jurisdictions worldwide.
| | |
| 2 | | Visit our website at pgiminvestments.com |
PGIM FUNDS — UPDATE
The Board of Directors/Trustees for the Fund has approved the implementation of an automatic conversion feature for Class C shares, effective as of April 1, 2019. To reflect these changes, effective April 1, 2019, the section of the Fund’s Prospectus entitled “How to Buy, Sell and Exchange Fund Shares—How to Exchange Your Shares—Frequent Purchases and Redemptions of Fund Shares” is restated to read as follows:
This supplement should be read in conjunction with your Summary Prospectus, Statutory Prospectus and Statement of Additional Information, be retained for future reference and is in addition to any existing Fund supplements.
| | 1. | In each Fund’s Statutory Prospectus, the following is added at the end of the section entitled “Fund Distributions And Tax Issues—If You Sell or Exchange Your Shares”: |
Automatic Conversion of Class C Shares
The conversion of Class C shares into Class A shares—which happens automatically approximately 10 years after purchase—is not a taxable event for federal income tax purposes. For more information about the automatic conversion of Class C shares, see Class C Shares Automatically Convert to Class A Shares in How to Buy, Sell and Exchange Fund Shares.
| | 2. | In each Fund’s Statutory Prospectus, the following sentence is added at the end of the section entitled “How to Buy, Sell and Exchange Shares—Closure of Certain Share Classes to New Group Retirement Plans”: |
Shareholders owning Class C shares may continue to hold their Class C shares until the shares automatically convert to Class A shares under the conversion schedule, or until the shareholder redeems their Class C shares.
| | 3. | In each Fund’s Statutory Prospectus, the following disclosure is added immediately following the section entitled “How to Buy, Sell and Exchange Shares—How to Buy Shares—Class B Shares Automatically Convert to Class A Shares”: |
Class C Shares Automatically Convert to Class A Shares
Starting on or about April 1, 2019 (the “Effective Date”), Class C shares will be eligible for automatic conversion into Class A shares on a monthly basis approximately ten years after the original date of purchase (the “Conversion Date”). Conversion will take place based on the relative NAV of the two classes, without the imposition of any sales load, fee or other charge. All such automatic conversions of Class C shares will constitute tax-free exchanges for federal income tax purposes.
For shareholders investing in Class C shares through retirement plans or omnibus accounts, and in certain other instances, the Fund and its agents may not have
| | | | |
| PGIM QMA Mid-Cap Value Fund | | | 3 | |
transparency into how long a shareholder has held Class C shares for purposes of determining whether such Class C shares are eligible for automatic conversion into Class A shares, and the relevant financial intermediary may not have the ability to track purchases in order to credit individual shareholders’ holding periods. In these circumstances, the Fund will not be able to automatically convert Class C shares into Class A shares as described above. In order to determine eligibility for conversion in these circumstances, it is the responsibility of the financial intermediary to notify the Fund that the shareholder is eligible for the conversion of Class C shares to Class A shares, and the financial intermediary may be required to maintain and provide the Fund with records that substantiate the holding period of Class C shares. It is the financial intermediary’s (and not the Fund’s) responsibility to keep records of transactions made in accounts it holds and to ensure that the shareholder is credited with the proper holding period based on such records or those provided to the financial intermediary by the shareholder. Please consult with your financial intermediary for the applicability of this conversion feature to your shares.
A financial intermediary may sponsor and/or control accounts, programs or platforms that impose a different conversion schedule or different eligibility requirements for the exchange of Class C shares for Class A shares (see Appendix A: Waivers and Discounts Available From Certain Financial Intermediaries of the Prospectus). Please consult with your financial intermediary if you have any questions regarding your shares’ conversion from Class C shares to Class A shares.
| | 4. | In Part II of each Fund’s Statement of Additional Information, the following disclosure is added immediately following the section entitled “Purchase, Redemption and Pricing of Fund Shares—Share Classes—Automatic Conversion of Class B Shares”: |
AUTOMATIC CONVERSION OF CLASS C SHARES. Starting on or about April 1, 2019 (the “Effective Date”), Class C shares will be eligible for automatic conversion into Class A shares on a monthly basis approximately ten years after the original date of purchase (the “Conversion Date”). Conversion will take place based on the relative NAV of the two classes, without the imposition of any sales load, fee or other charge. Class C shares of a Fund acquired through automatic reinvestment of dividends or distributions will convert to Class A shares of the Fund on the Conversion Date pro rata with the converting Class C shares of the Fund that were not acquired through reinvestment of dividends or distributions. All such automatic conversions of Class C shares will constitute tax-free exchanges for federal income tax purposes.
For shareholders investing in Class C shares through retirement plans or omnibus accounts, and in certain other instances, the Fund and its agents may not have transparency into how long a shareholder has held Class C shares for purposes of determining whether such Class C shares are eligible for automatic conversion into Class A shares, and the relevant financial intermediary may not have the ability to track purchases in order to credit individual shareholders’ holding periods. In these circumstances, the
| | |
| 4 | | Visit our website at pgiminvestments.com |
Fund will not be able to automatically convert Class C shares into Class A shares as described above. In order to determine eligibility for conversion in these circumstances, it is the responsibility of the financial intermediary to notify the Fund that the shareholder is eligible for the conversion of Class C shares to Class A shares, and the financial intermediary may be required to maintain and provide the Fund with records that substantiate the holding period of Class C shares. It is the financial intermediary’s (and not the Fund’s) responsibility to keep records of transactions made in accounts it holds and to ensure that the shareholder is credited with the proper holding period based on such records or those provided to the financial intermediary by the shareholder. Please consult with your financial intermediary for the applicability of this conversion feature to your shares.
Class C shares were generally closed to investments by new group retirement plans effective June 1, 2018. Group retirement plans (and their successor, related and affiliated plans) that have Class C shares of the Fund available to participants on or before the Effective Date may continue to open accounts for new participants in such share class and purchase additional shares in existing participant accounts.
The Fund has no responsibility for monitoring or implementing a financial intermediary’s process for determining whether a shareholder meets the required holding period for conversion. A financial intermediary may sponsor and/or control accounts, programs or platforms that impose a different conversion schedule or different eligibility requirements for the exchange of Class C shares for Class A shares, as set forth on Appendix A: Waivers and Discounts Available From Certain Financial Intermediaries of the Prospectus. In these cases, Class C shareholders may have their shares exchanged for Class A shares under the policies of the financial intermediary. Financial intermediaries will be responsible for making such exchanges in those circumstances. Please consult with your financial intermediary if you have any questions regarding your shares’ conversion from Class C shares to Class A shares.
LR1094
- Not part of the Annual Report -
| | | | |
| PGIM QMA Mid-Cap Value Fund | | | 5 | |
Table of Contents
| | |
| 6 | | Visit our website at pgiminvestments.com |
Letter from the President

Dear Shareholder:
We hope you find the annual report for PGIM QMA Mid-Cap Value Fund informative and useful. The report covers performance for the 12-month period that ended October 31, 2018.
We have important information to share with you. Effective June 11, 2018, Prudential Mutual Funds were renamed PGIM Funds. This renaming is part of our ongoing effort to further build our reputation and establish our global brand, which began when our firm adopted PGIM Investments as its name in April 2017. Please note that only the Fund’s name has changed. Your Fund’s management and operation, along with its symbols, remained the same.*
During the reporting period, the global economy continued to grow, and central banks gradually tightened monetary policy. In the US, the economy expanded and employment increased. In September, the Federal Reserve hiked interest rates for the eighth time since 2015, based on confidence in the economy.
Equity returns on the whole were strong, due to optimistic earnings expectations and investor sentiment. Global equities, including emerging markets, generally posted positive returns. However, they trailed the performance of US equities, which rose on higher corporate profits, new regulatory policies, and tax reform benefits. Volatility spiked briefly early in the period on inflation concerns, rising interest rates, and a potential global trade war, and again late in the period on worries that profit growth might slow in 2019.
The overall bond market declined modestly during the period, as measured by the Bloomberg Barclays US Aggregate Bond Index. The best performance came from higher-yielding, economically sensitive sectors, such as high yield bonds and bank loans, which posted small gains. US investment-grade corporate bonds and US Treasury bonds both finished the period with negative returns. A major trend during the period was the flattening of the US Treasury yield curve, which increased the yield on fixed income investments with shorter maturities and made them more attractive to investors.
Regarding your investments with PGIM, we believe it is important to maintain a diversified portfolio of funds consistent with your tolerance for risk, time horizon, and financial goals. Your financial advisor can help you create a diversified investment plan that may include funds covering all the basic asset classes and that reflects your personal investor profile and risk tolerance. However, diversification and asset allocation strategies do not assure a profit or protect against loss in declining markets.
At PGIM Investments, we consider it a great privilege and responsibility to help investors participate in opportunities across global markets while meeting their toughest investment challenges. PGIM is a top-10 global investment manager with more than $1 trillion in assets under management. This investment expertise allows us to deliver actively managed funds and strategies to meet the needs of investors around the globe.
Thank you for choosing our family of funds.
Sincerely,

Stuart S. Parker, President
PGIM QMA Mid-Cap Value Fund
December 14, 2018
*The Prudential Day One Funds did not change their names.
| | | | |
| PGIM QMA Mid-Cap Value Fund | | | 7 | |
Your Fund’s Performance (unaudited)
Performance data quoted represents past performance. Past performance does not guarantee future results. The investment return and principal value of an investment will fluctuate, so that an investor’s shares, when redeemed, may be worth more or less than their original cost. Current performance may be lower or higher than the past performance data quoted. An investor may obtain performance data as of the most recent month-end by visiting our website at www.pgiminvestments.com or by calling (800) 225-1852.
| | | | | | | | |
| | | Average Annual Total Returns as of 10/31/18 (with sales charges) |
| | | One Year (%) | | Five Years (%) | | Ten Years (%) | | Since Inception (%) |
| Class A | | –8.84 | | 5.27 | | 11.96 | | — |
| Class B | | –8.76 | | 5.52 | | 11.78 | | — |
| Class C | | –5.12 | | 5.68 | | 11.76 | | — |
| Class R | | –3.76 | | N/A | | N/A | | 3.26 (12/22/14) |
| Class Z | | –3.30 | | 6.74 | | 12.88 | | — |
| Class R2 | | N/A | | N/A | | N/A | | –10.54* (12/28/17) |
| Class R4 | | N/A | | N/A | | N/A | | –10.36* (12/28/17) |
| Class R6** | | –3.12 | | 6.88 | | N/A | | 9.69 (1/18/11) |
| Russell Midcap Value Index |
| | 0.16 | | 8.11 | | 13.35 | | — |
| S&P MidCap 400 Index |
| | 1.02 | | 8.89 | | 14.13 | | — |
| Russell Midcap Index |
| | 2.79 | | 8.97 | | 14.19 | | — |
| Lipper Mid-Cap Value Funds Average |
| | | –1.79 | | 6.27 | | 12.28 | | — |
| | |
| 8 | | Visit our website at pgiminvestments.com |
| | | | | | | | |
| | | Average Annual Total Returns as of 10/31/18
(without sales charges) |
| | | One Year (%) | | Five Years (%) | | Ten Years (%) | | Since Inception (%) |
| Class A | | –3.54 | | 6.47 | | 12.60 | | — |
| Class B | | –4.27 | | 5.67 | | 11.78 | | — |
| Class C | | –4.22 | | 5.68 | | 11.76 | | — |
| Class R | | –3.76 | | N/A | | N/A | | 3.26 (12/22/14) |
| Class Z | | –3.30 | | 6.74 | | 12.88 | | — |
| Class R2 | | N/A | | N/A | | N/A | | –10.54* (12/28/17) |
| Class R4 | | N/A | | N/A | | N/A | | –10.36* (12/28/17) |
| Class R6** | | –3.12 | | 6.88 | | N/A | | 9.69 (1/18/11) |
| Russell Midcap Value Index |
| | 0.16 | | 8.11 | | 13.35 | | — |
| S&P MidCap 400 Index |
| | 1.02 | | 8.89 | | 14.13 | | — |
| Russell Midcap Index |
| | 2.79 | | 8.97 | | 14.19 | | — |
| Lipper Mid-Cap Value Funds Average |
| | | –1.79 | | 6.27 | | 12.28 | | — |
| | | | |
| PGIM QMA Mid-Cap Value Fund | | | 9 | |
Your Fund’s Performance (continued)
Growth of a $10,000 Investment
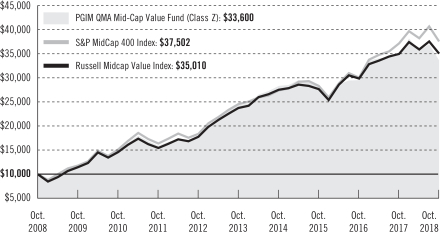
The graph compares a $10,000 investment in the Fund’s Class Z shares with a similar investment in the S&P MidCap 400 Index and Russell Midcap Value Index by portraying the initial account values at the beginning of the 10-year period for Class Z shares (October 31, 2008) and the account values at the end of the current fiscal year (October 31, 2018) as measured on a quarterly basis. For purposes of the graph, and unless otherwise indicated, it has been assumed that (a) all recurring fees (including management fees) were deducted; and (b) all dividends and distributions were reinvested. The line graph provides information for Class Z shares only. As indicated in the tables above, performance for other share classes will vary due to the differing charges and expenses applicable to each share class (as indicated in the following paragraphs). Without waiver of fees and/or expense reimbursements, if any, the Fund’s returns would have been lower.
Past performance does not predict future performance. Total returns and the ending account values in the graph include changes in share price and reinvestment of dividends and capital gains distributions in a hypothetical investment for the periods shown. The Fund’s total returns do not reflect the deduction of income taxes on an individual’s investment. Taxes may reduce your actual investment returns on income or gains paid by the Fund or any gains you may realize if you sell your shares.
Source: PGIM Investments LLC and Lipper Inc.
*Not annualized
**Formerly known as Class Q shares.
Since Inception returns are provided for any share class with less than 10 fiscal years of returns. Since Inception returns for the Indexes and the Lipper Average are measured from the closest month-end to the class’ inception date.
| | |
| 10 | | Visit our website at pgiminvestments.com |
The returns in the tables do not reflect the deduction of taxes that a shareholder would pay on Fund distributions or following the redemption of Fund shares. The average annual total returns take into account applicable sales charges, which are described for each share class in the table below.
| | | | | | | | | | | | | | | | |
| | | Class A | | Class B* | | Class C | | Class R | | Class Z | | Class R2 | | Class R4 | | Class R6** |
| Maximum initial sales charge | | 5.50% of the public offering price | | None | | None | | None | | None | | None | | None | | None |
| Contingent deferred sales charge (CDSC) (as a percentage of the lower of original purchase price or net asset value at redemption) | | 1.00% on sales of $1 million or more made within 12 months of purchase | | 5.00% (Yr. 1) 4.00% (Yr. 2) 3.00% (Yr. 3) 2.00% (Yr. 4) 1.00% (Yr. 5) 1.00% (Yr. 6) 0.00% (Yr. 7) | | 1.00% on sales made within 12 months of purchase | | None | | None | | None | | None | | None |
| Annual distribution or distribution and service (12b-1) fees (shown as a percentage of average daily net assets) | | 0.30% (0.25% currently) | | 1.00% | | 1.00% | | 0.75%
(0.50% currently) | | None | | 0.25% | | None | | None |
| Shareholder service fees | | None | | None | | None | | None | | None | | 0.10% | | 0.10% | | None |
*Class B shares are closed to all purchase activity and no additional Class B shares may be purchased or acquired except by exchange from Class B shares of another Fund or through dividend or capital gains reinvestment.
**Formerly known as Class Q shares.
Benchmark Definitions
Russell Midcap Value Index—The Russell Midcap Value Index is an unmanaged index that measures the performance of those Russell Midcap companies with lower price-to-book ratios and lower forecasted growth values. The stocks included in the Index are also members of the Russell 1000 Value Index. The average annual total returns for the Index measured from the month-end closest to the inception date of the Fund’s Class R shares are 5.76% and 10.51% for Class R6 shares. The cumulative total return for the Index measured from the month-end closest to the inception date of the Fund’s Class R2 shares and Class R4 shares is –4.30%.
| | | | |
| PGIM QMA Mid-Cap Value Fund | | | 11 | |
Your Fund’s Performance (continued)
S&P MidCap 400 Index—The S&P MidCap 400 Index is an unmanaged index of 400 domestic stocks chosen for market capitalization, liquidity, and industry group representation. It gives a broad look at how US mid-cap stock prices have performed. The average annual total returns for the Index measured from the month-end closest to the inception date of the Fund’s Class R shares is 7.83% and 10.85% for Class R6 shares. The cumulative total return for the Index measured from the month-end closest to the inception date of the Fund’s Class R2 shares and Class R4 shares is –2.77%.
Russell Midcap Index—The Russell Midcap Index is an unmanaged index that measures the performance of the 800 smallest companies in the Russell 1000 Index, which represent approximately 25% of the total market capitalization of the Russell 1000 Index. The average annual total returns for the Index measured from the month-end closest to the inception date of the Fund’s Class R shares is 7.01% and 10.94% for Class R6 shares. The cumulative total return for the Index measured from the month-end closest to the inception date of the Fund’s Class R2 shares and Class R4 shares is –1.47%.
Lipper Mid-Cap Value Funds Average—The Lipper Mid-Cap Value Funds Average (Lipper Average) is based on the average return of all funds in the Lipper Mid-Cap Value Funds universe for the periods noted. Funds in the Lipper Average, by portfolio practice, invest at least 75% of their equity assets in companies with market capitalizations (on a three-year weighted basis) less than 300% of the dollar-weighted median market capitalization of the middle 1,000 securities of the S&P SuperComposite 1500 Index. Mid-cap value funds typically have a below-average price-to-earnings ratio, price-to-book ratio, and three-year sales-per-share growth value compared with the companies in the S&P MidCap 400 Index. The average annual total returns for the Lipper Average measured from the month-end closest to the inception date of the Fund’s Class R shares is 4.34% and 8.99% for Class R6 shares. The cumulative total return for the Lipper Average measured from the month-end closest to the inception date of the Fund’s Class R2 shares and Class R4 shares is –6.04%.
Investors cannot invest directly in an index or average. The returns for the Indexes would be lower if they included the effects of sales charges, operating expenses of a mutual fund, or taxes. Returns for the Lipper Average reflect the deduction of operating expenses, but not sales charges or taxes.
Presentation of Fund Holdings
| | | | |
Five Largest Holdings expressed as a
percentage of net assets as of 10/31/18 (%) | |
SunTrust Banks, Inc., Banks | | | 1.6 | |
PG&E Corp., Electric Utilities | | | 1.4 | |
Citizens Financial Group, Inc., Banks | | | 1.3 | |
CenturyLink, Inc., Diversified Telecommunication Services | | | 1.3 | |
Fifth Third Bancorp, Banks | | | 1.3 | |
Holdings reflect only long-term investments and are subject to change.
| | | | |
Five Largest Industries expressed as a
percentage of net assets as of 10/31/18 (%) | |
Banks | | | 9.4 | |
Equity Real Estate Investment Trusts (REITs) | | | 9.0 | |
Insurance | | | 7.1 | |
Electric Utilities | | | 5.7 | |
Metals & Mining | | | 4.6 | |
Industry weightings reflect only long-term investments and are subject to change.
| | |
| 12 | | Visit our website at pgiminvestments.com |
Strategy and Performance Overview (unaudited)
How did the Fund perform?
The PGIM QMA Mid-Cap Value Fund’s Class Z shares returned –3.30% for the 12-month reporting period that ended October 31, 2018, underperforming the 0.16% return of the benchmark Russell Midcap Value Index (the Index) and the –1.79% return of the Lipper Mid-Cap Value Funds Average.
What were market conditions?
| • | | US equities delivered positive returns across all market capitalizations. Large-cap stocks (Russell 1000 Index: +7.0%) outperformed mid-cap stocks (Russell Midcap Index: +2.8%) and small-cap stocks (Russell 2000: +1.9%) for the reporting period. Growth stocks also outperformed value stocks within each of the market-cap indices. |
| • | | Within the Russell Midcap Value universe, information technology and energy fared best. The materials and industrials sectors, hurt by investor concerns with tariffs, posted negative returns. |
What worked?
| • | | The Fund’s relative performance was helped by favorable security selection in the real estate, utilities, health care, and consumer discretionary sectors. |
| • | | In the real estate sector, good security selection among retail REITs and diversified REITs added value. In addition, the Fund’s below-benchmark exposure to underperforming, specialized REITs contributed meaningfully to its relative performance. |
| • | | In the utilities sector, timely purchases in the electric utilities industry contributed to performance. In addition, the Fund’s overweight position in independent power and renewable electricity producer AES Corp. added significant value. |
| • | | In the health care sector, the Fund benefited from its above-benchmark weights in health care providers and its below-benchmark exposure to medical equipment companies. |
| • | | In the consumer discretionary sector, the Fund’s overweight positions in inexpensive media and retail companies aided performance. Top individual contributors included department store operators Macy’s, Inc. and Kohl’s Corp. and luxury apparel maker Ralph Lauren Corp. |
| • | | Another top-performing holding was the airline United Continental Holdings, Inc., which reported better-than-expected quarterly earnings and raised its profit outlook for the year. |
What didn’t work?
| • | | The Fund’s relative performance was hurt by unfavorable security selection in the information technology, financials, and materials sectors. |
| | | | |
| PGIM QMA Mid-Cap Value Fund | | | 13 | |
Strategy and Performance Overview (continued)
| • | | In the information technology sector, the Fund suffered the most from an overweight position in computer hard-disk drive maker Western Digital Corp. and from not holding a position in social media company Twitter, Inc. Despite solid earnings results for most quarters during the past year, Western Digital’s stock tumbled this reporting period on investor expectations for lower flash memory prices. Twitter shares have soared since the company achieved its first-ever profit in the fourth quarter of 2017. |
| • | | In the financials sector, unfavorable security selection among insurance providers weighed on performance. The most significant underperformer was Unum Group, as analysts raised concerns about the profitability of the company’s long-term-care insurance business. |
| • | | In the materials sector, the Fund’s overweight positions in inexpensive, but poor-performing chemical and container & packaging companies weighed on results. |
| • | | Other significant detractors included Laredo Petroleum, Inc., an Oklahoma-based oil and natural gas driller focused on the Permian basin, and Ryder System, Inc., a commercial fleet management specialist. |
The percentage points shown in the tables below identify each security’s positive or negative contribution to the Fund’s return relative to the benchmark.
| | | | | | |
| Top Contributors (%) | | Top Detractors (%) |
| Ralph Lauren Corp. (Class A) | | 0.31 | | Western Digital Corp. | | –0.41 |
| United Continental Holdings, Inc. | | 0.28 | | Twitter, Inc. | | –0.35 |
| AES Corp. | | 0.26 | | Laredo Petroleum, Inc. | | –0.26 |
| Macy’s, Inc. | | 0.21 | | Ryder System, Inc. | | –0.24 |
| Kohl’s Corp. | | 0.21 | | Unum Group | | –0.21 |
Current outlook
| • | | Although the average stock did not appear inexpensive at the end of the reporting period, QMA’s quantitative model continues to find attractively valued mid-cap companies in the US stock market. The spread in valuations between the most-expensive and least-expensive groups of stocks continues to be relatively wide, suggesting an opportunity for a payoff to value stocks. In addition, the Fund continues to trade at a significant discount to its Russell Midcap Value benchmark on various valuation metrics. QMA believes the deeply discounted valuations of the Fund’s holdings present an opportunity for strong relative performance ahead. |
| • | | Relative to the benchmark, the Fund’s biggest sector overweights are the financials and consumer discretionary sectors, where QMA’s quantitative model finds many inexpensive stocks. The information technology and utilities sectors, where most stocks rank as expensive, are among the Fund’s largest sector underweights. |
| | |
| 14 | | Visit our website at pgiminvestments.com |
Fees and Expenses (unaudited)
As a shareholder of the Fund, you incur two types of costs: (1) transaction costs, including sales charges (loads) on purchase payments and redemptions, as applicable, and (2) ongoing costs, including management fees, distribution and/or service (12b-1) fees, and other Fund expenses, as applicable. This example is intended to help you understand your ongoing costs (in dollars) of investing in the Fund and to compare these costs with the ongoing costs of investing in other mutual funds.
The example is based on an investment of $1,000 held through the six-month period ended October 31, 2018. The example is for illustrative purposes only; you should consult the Prospectus for information on initial and subsequent minimum investment requirements.
Actual Expenses
The first line for each share class in the table on the following page provides information about actual account values and actual expenses. You may use the information on this line, together with the amount you invested, to estimate the expenses that you paid over the period. Simply divide your account value by $1,000 (for example, an $8,600 account value ÷ $1,000 = 8.6), then multiply the result by the number on the first line under the heading “Expenses Paid During the Six-Month Period” to estimate the expenses you paid on your account during this period.
Hypothetical Example for Comparison Purposes
The second line for each share class in the table on the following page provides information about hypothetical account values and hypothetical expenses based on the Fund’s actual expense ratio and an assumed rate of return of 5% per year before expenses, which is not the Fund’s actual return. The hypothetical account values and expenses may not be used to estimate the actual ending account balance or expenses you paid for the period. You may use this information to compare the ongoing costs of investing in the Fund and other funds. To do so, compare this 5% hypothetical example with the 5% hypothetical examples that appear in the shareholder reports of the other funds.
The Fund’s transfer agent may charge additional fees to holders of certain accounts that are not included in the expenses shown in the table on the following page. These fees apply to individual retirement accounts (IRAs) and Section 403(b) accounts. As of the close of the six-month period covered by the table, IRA fees included an annual maintenance fee of $15 per account (subject to a maximum annual maintenance fee of $25 for all accounts held by the same shareholder). Section 403(b) accounts are charged an annual $25 fiduciary maintenance fee. Some of the fees may vary in amount, or may be waived, based on your total account balance or the number of PGIM funds, including the Fund, that you own. You should consider the additional fees that were charged to your Fund account over the six-month period when you estimate the total ongoing expenses paid over the period
| | | | |
| PGIM QMA Mid-Cap Value Fund | | | 15 | |
Fees and Expenses (continued)
and the impact of these fees on your ending account value, as these additional expenses are not reflected in the information provided in the expense table. Additional fees have the effect of reducing investment returns.
Please note that the expenses shown in the table are meant to highlight your ongoing costs only and do not reflect any transactional costs such as sales charges (loads). Therefore, the second line for each share class in the table is useful in comparing ongoing costs only and will not help you determine the relative total costs of owning different funds. In addition, if these transactional costs were included, your costs would have been higher.
| | | | | | | | | | | | | | | | | | |
PGIM
QMA Mid-Cap
Value Fund | | Beginning Account
Value
May 1, 2018 | | | Ending Account
Value
October 31, 2018 | | | Annualized
Expense Ratio
Based on the
Six-Month Period | | | Expenses Paid
During the
Six-Month Period* | |
| Class A | | Actual | | $ | 1,000.00 | | | $ | 939.90 | | | | 1.15 | % | | $ | 5.62 | |
| | Hypothetical | | $ | 1,000.00 | | | $ | 1,019.41 | | | | 1.15 | % | | $ | 5.85 | |
| Class B | | Actual | | $ | 1,000.00 | | | $ | 936.20 | | | | 1.95 | % | | $ | 9.52 | |
| | Hypothetical | | $ | 1,000.00 | | | $ | 1,015.38 | | | | 1.95 | % | | $ | 9.91 | |
| Class C | | Actual | | $ | 1,000.00 | | | $ | 937.00 | | | | 1.90 | % | | $ | 9.28 | |
| | Hypothetical | | $ | 1,000.00 | | | $ | 1,015.63 | | | | 1.90 | % | | $ | 9.65 | |
| Class R | | Actual | | $ | 1,000.00 | | | $ | 938.50 | | | | 1.45 | % | | $ | 7.08 | |
| | Hypothetical | | $ | 1,000.00 | | | $ | 1,017.90 | | | | 1.45 | % | | $ | 7.38 | |
| Class Z | | Actual | | $ | 1,000.00 | | | $ | 941.00 | | | | 0.94 | % | | $ | 4.60 | |
| | Hypothetical | | $ | 1,000.00 | | | $ | 1,020.47 | | | | 0.94 | % | | $ | 4.79 | |
| Class R2 | | Actual | | $ | 1,000.00 | | | $ | 939.80 | | | | 1.24 | % | | $ | 6.06 | |
| | Hypothetical | | $ | 1,000.00 | | | $ | 1,018.95 | | | | 1.24 | % | | $ | 6.31 | |
| Class R4 | | Actual | | $ | 1,000.00 | | | $ | 940.80 | | | | 1.00 | % | | $ | 4.89 | |
| | Hypothetical | | $ | 1,000.00 | | | $ | 1,020.16 | | | | 1.00 | % | | $ | 5.09 | |
| Class R6** | | Actual | | $ | 1,000.00 | | | $ | 942.20 | | | | 0.75 | % | | $ | 3.67 | |
| | | Hypothetical | | $ | 1,000.00 | | | $ | 1,021.42 | | | | 0.75 | % | | $ | 3.82 | |
*Fund expenses (net of fee waivers or subsidies, if any) for each share class are equal to the annualized expense ratio for each share class (provided in the table), multiplied by the average account value over the period, multiplied by the 184 days in the six-month period ended October 31, 2018, and divided by the 365 days in the Fund’s fiscal year ended October 31, 2018 (to reflect the six-month period). Expenses presented in the table include the expenses of any underlying portfolios in which the Fund may invest.
**Formerly known as Class Q shares.
| | |
| 16 | | Visit our website at pgiminvestments.com |
Schedule of Investments
as of October 31, 2018
| | | | | | | | |
| Description | | Shares | | | Value | |
LONG-TERM INVESTMENTS 100.0% | | | | | | | | |
| | |
COMMON STOCKS 99.8% | | | | | | | | |
| | |
Airlines 2.5% | | | | | | | | |
Alaska Air Group, Inc. | | | 30,300 | | | $ | 1,861,026 | |
Copa Holdings SA (Panama) (Class A Stock) | | | 26,800 | | | | 1,941,124 | |
JetBlue Airways Corp.* | | | 432,300 | | | | 7,232,379 | |
United Continental Holdings, Inc.* | | | 106,200 | | | | 9,081,162 | |
| | | | | | | | |
| | | | | | | 20,115,691 | |
| | |
Auto Components 2.9% | | | | | | | | |
Adient PLC(a) | | | 137,700 | | | | 4,188,834 | |
BorgWarner, Inc. | | | 180,200 | | | | 7,101,682 | |
Goodyear Tire & Rubber Co. (The) | | | 339,000 | | | | 7,139,340 | |
Lear Corp. | | | 40,500 | | | | 5,382,450 | |
| | | | | | | | |
| | | | | | | 23,812,306 | |
| | |
Banks 9.4% | | | | | | | | |
Associated Banc-Corp. | | | 30,200 | | | | 700,036 | |
BankUnited, Inc. | | | 29,400 | | | | 973,140 | |
CIT Group, Inc. | | | 5,600 | | | | 265,328 | |
Citizens Financial Group, Inc. | | | 288,600 | | | | 10,779,210 | |
Fifth Third Bancorp(a) | | | 393,800 | | | | 10,628,662 | |
First Hawaiian, Inc. | | | 65,000 | | | | 1,610,700 | |
Huntington Bancshares, Inc. | | | 353,300 | | | | 5,062,789 | |
KeyCorp | | | 518,700 | | | | 9,419,592 | |
PacWest Bancorp | | | 131,200 | | | | 5,329,344 | |
Regions Financial Corp. | | | 626,300 | | | | 10,628,311 | |
SunTrust Banks, Inc. | | | 200,700 | | | | 12,575,862 | |
Zions Bancorp NA | | | 169,300 | | | | 7,965,565 | |
| | | | | | | | |
| | | | | | | 75,938,539 | |
| | |
Beverages 1.2% | | | | | | | | |
Molson Coors Brewing Co. (Class B Stock) | | | 148,600 | | | | 9,510,400 | |
| | |
Biotechnology 0.1% | | | | | | | | |
United Therapeutics Corp.* | | | 7,800 | | | | 864,708 | |
| | |
Building Products 0.7% | | | | | | | | |
Owens Corning | | | 125,900 | | | | 5,951,293 | |
See Notes to Financial Statements.
| | | | |
| PGIM QMA Mid-Cap Value Fund | | | 17 | |
Schedule of Investments (continued)
as of October 31, 2018
| | | | | | | | |
| Description | | Shares | | | Value | |
COMMON STOCKS (Continued) | | | | | | | | |
| |
Capital Markets 0.9% | | | | | |
Invesco Ltd. | | | 306,300 | | | $ | 6,649,773 | |
Legg Mason, Inc. | | | 11,500 | | | | 324,530 | |
| | | | | | | | |
| | | | | | | 6,974,303 | |
| | |
Chemicals 2.5% | | | | | | | | |
Eastman Chemical Co. | | | 91,800 | | | | 7,192,530 | |
Huntsman Corp. | | | 117,100 | | | | 2,562,148 | |
Mosaic Co. (The) | | | 260,400 | | | | 8,056,776 | |
Olin Corp. | | | 19,900 | | | | 401,980 | |
Westlake Chemical Corp. | | | 34,100 | | | | 2,431,330 | |
| | | | | | | | |
| | | | | | | 20,644,764 | |
| | |
Construction & Engineering 1.7% | | | | | | | | |
AECOM*(a) | | | 239,066 | | | | 6,966,383 | |
Quanta Services, Inc.* | | | 218,000 | | | | 6,801,600 | |
| | | | | | | | |
| | | | | | | 13,767,983 | |
| | |
Consumer Finance 3.7% | | | | | | | | |
Ally Financial, Inc. | | | 337,100 | | | | 8,565,711 | |
Navient Corp. | | | 266,900 | | | | 3,090,702 | |
OneMain Holdings, Inc.* | | | 66,100 | | | | 1,885,172 | |
Santander Consumer USA Holdings, Inc. | | | 372,300 | | | | 6,980,625 | |
Synchrony Financial | | | 330,200 | | | | 9,536,176 | |
| | | | | | | | |
| | | | | | | 30,058,386 | |
| | |
Containers & Packaging 2.0% | | | | | | | | |
International Paper Co. | | | 168,800 | | | | 7,656,768 | |
WestRock Co. | | | 196,200 | | | | 8,430,714 | |
| | | | | | | | |
| | | | | | | 16,087,482 | |
| | |
Diversified Financial Services 2.1% | | | | | | | | |
AXA Equitable Holdings, Inc. | | | 242,100 | | | | 4,912,209 | |
Jefferies Financial Group, Inc. | | | 206,100 | | | | 4,424,967 | |
Voya Financial, Inc. | | | 167,600 | | | | 7,334,176 | |
| | | | | | | | |
| | | | | | | 16,671,352 | |
| | |
Diversified Telecommunication Services 1.3% | | | | | | | | |
CenturyLink, Inc.(a) | | | 520,400 | | | | 10,741,056 | |
See Notes to Financial Statements.
| | | | | | | | |
| Description | | Shares | | | Value | |
COMMON STOCKS (Continued) | | | | | | | | |
| | |
Electric Utilities 5.7% | | | | | | | | |
Avangrid, Inc. | | | 33,100 | | | $ | 1,556,031 | |
Edison International | | | 81,500 | | | | 5,655,285 | |
Entergy Corp. | | | 101,400 | | | | 8,512,530 | |
Evergy, Inc. | | | 60,500 | | | | 3,387,395 | |
FirstEnergy Corp. | | | 175,800 | | | | 6,553,824 | |
PG&E Corp.* | | | 246,800 | | | | 11,552,708 | |
PPL Corp. | | | 292,000 | | | | 8,876,800 | |
| | | | | | | | |
| | | | | | | 46,094,573 | |
| | |
Electrical Equipment 0.8% | | | | | | | | |
Regal Beloit Corp. | | | 91,900 | | | | 6,589,230 | |
| | |
Entertainment 1.1% | | | | | | | | |
Liberty Media Corp-Liberty Formula One* | | | 20,000 | | | | 661,600 | |
Viacom, Inc. (Class A Stock)(a) | | | 10,684 | | | | 377,893 | |
Viacom, Inc. (Class B Stock) | | | 239,200 | | | | 7,649,616 | |
| | | | | | | | |
| | | | | | | 8,689,109 | |
| | |
Equity Real Estate Investment Trusts (REITs) 9.0% | | | | | | | | |
Apple Hospitality REIT, Inc. | | | 418,100 | | | | 6,760,677 | |
Brixmor Property Group, Inc. | | | 473,135 | | | | 7,664,787 | |
Colony Capital, Inc. | | | 92,500 | | | | 542,975 | |
Hospitality Properties Trust | | | 286,600 | | | | 7,342,692 | |
Invitation Homes, Inc. | | | 38,200 | | | | 835,816 | |
Kimco Realty Corp. | | | 495,600 | | | | 7,974,204 | |
Medical Properties Trust, Inc. | | | 386,969 | | | | 5,750,359 | |
Omega Healthcare Investors, Inc. | | | 41,400 | | | | 1,380,690 | |
Park Hotels & Resorts, Inc. | | | 185,200 | | | | 5,383,764 | |
Senior Housing Properties Trust | | | 212,300 | | | | 3,411,661 | |
SITE Centers Corp. | | | 457,150 | | | | 5,682,375 | |
SL Green Realty Corp. | | | 22,800 | | | | 2,080,728 | |
Spirit Realty Capital, Inc. | | | 998,600 | | | | 7,809,052 | |
VEREIT, Inc. | | | 1,068,200 | | | | 7,829,906 | |
VICI Properties, Inc. | | | 98,800 | | | | 2,133,092 | |
| | | | | | | | |
| | | | | | | 72,582,778 | |
| | |
Food & Staples Retailing 0.9% | | | | | | | | |
Kroger Co. (The) | | | 232,200 | | | | 6,910,272 | |
| | |
Food Products 2.6% | | | | | | | | |
J.M. Smucker Co. (The) | | | 87,700 | | | | 9,499,664 | |
See Notes to Financial Statements.
| | | | |
| PGIM QMA Mid-Cap Value Fund | | | 19 | |
Schedule of Investments (continued)
as of October 31, 2018
| | | | | | | | |
| Description | | Shares | | | Value | |
COMMON STOCKS (Continued) | | | | | | | | |
| | |
Food Products (cont’d.) | | | | | | | | |
TreeHouse Foods, Inc.* | | | 35,400 | | | $ | 1,612,824 | |
Tyson Foods, Inc. (Class A Stock) | | | 168,400 | | | | 10,090,528 | |
| | | | | | | | |
| | | | | | | 21,203,016 | |
| | |
Health Care Providers & Services 3.3% | | | | | | | | |
Acadia Healthcare Co., Inc.*(a) | | | 123,700 | | | | 5,133,550 | |
Cardinal Health, Inc. | | | 124,100 | | | | 6,279,460 | |
DaVita, Inc.* | | | 67,700 | | | | 4,558,918 | |
MEDNAX, Inc.* | | | 74,700 | | | | 3,084,363 | |
Universal Health Services, Inc. (Class B Stock) | | | 66,000 | | | | 8,022,960 | |
| | | | | | | | |
| | | | | | | 27,079,251 | |
| | |
Hotels, Restaurants & Leisure 1.8% | | | �� | | | | | |
Norwegian Cruise Line Holdings Ltd.* | | | 152,700 | | | | 6,729,489 | |
Royal Caribbean Cruises Ltd. | | | 78,300 | | | | 8,200,359 | |
| | | | | | | | |
| | | | | | | 14,929,848 | |
| | |
Household Durables 4.3% | | | | | | | | |
Lennar Corp. (Class A Stock) | | | 172,700 | | | | 7,422,646 | |
Mohawk Industries, Inc.*(a) | | | 48,600 | | | | 6,061,878 | |
Newell Brands, Inc. | | | 435,400 | | | | 6,914,152 | |
PulteGroup, Inc. | | | 303,000 | | | | 7,444,710 | |
Toll Brothers, Inc. | | | 217,133 | | | | 7,308,697 | |
| | | | | | | | |
| | | | | | | 35,152,083 | |
| | |
Independent Power & Renewable Electricity Producers 1.1% | | | | | | | | |
AES Corp. | | | 598,800 | | | | 8,730,504 | |
| | |
Insurance 7.1% | | | | | | | | |
American Financial Group, Inc. | | | 25,500 | | | | 2,550,765 | |
CNA Financial Corp. | | | 152,375 | | | | 6,608,504 | |
Hartford Financial Services Group, Inc. (The) | | | 130,600 | | | | 5,931,852 | |
Lincoln National Corp. | | | 149,700 | | | | 9,010,443 | |
Loews Corp. | | | 194,036 | | | | 9,034,316 | |
Principal Financial Group, Inc. | | | 177,400 | | | | 8,350,218 | |
Reinsurance Group of America, Inc. | | | 59,700 | | | | 8,499,489 | |
Unum Group | | | 208,700 | | | | 7,567,462 | |
| | | | | | | | |
| | | | | | | 57,553,049 | |
See Notes to Financial Statements.
| | | | | | | | |
| Description | | Shares | | | Value | |
COMMON STOCKS (Continued) | | | | | | | | |
| | |
Internet & Direct Marketing Retail 0.9% | | | | | | | | |
Qurate Retail, Inc.* | | | 332,100 | | | $ | 7,286,274 | |
| | |
IT Services 0.9% | | | | | | | | |
DXC Technology Co. | | | 96,900 | | | | 7,057,227 | |
| | |
Machinery 2.2% | | | | | | | | |
Cummins, Inc. | | | 37,300 | | | | 5,098,537 | |
PACCAR, Inc. | | | 157,900 | | | | 9,033,459 | |
Trinity Industries, Inc. | | | 124,800 | | | | 3,563,040 | |
| | | | | | | | |
| | | | | | | 17,695,036 | |
| | |
Media 3.5% | | | | | | | | |
Discovery, Inc. (Class A Stock)*(a) | | | 27,100 | | | | 877,769 | |
Discovery, Inc. (Class C Stock)* | | | 138,700 | | | | 4,065,297 | |
DISH Network Corp. (Class A Stock)* | | | 87,100 | | | | 2,677,454 | |
Liberty Broadband Corp.* | | | 13,300 | | | | 1,102,969 | |
Liberty Media Corp.-Liberty SiriusXM (Class A Stock)* | | | 92,600 | | | | 3,818,824 | |
Liberty Media Corp.-Liberty SiriusXM (Class C Stock)* | | | 108,900 | | | | 4,494,303 | |
News Corp. (Class A Stock) | | | 210,200 | | | | 2,772,538 | |
News Corp. (Class B Stock) | | | 53,000 | | | | 707,020 | |
Tribune Media Co. (Class A Stock) | | | 196,300 | | | | 7,461,363 | |
| | | | | | | | |
| | | | | | | 27,977,537 | |
| | |
Metals & Mining 4.6% | | | | | | | | |
Alcoa Corp.* | | | 104,500 | | | | 3,656,455 | |
Freeport-McMoRan, Inc. | | | 703,700 | | | | 8,198,105 | |
Newmont Mining Corp. | | | 90,200 | | | | 2,788,984 | |
Nucor Corp. | | | 67,900 | | | | 4,014,248 | |
Reliance Steel & Aluminum Co. | | | 93,300 | | | | 7,363,236 | |
Steel Dynamics, Inc. | | | 97,800 | | | | 3,872,880 | |
United States Steel Corp. | | | 273,100 | | | | 7,245,343 | |
| | | | | | | | |
| | | | | | | 37,139,251 | |
| | |
Mortgage Real Estate Investment Trusts (REITs) 4.5% | | | | | | | | |
AGNC Investment Corp. | | | 451,600 | | | | 8,056,544 | |
Annaly Capital Management, Inc. | | | 942,700 | | | | 9,304,449 | |
Chimera Investment Corp. | | | 234,000 | | | | 4,352,400 | |
MFA Financial, Inc. | | | 613,600 | | | | 4,252,248 | |
New Residential Investment Corp. | | | 167,300 | | | | 2,991,324 | |
See Notes to Financial Statements.
| | | | |
| PGIM QMA Mid-Cap Value Fund | | | 21 | |
Schedule of Investments (continued)
as of October 31, 2018
| | | | | | | | |
| Description | | Shares | | | Value | |
COMMON STOCKS (Continued) | | | | | | | | |
| | |
Mortgage Real Estate Investment Trusts (REITs) (cont’d.) | | | | | | | | |
Starwood Property Trust, Inc. | | | 159,100 | | | $ | 3,455,652 | |
Two Harbors Investment Corp. | | | 279,900 | | | | 4,111,731 | |
| | | | | | | | |
| | | | | | | 36,524,348 | |
| | |
Multiline Retail 1.4% | | | | | | | | |
Kohl’s Corp. | | | 81,200 | | | | 6,149,276 | |
Macy’s, Inc.(a) | | | 161,100 | | | | 5,524,119 | |
| | | | | | | | |
| | | | | | | 11,673,395 | |
| | |
Multi-Utilities 0.6% | | | | | | | | |
Consolidated Edison, Inc. | | | 37,300 | | | | 2,834,800 | |
Public Service Enterprise Group, Inc. | | | 31,300 | | | | 1,672,359 | |
| | | | | | | | |
| | | | | | | 4,507,159 | |
| | |
Oil, Gas & Consumable Fuels 3.6% | | | | | | | | |
Antero Resources Corp.*(a) | | | 124,000 | | | | 1,970,360 | |
Cimarex Energy Co. | | | 59,800 | | | | 4,752,306 | |
EQT Corp. | | | 202,800 | | | | 6,889,116 | |
Gulfport Energy Corp.*(a) | | | 157,700 | | | | 1,436,647 | |
Laredo Petroleum, Inc.* | | | 214,800 | | | | 1,125,552 | |
Marathon Oil Corp. | | | 57,100 | | | | 1,084,329 | |
Marathon Petroleum Corp. | | | 21,900 | | | | 1,542,855 | |
Murphy Oil Corp. | | | 22,400 | | | | 713,664 | |
Range Resources Corp.(a) | | | 404,900 | | | | 6,417,665 | |
Southwestern Energy Co.* | | | 644,100 | | | | 3,439,494 | |
| | | | | | | | |
| | | | | | | 29,371,988 | |
| | |
Paper & Forest Products 0.9% | | | | | | | | |
Domtar Corp. | | | 151,500 | | | | 7,015,965 | |
| | |
Personal Products 0.3% | | | | | | | | |
Coty, Inc. (Class A Stock)(a) | | | 252,400 | | | | 2,662,820 | |
| | |
Pharmaceuticals 1.1% | | | | | | | | |
Mylan NV* | | | 291,089 | | | | 9,096,531 | |
| | |
Real Estate Management & Development 1.5% | | | | | | | | |
CBRE Group, Inc. (Class A Stock)* | | | 146,100 | | | | 5,886,369 | |
See Notes to Financial Statements.
| | | | | | | | |
| Description | | Shares | | | Value | |
COMMON STOCKS (Continued) | | | | | | | | |
| | |
Real Estate Management & Development (cont’d.) | | | | | | | | |
Jones Lang LaSalle, Inc. | | | 13,100 | | | $ | 1,732,606 | |
Realogy Holdings Corp.(a) | | | 235,500 | | | | 4,490,985 | |
| | | | | | | | |
| | | | | | | 12,109,960 | |
| | |
Road & Rail 0.9% | | | | | | | | |
AMERCO | | | 3,300 | | | | 1,077,384 | |
Knight-Swift Transportation Holdings, Inc. | | | 28,700 | | | | 918,400 | |
Ryder System, Inc. | | | 103,141 | | | | 5,704,729 | |
| | | | | | | | |
| | | | | | | 7,700,513 | |
| | |
Semiconductors & Semiconductor Equipment 0.3% | | | | | | | | |
First Solar, Inc.* | | | 55,300 | | | | 2,311,540 | |
| | |
Specialty Retail 1.4% | | | | | | | | |
AutoNation, Inc.* | | | 81,300 | | | | 3,291,024 | |
Gap, Inc. (The) | | | 170,400 | | | | 4,651,920 | |
Penske Automotive Group, Inc. | | | 81,300 | | | | 3,608,094 | |
| | | | | | | | |
| | | | | | | 11,551,038 | |
| | |
Technology Hardware, Storage & Peripherals 1.1% | | | | | | | | |
Western Digital Corp. | | | 181,000 | | | | 7,795,670 | |
Xerox Corp. | | | 32,300 | | | | 900,201 | |
| | | | | | | | |
| | | | | | | 8,695,871 | |
| | |
Trading Companies & Distributors 0.8% | | | | | | | | |
Air Lease Corp. | | | 166,000 | | | | 6,324,600 | |
WESCO International, Inc.* | | | 7,500 | | | | 376,350 | |
| | | | | | | | |
| | | | | | | 6,700,950 | |
| | |
Transportation Infrastructure 0.6% | | | | | | | | |
Macquarie Infrastructure Corp.(a) | | | 132,900 | | | | 4,910,655 | |
| | | | | | | | |
TOTAL COMMON STOCKS
(cost $828,363,350) | | | | | | | 808,640,034 | |
| | | | | | | | |
See Notes to Financial Statements.
| | | | |
| PGIM QMA Mid-Cap Value Fund | | | 23 | |
Schedule of Investments (continued)
as of October 31, 2018
| | | | | | | | |
| Description | | Shares | | | Value | |
EXCHANGE TRADED FUND 0.2% | |
iShares Russell Mid-Cap Value ETF
(cost $1,158,964) | | | 12,700 | | | $ | 1,063,117 | |
| | | | | | | | |
TOTAL LONG-TERM INVESTMENTS
(cost $829,522,314) | | | | | | | 809,703,151 | |
| | | | | | | | |
|
SHORT-TERM INVESTMENTS 7.5% | |
|
AFFILIATED MUTUAL FUNDS | |
PGIM Core Ultra Short Bond Fund(w) | | | 1,065,968 | | | | 1,065,968 | |
PGIM Institutional Money Market Fund
(cost $59,835,212; includes $59,774,109 of cash collateral for securities on loan)(b)(w) | | | 59,834,012 | | | | 59,834,012 | |
| | | | | | | | |
TOTAL SHORT-TERM INVESTMENTS
(cost $60,901,181) | | | | | | | 60,899,980 | |
| | | | | | | | |
TOTAL INVESTMENTS 107.5%
(cost $890,423,495) | | | | | | | 870,603,131 | |
Liabilities in excess of other assets (7.5)% | | | | | | | (60,410,034 | ) |
| | | | | | | | |
NET ASSETS 100.0% | | | | | | $ | 810,193,097 | |
| | | | | | | | |
The following abbreviations are used in the annual report:
ETF—Exchange Traded Fund
REITs—Real Estate Investment Trusts
| * | Non-income producing security. |
| (a) | All or a portion of security is on loan. The aggregate market value of such securities, including those sold and pending settlement, is $58,431,687; cash collateral of $59,774,109 (included in liabilities) was received with which the Fund purchased highly liquid short-term investments. |
| (b) | Represents security purchased with cash collateral received for securities on loan and includes dividend reinvestment. |
| (w) | PGIM Investments LLC, the manager of the Fund, also serves as manager of the PGIM Core Ultra Short Bond Fund and PGIM Institutional Money Market Fund. |
Fair Value Measurements:
Various inputs are used in determining the value of the Fund’s investments. These inputs are summarized in the three broad levels listed below.
Level 1—unadjusted quoted prices generally in active markets for identical securities.
Level 2—quoted prices for similar securities, interest rates and yield curves, prepayment speeds, foreign currency exchange rates and other observable inputs.
Level 3—unobservable inputs for securities valued in accordance with Board approved fair valuation procedures.
See Notes to Financial Statements.
The following is a summary of the inputs used as of October 31, 2018 in valuing such portfolio securities:
| | | | | | | | | | | | |
| | | Level 1 | | | Level 2 | | | Level 3 | |
Investments in Securities | | | | | | | | | | | | |
Common Stocks | | | | | | | | | | | | |
Airlines | | $ | 20,115,691 | | | $ | — | | | $ | — | |
Auto Components | | | 23,812,306 | | | | — | | | | — | |
Banks | | | 75,938,539 | | | | — | | | | — | |
Beverages | | | 9,510,400 | | | | — | | | | — | |
Biotechnology | | | 864,708 | | | | — | | | | — | |
Building Products | | | 5,951,293 | | | | — | | | | — | |
Capital Markets | | | 6,974,303 | | | | — | | | | — | |
Chemicals | | | 20,644,764 | | | | — | | | | — | |
Construction & Engineering | | | 13,767,983 | | | | — | | | | — | |
Consumer Finance | | | 30,058,386 | | | | — | | | | — | |
Containers & Packaging | | | 16,087,482 | | | | — | | | | — | |
Diversified Financial Services | | | 16,671,352 | | | | — | | | | — | |
Diversified Telecommunication Services | | | 10,741,056 | | | | — | | | | — | |
Electric Utilities | | | 46,094,573 | | | | — | | | | — | |
Electrical Equipment | | | 6,589,230 | | | | — | | | | — | |
Entertainment | | | 8,689,109 | | | | — | | | | — | |
Equity Real Estate Investment Trusts (REITs) | | | 72,582,778 | | | | — | | | | — | |
Food & Staples Retailing | | | 6,910,272 | | | | — | | | | — | |
Food Products | | | 21,203,016 | | | | — | | | | — | |
Health Care Providers & Services | | | 27,079,251 | | | | — | | | | — | |
Hotels, Restaurants & Leisure | | | 14,929,848 | | | | — | | | | — | |
Household Durables | | | 35,152,083 | | | | — | | | | — | |
Independent Power & Renewable Electricity Producers | | | 8,730,504 | | | | — | | | | — | |
Insurance | | | 57,553,049 | | | | — | | | | — | |
Internet & Direct Marketing Retail | | | 7,286,274 | | | | — | | | | — | |
IT Services | | | 7,057,227 | | | | — | | | | — | |
Machinery | | | 17,695,036 | | | | — | | | | — | |
Media | | | 27,977,537 | | | | — | | | | — | |
Metals & Mining | | | 37,139,251 | | | | — | | | | — | |
Mortgage Real Estate Investment Trusts (REITs) | | | 36,524,348 | | | | — | | | | — | |
Multiline Retail | | | 11,673,395 | | | | — | | | | — | |
Multi-Utilities | | | 4,507,159 | | | | — | | | | — | |
Oil, Gas & Consumable Fuels | | | 29,371,988 | | | | — | | | | — | |
Paper & Forest Products | | | 7,015,965 | | | | — | | | | — | |
Personal Products | | | 2,662,820 | | | | — | | | | — | |
Pharmaceuticals | | | 9,096,531 | | | | — | | | | — | |
Real Estate Management & Development | | | 12,109,960 | | | | — | | | | — | |
Road & Rail | | | 7,700,513 | | | | — | | | | — | |
Semiconductors & Semiconductor Equipment | | | 2,311,540 | | | | — | | | | — | |
Specialty Retail | | | 11,551,038 | | | | — | | | | — | |
Technology Hardware, Storage & Peripherals | | | 8,695,871 | | | | — | | | | — | |
Trading Companies & Distributors | | | 6,700,950 | | | | — | | | | — | |
See Notes to Financial Statements.
| | | | |
| PGIM QMA Mid-Cap Value Fund | | | 25 | |
Schedule of Investments (continued)
as of October 31, 2018
| | | | | | | | | | | | |
| | | Level 1 | | | Level 2 | | | Level 3 �� | |
Investments in Securities (continued) | | | | | | | | | | | | |
Common Stocks (continued) | | | | | | | | | | | | |
Transportation Infrastructure | | $ | 4,910,655 | | | $ | — | | | $ | — | |
Exchange Traded Fund | | | 1,063,117 | | | | — | | | | — | |
Affiliated Mutual Funds | | | 60,899,980 | | | | — | | | | — | |
| | | | | | | | | | | | |
Total | | $ | 870,603,131 | | | $ | — | | | $ | — | |
| | | | | | | | | | | | |
Industry Classification:
The industry classification of investments and liabilities in excess of other assets shown as a percentage of net assets as of October 31, 2018 were as follows (unaudited):
| | | | |
Banks | | | 9.4 | % |
Equity Real Estate Investment Trusts (REITs) | | | 9.0 | |
Affiliated Mutual Funds (7.4% represents investments purchased with collateral from securities on loan) | | | 7.5 | |
Insurance | | | 7.1 | |
Electric Utilities | | | 5.7 | |
Metals & Mining | | | 4.6 | |
Mortgage Real Estate Investment Trusts (REITs) | | | 4.5 | |
Household Durables | | | 4.3 | |
Consumer Finance | | | 3.7 | |
Oil, Gas & Consumable Fuels | | | 3.6 | |
Media | | | 3.5 | |
Health Care Providers & Services | | | 3.3 | |
Auto Components | | | 2.9 | |
Food Products | | | 2.6 | |
Chemicals | | | 2.5 | |
Airlines | | | 2.5 | |
Machinery | | | 2.2 | |
Diversified Financial Services | | | 2.1 | |
Containers & Packaging | | | 2.0 | |
Hotels, Restaurants & Leisure | | | 1.8 | |
Construction & Engineering | | | 1.7 | |
Real Estate Management & Development | | | 1.5 | |
Multiline Retail | | | 1.4 | |
Specialty Retail | | | 1.4 | |
Diversified Telecommunication Services | | | 1.3 | |
Beverages | | | 1.2 | % |
Pharmaceuticals | | | 1.1 | |
Independent Power & Renewable Electricity Producers | | | 1.1 | |
Technology Hardware, Storage & Peripherals | | | 1.1 | |
Entertainment | | | 1.1 | |
Road & Rail | | | 0.9 | |
Internet & Direct Marketing Retail | | | 0.9 | |
IT Services | | | 0.9 | |
Paper & Forest Products | | | 0.9 | |
Capital Markets | | | 0.9 | |
Food & Staples Retailing | | | 0.9 | |
Trading Companies & Distributors | | | 0.8 | |
Electrical Equipment | | | 0.8 | |
Building Products | | | 0.7 | |
Transportation Infrastructure | | | 0.6 | |
Multi-Utilities | | | 0.6 | |
Personal Products | | | 0.3 | |
Semiconductors & Semiconductor Equipment | | | 0.3 | |
Exchange Traded Fund | | | 0.2 | |
Biotechnology | | | 0.1 | |
| | | | |
| | | 107.5 | |
Liabilities in excess of other assets | | | (7.5 | ) |
| | | | |
| | | 100.0 | % |
| | | | |
Financial Instruments/Transactions—Summary of Offsetting and Netting Arrangements:
The Fund entered into financial instruments/transactions during the reporting period that are either offset in accordance with current requirements or are subject to enforceable master netting arrangements or similar agreements that permit offsetting. The information about offsetting and related netting arrangements for financial instruments/transactions, where the legal right to set-off exists, is presented in the summary below.
See Notes to Financial Statements.
Offsetting of financial instrument/transaction assets and liabilities:
| | | | | | | | | | | | |
Description | | Gross
Market
Value of
Recognized
Assets/
(Liabilities) | | | Collateral
Pledged/
(Received)(1) | | | Net Amount | |
Securities on Loan | | $ | 58,431,687 | | | $ | (58,431,687 | ) | | $ | — | |
| | | | | | | | | | | | |
| (1) | Collateral amount disclosed by the Fund is limited to the market value of financial instruments/transactions. |
See Notes to Financial Statements.
| | | | |
| PGIM QMA Mid-Cap Value Fund | | | 27 | |
Statement of Assets & Liabilities
as of October 31, 2018
| | | | |
Assets | | | | |
Investments at value, including securities on loan of $58,431,687: | | | | |
Unaffiliated investments (cost $829,522,314) | | $ | 809,703,151 | |
Affiliated investments (cost $60,901,181) | | | 60,899,980 | |
Dividends and interest receivable | | | 835,416 | |
Receivable for Fund shares sold | | | 811,117 | |
Receivable for investments sold | | | 1,907 | |
Prepaid expenses | | | 7,300 | |
| | | | |
Total Assets | | | 872,258,871 | |
| | | | |
| |
Liabilities | | | | |
Payable to broker for collateral for securities on loan | | | 59,774,109 | |
Payable for Fund shares reacquired | | | 1,374,658 | |
Management fee payable | | | 472,146 | |
Accrued expenses and other liabilities | | | 310,824 | |
Distribution fee payable | | | 89,923 | |
Affiliated transfer agent fee payable | | | 44,114 | |
| | | | |
Total Liabilities | | | 62,065,774 | |
| | | | |
| |
Net Assets | | $ | 810,193,097 | |
| | | | |
| | | | | |
Net assets were comprised of: | | | | |
Common stock, at par | | $ | 40,260 | |
Paid-in capital in excess of par | | | 762,926,889 | |
Total distributable earnings (loss) | | | 47,225,948 | |
| | | | |
Net assets, October 31, 2018 | | $ | 810,193,097 | |
| | | | |
See Notes to Financial Statements.
| | | | |
Class A | | | | |
Net asset value and redemption price per share,
($219,477,124 ÷ 10,880,785 shares of common stock issued and outstanding) | | $ | 20.17 | |
Maximum sales charge (5.50% of offering price) | | | 1.17 | |
| | | | |
Maximum offering price to public | | $ | 21.34 | |
| | | | |
| |
Class B | | | | |
Net asset value, offering price and redemption price per share, ($3,607,546 ÷ 208,407 shares of common stock issued and outstanding) | | $ | 17.31 | |
| | | | |
| |
Class C | | | | |
Net asset value, offering price and redemption price per share, ($42,594,984 ÷ 2,470,883 shares of common stock issued and outstanding) | | $ | 17.24 | |
| | | | |
| |
Class R | | | | |
Net asset value, offering price and redemption price per share, ($797,811 ÷ 39,299 shares of common stock issued and outstanding) | | $ | 20.30 | |
| | | | |
| |
Class Z | | | | |
Net asset value, offering price and redemption price per share, ($340,961,612 ÷ 16,711,952 shares of common stock issued and outstanding) | | $ | 20.40 | |
| | | | |
| |
Class R2 | | | | |
Net asset value, offering price and redemption price per share, ($48,122 ÷ 2,371 shares of common stock issued and outstanding) | | $ | 20.29 | |
| | | | |
| |
Class R4 | | | | |
Net asset value, offering price and redemption price per share, ($8,965 ÷ 441 shares of common stock issued and outstanding) | | $ | 20.33 | |
| | | | |
| |
Class R6 | | | | |
Net asset value, offering price and redemption price per share, ($202,696,933 ÷ 9,945,525 shares of common stock issued and outstanding) | | $ | 20.38 | |
| | | | |
See Notes to Financial Statements.
| | | | |
| PGIM QMA Mid-Cap Value Fund | | | 29 | |
Statement of Operations
Year Ended October 31, 2018
| | | | |
Net Investment Income (Loss) | | | | |
Income | | | | |
Unaffiliated dividend income (net of $1,615 foreign withholding tax) | | $ | 23,292,783 | |
Income from securities lending, net (including affiliated income of $31,160) | | | 96,876 | |
Affiliated dividend income | | | 52,732 | |
| | | | |
Total income | | | 23,442,391 | |
| | | | |
| |
Expenses | | | | |
Management fee | | | 7,403,298 | |
Distribution fee(a) | | | 1,355,990 | |
Shareholder servicing fees(a) | | | 22 | |
Transfer agent’s fees and expenses (including affiliated expense of $245,950)(a) | | | 1,218,009 | |
Registration fees(a) | | | 126,786 | |
Custodian and accounting fees | | | 104,589 | |
Shareholders’ reports | | | 66,291 | |
Legal fees and expenses | | | 30,621 | |
Audit fee | | | 23,812 | |
Directors’ fees | | | 23,296 | |
Miscellaneous | | | 47,421 | |
| | | | |
Total expenses | | | 10,400,135 | |
Less: Fee waiver and/or expense reimbursement(a) | | | (688,307 | ) |
Distribution fee waiver(a) | | | (131,726 | ) |
| | | | |
Net expenses | | | 9,580,102 | |
| | | | |
Net investment income (loss) | | | 13,862,289 | |
| | | | |
| |
Realized And Unrealized Gain (Loss) On Investments | | | | |
Net realized gain (loss) on investment transactions (including affiliated of $(3,362)) | | | 63,682,339 | |
Net change in unrealized appreciation (depreciation) on investments (including affiliated of $(2,295)) | | | (101,360,207 | ) |
| | | | |
Net gain (loss) on investment transactions | | | (37,677,868 | ) |
| | | | |
Net Increase (Decrease) In Net Assets Resulting From Operations | | $ | (23,815,579 | ) |
| | | | |
(a) Class specific expenses and waivers were as follows:
| | | | | | | | | | | | | | | | | | | | | | | | | | | | | | | | |
| | | Class A | | | Class B | | | Class C | | | Class R | | | Class Z | | | Class R2 | | | Class R4 | | | Class R6 | |
Distribution fee | | | 777,039 | | | | 47,887 | | | | 524,376 | | | | 6,657 | | | | — | | | | 31 | | | | — | | | | — | |
Shareholder servicing fees | | | — | | | | — | | | | — | | | | — | | | | — | | | | 13 | | | | 9 | | | | — | |
Transfer agent’s fees and expenses | | | 509,494 | | | | 12,132 | | | | 62,742 | | | | 953 | | | | 627,614 | | | | 91 | | | | 115 | | | | 4,868 | |
Registration fees | | | 15,813 | | | | 13,876 | | | | 14,226 | | | | 15,453 | | | | 15,592 | | | | 18,281 | | | | 18,281 | | | | 15,264 | |
Fee waiver and/or expense reimbursement | | | (260,584 | ) | | | (20,133 | ) | | | (29,882 | ) | | | (15,539 | ) | | | (207,927 | ) | | | (18,360 | ) | | | (18,386 | ) | | | (117,496 | ) |
Distribution fee waiver | | | (129,507 | ) | | | — | | | | — | | | | (2,219 | ) | | | — | | | | — | | | | — | | | | — | |
See Notes to Financial Statements.
Statements of Changes in Net Assets
| | | | | | | | |
| | | Year Ended October 31, | |
| | | 2018 | | | 2017 | |
Increase (Decrease) in Net Assets | | | | | | | | |
Operations | | | | | | | | |
Net investment income (loss) | | $ | 13,862,289 | | | $ | 12,461,669 | |
Net realized gain (loss) on investment transactions | | | 63,682,339 | | | | 43,520,843 | |
Net change in unrealized appreciation (depreciation) on investments | | | (101,360,207 | ) | | | 78,815,689 | |
| | | | | | | | |
Net increase (decrease) in net assets resulting from operations | | | (23,815,579 | ) | | | 134,798,201 | |
| | | | | | | | |
| | |
Dividends and Distributions | | | | | | | | |
Distributions from distributable earnings* | | | | | | | | |
Class A | | | (16,797,692 | ) | | | — | |
Class B | | | (346,004 | ) | | | — | |
Class C | | | (3,688,598 | ) | | | — | |
Class R | | | (39,342 | ) | | | — | |
Class Z | | | (27,750,947 | ) | | | — | |
Class R6 | | | (11,572,792 | ) | | | — | |
| | | | | | | | |
| | | (60,195,375 | ) | | | — | |
| | | | | | | | |
Dividends from net investment income | | | | | | | | |
Class A | | | | | | | (3,537,716 | ) |
Class B | | | | | | | (49,664 | ) |
Class C | | | | | | | (453,120 | ) |
Class R | | | | | | | (978 | ) |
Class Z | | | | | | | (5,075,587 | ) |
Class R6 | | | | | | | (1,534,170 | ) |
| | | | | | | | |
| | | * | | | | (10,651,235 | ) |
| | | | | | | | |
Distributions from net realized gains | | | | | | | | |
Class A | | | | | | | (5,277,818 | ) |
Class B | | | | | | | (133,950 | ) |
Class C | | | | | | | (1,222,132 | ) |
Class R | | | | | | | (1,778 | ) |
Class Z | | | | | | | (6,393,200 | ) |
Class R6 | | | | | | | (1,757,938 | ) |
| | | | | | | | |
| | | * | | | | (14,786,816 | ) |
| | | | | | | | |
See Notes to Financial Statements.
| | | | |
| PGIM QMA Mid-Cap Value Fund | | | 31 | |
Statements of Changes in Net Assets (continued)
| | | | | | | | |
| | | Year Ended October 31, | |
| | | 2018 | | | 2017 | |
Fund share transactions (Net of share conversions) | | | | | | | | |
Net proceeds from shares sold | | $ | 234,464,958 | | | $ | 316,571,892 | |
Net asset value of shares issued in reinvestment of dividends and distributions | | | 56,283,538 | | | | 24,063,415 | |
Cost of shares reacquired | | | (320,011,962 | ) | | | (295,887,309 | ) |
| | | | | | | | |
Net increase (decrease) in net assets from Fund share transactions | | | (29,263,466 | ) | | | 44,747,998 | |
| | | | | | | | |
Total increase (decrease) | | | (113,274,420 | ) | | | 154,108,148 | |
| | |
Net Assets: | | | | | | | | |
Beginning of year | | | 923,467,517 | | | | 769,359,369 | |
| | | | | | | | |
End of year(a) | | $ | 810,193,097 | | | $ | 923,467,517 | |
| | | | | | | | |
(a) Includes undistributed/(distributions in excess of) net investment income of: | | $ | | * | | $ | 9,233,432 | |
| | | | | | | | |
| * | For the year ended October 31, 2018, the Fund has adopted amendments to Regulation S-X (refer to Note 9). |
See Notes to Financial Statements.
Notes to Financial Statements
Prudential Investment Portfolios, Inc. 10 (the “Company”) is registered under the Investment Company Act of 1940, as amended (“1940 Act”), as an open-end management investment company. The Company was organized on March 5, 1997, as a Maryland Corporation and operates as a series company. The Company consists of two funds: PGIM Jennison Equity Income Fund and PGIM QMA Mid-Cap Value Fund, each of which are diversified funds. These financial statements relate only to the PGIM QMA Mid-Cap Value Fund (the “Fund”). Effective June 11, 2018, the names of the Fund and the other funds which comprise the Company were changed by replacing “Prudential” with “PGIM” and each fund’s Class Q shares were renamed Class R6 shares.
The investment objective of the Fund is capital growth.
1. Accounting Policies
The Fund follows the investment company accounting and reporting guidance of the Financial Accounting Standards Board (“FASB”) Accounting Standard Codification (“ASC”) Topic 946 Financial Services—Investment Companies. The following accounting policies conform to U.S. generally accepted accounting principles. The Fund consistently follows such policies in the preparation of its financial statements.
Securities Valuation: The Fund holds securities and other assets and liabilities that are fair valued at the close of each day (generally, 4:00 PM Eastern time) the New York Stock Exchange (“NYSE”) is open for trading. Fair value is the price that would be received to sell an asset or paid to transfer a liability in an orderly transaction between market participants on the measurement date. The Company’s Board of Directors (the “Board”) has adopted valuation procedures for security valuation under which fair valuation responsibilities have been delegated to PGIM Investments LLC (“PGIM Investments” or the “Manager”). Pursuant to the Board’s delegation, a Valuation Committee has been established as two persons, being one or more officers of the Company, including: the Company’s Treasurer (or the Treasurer’s direct reports); and the Company’s Chief or Deputy Chief Compliance Officer (or Vice-President-level direct reports of the Chief or Deputy Chief Compliance Officer). Under the current valuation procedures, the Valuation Committee of the Board is responsible for supervising the valuation of portfolio securities and other assets and liabilities. The valuation procedures permit the Fund to utilize independent pricing vendor services, quotations from market makers, and alternative valuation methods when market quotations are either not readily available or not deemed representative of fair value. A record of the Valuation Committee’s actions is subject to the Board’s review, approval, and ratification at its next regularly scheduled quarterly meeting.
For the fiscal reporting period-end, securities and other assets and liabilities were fair valued at the close of the last U.S. business day. Trading in certain foreign securities may occur
| | | | |
| PGIM QMA Mid-Cap Value Fund | | | 33 | |
Notes to Financial Statements (continued)
when the NYSE is closed (including weekends and holidays). Because such foreign securities trade in markets that are open on weekends and U.S. holidays, the values of some of the Fund’s foreign investments may change on days when investors cannot purchase or redeem Fund shares.
Various inputs determine how the Fund’s investments are valued, all of which are categorized according to the three broad levels (Level 1, 2, or 3) detailed in the Schedule of Investments and referred to herein as the “fair value hierarchy” in accordance with FASB ASC Topic 820—Fair Value Measurements and Disclosures.
Common and preferred stocks, exchange-traded funds, and derivative instruments, such as futures or options, that are traded on a national securities exchange are valued at the last sale price as of the close of trading on the applicable exchange where the security principally trades. Securities traded via NASDAQ are valued at the NASDAQ official closing price. To the extent these securities are valued at the last sale price or NASDAQ official closing price, they are classified as Level 1 in the fair value hierarchy. In the event that no sale or official closing price on valuation date exists, these securities are generally valued at the mean between the last reported bid and ask prices, or at the last bid price in the absence of an ask price. These securities are classified as Level 2 in the fair value hierarchy.
Investments in open-end, non-exchange-traded mutual funds are valued at their net asset values as of the close of the NYSE on the date of valuation. These securities are classified as Level 1 in the fair value hierarchy since they may be purchased or sold at their net asset values on the date of valuation.
Securities and other assets that cannot be priced according to the methods described above are valued based on pricing methodologies approved by the Board. In the event that unobservable inputs are used when determining such valuations, the securities will be classified as Level 3 in the fair value hierarchy.
When determining the fair value of securities, some of the factors influencing the valuation include: the nature of any restrictions on disposition of the securities; assessment of the general liquidity of the securities; the issuer’s financial condition and the markets in which it does business; the cost of the investment; the size of the holding and the capitalization of the issuer; the prices of any recent transactions or bids/offers for such securities or any comparable securities; any available analyst media or other reports or information deemed reliable by the Manager regarding the issuer or the markets or industry in which it operates. Using fair value to price securities may result in a value that is different from a security’s most recent closing price and from the price used by other unaffiliated mutual funds to calculate their net asset values.
Restricted and Illiquid Securities: Subject to guidelines adopted by the Board, the Fund may invest up to 15% of its net assets in illiquid securities, including those which are restricted as to disposition under securities law (“restricted securities”). Restricted securities are valued pursuant to the valuation procedures noted above. Illiquid securities are those that, because of the absence of a readily available market or due to legal or contractual restrictions on resale, cannot be sold within seven days in the ordinary course of business at approximately the amount at which the Fund has valued the investment. Therefore, the Fund may find it difficult to sell illiquid securities at the time considered most advantageous by its subadviser and may incur transaction costs that would not be incurred in the sale of securities that were freely marketable. Certain securities that would otherwise be considered illiquid because of legal restrictions on resale to the general public may be traded among qualified institutional buyers under Rule 144A of the Securities Act of 1933. These Rule 144A securities, as well as commercial paper that is sold in private placements under Section 4(2) of the Securities Act, may be deemed liquid by the Fund’s subadviser under the guidelines adopted by the Board of the Company. However, the liquidity of the Fund’s investments in Rule 144A securities could be impaired if trading does not develop or declines.
Master Netting Arrangements: The Company, on behalf of the Fund, is subject to various Master Agreements, or netting arrangements, with select counterparties. These are agreements which a subadviser may have negotiated and entered into on behalf of the Fund. A master netting arrangement between the Fund and the counterparty permits the Fund to offset amounts payable by the Fund to the same counterparty against amounts to be received; and by the receipt of collateral from the counterparty by the Fund to cover the Fund’s exposure to the counterparty. However, there is no assurance that such mitigating factors are easily enforceable. In addition to master netting arrangements, the right to set-off exists when all the conditions are met such that each of the parties owes the other determinable amounts, the reporting party has the right to set-off the amount owed with the amount owed by the other party, the reporting party intends to set-off and the right of set-off is enforceable by law. During the reporting period, there was no intention to settle on a net basis and all amounts are presented on a gross basis on the Statement of Assets and Liabilities.
Securities Lending: The Fund lends its portfolio securities to banks and broker-dealers. The loans are secured by collateral at least equal to the market value of the securities loaned. Collateral pledged by each borrower is invested in an affiliated money market fund and is marked to market daily, based on the previous day’s market value, such that the value of the collateral exceeds the value of the loaned securities. In the event of significant appreciation in value of securities on loan on the last business day of the reporting period, the financial statements may reflect a collateral value that is less than the market value of the loaned securities. Such shortfall is remedied as described above. Loans are subject to termination at the option of the borrower or the Fund. Upon termination of the loan, the borrower will return to the Fund securities identical to the loaned securities. Should the borrower of the securities fail financially, the Fund has the right to repurchase the securities in the open market using the collateral.
| | | | |
| PGIM QMA Mid-Cap Value Fund | | | 35 | |
Notes to Financial Statements (continued)
The Fund recognizes income, net of any rebate and securities lending agent fees, for lending its securities in the form of fees or interest on the investment of any cash received as collateral. The borrower receives all interest and dividends from the securities loaned and such payments are passed back to the lender in amounts equivalent thereto. The Fund also continues to recognize any unrealized gain (loss) in the market price of the securities loaned and on the change in the value of the collateral invested that may occur during the term of the loan. In addition, realized gain (loss) is recognized on changes in the value of the collateral invested upon liquidation of the collateral. Net earnings from securities lending are disclosed on the Statement of Operations as “Income from securities lending, net”.
Equity and Mortgage Real Estate Investment Trusts (collectively equity REITs): The Fund invests in equity REITs, which report information on the source of their distributions annually. Based on current and historical information, a portion of distributions received from equity REITs during the period is estimated to be dividend income, capital gain or return of capital and recorded accordingly. When material, these estimates are adjusted periodically when the actual source of distributions is disclosed by the equity REITs.
Master Limited Partnerships (MLPs): The Fund invests in MLPs. Distributions received from the Fund’s investment in MLPs generally are comprised of income and return of capital. The Fund records investment income and return of capital based on estimates made at the time such distributions are received. Such estimates are based on historical information available from each MLP and other industry sources. These estimates may subsequently be revised based on information received from MLPs after their respective tax reporting periods have concluded.
Securities Transactions and Net Investment Income: Securities transactions are recorded on the trade date. Realized gains (losses) from investment and currency transactions are calculated on the specific identification method. Dividend income is recorded on the ex-date. Expenses are recorded on an accrual basis, which may require the use of certain estimates by management that may differ from actual. Net investment income or loss (other than class specific expenses and waivers, which are allocated as noted below) and unrealized and realized gains (losses) are allocated daily to each class of shares based upon the relative proportion of adjusted net assets of each class at the beginning of the day. Class specific expenses and waivers, where applicable, are charged to the respective share classes. Class specific expenses include distribution fees and distribution fee waivers, shareholder servicing fees, transfer agent’s fees and expenses, registration fees and fee waivers and/or expense reimbursements, as applicable.
Taxes: It is the Fund’s policy to continue to meet the requirements of the Internal Revenue Code applicable to regulated investment companies and to distribute all of its taxable net investment income and capital gains, if any, to its shareholders. Therefore, no federal
income tax provision is required. Withholding taxes on foreign dividends, interest and capital gains, if any, are recorded, net of reclaimable amounts, at the time the related income is earned.
Dividends and Distributions: The Fund expects to pay dividends from net investment income and distributions from net realized capital gains, if any, annually. Dividends and distributions to shareholders, which are determined in accordance with federal income tax regulations and which may differ from generally accepted accounting principles, are recorded on the ex-date. Permanent book/tax differences relating to income and gain (loss) are reclassified amongst total distributable earnings (loss) and paid-in capital in excess of par, as appropriate.
Estimates: The preparation of financial statements requires management to make estimates and assumptions that affect the reported amounts and disclosures in the financial statements. Actual results could differ from those estimates.
2. Agreements
The Company, on behalf of the Fund, has a management agreement with PGIM Investments. Pursuant to this agreement, PGIM Investments has responsibility for all investment advisory services and supervises the subadviser’s performance of such services. In addition, under the management agreement, PGIM Investments provides all of the administrative functions necessary for the organization, operation and management of the Fund. PGIM Investments administers the corporate affairs of the Fund and, in connection therewith, furnishes the Fund with office facilities, together with those ordinary clerical and bookkeeping services which are not being furnished by the Fund’s custodian and the Fund’s transfer agent. PGIM Investments is also responsible for the staffing and management of dedicated groups of legal, marketing, compliance and related personnel necessary for the operation of the Fund. The legal, marketing, compliance and related personnel are also responsible for the management and oversight of the various service providers to the Fund, including, but not limited to, the custodian, transfer agent, and accounting agent.
PGIM Investments has entered into a subadvisory agreement with Quantitative Management Associates LLC (“QMA”). The subadvisory agreement provides that QMA will furnish investment advisory services in connection with the management of the Fund. In connection therewith, QMA is obligated to keep certain books and records of the Fund. PGIM Investments pays for the services of QMA, the cost of compensation of officers of the Fund, occupancy and certain clerical and bookkeeping costs of the Fund. The Fund bears all other costs and expenses.
Effective July 1, 2018, the management fee paid to PGIM Investments is accrued daily and payable monthly at an annual rate of 0.73% of the Fund’s average daily net assets up to $1 billion, 0.71% of the next $2 billion, 0.69% of the next $2 billion and 0.67% of the Fund’s average daily net assets in excess of $5 billion. Prior to July 1, 2018, the management fee paid to PGIM Investments was accrued daily and payable monthly at an
| | | | |
| PGIM QMA Mid-Cap Value Fund | | | 37 | |
Notes to Financial Statements
annual rate of 0.825% of the Fund’s average daily net assets up to $1 billion and 0.800% of the average daily net assets in excess of $1 billion. The effective management fee rate before any waivers and/or expense reimbursements was 0.794% for the year ended October 31, 2018.
Effective July 1, 2018, PGIM Investments has contractually agreed, through February 29, 2020, to limit total annual operating expenses after fee waivers and/or expense reimbursements to 1.13% of average daily net assets for Class A shares, 1.95% of average daily net assets for Class B shares, 1.95% of average daily net assets for Class C shares, 1.45% of average daily net assets for Class R shares, 0.95% of average daily net assets for Class Z shares, 1.23% of average daily net assets for Class R2 shares, 0.98% of average daily net assets for Class R4 shares, and 0.73% of average daily net assets for Class R6 shares. This contractual waiver excludes interest, brokerage, taxes (such as income and foreign withholding taxes, stamp duty and deferred tax expenses), acquired fund fees and expenses, extraordinary expenses, and certain other Fund expenses such as dividend and interest expense and broker charges on short sales. Expenses waived/reimbursed by the Manager in accordance with this agreement may be recouped by the Manager within the same fiscal year during which such waiver/reimbursement is made if such recoupment can be realized without exceeding the expense limit in effect at the time of the recoupment for that fiscal year.
Where applicable, PGIM Investments has voluntarily agreed through June 30, 2018, to waive management fees or shared operating expenses on any share class to the same extent that it waives similar expenses on any other share class and, in addition, total annual operating expenses for Class R6 shares will not exceed total annual operating expenses for Class Z shares. Effective July 1, 2018 this voluntary agreement became part of the Fund’s contractual waiver agreement through February 29, 2020 and is subject to recoupment by the Manager within the same fiscal year during which such wavier/reimbursement is made if such recoupment can be realized without exceeding the expense limit in effect at the time of the recoupment for that fiscal year. Prior to July 1, 2018, PGIM Investments had contractually agreed to limit total annual operating expenses after fee waivers and/or expense reimbursements to 1.20% of average daily net assets for Class A shares, 1.95% of average daily net assets for Class B shares, 1.95% of average daily net assets for Class C shares, 1.45% of average daily net assets for Class R shares, 0.95% of average daily net assets for Class Z shares, 1.30% of average daily net assets for Class R2 shares, 1.05% of average daily net assets for Class R4 shares, and 0.80% of average daily net assets for Class R6 shares.
The Company, on behalf of the Fund, has a distribution agreement with Prudential Investment Management Services LLC (“PIMS”), which acts as the distributor of the Class A, Class B, Class C, Class R, Class Z, Class R2, Class R4 and Class R6 shares of the
Fund. The Fund compensates PIMS for distributing and servicing the Fund’s Class A, Class B, Class C, Class R and Class R2 shares, pursuant to the plans of distribution (the “Distribution Plans”), regardless of expenses actually incurred by PIMS. The distribution fees are accrued daily and payable monthly. No distribution or service fees are paid to PIMS as distributor of the Class Z, Class R4 and Class R6 shares of the Fund.
Pursuant to the Distribution Plans, the Fund compensates PIMS for distribution related activities at an annual rate of up to 0.30%, 1%, 1%, 0.75% and 0.25% of the average daily net assets of the Class A, Class B, Class C, Class R and Class R2 shares, respectively. PIMS has contractually agreed through February 29, 2020 to limit such fees to 0.25% and 0.50% of the average daily net assets of the Class A and Class R shares, respectively.
The Fund has adopted a Shareholder Services Plan with respect to Class R2 and Class R4 shares. Under the terms of the Shareholder Services Plan, Class R2 and Class R4 shares are authorized to pay to Prudential Mutual Fund Services LLC (“PMFS”), its affiliates or third-party service providers, as compensation for services rendered to the shareholders of such Class R2 or Class R4 shares, a shareholder service fee at an annual rate of 0.10% of the average daily net assets attributable to Class R2 and Class R4 shares. The shareholder service fee is accrued daily and paid monthly.
PIMS has advised the Fund that it received $125,794 in front-end sales charges resulting from sales of Class A shares during the year ended October 31, 2018. From these fees, PIMS paid such sales charges to broker-dealers, who in turn paid commissions to salespersons and incurred other distribution costs.
PIMS has advised the Fund that for the year ended October 31, 2018, it received $5,307 and $1,364 in contingent deferred sales charges imposed upon redemptions by certain Class B and Class C shareholders, respectively.
PGIM Investments, PIMS and QMA are indirect, wholly-owned subsidiaries of Prudential Financial, Inc. (“Prudential”).
3. Other Transactions with Affiliates
Prudential Mutual Fund Services LLC (“PMFS”), an affiliate of PGIM Investments and an indirect, wholly-owned subsidiary of Prudential, serves as the Fund’s transfer agent. Transfer agent’s fees and expenses in the Statement of Operations include certain out-of-pocket expenses paid to non-affiliates, where applicable.
The Fund may enter into certain securities purchase or sale transactions under Board approved Rule 17a-7 procedures. Rule 17a-7 is an exemptive rule under the 1940 Act, that, subject to certain conditions, permits purchase and sale transactions among affiliated investment companies, or between an investment company and a person that is affiliated solely by reason of having a common (or affiliated) investment adviser, common directors,
| | | | |
| PGIM QMA Mid-Cap Value Fund | | | 39 | |
Notes to Financial Statements (continued)
and/or common officers. Such transactions are subject to ratification by the Board. For the reporting period ended October 31, 2018, no such transactions were entered into by the Fund.
The Fund may invest its overnight sweep cash in the PGIM Core Ultra Short Bond Fund (the “Core Fund”), and its securities lending cash collateral in the PGIM Institutional Money Market Fund (the “Money Market Fund”), each a series of Prudential Investment Portfolios 2, registered under the 1940 Act and managed by PGIM Investments. For the reporting period ended October 31, 2018, PGIM, Inc. was compensated $17,934 by PGIM
Investments for managing the Fund’s securities lending cash collateral as subadviser to the Money Market Fund. Earnings from the Core Fund and Money Market Fund are disclosed on the Statement of Operations as “Affiliated dividend income” and “Income from securities lending, net”, respectively.
4. Portfolio Securities
The aggregate cost of purchases and proceeds from sales of portfolio securities (excluding short-term investments and U.S. Government securities) for the year ended October 31, 2018, were $717,565,018 and $787,227,635, respectively.
A summary of the cost of purchases and proceeds from sales of shares of affiliated mutual funds for the year ended October 31, 2018, is presented as follows:
| | | | | | | | | | | | | | | | | | | | | | | | | | | | | | |
Value, Beginning of Year | | | Cost of
Purchases | | | Proceeds
from Sales | | | Change in
Unrealized
Gain
(Loss) | | | Realized
Gain
(Loss) | | | Value,
End of Year | | | Shares,
End
of Year | | | Income | |
| | PGIM Core Ultra Short Bond Fund* | | | | | | | | | | | | | |
| $ | 4,243,639 | | | $ | 129,787,357 | | | $ | 132,965,028 | | | $ | — | | | $ | — | | | $ | 1,065,968 | | | | 1,065,968 | | | $ | 52,732 | |
| | | |
| | PGIM Institutional Money Market Fund* | | | | | | | | | | | | | |
| | 37,960,058 | | | | 286,812,076 | | | | 264,932,466 | | | | (2,294 | ) | | | (3,362 | ) | | | 59,834,012 | | | | 59,834,012 | | | | 31,160 | ** |
| | | | | | | | | | | | | | | | | | | | | | | | | | | | | | |
| $ | 42,203,697 | | | $ | 416,599,433 | | | $ | 397,897,494 | | | $ | (2,294 | ) | | $ | (3,362 | ) | | $ | 60,899,980 | | | | | | | $ | 83,892 | |
| | | | | | | | | | | | | | | | | | | | | | | | | | | | | | |
| * | The Fund did not have any capital gain distributions during the reporting period. |
| ** | This amount is included in “Income from securities lending, net” on the Statement of Operations. |
5. Distributions and Tax Information
Distributions to shareholders, which are determined in accordance with federal income tax regulations and which may differ from generally accepted accounting principles, are recorded on the ex-date.
For the year ended October 31, 2018, the tax character of dividends paid by the Fund were $57,903,538 of ordinary income and $2,291,837 of long-term capital gains. For the year ended October 31, 2017, the tax character of dividends paid by the Fund were $18,584,086 of ordinary income and $6,853,965 of long-term capital gains.
As of October 31, 2018, the accumulated undistributed earnings on a tax basis were $32,710,295 of ordinary income and $40,841,880 of long-term capital gains.
The United States federal income tax basis of the Fund’s investments and the net unrealized depreciation as of October 31, 2018 were as follows:
| | | | | | |
Tax Basis | | Gross Unrealized Appreciation | | Gross Unrealized Depreciation | | Net Unrealized Depreciation |
| $896,929,358 | | $56,019,004 | | $(82,345,231) | | $(26,326,227) |
The book basis differs from tax basis primarily due to deferred losses on wash sales and other cost basis adjustments.
Management has analyzed the Fund’s tax positions taken on federal, state and local income tax returns for all open tax years and has concluded that no provision for income tax is required in the Fund’s financial statements for the current reporting period. The Fund’s federal, state and local income and federal excise tax returns for tax years for which the applicable statutes of limitations have not expired are subject to examination by the Internal Revenue Service and state departments of revenue.
6. Capital and Ownership
The Fund offers Class A, Class B, Class C, Class R, Class Z, Class R2, Class R4 and Class R6 shares. Class A shares are sold with a maximum front-end sales charge of 5.50%. Investors who purchase $1 million or more of Class A shares and sell these shares within 12 months of purchase are subject to a contingent deferred sales charge (“CDSC”) of 1%, although they are not subject to an initial sales charge. The Class A CDSC is waived for certain retirement and/or benefit plans. A special exchange privilege is also available for shareholders who qualified to purchase Class A shares at net asset value. Class B shares are sold with a CDSC which declines from 5% to zero depending on the period of time the shares are held. Class B shares will automatically convert to Class A shares on a quarterly basis approximately seven years after purchase. Class B shares are closed to new purchases. Class C shares are sold with a CDSC of 1% on sales made within 12 months of purchase. Class R, Class Z, Class R2, Class R4 and Class R6 shares are not subject to any sales or redemption charge and are available exclusively for sale to a limited group of investors.
Under certain circumstances, an exchange may be made from specified share classes of the Fund to one or more other share classes of the Fund as presented in the table of transactions in shares of common stock.
| | | | |
| PGIM QMA Mid-Cap Value Fund | | | 41 | |
Notes to Financial Statements (continued)
The authorized capital stock of the Company is 5.5 billion shares, with a par value of $0.001 per share. Of the Company’s authorized capital stock, 800 million authorized shares have been allocated to the Fund and divided into nine classes, designated Class A, Class B, Class C, Class R, Class Z, Class R2, Class R4, Class T and Class R6 common stock, each of which consists of 100 million, 5 million, 30 million, 75 million, 175 million, 75 million, 75 million, 75 million and 190 million authorized shares, respectively. The Fund currently does not have any Class T shares outstanding.
As of October 31, 2018, Prudential, through its affiliated entities, including affiliated funds (if applicable), owned 558 Class R shares, 441 Class R2 shares, 441 Class R4 shares and 530,994 Class R6 shares of the Fund. At reporting period end, two shareholders of record held 16% of the Fund’s outstanding shares on behalf of multiple beneficial owners.
Transactions in shares of common stock were as follows:
| | | | | | | | |
Class A | | Shares | | | Amount | |
Year ended October 31, 2018: | | | | | | | | |
Shares sold | | | 1,550,466 | | | $ | 34,408,657 | |
Shares issued in reinvestment of dividends and distributions | | | 663,954 | | | | 14,792,904 | |
Shares reacquired | | | (3,071,311 | ) | | | (68,066,084 | ) |
| | | | | | | | |
Net increase (decrease) in shares outstanding before conversion | | | (856,891 | ) | | | (18,864,523 | ) |
Shares issued upon conversion from other share class(es) | | | 62,781 | | | | 1,395,218 | |
Shares reacquired upon conversion into other share class(es) | | | (380,259 | ) | | | (8,366,084 | ) |
| | | | | | | | |
Net increase (decrease) in shares outstanding | | | (1,174,369 | ) | | $ | (25,835,389 | ) |
| | | | | | | | |
Year ended October 31, 2017: | | | | | | | | |
Shares sold | | | 2,699,895 | | | $ | 58,412,501 | |
Shares issued in reinvestment of dividends and distributions | | | 362,805 | | | | 7,749,518 | |
Shares reacquired | | | (3,683,686 | ) | | | (79,686,902 | ) |
| | | | | | | | |
Net increase (decrease) in shares outstanding before conversion | | | (620,986 | ) | | | (13,524,883 | ) |
Shares issued upon conversion from other share class(es) | | | 132,694 | | | | 2,877,139 | |
Shares reacquired upon conversion into other share class(es) | | | (1,470,100 | ) | | | (32,156,267 | ) |
| | | | | | | | |
Net increase (decrease) in shares outstanding | | | (1,958,392 | ) | | $ | (42,804,011 | ) |
| | | | | | | | |
Schedule of Investments (continued)
as of October 31, 2018
| | | | | | | | |
Class B | | Shares | | | Amount | |
Year ended October 31, 2018: | | | | | | | | |
Shares sold | | | 16,601 | | | $ | 326,735 | |
Shares issued in reinvestment of dividends and distributions | | | 16,841 | | | | 324,191 | |
Shares reacquired | | | (71,112 | ) | | | (1,346,173 | ) |
| | | | | | | | |
Net increase (decrease) in shares outstanding before conversion | | | (37,670 | ) | | | (695,247 | ) |
Shares reacquired upon conversion into other share class(es) | | | (31,661 | ) | | | (616,083 | ) |
| | | | | | | | |
Net increase (decrease) in shares outstanding | | | (69,331 | ) | | $ | (1,311,330 | ) |
| | | | | | | | |
Year ended October 31, 2017: | | | | | | | | |
Shares sold | | | 73,367 | | | $ | 1,384,120 | |
Shares issued in reinvestment of dividends and distributions | | | 8,765 | | | | 163,466 | |
Shares reacquired | | | (123,589 | ) | | | (2,331,642 | ) |
| | | | | | | | |
Net increase (decrease) in shares outstanding before conversion | | | (41,457 | ) | | | (784,056 | ) |
Shares reacquired upon conversion into other share class(es) | | | (37,561 | ) | | | (713,160 | ) |
| | | | | | | | |
Net increase (decrease) in shares outstanding | | | (79,018 | ) | | $ | (1,497,216 | ) |
| | | | | | | | |
Class C | | | | | | |
Year ended October 31, 2018: | | | | | | | | |
Shares sold | | | 116,594 | | | $ | 2,223,483 | |
Shares issued in reinvestment of dividends and distributions | | | 182,413 | | | | 3,495,035 | |
Shares reacquired | | | (600,932 | ) | | | (11,412,345 | ) |
| | | | | | | | |
Net increase (decrease) in shares outstanding before conversion | | | (301,925 | ) | | | (5,693,827 | ) |
Shares reacquired upon conversion into other share class(es) | | | (169,484 | ) | | | (3,184,495 | ) |
| | | | | | | | |
Net increase (decrease) in shares outstanding | | | (471,409 | ) | | $ | (8,878,322 | ) |
| | | | | | | | |
Year ended October 31, 2017: | | | | | | | | |
Shares sold | | | 599,122 | | | $ | 11,285,262 | |
Shares issued in reinvestment of dividends and distributions | | | 83,944 | | | | 1,558,834 | |
Shares reacquired | | | (692,314 | ) | | | (12,964,291 | ) |
| | | | | | | | |
Net increase (decrease) in shares outstanding before conversion | | | (9,248 | ) | | | (120,195 | ) |
Shares reacquired upon conversion into other share class(es) | | | (307,691 | ) | | | (5,746,546 | ) |
| | | | | | | | |
Net increase (decrease) in shares outstanding | | | (316,939 | ) | | $ | (5,866,741 | ) |
| | | | | | | | |
Class R | | | | | | |
Year ended October 31, 2018: | | | | | | | | |
Shares sold | | | 35,853 | | | $ | 802,404 | |
Shares issued in reinvestment of dividends and distributions | | | 1,751 | | | | 39,341 | |
Shares reacquired | | | (31,385 | ) | | | (705,415 | ) |
| | | | | | | | |
Net increase (decrease) in shares outstanding | | | 6,219 | | | $ | 136,330 | |
| | | | | | | | |
Year ended October 31, 2017: | | | | | | | | |
Shares sold | | | 29,402 | | | $ | 636,648 | |
Shares issued in reinvestment of dividends and distributions | | | 128 | | | | 2,756 | |
Shares reacquired | | | (978 | ) | | | (21,227 | ) |
| | | | | | | | |
Net increase (decrease) in shares outstanding | | | 28,552 | | | $ | 618,177 | |
| | | | | | | | |
| | | | |
| PGIM QMA Mid-Cap Value Fund | | | 43 | |
Notes to Financial Statements (continued)
| | | | | | | | |
Class Z | | Shares | | | Amount | |
Year ended October 31, 2018: | | | | | | | | |
Shares sold | | | 4,400,794 | | | $ | 98,167,907 | |
Shares issued in reinvestment of dividends and distributions | | | 1,159,824 | | | | 26,084,430 | |
Shares reacquired | | | (8,425,650 | ) | | | (187,815,467 | ) |
| | | | | | | | |
Net increase (decrease) in shares outstanding before conversion | | | (2,865,032 | ) | | | (63,563,130 | ) |
Shares issued upon conversion from other share class(es) | | | 512,238 | | | | 11,376,184 | |
Shares reacquired upon conversion into other share class(es) | | | (45,593 | ) | | | (1,008,202 | ) |
| | | | | | | | |
Net increase (decrease) in shares outstanding | | | (2,398,387 | ) | | $ | (53,195,148 | ) |
| | | | | | | | |
Year ended October 31, 2017: | | | | | | | | |
Shares sold | | | 6,905,027 | | | $ | 151,377,039 | |
Shares issued in reinvestment of dividends and distributions | | | 525,132 | | | | 11,311,347 | |
Shares reacquired | | | (7,168,269 | ) | | | (156,501,857 | ) |
| | | | | | | | |
Net increase (decrease) in shares outstanding before conversion | | | 261,890 | | | | 6,186,529 | |
Shares issued upon conversion from other share class(es) | | | 1,628,609 | | | | 35,884,210 | |
Shares reacquired upon conversion into other share class(es) | | | (14,960 | ) | | | (328,124 | ) |
| | | | | | | | |
Net increase (decrease) in shares outstanding | | | 1,875,539 | | | $ | 41,742,615 | |
| | | | | | | | |
Class R2 | | | | | | |
Period ended October 31, 2018*: | | | | | | | | |
Shares sold | | | 2,371 | | | $ | 52,753 | |
| | | | | | | | |
Net increase (decrease) in shares outstanding | | | 2,371 | | | $ | 52,753 | |
| | | | | | | | |
Class R4 | | | | | | |
Period ended October 31, 2018*: | | | | | | | | |
Shares sold | | | 441 | | | $ | 10,000 | |
| | | | | | | | |
Net increase (decrease) in shares outstanding | | | 441 | | | $ | 10,000 | |
| | | | | | | | |
Class R6 | | | | | | |
Year ended October 31, 2018: | | | | | | | | |
Shares sold | | | 4,424,882 | | | $ | 98,473,019 | |
Shares issued in reinvestment of dividends and distributions | | | 514,830 | | | | 11,547,637 | |
Shares reacquired | | | (2,281,991 | ) | | | (50,666,478 | ) |
| | | | | | | | |
Net increase (decrease) in shares outstanding before conversion | | | 2,657,721 | | | | 59,354,178 | |
Shares issued upon conversion from other share class(es) | | | 18,365 | | | | 403,462 | |
| | | | | | | | |
Net increase (decrease) in shares outstanding | | | 2,676,086 | | | $ | 59,757,640 | |
| | | | | | | | |
Year ended October 31, 2017: | | | | | | | | |
Shares sold | | | 4,269,492 | | | $ | 93,476,322 | |
Shares issued in reinvestment of dividends and distributions | | | 152,513 | | | | 3,277,494 | |
Shares reacquired | | | (2,043,665 | ) | | | (44,381,390 | ) |
| | | | | | | | |
Net increase (decrease) in shares outstanding before conversion | | | 2,378,340 | | | | 52,372,426 | |
Shares issued upon conversion from other share class(es) | | | 8,402 | | | | 182,748 | |
| | | | | | | | |
Net increase (decrease) in shares outstanding | | | 2,386,742 | | | $ | 52,555,174 | |
| | | | | | | | |
| * | Commencement of offering was December 28, 2017. |
7. Borrowings
The Company, on behalf of the Fund, along with other affiliated registered investment companies (the “Funds”), is a party to a Syndicated Credit Agreement (“SCA”) with a group of banks. The purpose of the SCA is to provide an alternative source of temporary funding for capital share redemptions. The SCA provides for a commitment of $900 million for the period October 4, 2018 through October 3, 2019. The Funds pay an annualized commitment fee of 0.15% of the unused portion of the SCA. The Fund’s portion of the commitment fee for the unused amount, allocated based upon a method approved by the Board, is accrued daily and paid quarterly. Prior to October 4, 2018, the Funds had another SCA that provided a commitment of $900 million and the Funds paid an annualized commitment fee of 0.15% of the unused portion of the SCA. The interest on borrowings under both SCAs is paid monthly and at a per annum interest rate based upon a contractual spread plus the higher of (1) the effective federal funds rate, (2) the 1-month LIBOR rate or (3) zero percent.
Other affiliated registered investment companies that are parties to the SCA include portfolios that are subject to a predetermined mathematical formula used to manage certain benefit guarantees offered under variable annuity contracts. The formula may result in large scale asset flows into and out of these portfolios. Consequently, these portfolios may be more likely to utilize the SCA for purposes of funding redemptions. It may be possible for those portfolios to fully exhaust the committed amount of the SCA, thereby requiring the Manager to allocate available funding per a Board-approved methodology designed to treat the Funds in the SCA equitably.
The Fund utilized the SCA during the reporting period ended October 31, 2018. The average daily balance for the 41 days that the Fund had loans outstanding during the period was $1,487,512, borrowed at a weighted average interest rate of 3.19%. The maximum loan balance outstanding during the period was $4,692,000. At October 31, 2018, the Fund did not have an outstanding loan balance.
8. Risks of Investing in the Fund
The Fund’s risks include, but are not limited to, some or all of the risks discussed below:
Equity and Equity-Related Securities Risks: The value of a particular security could go down and you could lose money. In addition to an individual security losing value, the value of the equity markets or a sector in which the Fund invests could go down. The Fund’s holdings can vary significantly from broad market indexes and the performance of the Fund can deviate from the performance of these indexes. Different parts of a market can react differently to adverse issuer, market, regulatory, political and economic developments.
Risks of Investing in Equity and Mortgage Real Estate Investment Trusts (collectively equity REITs): Real estate securities are subject to similar risks as direct investments in real estate and mortgages, and their value will depend on the value of the underlying properties or the underlying loans or interests. The underlying loans may be subject to the risks of default or
| | | | |
| PGIM QMA Mid-Cap Value Fund | | | 45 | |
Notes to Financial Statements (continued)
of payments that occur earlier or later than expected, and such loans may also include so-called “subprime” mortgages. The value of these securities will rise and fall in response to many factors, Including economic conditions, the demand for rental property and interest rates. In particular, the value of these securities may decline when interest rates rise and will also be affected by the real estate market and by the management of the underlying properties.
In addition, investing in equity REITs involves certain unique risks in addition to those risks associated with investing in the real estate industry in general. Equity REITs may be affected by changes in the value of the underlying property owned by the equity REITs, while mortgage equity REITs may be affected by the quality of any credit extended. Equity REITs are dependent upon management skills, may not be diversified geographically or by property/mortgage asset type, and are subject to heavy cash flow dependency, default by borrowers and self-liquidation. Since equity REITs are relatively smaller in size when compared to the broader market, and smaller companies tend to be more volatile than larger companies, they may be more volatile and/or more illiquid than other types of equity securities. Equity REITs are subject to interest rate risks. Equity REITs may incur significant amounts of leverage. The Fund will indirectly bear a portion of the expenses, including management fees, paid by each equity REIT in which it invests, in addition to the expenses of the Fund.
9. Recent Accounting Pronouncements and Reporting Updates
In August 2018, the Securities and Exchange Commission (the “SEC”) adopted amendments to Regulation S-X to update and simplify the disclosure requirements for registered investment companies by eliminating requirements that are redundant or duplicative of US GAAP requirements or other SEC disclosure requirements. The new amendments require the presentation of the total, rather than the components, of distributable earnings on the Statement of Assets and Liabilities and the total, rather than the components, of dividends from net investment income and distributions from net realized gains on the Statements of Changes in Net Assets. The amendments also removed the requirement for the parenthetical disclosure of undistributed net investment income on the Statements of Changes in Net Assets and certain tax adjustments that were reflected in the Notes to Financial Statements. All of these have been reflected in the Fund’s financial statements.
In August 2018, the FASB issued Accounting Standards Update (“ASU”) No. 2018-13, which changes certain fair value measurement disclosure requirements. The new ASU, in addition to other modifications and additions, removes the requirement to disclose the amount and reasons for transfers between Level 1 and Level 2 of the fair value hierarchy, and the Fund’s policy for the timing of transfers between levels. The amendments are
effective for financial statements issued for fiscal years beginning after December 15, 2019, and interim periods within those fiscal years. Management has evaluated the implications of certain provisions of the ASU and has determined to early adopt aspects related to the removal and modification of certain fair value measurement disclosures under the ASU effective immediately. At this time, management is evaluating the implications of certain other provisions of the ASU related to new disclosure requirements and any impact on the financial statement disclosures has not yet been determined.
| | | | |
| PGIM QMA Mid-Cap Value Fund | | | 47 | |
Financial Highlights
| | | | | | | | | | | | | | | | | | | | |
| Class A Shares | | | | | | | | | | | | | | | |
| | | | | | Year Ended October 31, | | | | |
| | | 2018 | | | 2017 | | | 2016 | | | 2015 | | | 2014 | |
| Per Share Operating Performance(a): | | | | | | | | | | | | | | | | | | | | |
| Net Asset Value, Beginning of Year | | | $22.24 | | | | $19.48 | | | | $20.29 | | | | $21.57 | | | | $20.51 | |
| Income (loss) from investment operations: | | | | | | | | | | | | | | | | | | | | |
| Net investment income (loss) | | | 0.30 | | | | 0.28 | | | | 0.22 | | | | 0.23 | | | | 0.17 | |
| Net realized and unrealized gain (loss) on investment transactions | | | (0.95 | ) | | | 3.11 | | | | 0.34 | | | | (0.23 | ) | | | 2.92 | |
| Total from investment operations | | | (0.65 | ) | | | 3.39 | | | | 0.56 | | | | - | | | | 3.09 | |
| Less Dividends and Distributions: | | | | | | | | | | | | | | | | | | | | |
| Dividends from net investment income | | | (0.32 | ) | | | (0.25 | ) | | | (0.21 | ) | | | (0.12 | ) | | | (0.15 | ) |
| Distributions from net realized gains | | | (1.10 | ) | | | (0.38 | ) | | | (1.16 | ) | | | (1.16 | ) | | | (1.88 | ) |
| Total dividends and distributions | | | (1.42 | ) | | | (0.63 | ) | | | (1.37 | ) | | | (1.28 | ) | | | (2.03 | ) |
| Net asset value, end of year | | | $20.17 | | | | $22.24 | | | | $19.48 | | | | $20.29 | | | | $21.57 | |
| Total Return(b): | | | (3.54)% | | | | 17.56% | | | | 3.38% | | | | 0.15% | | | | 16.54% | |
| |
| Ratios/Supplemental Data: | |
| Net assets, end of year (000) | | | $219,477 | | | | $268,067 | | | | $272,964 | | | | $288,607 | | | | $218,957 | |
| Average net assets (000) | | | $259,013 | | | | $283,669 | | | | $277,601 | | | | $267,085 | | | | $159,125 | |
| Ratios to average net assets(c): | | | | | | | | | | | | | | | | | | | | |
| Expenses after waivers and/or expense reimbursement | | | 1.18% | | | | 1.21% | | | | 1.20% | | | | 1.21% | | | | 1.22% | |
| Expenses before waivers and/or expense reimbursement | | | 1.33% | | | | 1.34% | (d) | | | 1.34% | | | | 1.35% | | | | 1.42% | |
| Net investment income (loss) | | | 1.35% | | | | 1.31% | | | | 1.16% | | | | 1.09% | | | | 0.81% | |
| Portfolio turnover rate(e) | | | 78% | | | | 112% | | | | 87% | | | | 101% | | | | 87% | |
| (a) | Calculated based on average shares outstanding during the year. |
| (b) | Total return does not consider the effects of sales loads. Total return is calculated assuming a purchase of a share on the first day and a sale on the last day of each year reported and includes reinvestment of dividends and distributions, if any. Total returns may reflect adjustments to conform to generally accepted accounting principles. |
| (c) | Does not include expenses of the underlying funds in which the Fund invests. |
| (d) | Effective August 1, 2017, class specific expenses include transfer agent fees and expenses and registration fees, which are charged to their respective share class. |
| (e) | The Fund’s portfolio turnover rate is calculated in accordance with regulatory requirements, without regard to transactions involving short term investments and certain derivatives. If such transactions were included, the Fund’s portfolio turnover rate may be higher. |
See Notes to Financial Statements.
| | | | | | | | | | | | | | | | | | | | |
| Class B Shares | | | | | | | | | | | | | | | |
| | | Year Ended October 31, | |
| | | 2018 | | | 2017 | | | 2016 | | | 2015 | | | 2014 | |
| Per Share Operating Performance(a): | | | | | | | | | | | | | | | | | | | | |
| Net Asset Value, Beginning of Year | | | $19.29 | | | | $16.99 | | | | $17.88 | | | | $19.17 | | | | $18.46 | |
| Income (loss) from investment operations: | | | | | | | | | | | | | | | | | | | | |
| Net investment income (loss) | | | 0.11 | | | | 0.10 | | | | 0.07 | | | | 0.07 | | | | 0.02 | |
| Net realized and unrealized gain (loss) on investment transactions | | | (0.80 | ) | | | 2.72 | | | | 0.28 | | | | (0.20 | ) | | | 2.61 | |
| Total from investment operations | | | (0.69 | ) | | | 2.82 | | | | 0.35 | | | | (0.13 | ) | | | 2.63 | |
| Less Dividends and Distributions: | | | | | | | | | | | | | | | | | | | | |
| Dividends from net investment income | | | (0.19 | ) | | | (0.14 | ) | | | (0.08 | ) | | | - | | | | (0.04 | ) |
| Distributions from net realized gains | | | (1.10 | ) | | | (0.38 | ) | | | (1.16 | ) | | | (1.16 | ) | | | (1.88 | ) |
| Total dividends and distributions | | | (1.29 | ) | | | (0.52 | ) | | | (1.24 | ) | | | (1.16 | ) | | | (1.92 | ) |
| Net asset value, end of year | | | $17.31 | | | | $19.29 | | | | $16.99 | | | | $17.88 | | | | $19.17 | |
| Total Return(b): | | | (4.27)% | | | | 16.71% | | | | 2.57% | | | | (0.59)% | | | | 15.66% | |
| |
| Ratios/Supplemental Data: | |
| Net assets, end of year (000) | | | $3,608 | | | | $5,357 | | | | $6,063 | | | | $7,202 | | | | $7,959 | |
| Average net assets (000) | | | $4,789 | | | | $6,566 | | | | $6,263 | | | | $7,886 | | | | $7,163 | |
| Ratios to average net assets(c): | | | | | | | | | | | | | | | | | | | | |
| Expenses after waivers and/or expense reimbursement | | | 1.95% | | | | 1.96% | | | | 1.95% | | | | 1.96% | | | | 1.97% | |
| Expenses before waivers and/or expense reimbursement | | | 2.37% | | | | 2.09% | (d) | | | 2.04% | | | | 2.05% | | | | 2.12% | |
| Net investment income (loss) | | | 0.58% | | | | 0.56% | | | | 0.43% | | | | 0.35% | | | | 0.08% | |
| Portfolio turnover rate(e) | | | 78% | | | | 112% | | | | 87% | | | | 101% | | | | 87% | |
| (a) | Calculated based on average shares outstanding during the year. |
| (b) | Total return does not consider the effects of sales loads. Total return is calculated assuming a purchase of a share on the first day and a sale on the last day of each year reported and includes reinvestment of dividends and distributions, if any. Total returns may reflect adjustments to conform to generally accepted accounting principles. |
| (c) | Does not include expenses of the underlying funds in which the Fund invests. |
| (d) | Effective August 1, 2017, class specific expenses include transfer agent fees and expenses and registration fees, which are charged to their respective share class. |
| (e) | The Fund’s portfolio turnover rate is calculated in accordance with regulatory requirements, without regard to transactions involving short term investments and certain derivatives. If such transactions were included, the Fund’s portfolio turnover rate may be higher. |
See Notes to Financial Statements.
| | | | |
| PGIM QMA Mid-Cap Value Fund | | | 49 | |
Financial Highlights (continued)
| | | | | | | | | | | | | | | | | | | | |
| Class C Shares | | | | | | | | | | | | | | | |
| | | Year Ended October 31, | |
| | | 2018 | | | 2017 | | | 2016 | | | 2015 | | | 2014 | |
| Per Share Operating Performance(a): | | | | | | | | | | | | | | | | | | | | |
| Net Asset Value, Beginning of Year | | | $19.21 | | | | $16.93 | | | | $17.81 | | | | $19.10 | | | | $18.40 | |
| Income (loss) from investment operations: | | | | | | | | | | | | | | | | | | | | |
| Net investment income (loss) | | | 0.11 | | | | 0.10 | | | | 0.07 | | | | 0.06 | | | | 0.02 | |
| Net realized and unrealized gain (loss) on investment transactions | | | (0.79 | ) | | | 2.70 | | | | 0.29 | | | | (0.19 | ) | | | 2.60 | |
| Total from investment operations | | | (0.68 | ) | | | 2.80 | | | | 0.36 | | | | (0.13 | ) | | | 2.62 | |
| Less Dividends and Distributions: | | | | | | | | | | | | | | | | | | | | |
| Dividends from net investment income | | | (0.19 | ) | | | (0.14 | ) | | | (0.08 | ) | | | - | | | | (0.04 | ) |
| Distributions from net realized gains | | | (1.10 | ) | | | (0.38 | ) | | | (1.16 | ) | | | (1.16 | ) | | | (1.88 | ) |
| Total dividends and distributions | | | (1.29 | ) | | | (0.52 | ) | | | (1.24 | ) | | | (1.16 | ) | | | (1.92 | ) |
| Net asset value, end of year | | | $17.24 | | | | $19.21 | | | | $16.93 | | | | $17.81 | | | | $19.10 | |
| Total Return(b): | | | (4.22)% | | | | 16.65% | | | | 2.64% | | | | (0.59)% | | | | 15.66% | |
| |
| Ratios/Supplemental Data: | |
| Net assets, end of year (000) | | | $42,595 | | | | $56,517 | | | | $55,164 | | | | $62,110 | | | | $50,573 | |
| Average net assets (000) | | | $52,438 | | | | $59,943 | | | | $57,300 | | | | $59,460 | | | | $43,599 | |
| Ratios to average net assets(c): | | | | | | | | | | | | | | | | | | | | |
| Expenses after waivers and/or expense reimbursement | | | 1.92% | | | | 1.96% | | | | 1.95% | | | | 1.96% | | | | 1.97% | |
| Expenses before waivers and/or expense reimbursement | | | 1.97% | | | | 2.03% | (d) | | | 2.04% | | | | 2.05% | | | | 2.12% | |
| Net investment income (loss) | | | 0.60% | | | | 0.55% | | | | 0.42% | | �� | | 0.34% | | | | 0.08% | |
| Portfolio turnover rate(e) | | | 78% | | | | 112% | | | | 87% | | | | 101% | | | | 87% | |
| (a) | Calculated based on average shares outstanding during the year. |
| (b) | Total return does not consider the effects of sales loads. Total return is calculated assuming a purchase of a share on the first day and a sale on the last day of each year reported and includes reinvestment of dividends and distributions, if any. Total returns may reflect adjustments to conform to generally accepted accounting principles. |
| (c) | Does not include expenses of the underlying funds in which the Fund invests. |
| (d) | Effective August 1, 2017, class specific expenses include transfer agent fees and expenses and registration fees, which are charged to their respective share class. |
| (e) | The Fund’s portfolio turnover rate is calculated in accordance with regulatory requirements, without regard to transactions involving short term investments and certain derivatives. If such transactions were included, the Fund’s portfolio turnover rate may be higher. |
See Notes to Financial Statements.
| | | | | | | | | | | | | | | | | | | | |
| Class R Shares | | | | | | | | | | | | | | | |
| | | Year Ended October 31, | | | | | | December 22, 2014(a)
through
October 31, | |
| | | 2018 | | | 2017 | | | 2016 | | | | | | 2015 | |
| Per Share Operating Performance(b): | | | | | | | | | | | | | | | | | | | | |
| Net Asset Value, Beginning of Period | | | $22.38 | | | | $19.60 | | | | $20.40 | | | | | | | | $20.98 | |
| Income (loss) from investment operations: | | | | | | | | | | | | | | | | | | | | |
| Net investment income (loss) | | | 0.24 | | | | 0.22 | | | | 0.18 | | | | | | | | 0.12 | |
| Net realized and unrealized gain (loss) on investment transactions | | | (0.95 | ) | | | 3.15 | | | | 0.34 | | | | | | | | (0.70 | ) |
| Total from investment operations | | | (0.71 | ) | | | 3.37 | | | | 0.52 | | | | | | | | (0.58 | ) |
| Less Dividends and Distributions: | | | | | | | | | | | | | | | | | | | | |
| Dividends from net investment income | | | (0.27 | ) | | | (0.21 | ) | | | (0.16 | ) | | | | | | | - | |
| Distributions from net realized gains | | | (1.10 | ) | | | (0.38 | ) | | | (1.16 | ) | | | | | | | - | |
| Total dividends and distributions | | | (1.37 | ) | | | (0.59 | ) | | | (1.32 | ) | | | | | | | - | |
| Net asset value, end of period | | | $20.30 | | | | $22.38 | | | | $19.60 | | | | | | | | $20.40 | |
| Total Return(c): | | | (3.76)% | | | | 17.31% | | | | 3.12% | | | | | | | | (2.76)% | |
| |
| Ratios/Supplemental Data: | | | | | | | | | | | | | | | |
| Net assets, end of period (000) | | | $798 | | | | $740 | | | | $89 | | | | | | | | $354 | |
| Average net assets (000) | | | $888 | | | | $412 | | | | $293 | | | | | | | | $261 | |
| Ratios to average net assets(d): | | | | | | | | | | | | | | | | | | | | |
| Expenses after waivers and/or expense reimbursement | | | 1.42% | | | | 1.44% | | | | 1.45% | | | | | | | | 1.51% | (e) |
| Expenses before waivers and/or expense reimbursement | | | 3.42% | | | | 4.01% | (f) | | | 1.79% | | | | | | | | 1.81% | (e) |
| Net investment income (loss) | | | 1.07% | | | | 0.99% | | | | 0.99% | | | | | | | | 0.67% | (e) |
| Portfolio turnover rate(g) | | | 78% | | | | 112% | | | | 87% | | | | | | | | 101% | |
| (a) | Commencement of offering. |
| (b) | Calculated based on average shares outstanding during the period. |
| (c) | Total return is calculated assuming a purchase of a share on the first day and a sale on the last day of each period reported and includes reinvestment of dividends and distributions, if any. Total returns may reflect adjustments to conform to generally accepted accounting principles. Total returns for periods less than one full year are not annualized. |
| (d) | Does not include expenses of the underlying funds in which the Fund invests. |
| (f) | Effective August 1, 2017, class specific expenses include transfer agent fees and expenses and registration fees, which are charged to their respective share class. |
| (g) | The Fund’s portfolio turnover rate is calculated in accordance with regulatory requirements, without regard to transactions involving short term investments and certain derivatives. If such transactions were included, the Fund’s portfolio turnover rate may be higher. |
See Notes to Financial Statements.
| | | | |
| PGIM QMA Mid-Cap Value Fund | | | 51 | |
Financial Highlights (continued)
| | | | | | | | | | | | | | | | | | | | |
| Class Z Shares | | | | | | | | | | | | | | | |
| | | | | | Year Ended October 31, | | | | |
| | | 2018 | | | 2017 | | | 2016 | | | 2015 | | | 2014 | |
| Per Share Operating Performance(a): | | | | | | | | | | | | | | | | | | | | |
| Net Asset Value, Beginning of Year | | | $22.48 | | | | $19.68 | | | | $20.49 | | | | $21.76 | | | | $20.68 | |
| Income (loss) from investment operations: | | | | | | | | | | | | | | | | | | | | |
| Net investment income (loss) | | | 0.35 | | | | 0.34 | | | | 0.26 | | | | 0.28 | | | | 0.21 | |
| Net realized and unrealized gain (loss) on investment transactions | | | (0.95 | ) | | | 3.14 | | | | 0.35 | | | | (0.22 | ) | | | 2.95 | |
| Total from investment operations | | | (0.60 | ) | | | 3.48 | | | | 0.61 | | | | 0.06 | | | | 3.16 | |
| Less Dividends and Distributions: | | | | | | | | | | | | | | | | | | | | |
| Dividends from net investment income | | | (0.38 | ) | | | (0.30 | ) | | | (0.26 | ) | | | (0.17 | ) | | | (0.20 | ) |
| Distributions from net realized gains | | | (1.10 | ) | | | (0.38 | ) | | | (1.16 | ) | | | (1.16 | ) | | | (1.88 | ) |
| Total dividends and distributions | | | (1.48 | ) | | | (0.68 | ) | | | (1.42 | ) | | | (1.33 | ) | | | (2.08 | ) |
| Net asset value, end of year | | | $20.40 | | | | $22.48 | | | | $19.68 | | | | $20.49 | | | | $21.76 | |
| Total Return(b): | | | (3.30)% | | | | 17.84% | | | | 3.64% | | | | 0.45% | | | | 16.80% | |
| |
| Ratios/Supplemental Data: | | | | | | | | | | | | | | | |
| Net assets, end of year (000) | | | $340,962 | | | | $429,566 | | | | $339,119 | | | | $318,977 | | | | $173,716 | |
| Average net assets (000) | | | $414,839 | | | | $402,691 | | | | $332,406 | | | | $262,069 | | | | $82,847 | |
| Ratios to average net assets(c): | | | | | | | | | | | | | | | | | | | | |
| Expenses after waivers and/or expense reimbursement | | | 0.93% | | | | 0.95% | | | | 0.95% | | | | 0.96% | | | | 0.97% | |
| Expenses before waivers and/or expense reimbursement | | | 0.98% | | | | 1.02% | (d) | | | 1.04% | | | | 1.05% | | | | 1.11% | |
| Net investment income (loss) | | | 1.59% | | | | 1.55% | | | | 1.40% | | | | 1.31% | | | | 1.02% | |
| Portfolio turnover rate(e) | | | 78% | | | | 112% | | | | 87% | | | | 101% | | | | 87% | |
| (a) | Calculated based on average shares outstanding during the year. |
| (b) | Total return is calculated assuming a purchase of a share on the first day and a sale on the last day of each year reported and includes reinvestment of dividends and distributions, if any. Total returns may reflect adjustments to conform to generally accepted accounting principles. |
| (c) | Does not include expenses of the underlying funds in which the Fund invests. |
| (d) | Effective August 1, 2017, class specific expenses include transfer agent fees and expenses and registration fees, which are charged to their respective share class. |
| (e) | The Fund’s portfolio turnover rate is calculated in accordance with regulatory requirements, without regard to transactions involving short term investments and certain derivatives. If such transactions were included, the Fund’s portfolio turnover rate may be higher. |
See Notes to Financial Statements.
| | | | |
| Class R2 Shares | | | |
| | | December 28,
2017(a)
through
October 31,
2018 | |
| Per Share Operating Performance(b): | | | | |
| Net Asset Value, Beginning of Period | | | $22.68 | |
| Income (loss) from investment operations: | | | | |
| Net investment income (loss) | | | 0.06 | |
| Net realized and unrealized gain (loss) on investment transactions | | | (2.45 | ) |
| Total from investment operations | | | (2.39 | ) |
| Net asset value, end of period | | | $20.29 | |
| Total Return(c): | | | (10.54)% | |
| |
| Ratios/Supplemental Data: | | | |
| Net assets, end of period (000) | | | $48 | |
| Average net assets (000) | | | $15 | |
| Ratios to average net assets(d): | | | | |
| Expenses after waivers and/or expense reimbursement | | | 1.26% | (e) |
| Expenses before waivers and/or expense reimbursement | | | 150.41% | (e) |
| Net investment income (loss) | | | 0.31% | (e) |
| Portfolio turnover rate(f) | | | 78% | |
| (a) | Commencement of offering. |
| (b) | Calculated based on average shares outstanding during the period. |
| (c) | Total return is calculated assuming a purchase of a share on the first day and a sale on the last day of each period reported and includes reinvestment of dividends and distributions, if any. Total returns may reflect adjustments to conform to generally accepted accounting principles. Total returns for periods less than one full year are not annualized. |
| (d) | Does not include expenses of the underlying funds in which the Fund invests. |
| (f) | The Fund’s portfolio turnover rate is calculated in accordance with regulatory requirements, without regard to transactions involving short term investments and certain derivatives. If such transactions were included, the Fund’s portfolio turnover rate may be higher. |
See Notes to Financial Statements.
| | | | |
| PGIM QMA Mid-Cap Value Fund | | | 53 | |
Financial Highlights (continued)
| | | | |
| Class R4 Shares | | | |
| | | December 28,
2017(a)
through
October 31,
2018 | |
| Per Share Operating Performance(b): | | | | |
| Net Asset Value, Beginning of Period | | | $22.68 | |
| Income (loss) from investment operations: | | | | |
| Net investment income (loss) | | | 0.21 | |
| Net realized and unrealized gain (loss) on investment transactions | | | (2.56 | ) |
| Total from investment operations | | | (2.35 | ) |
| Net asset value, end of period | | | $20.33 | |
| Total Return(c): | | | (10.36)% | |
| |
| Ratios/Supplemental Data: | | | |
| Net assets, end of period (000) | | | $9 | |
| Average net assets (000) | | | $10 | |
| Ratios to average net assets(d): | | | | |
| Expenses after waivers and/or expense reimbursement | | | 1.02% | (e) |
| Expenses before waivers and/or expense reimbursement | | | 225.30% | (e) |
| Net investment income (loss) | | | 1.14% | (e) |
| Portfolio turnover rate(f) | | | 78% | |
| (a) | Commencement of offering. |
| (b) | Calculated based on average shares outstanding during the period. |
| (c) | Total return is calculated assuming a purchase of a share on the first day and a sale on the last day of each period reported and includes reinvestment of dividends and distributions, if any. Total returns may reflect adjustments to conform to generally accepted accounting principles. Total returns for periods less than one full year are not annualized. |
| (d) | Does not include expenses of the underlying funds in which the Fund invests. |
| (f) | The Fund’s portfolio turnover rate is calculated in accordance with regulatory requirements, without regard to transactions involving short term investments and certain derivatives. If such transactions were included, the Fund’s portfolio turnover rate may be higher. |
See Notes to Financial Statements.
| | | | | | | | | | | | | | | | | | | | |
| Class R6 Shares | | | | | | | | | | | | | | | |
| | | | | | Year Ended October 31, | | | | |
| | | 2018 | | | 2017 | | | 2016 | | | 2015 | | | 2014 | |
| Per Share Operating Performance(a): | | | | | | | | | | | | | | | | | | | | |
| Net Asset Value, Beginning of Year | | | $22.45 | | | | $19.65 | | | | $20.47 | | | | $21.75 | | | | $20.69 | |
| Income (loss) from investment operations: | | | | | | | | | | | | | | | | | | | | |
| Net investment income (loss) | | | 0.38 | | | | 0.37 | | | | 0.29 | | | | 0.31 | | | | 0.23 | |
| Net realized and unrealized gain (loss) on investment transactions | | | (0.94 | ) | | | 3.14 | | | | 0.35 | | | | (0.23 | ) | | | 2.94 | |
| Total from investment operations | | | (0.56 | ) | | | 3.51 | | | | 0.64 | | | | 0.08 | | | | 3.17 | |
| Less Dividends and Distributions: | | | | | | | | | | | | | | | | | | | | |
| Dividends from net investment income | | | (0.41 | ) | | | (0.33 | ) | | | (0.30 | ) | | | (0.20 | ) | | | (0.23 | ) |
| Distributions from net realized gains | | | (1.10 | ) | | | (0.38 | ) | | | (1.16 | ) | | | (1.16 | ) | | | (1.88 | ) |
| Total dividends and distributions | | | (1.51 | ) | | | (0.71 | ) | | | (1.46 | ) | | | (1.36 | ) | | | (2.11 | ) |
| Net asset value, end of year | | | $20.38 | | | | $22.45 | | | | $19.65 | | | | $20.47 | | | | $21.75 | |
| Total Return(b): | | | (3.12)% | | | | 18.03% | | | | 3.79% | | | | 0.55% | | | | 16.87% | |
| |
| Ratios/Supplemental Data: | | | | | | | | | | | | | | | |
| Net assets, end of year (000) | | | $202,697 | | | | $163,221 | | | | $95,960 | | | | $74,707 | | | | $31,261 | |
| Average net assets (000) | | | $200,226 | | | | $125,192 | | | | $82,160 | | | | $43,995 | | | | $23,206 | |
| Ratios to average net assets(c): | | | | | | | | | | | | | | | | | | | | |
| Expenses after waivers and/or expense reimbursement | | | 0.78% | | | | 0.80% | | | | 0.80% | | | | 0.80% | | | | 0.91% | |
| Expenses before waivers and/or expense reimbursement | | | 0.83% | | | | 0.87% | (d) | | | 0.89% | | | | 0.89% | | | | 0.97% | |
| Net investment income (loss) | | | 1.71% | | | | 1.70% | | | | 1.54% | | | | 1.50% | | | | 1.14% | |
| Portfolio turnover rate(e) | | | 78% | | | | 112% | | | | 87% | | | | 101% | | | | 87% | |
| (a) | Calculated based on average shares outstanding during the year. |
| (b) | Total return is calculated assuming a purchase of a share on the first day and a sale on the last day of each year reported and includes reinvestment of dividends and distributions, if any. Total returns may reflect adjustments to conform to generally accepted accounting principles. |
| (c) | Does not include expenses of the underlying funds in which the Fund invests. |
| (d) | Effective August 1, 2017, class specific expenses include transfer agent fees and expenses and registration fees, which are charged to their respective share class. |
| (e) | The Fund’s portfolio turnover rate is calculated in accordance with regulatory requirements, without regard to transactions involving short term investments and certain derivatives. If such transactions were included, the Fund’s portfolio turnover rate may be higher. |
See Notes to Financial Statements.
| | | | |
| PGIM QMA Mid-Cap Value Fund | | | 55 | |
Report of Independent Registered Public Accounting Firm
The Board of Directors and Shareholders
Prudential Investment Portfolios, Inc. 10:
Opinion on the Financial Statements
We have audited the accompanying statement of assets and liabilities of PGIM QMA Mid-Cap Value Fund (formerly Prudential QMA Mid-Cap Value Fund) (the “Fund”), a series of Prudential Investment Portfolios, Inc. 10, including the schedule of investments, as of October 31, 2018, the related statement of operations for the year then ended, the statements of changes in net assets for each of the years in the two-year period then ended, and the related notes (collectively, the financial statements) and the financial highlights for the years or periods indicated therein. In our opinion, the financial statements and financial highlights present fairly, in all material respects, the financial position of the Fund as of October 31, 2018, the results of its operations for the year then ended, the changes in its net assets for each of the years in the two-year period then ended, and the financial highlights for the years or periods indicated therein, in conformity with U.S. generally accepted accounting principles.
Basis for Opinion
These financial statements and financial highlights are the responsibility of the Fund’s management. Our responsibility is to express an opinion on these financial statements and financial highlights based on our audits. We are a public accounting firm registered with the Public Company Accounting Oversight Board (United States) (“PCAOB”) and are required to be independent with respect to the Fund in accordance with the U.S. federal securities laws and the applicable rules and regulations of the Securities and Exchange Commission and the PCAOB.
We conducted our audits in accordance with the standards of the PCAOB. Those standards require that we plan and perform the audit to obtain reasonable assurance about whether the financial statements and financial highlights are free of material misstatement, whether due to error or fraud. Our audits included performing procedures to assess the risks of material misstatement of the financial statements and financial highlights, whether due to error or fraud, and performing procedures that respond to those risks. Such procedures included examining, on a test basis, evidence regarding the amounts and disclosures in the financial statements and financial highlights. Such procedures also included confirmation of securities owned as of October 31, 2018, by correspondence with the custodians, transfer agents and brokers or by other appropriate auditing procedures when replies from brokers were not received. Our audits also included evaluating the accounting principles used and significant estimates made by management, as well as evaluating the overall presentation of the financial statements and financial highlights. We believe that our audits provide a reasonable basis for our opinion.

We have served as the auditor of one or more PGIM and/or Prudential Retail investment companies since 2003.
New York, New York
December 17, 2018
Federal Income Tax Information (unaudited)
We are advising you that during the fiscal year ended October 31, 2018, the Fund reports the maximum amount allowed per share but not less than $.06 for Class A, B, C, R, Z and R6 shares as a capital gain distribution in accordance with Section 852(b)(3)(C) of the Internal Revenue Code.
For the year ended October 31, 2018, the Fund reports the maximum amount allowable under Section 854 of the Internal Revenue Code, but not less than, the following percentages of the ordinary income dividends paid as 1) qualified dividend income (QDI); and 2) eligible for corporate dividends received deduction (DRD):
| | | | | | | | |
| | | QDI | | | DRD | |
PGIM QMA Mid-Cap Value Fund | | | 26.41 | % | | | 26.22 | % |
In January 2019, you will be advised on IRS Form 1099-DIV or substitute 1099-DIV, as to the federal tax status of dividends and distributions received by you in calendar year 2018.
| | | | |
| PGIM QMA Mid-Cap Value Fund | | | 57 | |
INFORMATION ABOUT BOARD MEMBERS AND OFFICERS (unaudited)
Information about Board Members and Officers of the Fund is set forth below. Board Members who are not deemed to be “interested persons” of the Fund, as defined in the 1940 Act, are referred to as “Independent Board Members.” Board Members who are deemed to be “interested persons” of the Fund are referred to as “Interested Board Members.” The Board Members are responsible for the overall supervision of the operations of the Fund and perform the various duties imposed on the directors of investment companies by the 1940 Act. The Board in turn elects the Officers, who are responsible for administering the day-to-day operations of the Fund.
| | | | | | |
| Independent Board Members | | | | |
| | | | |
Name, Address, Age Position(s) Portfolios Overseen | | Principal Occupation(s) During Past Five Years | | Other Directorships Held During Past Five Years | | Length of Board Service |
| | | | |
Ellen S. Alberding (60) Board Member Portfolios Overseen: 93 | | President and Board Member, The Joyce Foundation (charitable foundation) (since 2002); Vice Chair, City Colleges of Chicago (community college system) (2011-2015); Trustee, National Park Foundation (charitable foundation for national park system) (2009-2018); Trustee, Economic Club of Chicago (since 2009); Trustee, Loyola University (since 2018). | | None. | | Since September 2013 |
| | | | |
Kevin J. Bannon (66) Board Member Portfolios Overseen: 93 | | Retired; Managing Director (April 2008-May 2015) and Chief Investment Officer (October 2008-November 2013) of Highmount Capital LLC (registered investment adviser); formerly Executive Vice President and Chief Investment Officer (April 1993-August 2007) of Bank of New York Company; President (May 2003-May 2007) of BNY Hamilton Family of Mutual Funds. | | Director of Urstadt Biddle Properties (equity real estate investment trust) (since September 2008). | | Since July 2008 |
| | | | |
Linda W. Bynoe (66) Board Member Portfolios Overseen: 93 | | President and Chief Executive Officer (since March 1995) and formerly Chief Operating Officer (December 1989-February 1995) of Telemat Ltd. (management consulting); formerly Vice President (January 1985-June 1989) at Morgan Stanley & Co. (broker-dealer). | | Director of Anixter International, Inc. (communication products distributor) (since January 2006); Director of Northern Trust Corporation (financial services) (since April 2006); Trustee of Equity Residential (residential real estate) (since December 2009). | | Since March 2005 |
PGIM QMA Mid-Cap Value Fund
| | | | | | |
Independent Board Members | | | | |
| | | | |
Name, Address, Age Position(s) Portfolios Overseen | | Principal Occupation(s) During Past Five Years | | Other Directorships Held During Past Five Years | | Length of Board Service |
| | | | |
Barry H. Evans (58) Board Member Portfolios Overseen: 92 | | Retired; formerly President (2005 – 2016), Global Chief Operating Officer (2014– 2016), Chief Investment Officer – Global Head of Fixed Income (1998-2014), and various portfolio manager roles (1986-2006), Manulife Asset Management U.S. | | Director, Manulife Trust Company (since 2011); formerly Director, Manulife Asset Management Limited (2015-2017); formerly Chairman of the Board of Directors of Manulife Asset Management U.S. (2005-2016); formerly Chairman of the Board, Declaration Investment Management and Research (2008-2016). | | Since September 2017 |
| | | | |
Keith F. Hartstein (62) Board Member & Independent Chair Portfolios Overseen: 93 | | Retired; Member (since November 2014) of the Governing Council of the Independent Directors Council (organization of independent mutual fund directors); formerly President and Chief Executive Officer (2005-2012), Senior Vice President (2004-2005), Senior Vice President of Sales and Marketing (1997-2004), and various executive management positions (1990-1997), John Hancock Funds, LLC (asset management); Chairman, Investment Company Institute’s Sales Force Marketing Committee (2003-2008). | | None. | | Since September 2013 |
Visit our website at pgiminvestments.com
| | | | | | |
| Independent Board Members | | | | |
| | | | |
Name, Address, Age Position(s) Portfolios Overseen | | Principal Occupation(s) During Past Five Years | | Other Directorships Held During Past Five Years | | Length of Board Service |
| | | | |
Laurie Simon Hodrick (56) Board Member Portfolios Overseen: 92 | | A. Barton Hepburn Professor Emerita of Economics in the Faculty of Business, Columbia Business School (since 2018); Visiting Professor of Law, Stanford Law School (since 2015); Visiting Fellow at the Hoover Institution, Stanford University (since 2015); Sole Member, ReidCourt LLC (since 2008) (a consulting firm); formerly A. Barton Hepburn Professor of Economics in the Faculty of Business, Columbia Business School (1996-2017); formerly Managing Director, Global Head of Alternative Investment Strategies, Deutsche Bank (2006-2008). | | Independent Director, Corporate Capital Trust (since April 2017) (a business development company); Independent Director, Kabbage, Inc. (since July 2018) (financial services). | | Since September 2017 |
| | | | |
Michael S. Hyland, CFA (73) Board Member Portfolios Overseen: 93 | | Retired (since February 2005); formerly Senior Managing Director (July 2001-February 2005) of Bear Stearns & Co, Inc.; Global Partner, INVESCO (1999-2001); Managing Director and President of Salomon Brothers Asset Management (1989-1999). | | None. | | Since July 2008 |
| | | | |
Richard A. Redeker (75) Board Member Portfolios Overseen: 93 | | Retired Mutual Fund Senior Executive (50 years); Management Consultant; Director, Mutual Fund Directors Forum (since 2014); Independent Directors Council (organization of independent mutual fund directors)-Executive Committee, Chair of Policy Steering Committee, Governing Council. | | None. | | Since October 1993 |
PGIM QMA Mid-Cap Value Fund
| | | | | | |
| Independent Board Members | | | | |
| | | | |
Name, Address, Age Position(s) Portfolios Overseen | | Principal Occupation(s) During Past Five Years | | Other Directorships Held During Past Five Years | | Length of Board Service |
| | | | |
Brian K. Reid (56)# Board Member Portfolios Overseen: 92 | | Retired; formerly Chief Economist for the Investment Company Institute (ICI) (2005-2017); formerly Senior Economist and Director of Industry and Financial Analysis at the ICI (1998-2004); formerly Senior Economist, Industry and Financial Analysis at the ICI (1996-1998); formerly Staff Economist at the Federal Reserve Board (1989-1996); Director, ICI Mutual Insurance Company (2012-2017). | | None. | | Since March 2018 |
| # | Mr. Reid joined the Board effective as of March 1, 2018. |
| | | | | | |
| Interested Board Members | | | | |
| | | | |
Name, Address, Age Position(s) Portfolios Overseen | | Principal Occupation(s) During Past Five Years | | Other Directorships Held During Past Five Years | | Length of
Board Service |
| | | | |
Stuart S. Parker (56) Board Member & President Portfolios Overseen: 93 | | President of PGIM Investments LLC (formerly known as Prudential Investments LLC) (since January 2012); Executive Vice President of Prudential Investment Management Services LLC (since December 2012); formerly Executive Vice President of Jennison Associates LLC and Head of Retail Distribution of PGIM Investments LLC (June 2005-December 2011). | | None. | | Since January 2012 |
Visit our website at pgiminvestments.com
| | | | | | |
| Interested Board Members | | | | |
| | | | |
Name, Address, Age Position(s) Portfolios Overseen | | Principal Occupation(s) During Past Five Years | | Other Directorships Held During Past Five Years | | Length of Board Service |
| | | | |
Scott E. Benjamin (45) Board Member & Vice President Portfolios Overseen:93 | | Executive Vice President (since June 2009) of PGIM Investments LLC; Executive Vice President (June 2009-June 2012) and Vice President (since June 2012) of Prudential Investment Management Services LLC; Executive Vice President (since September 2009) of AST Investment Services, Inc.; Senior Vice President of Product Development and Marketing, PGIM Investments (since February 2006); formerly Vice President of Product Development and Product Management, PGIM Investments LLC (2003-2006). | | None. | | Since March 2010 |
| | | | |
Grace C. Torres* (59) Board Member Portfolios Overseen: 92 | | Retired; formerly Treasurer and Principal Financial and Accounting Officer of the PGIM Funds, Target Funds, Advanced Series Trust, Prudential Variable Contract Accounts and The Prudential Series Fund (1998-June 2014); Assistant Treasurer (March 1999-June 2014) and Senior Vice President (September 1999-June 2014) of PGIM Investments LLC; Assistant Treasurer (May 2003-June 2014) and Vice President (June 2005-June 2014) of AST Investment Services, Inc.; Senior Vice President and Assistant Treasurer (May 2003-June 2014) of Prudential Annuities Advisory Services, Inc. | | Formerly Director (July 2015-January 2018) of Sun Bancorp, Inc. N.A. and Sun National Bank; Director (since January 2018) of OceanFirst Financial Corp. and OceanFirst Bank. | | Since November 2014 |
* Note: Prior to her retirement in 2014, Ms. Torres was employed by PGIM Investments LLC. Due to her prior employment, she is considered to be an “interested person” under the 1940 Act. Ms. Torres is a Non-Management Interested Board Member.
PGIM QMA Mid-Cap Value Fund
| | | | |
| Fund Officers(a) | | | | |
| | | |
Name, Address and Age Position with Fund | | Principal Occupation(s) During Past Five Years | | Length of Service as Fund Officer |
| | | |
Raymond A. O’Hara (63) Chief Legal Officer | | Vice President and Corporate Counsel (since July 2010) of Prudential Insurance Company of America (Prudential); Vice President (March 2011-Present) of Pruco Life Insurance Company and Pruco Life Insurance Company of New Jersey; Vice President and Corporate Counsel (March 2011-Present) of Prudential Annuities Life Assurance Corporation; Chief Legal Officer of PGIM Investments LLC (since June 2012); Chief Legal Officer of Prudential Mutual Fund Services LLC (since June 2012) and Corporate Counsel of AST Investment Services, Inc. (since June 2012); formerly Assistant Vice President and Corporate Counsel (September 2008-July 2010) of The Hartford Financial Services Group, Inc.; formerly Associate (September 1980-December 1987) and Partner (January 1988–August 2008) of Blazzard & Hasenauer, P.C. (formerly, Blazzard, Grodd & Hasenauer, P.C.). | | Since June 2012 |
| | | |
Chad A. Earnst (43) Chief Compliance Officer | | Chief Compliance Officer (September 2014-Present) of PGIM Investments LLC; Chief Compliance Officer (September 2014-Present) of the PGIM Funds, Target Funds, Advanced Series Trust, The Prudential Series Fund, Prudential’s Gibraltar Fund, Inc., PGIM Global Short Duration High Yield Income Fund, Inc., PGIM Short Duration High Yield Fund, Inc. and PGIM Jennison MLP Income Fund, Inc.; formerly Assistant Director (March 2010-August 2014) of the Asset Management Unit, Division of Enforcement, US Securities & Exchange Commission; Assistant Regional Director (January 2010-August 2014), Branch Chief (June 2006–December 2009) and Senior Counsel (April 2003-May 2006) of the Miami Regional Office, Division of Enforcement, US Securities & Exchange Commission. | | Since September 2014 |
| | | |
Dino Capasso (44) Deputy Chief Compliance Officer | | Vice President and Deputy Chief Compliance Officer (June 2017-Present) of PGIM Investments LLC; formerly, Senior Vice President and Senior Counsel (January 2016-June 2017), and Vice President and Counsel (February 2012-December 2015) of Pacific Investment Management Company LLC. | | Since March 2018 |
| | | |
Andrew R. French (56) Secretary | | Vice President and Corporate Counsel (since February 2010) of Prudential; formerly Director and Corporate Counsel (2006-2010) of Prudential; Vice President and Assistant Secretary (since January 2007) of PGIM Investments LLC; Vice President and Assistant Secretary (since January 2007) of Prudential Mutual Fund Services LLC. | | Since October 2006 |
Visit our website at pgiminvestments.com
| | | | |
| Fund Officers(a) | | | | |
| | | |
Name, Address and Age Position with Fund | | Principal Occupation(s) During Past Five Years | | Length of Service as Fund Officer |
| | | |
Jonathan D. Shain (60) Assistant Secretary | | Vice President and Corporate Counsel (since August 1998) of Prudential; Vice President and Assistant Secretary (since May 2001) of PGIM Investments LLC; Vice President and Assistant Secretary (since February 2001) of Prudential Mutual Fund Services LLC; formerly Vice President and Assistant Secretary (May 2003-June 2005) of AST Investment Services, Inc. | | Since May 2005 |
| | | |
Claudia DiGiacomo (44) Assistant Secretary | | Vice President and Corporate Counsel (since January 2005) of Prudential; Vice President and Assistant Secretary of PGIM Investments LLC (since December 2005); formerly Associate at Sidley Austin Brown & Wood LLP (1999-2004). | | Since December 2005 |
| | | |
Charles H. Smith (45) Anti-Money Laundering Compliance Officer | | Vice President, Corporate Compliance, Anti-Money Laundering Unit (since January 2015) of Prudential; committee member of the American Council of Life Insurers Anti-Money Laundering and Critical Infrastructure Committee (since January 2016); formerly Global Head of Economic Sanctions Compliance at AIG Property Casualty (February 2007 – December 2014); Assistant Attorney General at the New York State Attorney General’s Office, Division of Public Advocacy. (August 1998 —January 2007). | | Since January 2017 |
| | | |
Brian D. Nee (52) Treasurer and Principal Financial and Accounting Officer | | Vice President and Head of Finance of PGIM Investments LLC (since August 2015) and PGIM Global Partners (since February 2017); formerly, Vice President, Treasurer’s Department of Prudential (September 2007-August 2015). | | Since July 2018 |
| | | |
Peter Parrella (60) Assistant Treasurer | | Vice President (since 2007) and Director (2004-2007) within Prudential Mutual Fund Administration; formerly Tax Manager at SSB Citi Fund Management LLC (1997-2004). | | Since June 2007 |
| | | |
Lana Lomuti (51) Assistant Treasurer | | Vice President (since 2007) and Director (2005-2007), within Prudential Mutual Fund Administration; formerly Assistant Treasurer (December 2007-February 2014) of The Greater China Fund, Inc. | | Since April 2014 |
| | | |
Linda McMullin (57) Assistant Treasurer | | Vice President (since 2011) and Director (2008-2011) within Prudential Mutual Fund Administration. | | Since April 2014 |
| | | |
Kelly A. Coyne (50) Assistant Treasurer | | Director, Investment Operations of Prudential Mutual Fund Services LLC (since 2010). | | Since March 2015 |
(a) Excludes Mr. Parker and Mr. Benjamin, interested Board Members who also serve as President and Vice President, respectively.
Explanatory Notes to Tables:
| ∎ | | Board Members are deemed to be “Interested,” as defined in the 1940 Act, by reason of their affiliation with PGIM Investments LLC and/or an affiliate of PGIM Investments LLC. |
| ∎ | | Unless otherwise noted, the address of all Board Members and Officers is c/o PGIM Investments LLC, 655 Broad Street, Newark, New Jersey 07102-4410. |
| ∎ | | There is no set term of office for Board Members or Officers. The Board Members have adopted a retirement policy, which calls for the retirement of Board Members on December 31 of the year in which they reach the age of 75. |
PGIM QMA Mid-Cap Value Fund
| ∎ | | “Other Directorships Held” includes only directorships of companies required to register or file reports with the SEC under the 1934 Act (that is, “public companies”) or other investment companies registered under the 1940 Act. |
| ∎ | | “Portfolios Overseen” includes all investment companies managed by PGIM Investments LLC. The investment companies for which PGIM Investments LLC serves as manager include the PGIM Funds, The Prudential Variable Contract Accounts, PGIM ETF Trust, PGIM Short Duration High Yield Fund, Inc., PGIM Global Short Duration High Yield Fund, Inc., The Prudential Series Fund, Prudential’s Gibraltar Fund, Inc. and the Advanced Series Trust. |
Visit our website at pgiminvestments.com
Approval of Advisory Agreements (unaudited)
The Fund’s Board of Directors
The Board of Directors (the “Board”) of PGIM QMA Mid-Cap Value Fund (the “Fund”)1 consists of twelve individuals, nine of whom are not “interested persons” of the Fund, as defined in the Investment Company Act of 1940, as amended (the “1940 Act”) (the “Independent Directors”). The Board is responsible for the oversight of the Fund and its operations, and performs the various duties imposed on the directors of investment companies by the 1940 Act. The Independent Directors have retained independent legal counsel to assist them in connection with their duties. The Chair of the Board is an Independent Director. The Board has established four standing committees: the Audit Committee, the Nominating and Governance Committee, and two Investment Committees. Each committee is chaired by, and composed of, Independent Directors.
Annual Approval of the Fund’s Advisory Agreements
As required under the 1940 Act, the Board determines annually whether to renew the Fund’s management agreement with PGIM Investments LLC (“PGIM Investments”) and the Fund’s subadvisory agreement with Quantitative Management Associates LLC (“QMA”). In considering the renewal of the agreements, the Board, including all of the Independent Directors, met on June 7, 2018 and on June 19-21, 2018 and approved the renewal of the agreements through July 31, 2019, after concluding that the renewal of the agreements was in the best interests of the Fund and its shareholders.
In advance of the meetings, the Board requested and received materials relating to the agreements, and had the opportunity to ask questions and request further information in connection with its consideration. Among other things, the Board considered comparative fee information from PGIM Investments and QMA. Also, the Board considered comparisons with other mutual funds in relevant Peer Universes and Peer Groups, as is further discussed below.
In approving the agreements, the Board, including the Independent Directors advised by independent legal counsel, considered the factors it deemed relevant, including the nature, quality and extent of services provided by PGIM Investments and the subadviser, the performance of the Fund, the profitability of PGIM Investments and its affiliates, expenses and fees, and the potential for economies of scale that may be shared with the Fund and its shareholders as the Fund’s assets grow. In their deliberations, the Directors did not identify any single factor which alone was responsible for the Board’s decision to approve the agreements with respect to the Fund. In connection with its deliberations, the Board considered information provided by PGIM Investments throughout the year at regular Board meetings, presentations from portfolio managers and other information, as well as information furnished at or in advance of the meetings on June 7, 2018 and on June 19-21, 2018.
| 1 | PGIM QMA Mid-Cap Value Fund is a series of Prudential Investment Portfolios, Inc. 10. |
| | |
| PGIM QMA Mid-Cap Value Fund |
Approval of Advisory Agreements (continued)
The Directors determined that the overall arrangements between the Fund and PGIM Investments, which serves as the Fund’s investment manager pursuant to a management agreement, and between PGIM Investments and QMA, which serves as the Fund’s subadviser pursuant to the terms of a subadvisory agreement with PGIM Investments, are in the best interests of the Fund and its shareholders in light of the services performed, fees charged and such other matters as the Directors considered relevant in the exercise of their business judgment.
The material factors and conclusions that formed the basis for the Directors’ reaching their determinations to approve the continuance of the agreements are separately discussed below.
Nature, Quality and Extent of Services
The Board received and considered information regarding the nature, quality and extent of services provided to the Fund by PGIM Investments and QMA. The Board considered the services provided by PGIM Investments, including but not limited to the oversight of the subadviser for the Fund, as well as the provision of fund recordkeeping, compliance, and other services to the Fund. With respect to PGIM Investments’ oversight of the subadviser, the Board noted that PGIM Investments’ Strategic Investment Research Group (“SIRG”), which is a business unit of PGIM Investments, is responsible for monitoring and reporting to PGIM Investments’ senior management on the performance and operations of the subadviser. The Board also considered that PGIM Investments pays the salaries of all of the officers and interested Directors of the Fund who are part of Fund management. The Board also considered the investment subadvisory services provided by QMA, including investment research and security selection, as well as adherence to the Fund’s investment restrictions and compliance with applicable Fund policies and procedures. The Board considered PGIM Investments’ evaluation of the subadviser, as well as PGIM Investments’ recommendation, based on its review of the subadviser, to renew the subadvisory agreement.
The Board considered the qualifications, backgrounds and responsibilities of PGIM Investments’ senior management responsible for the oversight of the Fund and QMA, and also considered the qualifications, backgrounds and responsibilities of the QMA portfolio managers who are responsible for the day-to-day management of the Fund’s portfolio. The Board was provided with information pertaining to PGIM Investments’ and QMA’s organizational structure, senior management, investment operations, and other relevant information pertaining to PGIM Investments and QMA. The Board also noted that it received favorable compliance reports from the Fund’s Chief Compliance Officer (“CCO”) as to PGIM Investments and QMA. The Board noted that QMA is affiliated with PGIM Investments.
The Board concluded that it was satisfied with the nature, extent and quality of the investment management services provided by PGIM Investments and the subadvisory
| | |
| Visit our website at pgiminvestments.com | | |
services provided to the Fund by QMA, and that there was a reasonable basis on which to conclude that the Fund benefits from the services provided by PGIM Investments and QMA under the management and subadvisory agreements.
Costs of Services and Profits Realized by PGIM Investments
The Board was provided with information on the profitability of PGIM Investments and its affiliates in serving as the Fund’s investment manager. The Board discussed with PGIM Investments the methodology utilized in assembling the information regarding profitability and considered its reasonableness. The Board recognized that it is difficult to make comparisons of profitability from fund management contracts because comparative information is not generally publicly available and is affected by numerous factors, including the structure of the particular adviser, the types of funds it manages, its business mix, numerous assumptions regarding allocations and the adviser’s capital structure and cost of capital. Taking these factors into account, the Board concluded that the profitability of PGIM Investments and its affiliates in relation to the services rendered was not unreasonable.
Economies of Scale
The Board received and discussed information concerning economies of scale that PGIM Investments may realize as the Fund’s assets grow beyond current levels. The Board noted that the management fee schedule for the Fund includes breakpoints, which have the effect of decreasing the fee rate as assets increase. During the course of time, the Board has considered information regarding the launch date of the Fund, the management fees of the Fund compared to those of similarly managed funds and PGIM Investments’ investment in the Fund over time .The Board noted that economies of scale can be shared with the Fund in other ways, including low management fees from inception, additional technological and personnel investments to enhance shareholder services, and maintaining existing expense structures in the face of a rising cost environment. The Board also considered PGIM Investments’ assertion that it continually evaluates the management fee schedule of the Fund and the potential to share economies of scale through breakpoints or fee waivers as asset levels increase.
The Board recognized the inherent limitations of any analysis of economies of scale, stemming largely from the Board’s understanding that most of PGIM Investments’ costs are not specific to individual funds, but rather are incurred across a variety of products and services.
Other Benefits to PGIM Investments and QMA
The Board considered potential ancillary benefits that might be received by PGIM Investments, QMA and their affiliates as a result of their relationship with the Fund. The Board concluded that potential benefits to be derived by PGIM Investments included
| | |
| PGIM QMA Mid-Cap Value Fund |
Approval of Advisory Agreements (continued)
transfer agency fees received by the Fund’s transfer agent (which is affiliated with PGIM Investments), and benefits to its reputation as well as other intangible benefits resulting from PGIM Investments’ association with the Fund. The Board concluded that the potential benefits to be derived by QMA included its ability to use soft dollar credits, as well as the potential benefits consistent with those generally resulting from an increase in assets under management, specifically, potential access to additional research resources and benefits to its reputation. The Board concluded that the benefits derived by PGIM Investments and QMA were consistent with the types of benefits generally derived by investment managers and subadvisers to mutual funds.
Performance of the Fund / Fees and Expenses
The Board considered certain additional specific factors and made related conclusions relating to the historical performance of the Fund for the one-, three-, five- and ten-year periods ended December 31, 2017.
The Board also considered the Fund’s actual management fee, as well as the Fund’s net total expense ratio, for the fiscal year ended October 31, 2017. The Board considered the management fee for the Fund as compared to the management fee charged by PGIM Investments to other funds and the fee charged by other advisers to comparable mutual funds in a Peer Group. The actual management fee represents the fee rate actually paid by Fund shareholders and includes any fee waivers or reimbursements. The net total expense ratio for the Fund represents the actual expense ratio incurred by Fund shareholders.
The mutual funds included in the Peer Universe, which was used to consider performance, and the Peer Group, which was used to consider expenses and fees, were objectively determined by Broadridge, an independent provider of mutual fund data. In certain circumstances, PGIM Investments also may have provided supplemental Peer Universe or Peer Group information for reasons addressed with the Board. The comparisons placed the Fund in various quartiles, with the first quartile being the best 25% of the mutual funds (for performance, the best performing mutual funds and, for expenses, the lowest cost mutual funds).
The section below summarizes key factors considered by the Board and the Board’s conclusions regarding the Fund’s performance, fees and overall expenses. The table sets forth gross performance comparisons (which do not reflect the impact on performance of fund expenses, or any subsidies, expense caps or waivers that may be applicable) with the Peer Universe, actual management fees with the Peer Group (which reflect the impact of any subsidies or fee waivers), and net total expenses with the Peer Group, each of which were key factors considered by the Board.
| | |
| Visit our website at pgiminvestments.com | | |
| | | | | | | | |
| Gross Performance | | 1 Year | | 3 Years | | 5 Years | | 10 Years |
| | | 3rd Quartile | | 3rd Quartile | | 1st Quartile | | 1st Quartile |
| Actual Management Fees: 3rd Quartile |
| Net Total Expenses: 2nd Quartile |
| | • | | The Board noted that the Fund outperformed its benchmark index over all periods. |
| | • | | Although the Fund ranked in the third quartile over the one-year period, the Board noted that the Fund’s longer-term performance against its peers was strong, with the Fund ranked in the first quartile over the five- and ten-year periods. |
| | • | | The Board also considered that, when it evaluated performance the prior year, the Fund ranked in the first quartile of its peers and outperformed its benchmark index over the one-, three-, five- and ten-year periods ended December 31, 2016. |
| | • | | The Board and PGIM Investments agreed to enhance the existing expense cap, such that effective July 1, 2018 the expense cap (exclusive of certain fees and expenses) is 1.13% for Class A shares, 1.95% for Class B shares, 1.95% for Class C shares, 1.45% for Class R shares, 0.95% for Class Z shares, 1.23% for Class R2 shares, 0.98% for Class R4 shares, and 0.73% for Class R6 shares through February 29, 2020. The expense cap also provides that PGIM Investments is obligated to waive fees or shared operating expenses on any share class to the same extent that it waives similar expenses on any other share class. |
| | • | | The Board and PGIM Investments also agreed to permanently reduce the Fund’s management fee schedule such that effective July 1, 2018, the new management fee schedule is 0.73% on average daily net assets to $1 billion, 0.71% on average daily net assets from $1 billion to $3 billion, 0.69% on average daily net assets from $3 billion to $5 billion, and 0.67% on average daily net assets over $5 billion. |
| | • | | The Board and PGIM Investments also agreed to contractually reduce the Fund’s subadvisory fee schedule such that effective July 1, 2018, the new subadvisory fee is 0.365% on average daily net assets to $1 billion, 0.355% on average daily net assets from $1 billion to $3 billion, 0.345% on average daily net assets from $3 billion to $ 5 billion, and 0.335% on average daily net assets over $5 billion. |
| | • | | The Board concluded that, in light of the above, it would be in the best interests of the Fund and its shareholders to renew the agreements with the permanent management fee and subadvisory fee reduction. |
| | • | | The Board concluded that the management fees (including subadvisory fees) and total expenses were reasonable in light of the services provided. |
* * *
After full consideration of these factors, the Board concluded that approval of the agreements was in the best interests of the Fund and its shareholders.
| | |
| PGIM QMA Mid-Cap Value Fund |
| | | | |
| ∎ MAIL | | ∎ TELEPHONE | | ∎ WEBSITE |
655 Broad Street Newark, NJ 07102 | | (800) 225-1852 | | www.pgiminvestments.com |
|
| PROXY VOTING |
The Board of Directors of the Fund has delegated to the Fund’s subadviser the responsibility for voting any proxies and maintaining proxy recordkeeping with respect to the Fund. A description of these proxy voting policies and procedures is available without charge, upon request, by calling
(800) 225-1852. Information regarding how the Fund voted proxies relating to portfolio securities during the most recent 12-month period ended June 30 is available on the Fund’s website and on the Securities and Exchange Commission’s website. |
|
| DIRECTORS |
| Ellen S. Alberding • Kevin J. Bannon • Scott E. Benjamin • Linda W. Bynoe • Barry H. Evans • Keith F. Hartstein • Laurie Simon Hodrick • Michael S. Hyland • Stuart S. Parker • Richard A. Redeker • Brian K. Reid • Grace C. Torres |
|
| OFFICERS |
| Stuart S. Parker, President • Scott E. Benjamin, Vice President • Brian D. Nee, Treasurer and Principal Financial and Accounting Officer • Raymond A. O’Hara, Chief Legal Officer • Andrew R. French, Secretary • Chad A. Earnst, Chief Compliance Officer • Dino Capasso, Vice President and Deputy Chief Compliance Officer • Charles H. Smith, Anti-Money Laundering Compliance Officer • Jonathan D. Shain, Assistant Secretary • Claudia DiGiacomo, Assistant Secretary • Peter Parrella, Assistant Treasurer • Lana Lomuti, Assistant Treasurer • Linda McMullin, Assistant Treasurer • Kelly A. Coyne, Assistant Treasurer |
| | | | |
| MANAGER | | PGIM Investments LLC | | 655 Broad Street Newark, NJ 07102 |
|
| SUBADVISER | | Quantitative Management Associates LLC | | Gateway Center Two
100 Mulberry Street Newark, NJ 07102 |
|
| DISTRIBUTOR | | Prudential Investment Management Services LLC | | 655 Broad Street Newark, NJ 07102 |
|
| CUSTODIAN | | The Bank of New York Mellon | | 225 Liberty Street New York, NY 10286 |
|
| TRANSFER AGENT | | Prudential Mutual Fund Services LLC | | PO Box 9658 Providence, RI 02940 |
|
| INDEPENDENT REGISTERED PUBLIC ACCOUNTING FIRM | | KPMG LLP | | 345 Park Avenue New York, NY 10154 |
|
| FUND COUNSEL | | Willkie Farr & Gallagher LLP | | 787 Seventh Avenue New York, NY 10019 |
|
|
| An investor should consider the investment objectives, risks, charges, and expenses of the Fund carefully before investing. The prospectus and summary prospectus contain this and other information about the Fund. An investor may obtain a prospectus and summary prospectus by visiting our website at www.pgiminvestments.com or by calling (800) 225-1852. The prospectus and summary prospectus should be read carefully before investing. |
|
| E-DELIVERY |
| To receive your mutual fund documents online, go to www.pgiminvestments.com/edelivery and enroll. Instead of receiving printed documents by mail, you will receive notification via email when new materials are available. You can cancel your enrollment or change your email address at any time by visiting the website address above. |
|
| SHAREHOLDER COMMUNICATIONS WITH DIRECTORS |
| Shareholders can communicate directly with the Board of Directors by writing to the Chair of the Board, PGIM QMA Mid-Cap Value Fund, PGIM Investments, Attn: Board of Directors, 655 Broad Street, Newark, NJ 07102. Shareholders can communicate directly with an individual Director by writing to the same address. Communications are not screened before being delivered to the addressee. |
|
| AVAILABILITY OF PORTFOLIO SCHEDULE |
| The Fund files its complete schedule of portfolio holdings with the Securities and Exchange Commission for the first and third quarters of each fiscal year on Form N-Q. The Fund’s Forms N-Q are available on the Commission’s website at www.sec.gov. The Fund’s schedule of portfolio holdings is also available on the Fund’s website as of the end of each month no sooner than 15 days after the end of the month. |
|
| The Fund’s Statement of Additional Information contains additional information about the Fund’s Directors and is available without charge, upon request, by calling (800) 225-1852. |
Mutual Funds:
| | | | |
ARE NOT INSURED BY THE FDIC OR ANY
FEDERAL GOVERNMENT AGENCY | | MAY LOSE VALUE | | ARE NOT A DEPOSIT OF OR GUARANTEED BY ANY BANK OR ANY BANK AFFILIATE |
PGIM QMA MID-CAP VALUE FUND
| | | | | | | | | | | | | | | | |
| SHARE CLASS | | A | | B | | C | | R | | Z | | R2 | | R4 | | R6* |
| NASDAQ | | SPRAX | | SVUBX | | NCBVX | | SDVRX | | SPVZX | | PMVEX | | PMVFX | | PMVQX |
| CUSIP | | 74441L105 | | 74441L204 | | 74441L303 | | 74441L782 | | 74441L709 | | 74441L758 | | 74441L741 | | 74441L824 |
*Formerly known as Class Q shares.
MF202E
Item 2 – Code of Ethics – – See Exhibit (a)
As of the end of the period covered by this report, the registrant has adopted a code of ethics (the “Section 406 Standards for Investment Companies – Ethical Standards for Principal Executive and Financial Officers”) that applies to the registrant’s Principal Executive Officer and Principal Financial Officer; the registrant’s Principal Financial Officer also serves as the Principal Accounting Officer.
The registrant hereby undertakes to provide any person, without charge, upon request, a copy of the code of ethics. To request a copy of the code of ethics, contact the registrant 800-225-1852, and ask for a copy of the Section 406 Standards for Investment Companies - Ethical Standards for Principal Executive and Financial Officers.
Item 3 – Audit Committee Financial Expert –
The registrant’s Board has determined that Mr. Kevin J. Bannon, member of the Board’s Audit Committee is an “audit committee financial expert,” and that he is “independent,” for purposes of this Item.
Item 4 – Principal Accountant Fees and Services –
(a) Audit Fees
For the fiscal years ended October 31, 2018 and October 31, 2017, KPMG LLP (“KPMG”), the Registrant’s principal accountant, billed the Registrant $50,870 and $50,366 respectively, for professional services rendered for the audit of the Registrant’s annual financial statements or services that are normally provided in connection with statutory and regulatory filings.
(b) Audit-Related Fees
For the fiscal years ended October 31, 2018 and October 31, 2017: none.
(c) Tax Fees
For the fiscal years ended October 31, 2018 and October 31, 2017: none.
(d) All Other Fees
For the fiscal years ended October 31, 2018 and October 31, 2017: none.
(e) (1) Audit Committee Pre-Approval Policies and Procedures
THE PRUDENTIAL MUTUAL FUNDS
AUDIT COMMITTEE POLICY
on
Pre-Approval of Services Provided by the Independent Accountants
The Audit Committee of each Prudential Mutual Fund is charged with the responsibility to monitor the independence of the Fund’s independent accountants. As part of this responsibility, the Audit Committee must pre-approve the independent accounting firm’s engagement to render audit and/or permissible non-audit services, as required by law. In evaluating a proposed engagement of the independent accountants, the Audit Committee will assess the effect that the engagement might reasonably be expected to have on the accountant’s independence. The Committee’s evaluation will be based on:
| | • | | a review of the nature of the professional services expected to be provided, |
| | • | | a review of the safeguards put into place by the accounting firm to safeguard independence, and |
| | • | | periodic meetings with the accounting firm. |
Policy for Audit and Non-Audit Services Provided to the Funds
On an annual basis, the scope of audits for each Fund, audit fees and expenses, and audit-related and non-audit services (and fees proposed in respect thereof) proposed to be performed by the Fund’s independent accountants will be presented by the Treasurer and the independent accountants to the Audit Committee for review and, as appropriate, approval prior to the initiation of such services. Such presentation shall be accompanied by confirmation by both the Treasurer and the independent accountants that the proposed non-audit services will not adversely affect the independence of the independent accountants. Such proposed non-audit services shall be described in sufficient detail to enable the Audit Committee to assess the appropriateness of such services and fees, and the compatibility of the provision of such services with the auditor’s independence. The Committee shall receive periodic reports on the progress of the audit and other services which are approved by the Committee or by the Committee Chair pursuant to authority delegated in this Policy.
The categories of services enumerated under “Audit Services”, “Audit-related Services”, and “Tax Services” are intended to provide guidance to the Treasurer and the independent accountants as to those categories of services which the Committee believes are generally consistent with the independence of the independent accountants and which the Committee (or the Committee Chair) would expect upon the presentation of specific proposals to pre-approve. The enumerated categories are not intended as an exclusive list of audit, audit-related or tax services, which the Committee (or the Committee Chair) would consider for pre-approval.
Audit Services
The following categories of audit services are considered to be consistent with the role of the Fund’s independent accountants:
| | Ø | Annual Fund financial statement audits |
| | Ø | Seed audits (related to new product filings, as required) |
| | Ø | SEC and regulatory filings and consents |
Audit-related Services
The following categories of audit-related services are considered to be consistent with the role of the Fund’s independent accountants:
| | Ø | Accounting consultations |
| | Ø | Fund merger support services |
| | Ø | Agreed Upon Procedure Reports |
| | Ø | Other Internal Control Reports |
Individual audit-related services that fall within one of these categories (except for fund merger support services) and are not presented to the Audit Committee as part of the annual pre-approval process are subject to an authorized pre-approval by the Audit Committee so long as the estimated fee for those services does not exceed $30,000. Any services provided under such pre-approval will be reported to the Audit Committee at its next regular meeting. Should the amount of such services exceed $30,000 any additional fees will be subject to pre-approval by the Committee Chair (or any other Committee member on whom this responsibility has been delegated). Fees related to fund merger support services are subject to a separate authorized pre-approval by the Audit Committee with fees determined on a per occurrence and merger complexity basis.
Tax Services
The following categories of tax services are considered to be consistent with the role of the Fund’s independent accountants:
| | Ø | Tax compliance services related to the filing or amendment of the following: |
| | ◾ | Federal, state and local income tax compliance; and, |
| | ◾ | Sales and use tax compliance |
| | Ø | Timely RIC qualification reviews |
| | Ø | Tax distribution analysis and planning |
| | Ø | Tax authority examination services |
| | Ø | Tax appeals support services |
| | Ø | Accounting methods studies |
| | Ø | Fund merger support services |
| | Ø | Tax consulting services and related projects |
Individual tax services that fall within one of these categories and are not presented to the Audit Committee as part of the annual pre-approval process are subject to an authorized pre-approval by the Audit Committee so long as the estimated fee for those services does not exceed $30,000. Any services provided under such pre-approval will be reported to the Audit Committee at its next regular meeting. Should the amount of such services exceed $30,000 any additional fees will be subject to pre-approval by the Committee Chair (or any other Committee member on whom this responsibility has been delegated).
Other Non-Audit Services
Certain non-audit services that the independent accountants are legally permitted to render will be subject to pre-approval by the Committee or by one or more Committee members to whom the Committee has delegated this authority and who will report to the full Committee any pre-approval decisions made pursuant to this Policy. Non-audit services presented for pre-approval pursuant to this paragraph will be accompanied by a confirmation from both the Treasurer and the independent accountants that the proposed services will not adversely affect the independence of the independent accountants.
Proscribed Services
The Fund’s independent accountants will not render services in the following categories of non-audit services:
| | Ø | Bookkeeping or other services related to the accounting records or financial statements of the Fund |
| | Ø | Financial information systems design and implementation |
| | Ø | Appraisal or valuation services, fairness opinions, or contribution-in-kind reports |
| | Ø | Internal audit outsourcing services |
| | Ø | Management functions or human resources |
| | Ø | Broker or dealer, investment adviser, or investment banking services |
| | Ø | Legal services and expert services unrelated to the audit |
| | Ø | Any other service that the Public Company Accounting Oversight Board determines, by regulation, is impermissible. |
Pre-approval of Non-Audit Services Provided to Other Entities Within the Prudential Fund Complex
Certain non-audit services provided to PGIM Investments LLC or any of its affiliates that also provide ongoing services to the Prudential Mutual Funds will be subject to pre-approval by the Audit Committee. The only non-audit services provided to these entities that will require pre-approval are those related directly to the operations and financial reporting of the Funds. Individual projects that are not presented to the Audit Committee as part of the annual pre-approval process will be subject to pre-approval by the Committee Chair (or any other Committee member on whom this responsibility has been delegated) so long as the estimated fee for those services does not exceed $30,000. Services presented for pre-approval pursuant to this paragraph will be accompanied by a confirmation from both the Treasurer and the independent accountants that the proposed services will not adversely affect the independence of the independent accountants.
Although the Audit Committee will not pre-approve all services provided to PGIM Investments LLC and its affiliates, the Committee will receive an annual report from the Fund’s independent accounting firm showing the aggregate fees for all services provided to PGIM Investments and its affiliates.
(e) (2) Percentage of services referred to in 4(b) – 4(d) that were approved by the audit committee –
For the fiscal years ended October 31, 2018 and October 31, 2017: none.
(f) Percentage of hours expended attributable to work performed by other than full time employees of principal accountant if greater than 50%.
The percentage of hours expended on the principal accountant’s engagement to audit the registrant’s financial statements for the most recent fiscal year that were attributed to work performed by persons other than the principal accountant’s full-time, permanent employees was 0%.
(g) Non-Audit Fees
The aggregate non-audit fees billed by KPMG for services rendered to the registrant’s investment adviser and any entity controlling, controlled by, or under common control with the investment adviser that provides ongoing services to the registrant for the fiscal years ended October 31, 2018 and October 31, 2017 was $0 and $0, respectively.
(h) Principal Accountant’s Independence
Not applicable as KPMG has not provided non-audit services to the registrant’s investment adviser and any entity controlling, controlled by, or under common control with the investment adviser that provides ongoing services to the registrant that were not pre-approved pursuant to Rule 2-01(c)(7)(ii) of Regulation S-X.
| | |
| Item 5 – | | Audit Committee of Listed Registrants – Not applicable. |
| |
| Item 6 – | | Schedule of Investments – The schedule is included as part of the report to shareholders filed under Item 1 of this Form. |
| |
| Item 7 – | | Disclosure of Proxy Voting Policies and Procedures for Closed-End Management Investment Companies – Not applicable. |
| |
| Item 8 – | | Portfolio Managers of Closed-End Management Investment Companies – Not applicable. |
| |
| Item 9 – | | Purchases of Equity Securities by Closed-End Management Investment Company and Affiliated Purchasers – Not applicable. |
|
| Item 10 – Submission of Matters to a Vote of Security Holders – Not applicable. |
|
| Item 11 – Controls and Procedures |
| | (a) | It is the conclusion of the registrant’s principal executive officer and principal financial officer that the effectiveness of the registrant’s current disclosure controls and procedures (such disclosure controls and procedures having been evaluated within 90 days of the date of this filing) provide reasonable assurance that the information required to be disclosed by the registrant has been recorded, processed, summarized and reported within the time period specified in the Commission’s rules and forms and that the information required to be disclosed by the registrant has been accumulated and communicated to the registrant’s principal executive officer and principal financial officer in order to allow timely decisions regarding required disclosure. |
| | (b) | There has been no significant change in the registrant’s internal control over financial reporting that occurred during the registrant’s most recent fiscal quarter of the period covered by this report that has materially affected, or is likely to materially affect, the registrant’s internal control over financial reporting. |
Item 12 – Exhibits
| | |
(a) (1) | | Code of Ethics – Attached hereto as Exhibit EX-99.CODE-ETH |
| | (2) | Certifications pursuant to Section 302 of the Sarbanes-Oxley Act – Attached hereto as Exhibit EX-99.CERT. |
| | (3) | Any written solicitation to purchase securities under Rule 23c-1. – Not applicable. |
| | (b) | Certifications pursuant to Section 906 of the Sarbanes-Oxley Act – Attached hereto as Exhibit EX-99.906CERT. |
SIGNATURES
Pursuant to the requirements of the Securities Exchange Act of 1934 and the Investment Company Act of 1940, the registrant has duly caused this report to be signed on its behalf by the undersigned, thereunto duly authorized.
| | |
Registrant: | | Prudential Investment Portfolios, Inc. 10 |
| |
By: | | /s/ Andrew R. French |
| | Andrew R. French |
| | Secretary |
| |
Date: | | December 18, 2018 |
Pursuant to the requirements of the Securities Exchange Act of 1934 and the Investment Company Act of 1940, this report has been signed below by the following persons on behalf of the registrant and in the capacities and on the dates indicated.
| | |
By: | | /s/ Stuart S. Parker |
| | Stuart S. Parker |
| | President and Principal Executive Officer |
| |
Date: | | December 18, 2018 |
| | |
By: | | /s/ Brian D. Nee |
| | Brian D. Nee |
| | Treasurer and Principal Financial and Accounting Officer |
| |
Date: | | December 18, 2018 |