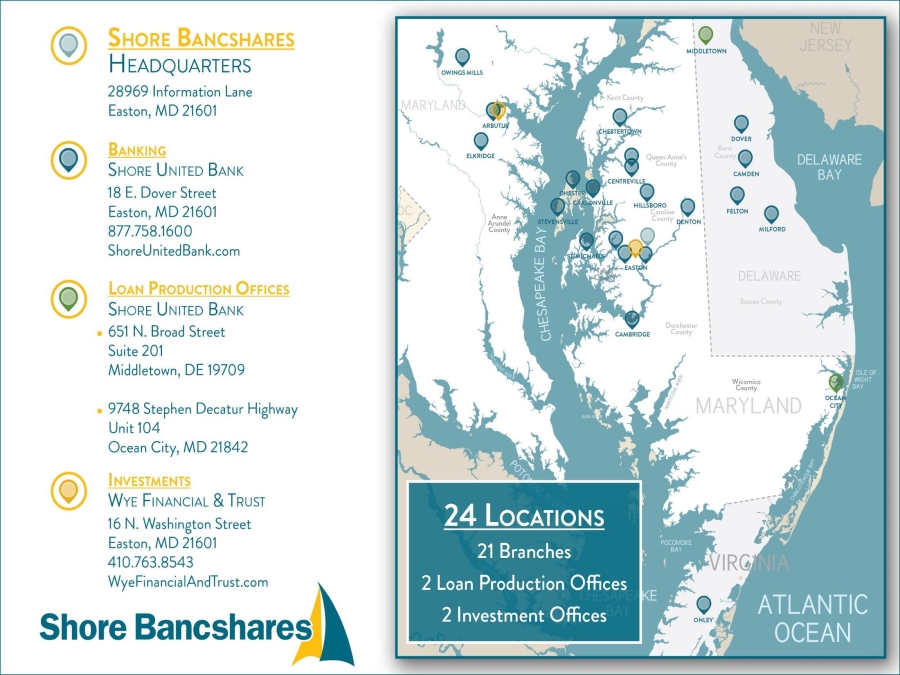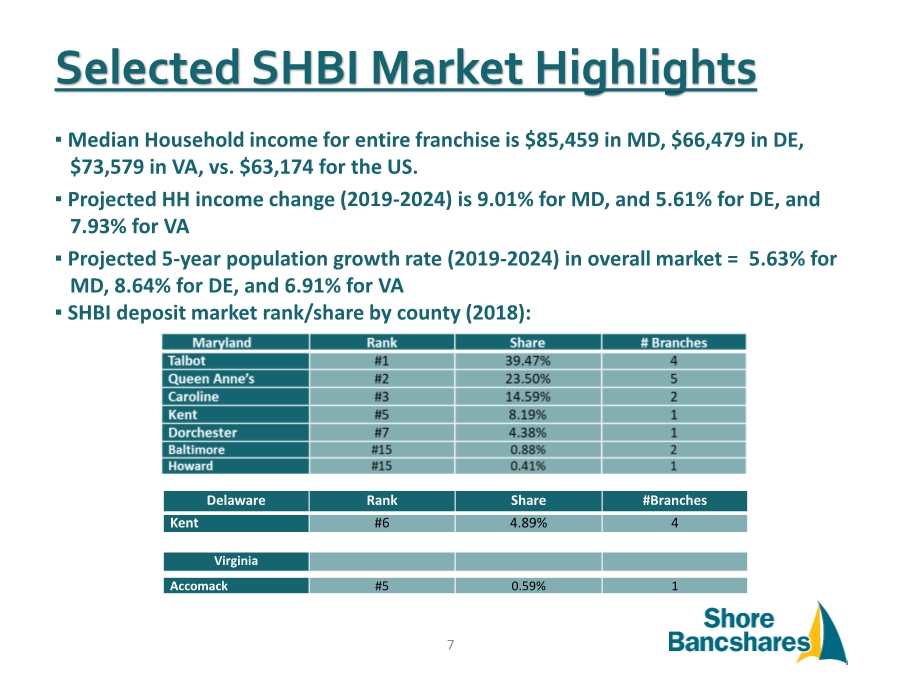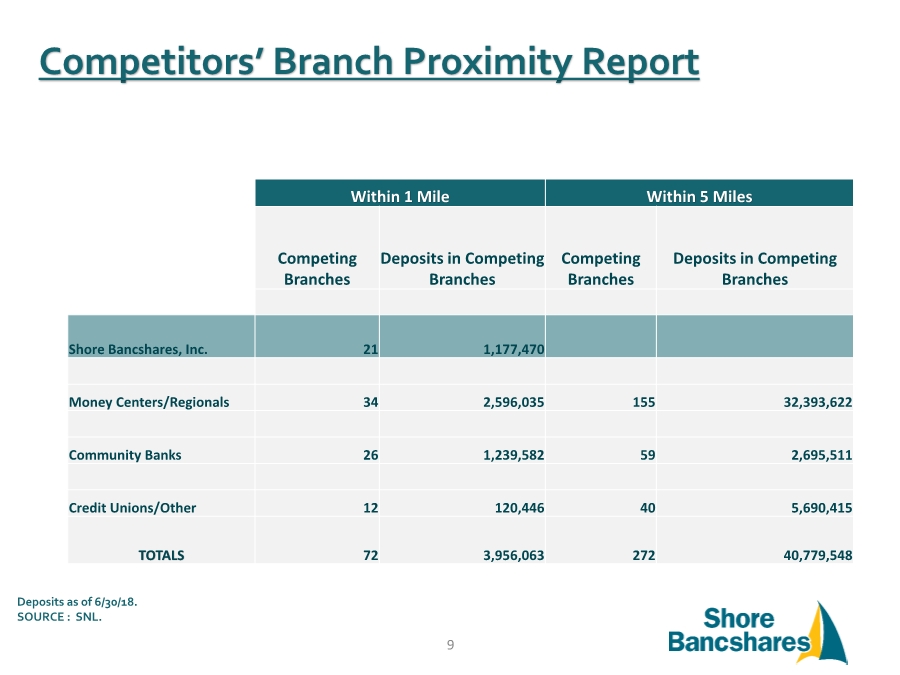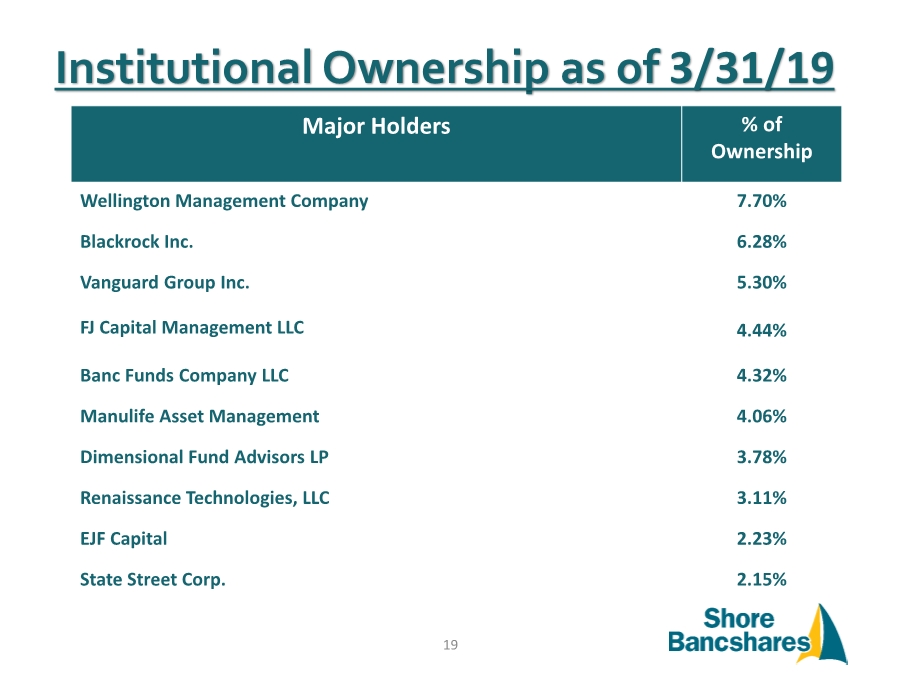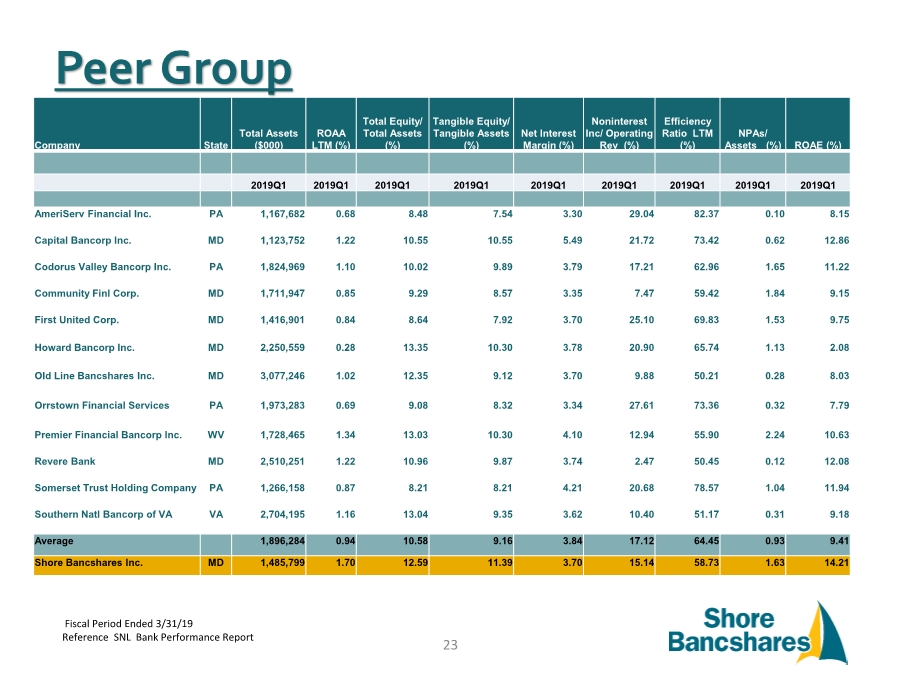
| Deposit Market Share: SHBI Market Market Rank Ticker Company Name City (HQ) HQ State Branches 2018 Total Deposits 2018 ($000) ’18 Market Share(%) 1 BAC Bank of America Corp. Charlotte NC 41 6,280,377 19.63 2 MTB M&T Bank Corp. Buffalo NY 54 5,058,554 15.81 3 PNC PNC Financial Services Group Inc. Pittsburgh PA 58 3,825,165 11.96 4 BBT BB&T Corp. Winston-Salem NC 51 3,599,255 11.25 5 WFC Wells Fargo & Co. San Francisco CA 26 2,872,780 8.98 6 SHBI Shore Bancshares Inc. Easton MD 21 1,177,470 3.68 7 FNB FNB Corp. Pittsburgh PA 13 870,144 2.72 8 HBMD Howard Bancorp Inc. Baltimore MD 10 834,963 2.61 9 FULT Fulton Financial Corp. Lancaster PA 10 807,618 2.52 10 --- Rosedale Federal Savings & Loan Association Baltimore MD 7 589,498 1.84 11 --- Capital Funding Bancorp Inc. Baltimore MD 1 582,524 1.82 12 COF Capital One Financial McLean VA 5 572,881 1.79 13 SASR Sandy Spring Bancorp Inc. Olney MD 3 422,318 1.32 14 Old Line Bancshares Inc. Bowie MD 7 415,794 1.30 15 --- Queenstown Bank Queenstown MD 8 412,339 1.29 16 PSB Holding Corp. Preston MD 8 352,027 1.10 17 WSFS WSFS Financial Corp. Wilmington DE 7 334,414 1.05 18 DLMV Delmarva Bancshares Inc. Cambridge MD 6 288,063 0.90 19 Orrstown Financial Services Inc. Shippensburg PA 4 281,395 0.88 20 Revere Bank Rockville MD 2 267,220 0.84 Other Market Participants (24) 55 2,144,240 6.70 Total 397 31,989,039 100.00 NOTE: SHBI Market defined as Maryland Counties of Kent, Queen Anne's, Talbot, Caroline, Dorchester, Baltimore, Howard; Kent County, Delaware; and Accomack County, VA. SOURCE: SNL Analysis YE2018 8 |