UNITED STATES
SECURITIES AND EXCHANGE COMMISSION
WASHINGTON, D.C. 20549
FORM 10-K
(MARK ONE) | | | | | | | | |
| ☒ | | ANNUAL REPORT PURSUANT TO SECTION 13 OR 15(d) OF THE SECURITIES EXCHANGE ACT OF 1934 |
For the fiscal year ended December 31, 2024
OR | | | | | | | | |
| ☐ | | TRANSITION REPORT PURSUANT TO SECTION 13 OR 15(d) OF THE SECURITIES EXCHANGE ACT OF 1934 |
For the transition period from to
Commission file number 000-30713
Intuitive Surgical, Inc.
(Exact name of Registrant as specified in its Charter) | | | | | | | | |
| Delaware | | 77-0416458 |
| (State or Other Jurisdiction of Incorporation or Organization) | | (I.R.S. Employer Identification Number) |
1020 Kifer Road
Sunnyvale, California 94086
(Address of principal executive offices) (Zip Code)
(408) 523-2100
(Registrant’s telephone number, including area code)
Securities registered pursuant to Section 12(b) of the Act: | | | | | | | | |
| Title of each class | Trading Symbol(s) | Name of each exchange on which registered |
| Common Stock, par value $0.001 per share | ISRG | The Nasdaq Global Select Market |
Securities registered pursuant to Section 12(g) of the Act: None
Indicate by check mark if the registrant is a well-known seasoned issuer, as defined in Rule 405 of the Securities Act. Yes ☒ No ☐
Indicate by check mark if the registrant is not required to file reports pursuant to Section 13 or Section 15(d) of the Act. Yes ☐ No ☒
Indicate by check mark whether the registrant (1) has filed all reports required to be filed by Section 13 or 15(d) of the Securities Exchange Act of 1934 during the preceding 12 months (or for such shorter period that the registrant was required to file such reports), and (2) has been subject to such filing requirements for the past 90 days. Yes ☒ No ☐
Indicate by check mark whether the registrant has submitted electronically every Interactive Data File required to be submitted pursuant to Rule 405 of Regulation S-T (§ 232.405 of this chapter) during the preceding 12 months (or for such shorter period that the registrant was required to submit such files). Yes ☒ No ☐
Indicate by check mark whether the registrant is a large accelerated filer, an accelerated filer, a non-accelerated filer, a smaller reporting company, or emerging growth company. See definition of “large accelerated filer,” “accelerated filer,” “smaller reporting company,” and “emerging growth company” in Rule 12b-2 of the Exchange Act.
| | | | | | | | | | | | | | |
| Large accelerated filer | ☒ | | Accelerated filer | ☐ |
| Non-accelerated filer | ☐ | | Smaller reporting company | ☐ |
| | | Emerging growth company | ☐ |
If an emerging growth company, indicate by check mark if the registrant has elected not to use the extended transition period for complying with any new or revised financial accounting standards provided pursuant to Section 13(a) of the Exchange Act. ☐
Indicate by check mark whether the registrant has filed a report on and attestation to its management’s assessment of the effectiveness of its internal control over financial reporting under Section 404(b) of the Sarbanes-Oxley Act (15 U.S.C. 7262(b)) by the registered public accounting firm that prepared or issued its audit report. ☒
If securities are registered pursuant to Section 12(b) of the Act, indicate by check mark whether the financial statements of the registrant included in the filing reflect the correction of an error to previously issued financial statements. ☐
Indicate by check mark whether any of those error corrections are restatements that required a recovery analysis of incentive-based compensation received by any of the registrant’s executive officers during the relevant recovery period pursuant to §240.10D-1(b). ☐
Indicate by check mark whether the registrant is a shell company (as defined in Rule 12b-2 of the Exchange Act). Yes ☐ No ☒
The aggregate market value of the voting and non-voting common equity held by non-affiliates on June 30, 2024, based upon the closing price of Common Stock on such date as reported on The Nasdaq Global Select Market, was approximately $157.3 billion. Shares of voting stock held by each officer and director have been excluded in that such persons may be deemed to be affiliates. This assumption regarding affiliate status is not necessarily a conclusive determination for other purposes.
The number of outstanding shares of the registrant’s common stock as of January 27, 2025, was 356,656,964.
DOCUMENTS INCORPORATED BY REFERENCE
Part III incorporates information by reference to the definitive proxy statement for the Company’s Annual Meeting of Stockholders to be held on or about May 1, 2025, to be filed within 120 days of the registrant’s fiscal year ended December 31, 2024.
INTUITIVE SURGICAL, INC.
INDEX
CAUTIONARY NOTE REGARDING FORWARD-LOOKING STATEMENTS
This report contains forward-looking statements within the meaning of Section 27A of the Securities Act of 1933, as amended, and Section 21E of the Securities Exchange Act of 1934, as amended. Forward-looking statements relate to expectations concerning matters that are not historical facts. Statements using words such as “estimates,” “projects,” “believes,” “anticipates,” “plans,” “expects,” “intends,” “may,” “will,” “could,” “should,” “would,” “targeted,” and similar words and expressions are intended to identify forward-looking statements. These forward-looking statements include, but are not limited to, statements related to future results of operations, future financial condition, the expected impacts of COVID-19 on our business, financial condition, and results of operations, our financing plans and future capital requirements, our potential tax assets or liabilities, and statements based on current expectations, estimates, forecasts, and projections about the economies and geographic markets in which we operate and our beliefs and assumptions regarding these economies and markets. These forward-looking statements are necessarily estimates reflecting the judgment of our management and involve a number of risks and uncertainties that could cause actual results to differ materially from those suggested by the forward-looking statements. These forward-looking statements should be considered in light of various important factors, including, but not limited to, the following: the overall macroeconomic environment, which may impact customer spending and our costs, including tariffs, the levels of inflation, and interest rates; the conflict between Ukraine and Russia; conflicts in the Middle East; disruption to our supply chain, including difficulties in obtaining a sufficient supply of materials; curtailed or delayed capital spending by hospitals; the impact of global and regional economic and credit market conditions on healthcare spending; delays in obtaining new product approvals, clearances, or certifications from the Food and Drug Administration (“FDA”), comparable regulatory authorities, or notified bodies; the risk of our inability to comply with complex FDA and other regulations, which may result in significant enforcement actions; regulatory approvals, clearances, certifications, and restrictions or any dispute that may occur with any regulatory body; healthcare reform legislation in the U.S. and its impact on hospital spending, reimbursement, and fees levied on certain medical device revenues; changes in hospital admissions and actions by payers to limit or manage surgical procedures; the timing and success of product development and customer acceptance of developed products; the results of any collaborations, in-licensing arrangements, joint ventures, strategic alliances, or partnerships, including the joint venture with Shanghai Fosun Pharmaceutical (Group) Co., Ltd.; our completion of and ability to successfully integrate acquisitions; intellectual property positions and litigation; risks associated with our operations and any expansion outside of the U.S.; unanticipated manufacturing disruptions or the inability to meet demand for products; our reliance on sole- and single-sourced suppliers; the results of legal proceedings to which we are or may become a party; adverse publicity regarding us and the safety of our products and adequacy of training; the impact of changes to tax legislation, guidance, and interpretations; changes in tariffs, trade barriers, and regulatory requirements (including potential new tariffs imposed by the current U.S. presidential administration on imports from Mexico, where we currently manufacture a significant majority of our instruments and accessories); and other risks and uncertainties, including those listed under the caption “Risk Factors.” Readers are cautioned not to place undue reliance on these forward-looking statements, which speak only as of the date of this report and which are based on current expectations and are subject to risks, uncertainties, and assumptions that are difficult to predict. Our actual results may differ materially and adversely from those expressed in any forward-looking statement, and we undertake no obligation to publicly update or release any revisions to these forward-looking statements, except as required by law. Additional risks are described throughout this report, particularly in Part I, “Item 1A. Risk Factors,” and include, but are not limited to, those summarized on the following pages.
RISKS RELATING TO OUR BUSINESS
•Our markets are highly competitive, and customers may choose to purchase our competitors’ products or services or may not accept robotic-assisted medical procedures, which could result in reduced revenue and loss of market share.
•We are subject to a variety of risks due to our operations outside of the U.S.
•We are subject to litigation, investigations, and other legal proceedings relating to our products, customers, competitors, and government regulators that could materially adversely affect our financial condition, divert management’s attention, and harm our business.
•We offer usage-based arrangements, including alternative capital acquisition approaches; as a result, we are exposed to an increased risk of losses of revenue and increased credit risk, which could adversely affect our business, financial condition, or results of operations.
•Our reliance on sole- and single-sourced suppliers and ability to purchase at acceptable prices a sufficient supply of materials could harm our ability to meet product demand in a timely manner or within budget.
•New product developments and introductions may adversely affect our business, financial condition, or results of operations.
•We may encounter manufacturing problems or delays that could result in lost revenue.
•We expect gross profit margins to vary over time, and changes in our gross profit margins could adversely affect our business, financial condition, or results of operations.
•Macroeconomic conditions could materially adversely affect our business, financial condition, or results of operations.
•Information technology system failures, cyberattacks, or deficiencies in our cybersecurity could harm our business, customer relations, financial condition, or results of operations.
•If our products do not achieve and maintain market acceptance, we will not be able to generate the revenue necessary to support our business.
•If hospitals are unable to obtain coverage and reimbursement for procedures using our products, if reimbursement is insufficient to cover the costs of purchasing our products, or if limitations are imposed by governments on the amount hospitals can charge for certain procedures, we may be unable to generate sufficient sales to support our business.
•If our products contain defects or encounter performance problems, we may have to recall our products and our reputation may suffer.
•We utilize distributors for a portion of our sales and service of our products in certain countries, which subjects us to a number of risks that could harm our business, financial condition, or results of operations.
•The failure to attract and retain key personnel could harm our ability to compete, and changes in our existing labor relationships could materially adversely impact our business, financial condition, or results of operations.
•Public health crises or epidemic diseases, or the perception of their effects, could materially adversely affect our business, financial condition, or results of operations.
•Negative publicity, whether accurate or inaccurate, concerning our products or our company could reduce market acceptance of our products and could result in decreased product demand and reduced revenues.
•We could be subject to significant, uninsured losses, which may have a material adverse impact on our business, financial condition, or results of operations.
•We experience long and variable contracting cycles and seasonality in our business, which may cause fluctuations in our financial results.
•Third parties may offer to sell remanufactured or unauthorized instruments and accessories to our customers or provide unauthorized service on our systems, which could adversely impact safety, our financial results, and our reputation.
•Our business is subject to complex and evolving laws and regulations regarding data privacy, data protection, artificial intelligence, and responsible use of data.
•Ongoing and future global conflicts could adversely affect our business, financial condition, or results of operations.
•Incorporating artificial intelligence technologies into our products, services, and operations may result in legal and regulatory risks or have other adverse consequences to our business, financial condition, or results of operations.
•Disruptions at the FDA and other government agencies or notified bodies could hinder their ability to hire, retain, or deploy personnel, or otherwise prevent products from being developed, cleared, certified, approved, or commercialized in a timely manner or at all, which may adversely affect our business, financial condition, or results of operations.
•We may incur losses associated with currency fluctuations and may not be able to effectively hedge our exposure.
•If we do not successfully manage our collaboration, licensing, joint venture, strategic alliance, or partnership arrangements with third parties, we may not realize the expected benefits from such arrangements, which may have a
material adverse effect on our business, financial condition, or results of operations.
•If we fail to successfully acquire or integrate new businesses, products, and technology, we may not realize expected benefits, or our business may be harmed.
•We are exposed to credit risk and fluctuations in the market value of our investments.
•Changes in our effective tax rate may adversely affect our business, financial condition, or results of operations.
•We are subject to risks associated with real estate construction and development.
•Climate change, natural disasters, or other events beyond our control could disrupt our business, financial condition, or results of operations.
•Consolidation in the healthcare industry could have an adverse effect on our business, financial condition, or results of operations.
•We use estimates, make judgments, and apply certain methods in determining our financial results and in measuring the progress of our business. As these estimates, judgments, and methods change, our results of operations and our assessment of the progress of our business could vary.
RISKS RELATING TO OUR REGULATORY ENVIRONMENT
•Complying with FDA and foreign regulations is a complex process, and our failure to fully comply could subject us to significant enforcement actions.
•Our products are subject to a lengthy and uncertain domestic regulatory review process. If we do not obtain and maintain the necessary domestic regulatory authorizations, we will not be able to sell our products in the U.S.
•Our products may cause or contribute to adverse medical events or be subject to failures or malfunctions that we are required to report to the FDA and foreign regulatory authorities and, if we fail to do so, we would be subject to sanctions that could harm our reputation, business, financial condition, or results of operations.
•If our manufacturing facilities do not continue to meet federal, state, or other manufacturing regulations and standards, we may be required to temporarily cease all or part of our manufacturing operations, import/export of our products, and/or recall some products, which could result in significant product delivery delays and lost revenue.
•Our products are subject to international regulatory processes and approval or certification requirements. If we do not obtain and maintain the necessary regulatory requirements, we will not be able to sell our products in other countries.
•Changes in healthcare legislation and policy may have an adverse effect on our business, financial condition, or results of operations.
•We are subject to federal, state, and foreign laws governing our business practices, which, if violated, could result in substantial penalties. Additionally, challenges to, or investigation into, our practices could cause adverse publicity and be costly to respond to and, thus, could harm our business, financial condition, or results of operations.
•If hospitals and other surgical facilities do not continue to meet federal, state, or other regulatory standards, they may be required to temporarily cease all or part of their system utilization.
RISKS RELATING TO OUR INTELLECTUAL PROPERTY
•If we are unable to fully protect and successfully defend our intellectual property from use by third parties, our ability to compete in the market may be harmed.
•Others may be successful in asserting that our products infringe their intellectual property rights, which may cause us to pay substantial damages and/or enjoin us from commercializing our products.
•Our products may rely on licenses from third parties, which may not be available to us on commercially reasonable terms or at all. If we lose access to these technologies, our revenues could decline.
GENERAL RISK FACTORS
•Our future operating results may be below expectations, which could cause our stock price to decline.
•Our stock price has been, and will likely continue to be, volatile.
•Changes to financial accounting standards may affect our reported results of operations.
The summary of material risk factors described above should be read together with the text of the full risk factors below in the section entitled “Item 1A. Risk Factors” and the other information set forth in this Annual Report on Form 10-K, including our Consolidated Financial Statements and the related notes, as well as other documents that we file with the U.S. Securities and Exchange Commission. The risks summarized above or described in full below are not the only risks that we face. Additional risks and uncertainties not precisely known to us or that we currently deem to be immaterial may also materially adversely affect our business, financial condition, or results of operations.
PART I
ITEM 1. BUSINESS
In this report, “Intuitive Surgical,” “Intuitive,” the “Company,” “we,” “us,” and “our” refer to Intuitive Surgical, Inc. and its wholly and majority-owned subsidiaries. Intuitive®, Intuitive Surgical®, da Vinci®, da Vinci S®, da Vinci Si®, da Vinci X®, da Vinci Xi®, da Vinci 5™, da Vinci SP®, EndoWrist®, Firefly®, Flexision®, Intuitive 3D Models™, Intuitive Hub™, Ion®, My Intuitive™, OnSite®, SimNow®, SureForm®, and SynchroSeal® are trademarks or registered trademarks of the Company.
Company Background
As part of Intuitive’s mission, we believe that minimally invasive care is life-enhancing care. By combining ingenuity and intelligent technology, we expand the potential of physicians to heal without constraints. We envision a future of care that is less invasive and profoundly better, where diseases are identified early and treated quickly so patients can get back to what matters most.
Since our founding 30 years ago, we have been delivering on this mission and vision by combining innovative technology with clinical expertise to advance minimally invasive care. We do so by providing a comprehensive ecosystem that includes robotic-assisted systems, instruments and accessories, customer learning, and support services all connected by a digital portfolio that enables actionable insights across the care continuum. Among other capabilities, these products and services can augment the skills and improve the efficiency of clinicians and care teams while providing decision support and learning that can help deliver differentiated clinical and economic value for patients, providers, and payers when compared to the next best available treatment options.
To assure continued alignment with the patients and healthcare community we serve, we have adopted the Quintuple Aim as our “north star.” Starting foremost with a focus on patients, we seek to demonstrate that our products can deliver better outcomes that are validated by rigorous peer-reviewed evidence. Second, we aim to work with clinicians and care teams to create better patient experiences that enable patients to more quickly get back to what matters most in their lives, with fewer complications, less pain and discomfort, and greater predictability. Third, we aim to enable the care teams who use our platforms and technology-enabled ecosystem to have better experiences that augment their skills while reducing fatigue and increasing efficiency and reliability. Fourth, we aim to help lower the total cost of care per patient episode when compared with existing treatment alternatives, providing a return on investment for hospitals and healthcare systems and value for payers. Lastly, we aim to expand access to high-quality minimally invasive care by partnering with hospitals, healthcare systems, and patient advocacy groups to address barriers to care.
While surgery and acute interventions have improved significantly in the past few decades, there remains a significant need to improve across all aspects of the Quintuple Aim. Stakeholders continue to expect better clinical outcomes and decreased variability of outcomes across clinicians and care teams. Globally, healthcare systems continue to be stressed and lacking in critical resources, including the professionals who staff care teams. At the same time, healthcare providers, payers, and governments strain to cover the healthcare needs of their populations and demand lower total cost per patient to treat disease. In the face of these challenges, we continue to believe that we are well-positioned to synthesize scientific and technological advances in biology, computing, imaging, algorithms, and robotics to deliver meaningful and measurable value to all of our stakeholders.
Products
Systems
Advanced robotic systems provide precise, powerful platforms with high-performance vision, extending the care team’s capabilities to enhance minimally invasive care. These systems include da Vinci surgical systems, which are designed to enable a wide range of surgical procedures using a minimally invasive approach, and the Ion endoluminal system, which extends our commercial offerings beyond surgery into diagnostic procedures, enabling minimally invasive biopsies in the lung.
Da Vinci Surgical Systems
By striving to find less invasive ways to enter the body, provide clearer views of anatomy and more precise tissue interactions, and help hone surgical skills, Intuitive launched its first da Vinci surgical system in 1999. In 2000, the FDA cleared da Vinci for general laparoscopic surgery. Since then, we have received numerous additional indications within the U.S. as well as outside of the U.S. Refer to the section titled “Regulatory Activities” in our Management’s Discussion and Analysis of Financial Condition and Results of Operations for more recent regulatory clearances, approvals, and certification.
There are several models of the da Vinci surgical system currently used by our customers: our recently released fifth-generation da Vinci 5 surgical system, our fourth-generation da Vinci X, da Vinci Xi, and da Vinci SP surgical systems, our third-generation da Vinci Si surgical system, and our second-generation da Vinci S surgical system. The da Vinci surgical
systems are designed to enable surgeons to perform a wide range of surgical procedures within our targeted general surgery, urologic, gynecologic, cardiothoracic, and head and neck specialties. Da Vinci systems offer surgeons three-dimensional, high definition (“3DHD”) vision, a magnified view, and robotic and computer assistance. They use specialized instrumentation, including a miniaturized surgical camera (endoscope) and wristed instruments (e.g., scissors, scalpels, and forceps) that are designed to help with precise dissection and reconstruction deep inside the body.
Our da Vinci surgical systems are comprised of the following components:
Surgeon Console. The da Vinci surgical system allows surgeons to operate while comfortably seated at an ergonomic console viewing a 3DHD image of the surgical field. The surgeon’s fingers grasp instrument controls below the display with the surgeon’s hands naturally positioned relative to his or her eyes. Using electronic hardware, software, algorithms, and mechanics, our technology translates the surgeon’s hand movements into precise and corresponding real-time micro movements of the da Vinci instruments positioned inside the patient. On most of our current systems (da Vinci 5, da Vinci X, da Vinci Xi, da Vinci SP, and da Vinci Si), a second surgeon console may be used in two ways: to provide assistance to the primary surgeon during surgery or to act as an active aid during surgeon-proctor training sessions. With the da Vinci 5, da Vinci X, da Vinci Xi, da Vinci SP, and da Vinci Si, a surgeon sitting at a second console can view the same surgery as the primary surgeon and can be passed control of some or all of the da Vinci instruments during the surgery. In addition, surgeons can control 3D virtual pointers to augment the dual-surgeon experience. The da Vinci surgical system is designed to allow surgeons to operate while seated, which may be clinically advantageous because of reduced surgeon fatigue. The da Vinci surgical system’s design provides natural hand-eye alignment at the surgeon console. Because the da Vinci surgical system’s robotic arms hold the camera and instruments steady, there is less surgeon and assistant fatigue and enhanced control by the surgeon.
Patient-Side Cart. The patient-side cart holds electromechanical arms that manipulate the instruments inside the patient. For our da Vinci 5, da Vinci X, da Vinci Xi, and da Vinci Si surgical systems, up to four arms attached to the cart can be positioned, as appropriate, and then locked into place. At least two arms hold surgical instruments, one representing the surgeon’s left hand and one representing the surgeon’s right hand. A third arm positions the endoscope, allowing the surgeon to easily move, zoom, and rotate the field of vision. A fourth instrument arm extends surgical capabilities by enabling the surgeon to add a third instrument to perform additional tasks. The fourth instrument arm is a standard, integrated feature on the da Vinci 5, da Vinci X, da Vinci Xi, and da Vinci Si surgical systems. Our da Vinci single-port (“SP”) surgical system includes a single arm with three multi-jointed, wristed instruments and the first da Vinci fully wristed, 3DHD camera. The instruments and the camera all emerge through a single cannula and are triangulated around the target anatomy to avoid external instrument collisions that can occur in narrow surgical workspaces.
3DHD Vision System. Our vision system includes a 3DHD endoscope with two independent vision channels linked to two separate color monitors through sophisticated image processing electronics and software. The resulting 3DHD image has high resolution, high contrast, low flicker, and low cross fading. A digital zoom feature in the 3DHD vision system allows surgeons to magnify the surgical field of view without adjusting the endoscope position and, thereby, reduces interference between the endoscope and instruments. The 3DHD vision system is a standard, integrated feature on the da Vinci 5, da Vinci X, da Vinci Xi, da Vinci SP, da Vinci Si, and da Vinci S surgical systems.
Firefly Fluorescence Imaging (“Firefly”). Firefly is a standard feature of the da Vinci 5, da Vinci X, da Vinci Xi, and da Vinci SP surgical systems and is available as an upgrade on our da Vinci Si surgical system. This imaging capability combines an injectable fluorescent dye with a specialized da Vinci camera head, endoscope, and laser-based illuminator to allow surgeons to identify vasculature, tissue perfusion, or biliary ducts in three dimensions beneath tissue surfaces in real-time. The most common procedural categories for the use of Firefly are urology, gynecology, and general surgery.
Da Vinci Integrated Table Motion. Integrated Table Motion coordinates the movements of the da Vinci robotic arms with an advanced operating room (“OR”) table, the TS 7000dV OR Table sold by Hillrom (now a part of Baxter International Inc.), to enable managing the patient’s position in real-time while the da Vinci robotic arms remain docked. This gives OR teams the capability to improve the positioning of the operating table during da Vinci surgical system procedures. Integrated Table Motion enables the patient to be dynamically positioned during the procedure. It enables surgeons to extend reach, facilitate access, and choose the angle of approach to target anatomy, as well as reposition the table during the procedure to enhance anesthesiologists’ management of the patient. Integrated Table Motion is a standard feature for da Vinci 5 surgical systems and is available as an upgrade for da Vinci Xi surgical systems.
Ion Endoluminal System
In 2019, the FDA cleared our Ion endoluminal system, which is a flexible, robotic-assisted, catheter-based platform that utilizes instruments and accessories for which the first cleared indication is minimally invasive biopsies in the lung. Our Ion system extends our commercial offering beyond surgery into diagnostic, endoluminal procedures. The system features an ultra-thin, ultra-maneuverable catheter that can articulate 180 degrees in all directions and allows navigation far into the peripheral
lung and provides the stability necessary for precision in a biopsy. Many suspicious lesions found in the lung may be small and difficult to access, which can make diagnosis challenging, and Ion helps physicians obtain tissue samples from deep within the lung, which could help enable earlier diagnosis.
Instruments and Accessories
We offer a comprehensive suite of stapling, energy, and core instrumentation for our multi-port da Vinci surgical systems. Our technology is designed to transform the surgeon’s natural hand movements outside of the body into corresponding micro-movements inside the patient’s body and suture with precision, just as they can in open surgery. With our technology, a surgeon can also use “motion scaling,” a feature that translates, for example, a three-millimeter hand movement outside the patient’s body into a one-millimeter instrument movement in the surgical field inside the patient’s body. Motion scaling is designed to allow precision and control for delicate tasks. In addition, our technology filters the tremor inherent in a surgeon’s hands.
Da Vinci Instruments. Most of the instruments that we manufacture incorporate wristed joints for natural dexterity and tips customized for various surgical procedures. Various da Vinci instrument tips include forceps, scissors, electrocautery tools, scalpels, and other surgical tools that are familiar to the surgeon from open surgery and conventional minimally invasive surgery (“MIS”). A variety of instruments may be selected and used interchangeably during a surgery. Most instruments are sterilizable at the hospital, while others are provided sterile, and most are reusable for a defined number of procedures. A programmed memory chip inside each instrument performs several functions that help determine how the da Vinci system and instruments work together. In addition, the chip generally will not allow the instrument to be used for more than the prescribed number of procedures to help ensure that its performance meets specifications during each procedure.
Da Vinci Stapling. The SureForm and EndoWrist staplers are wristed, stapling instruments intended for resection, transection, and creation of anastomoses. These instruments enable surgeons to precisely position and fire the stapler. We have various staplers that can be used with our da Vinci 5, da Vinci X, and da Vinci Xi surgical systems: the SureForm 30, 45, and 60 staplers, where the numeric designation indicates the length of the staple line. The SureForm 30, 45, and 60 staplers are single-use, fully wristed, stapling instruments intended to be used in general, thoracic, gynecologic, urologic, and pediatric surgical procedures. The SureForm 30 stapler may deliver particular utility in thoracic procedures. The SureForm 45 stapler may receive particular use in thoracic and colorectal procedures where maneuverability and visualization are limited. The SureForm 60 stapler is intended to deliver particular value in bariatric procedures. Outside of the U.S. (“OUS”), we also offer the EndoWrist 30 and 45 staplers that can be used with our da Vinci X and da Vinci Xi surgical systems. The EndoWrist 30 stapler is intended to deliver particular utility with fine tissue interaction in lobectomy and other thoracic procedures. The EndoWrist 45 stapler is used in general, gynecologic, thoracic, and urologic surgical procedures. We also have various clearances for five stapler reloads: gray (2.0 mm), white (2.5 mm), blue (3.5 mm), green (4.3 mm), and black (4.6 mm). Not all reloads are available for use on all staplers. Not all staplers or reloads are available in all countries.
Da Vinci Energy. Our first-generation E-100 generator is offered as an upgrade to power our da Vinci Vessel Sealer Extend and SynchroSeal instruments. Additionally, we recently introduced our second-generation E-200 generator, an advanced electrosurgical generator designed to provide high-frequency energy for cutting, coagulation, and vessel sealing of tissues. The E-200 generator is integrated with the da Vinci 5 surgical system, is compatible with our da Vinci X and Xi surgical systems, and can also function as a standalone electrosurgical generator.
Vessel Sealer Extend is a single-use, fully wristed, advanced bipolar instrument that is compatible with our da Vinci 5, da Vinci X, and da Vinci Xi surgical systems. It is intended for grasping and blunt dissection of tissue, bipolar coagulation, and mechanical transection of vessels up to 7 mm in diameter and tissue bundles that fit in the jaws of the instrument. This instrument enables surgeons to control vessel sealing, while providing the benefits of robotic-assisted surgery, and is designed to enhance surgical efficiency and autonomy in a variety of general and gynecologic surgical procedures.
SynchroSeal enables a surgeon to perform rapid, one-step sealing and transection with a single pedal press. SynchroSeal uses advanced bipolar energy from its raised cut electrode to transect tissue and then cool down quickly.
Accessory Products. We sell various accessory products, which are used in conjunction with the da Vinci surgical systems as surgical procedures are performed. Accessory products include sterile drapes used to help ensure a sterile field during surgery, vision products, such as replacement 3D stereo endoscopes, camera heads, and light guides, and other items that facilitate the use of the da Vinci surgical systems.
Instruments and accessories are also used with our Ion endoluminal system to perform lung biopsy procedures and for the operation and maintenance of the system.
Ion Instruments. Instruments utilized with our Ion system include our fully articulating catheter, which is employed to navigate the intricate and narrow airways of the lungs, our peripheral vision probe, an endoscope that provides real-time
airway visualization for catheter navigation, and our Flexision biopsy needles, which are used to procure tissue samples from lung nodules.
Accessory Products. Accessory products that are used in conjunction with the Ion system include cleaning tools and other ancillary equipment essential for the operation and maintenance of the Ion system.
Learning
Intuitive provides a progressive learning journey to support the use of our technology. These training pathways leverage both learning engagements and learning technologies. Learning engagement touchpoints vary by specific pathway, skill level, and interest, while learning technologies enable and provide training directly to the customer. The portfolio of learning offerings includes role-specific training pathways, learning engagements, and learning technology.
Training Pathways. Intuitive’s training pathways provide a systematic learning journey that helps customers build technical proficiency. There are pathways for surgeons and physicians, residents and fellows, OR care teams, patient side assists, and robotic coordinators, as well as recommendations for executives.
Learning Engagements. Intuitive learning engagements are touchpoints that support customers throughout their learning journeys. They vary by pathway, skill level, and focus area. Engagements include case observations, online education, in-service training, simulation/skills training, OR care team training, technology training, reprocessing training, proctoring, advanced training, and curriculum development support. Many of these programs take place at Intuitive training centers and are taught by experienced Intuitive staff, while our advanced courses are taught by surgeon and physician instructors.
Learning Technology. Learning technologies are designed to help customers access training. Enabling technology helps bring innovative offerings to the customer. Intuitive’s enabling technologies include Telepresence and the Advanced Insights Suite (which includes Case Insights and Insights Engine). Learning technology solutions include Intuitive Learning, SimNow, customized training models, remote case observations, and remote proctoring. Two of the technology solutions most often used by customers are Intuitive Learning and SimNow.
Intuitive Learning. Intuitive Learning enables customers to complete technology and procedure education, while also being able to view, assign, and track technology and simulation learning. Intuitive Learning’s user roles include surgeons/physicians, residents/fellows, care teams, patient side assists, robotic coordinators, and sterile reprocessing staff.
SimNow. Our cloud-enabled SimNow simulation platform is a practice tool that gives a user the opportunity to practice their skills and gain familiarity with the surgeon console controls and supports the user’s progressive learning pathway. SimNow incorporates 3D, physics-based computer simulation technology to immerse the user within a virtual environment and provides training capabilities that have been used extensively by surgeons. The user navigates through the environment and completes exercises by controlling virtual instruments from the surgeon console. Upon completion of a skills exercise, the skills simulator provides a quantitative assessment of user performance based on a variety of task-specific metrics. The SimNow online connection drives real-time simulation performance tracking for surgeons and administrators through an online dashboard and supports remote updates of the VR content and 3DHD videos to drive a more interactive and engaging customer experience. SimNow is intended to augment, not replace, existing training programs for the da Vinci 5, da Vinci X, da Vinci Xi, and da Vinci SP surgical systems.
Services
We have a network of field service engineers across the U.S., Canada, Europe, and Asia and maintain relationships with various distributors around the globe. This infrastructure of service and support specialists offers a full complement of services for our customers, including installation, repair, maintenance, 24/7 technical support, and proactive system health monitoring.
Our comprehensive support and program assistance helps ensure customers and care teams maximize program performance and protect their investment. Services include readiness support, maintenance support, perioperative consulting, Custom Hospital Analytics, and market consulting optimization.
Readiness and Maintenance Support. Readiness support is operational support to ensure smooth onboarding and adoption of new systems and technology. Maintenance support helps to maximize operational efficiency and reduce unplanned equipment downtime. It includes service care plans, support teams, OnSite monitoring, software upgrades and updates, as well as a customer portal. The service plan portfolio offers flexible service plans to ensure reliability of the systems and instruments and help optimize the robotics program. The support team of expert field service, remote technical support, and customer care agents resolve and prevent technology issues that could inhibit optimal utilization. OnSite monitoring offers remote service in real-time for pre-operative and intraoperative troubleshooting, as well as proactive monitoring of system performance. Software upgrades and updates enable the latest product innovations, enhancements, and reliability improvements. The customer portal is an online tool that enables customers to access system utilization and program
analytics, view orders and maintenance history, and initiate product returns and exchanges to help achieve the operational and financial goals of a robotics program.
Perioperative Consulting. Perioperative consulting is a suite of customized solutions to improve a hospital’s efficiency and performance with Intuitive technologies. New system integration support is available to streamline the start-up process and expedite increased procedure volumes. Overall program assessments help to support efficiency improvements, cost reductions, and system access optimization.
Program Analytics. Our Custom Hospital Analytics program enables the integration of data sources so that individual health institutions can analyze their data in their own environment. Using this data, executives, administrators, care teams, and surgeons can gain alignment around their programs based on their KPIs, determine best practices, assess gaps, and take actionable steps to address any gaps.
Digital Solutions
Integrated digital capabilities provide connected offerings, streamlining performance for hospitals with program-enhancing insights. Secure-by-design, cloud-enabled products analyze and simplify essential data to continuously optimize the use of time, tools, and techniques.
Intuitive Hosted & Managed Services. The vast majority of our systems are network connected and directly communicate with Intuitive to enable proactive monitoring of product performance to provide high uptime reliability, as well as provide software updates and data insights to Intuitive customers.
3D Modeling Services. Intuitive 3D Models is our augmented reality imaging product for use in kidney, prostate, lung, and rectal procedures. The service extracts CT and MR scans, runs them through segmentation algorithms and, after technicians’ revision and radiologists’ review, returns a 3D segmented model of the organ for use in planning for a procedure, intraoperative visualization, and surgical education. The tool uses augmented reality to give surgeons an image with details of organ anatomy – blood vessels, tumor shape, and size – that they may not be able to see well with other two-dimensional imaging. Intuitive designed this to help with pre-operative planning and intraoperative guidance to let surgeons know where critical anatomy sits as they work through a procedure, as well as to be shared as a teaching tool for other physicians and patients. The product has recently been launched, and we are in the process of bringing the first sites onboard.
My Intuitive. This mobile and web application was developed to be the single point for Intuitive customers to access individual or program-level data from Intuitive. The application also offers comparisons of those insights with anonymized national benchmarks to help drive operational efficiencies and decreased costs. It enables mobile access to Intuitive’s Learning platform, case reports generated automatically for the surgeon, and an ability for surgeons to publish their practice information online for patients seeking local physicians.
Intuitive Hub. Intuitive Hub is an OR informatics platform that integrates multiple applications and data sets to help orchestrate medical procedure workflows. For the care team, Intuitive Hub acts as a point-of-care device that automates tasks, such as video recording and bookmarking. The Intuitive Telepresence application on Hub can be used to facilitate peer-to-peer collaboration, learning, and support. Video captured during surgery and da Vinci system data are connected via Intuitive Hub for physicians to access after a surgical procedure, helping to facilitate personalized learning and increase efficiency.
Business Strategy
We align our goals to those of our customers, often called the Quintuple Aim: enabling physicians and hospitals to improve outcomes for their patients, improve their patient’s experience, improve the care team’s experience, address barriers to expanding access to high quality minimally invasive care, and lower the total cost to treat per patient episode. Through the use of Intuitive’s smart, connected systems, robotic technologies, advanced imaging, and informatics, our objective is to create value for patients, physicians, and hospitals, as summarized below.
Patient Value. We believe that the value of a medical procedure to a patient can be defined: Patient Value = Procedure Efficacy / Invasiveness. We define procedure efficacy as a measure of the success of the procedure in helping resolve the underlying disease, and invasiveness as a measure of patient pain and disruption of regular activities. When the patient value of a procedure using an Intuitive product is greater than that of alternative intervention options, patients may benefit from seeking out physicians and hospitals that offer those products, which could potentially result in a local market share shift. Adoption of Intuitive technology occurs by procedure and by market and is driven by the relative patient value and the total intervention costs of da Vinci and Ion procedures as compared to alternative intervention options for the same disease state or condition. We believe that most patients will place a higher value on procedures that are not only more efficacious but also less invasive than alternative interventions. Our goal is to provide products to
physicians who, in turn, provide patients with procedure options that are both highly effective and less invasive than others. Furthermore, we will work to increase access to minimally invasive care.
Physician Value. We offer physicians and their operating room staff training on the technical use of our products. Our da Vinci surgical system provides an ergonomic platform for surgeons to perform their procedures. We seek to provide surgeons with reliable and easy-to-use products. For example, the change to cloud-based analytics and routine use of local analytics may help surgeons track their procedures and processes and, with a network-connected smartphone and the My Intuitive app, surgeons can access and explore their procedure data, such as console time and instrument usage, to gain insights into their program. Ion brings physicians an immersive bronchoscopy experience from visualizing the lung anatomy and planning each patient’s procedure to navigating and biopsying small nodules in the peripheral lung. Results from early studies have demonstrated relatively low occurrence of pneumothorax requiring intervention.
Hospital Value. We help hospitals build value by increasing surgical revenue and reducing costs through lower complication rates and reduced lengths of patient stay. For example, we believe robotic-assisted surgery with the da Vinci surgical system is a cost-effective approach to many surgeries as compared to alternative treatment options, as recognized in many published studies. We also offer our Custom Hospital Analytics program, which enables the integration of data sources so that individual health institutions can analyze their data in their own environment. Using this data, administrators, chiefs of surgery, and surgeons can gain alignment around their programs based on their KPIs, determine best practices, assess gaps, and take actionable steps to address any gaps.
Clinical Applications
We are the beneficiaries of productive collaborations with leading surgeons in exploring and developing new techniques and applications for robotic-assisted surgery with the da Vinci surgical system and minimally invasive biopsies with the Ion endoluminal system—an important part of our creative process. We primarily focus our development efforts on those procedures in which we believe our products bring the highest patient value, surgeon value, and hospital value. We currently focus on five surgical specialties: general surgery, urologic surgery, gynecologic surgery, cardiothoracic surgery, and head and neck surgery. Key procedures that we are focused on include hernia repair, colon and rectal procedures, cholecystectomy, bariatric surgery, prostatectomy, partial nephrectomy, hysterectomy, sacrocolpopexy, lobectomy, and transoral robotic surgery. We also focus on minimally invasive biopsies in the lung. Representative surgical applications are described below.
General Surgery
Hernia Repair. A hernia occurs when an organ or other tissue squeezes through a weak spot in a surrounding muscle or connective tissue. During a hernia repair surgery, the weakened tissue is secured, and defects are repaired. Common types of hernias are ventral and inguinal. Ventral, or abdominal hernia, may occur through a scar after surgery in the abdomen. Inguinal hernia is a bulge in the groin and is more common in men. Hernia repair can be performed using traditional open surgery or MIS. There is a wide range of complexity in hernia repair surgeries and varying surgeon opinions regarding optimal surgical approach. The benefits of minimally invasive and robotic-assisted hernia repair surgery vary by patient.
Colorectal Surgery. These procedures typically involve benign or cancerous conditions of the lower digestive system, in particular the rectum or colon. Common procedures in this area include hemicolectomy, sigmoidectomy, low anterior resection, and abdominoperineal resection. Surgeons have reported that the use of robotic-assisted surgery with a da Vinci surgical system and our latest technologies, such as the SureForm stapler and da Vinci energy products, has enabled them to offer MIS approaches to a broader range of colorectal surgery patients.
Cholecystectomy. Cholecystectomy, or the surgical removal of the gallbladder, is a commonly performed general surgery procedure. Cholecystectomy is the primary method for the treatment of gallstones and other gallbladder diseases. Most cholecystectomies are performed using multi-port MIS techniques, although some surgeons choose to perform cholecystectomy using manual single-port instrumentation. Firefly technology can be used to visualize biliary anatomy in three dimensions beneath the tissue surfaces during multi-port da Vinci cholecystectomies.
Bariatric Surgery. A body of literature points to the benefit of surgery to treat patients with morbid obesity and its secondary effects, such as diabetes. Sleeve gastrectomy and Roux-en-Y gastric bypass (“RYGB”) are commonly performed surgical procedures for morbid obesity in the U.S. The body habitus of morbidly obese patients can make laparoscopic surgery physically challenging for the surgeon, and certain surgeons have found value in using the da Vinci surgical system to improve upon the ergonomics when performing MIS in morbidly obese patients. In addition, RYGB can be a technically challenging procedure due to the suturing, stapling, and tissue (bowel) manipulation that is required. Surgeons using the da Vinci surgical system have reported a reduction in a critical complication (anastomotic leaks) relative to laparoscopic RYGB. Also, we believe SureForm 60 may have particular utility in bariatric procedures.
Urologic Surgery
Prostatectomy. Radical prostatectomy is the removal of the prostate gland in patients diagnosed with clinically localized prostate cancer. The standard approach to the removal of the prostate was via an open surgical procedure. The conventional laparoscopic approach is an option, but it is difficult and poses challenges to even the most skilled urologist. The da Vinci surgical system has enabled a large number of surgeons to convert from using an open surgical technique to a minimally invasive technique.
Partial Nephrectomy. Partial nephrectomy is the removal of a small portion of a kidney (typically, an area of the kidney containing a tumor). Partial nephrectomies are most commonly performed in patients diagnosed with clinically localized renal cancer. Excluding robotic-assisted surgery with a da Vinci surgical system, there are three common surgical approaches to performing partial nephrectomies: open surgical technique, laparoscopy, and hand-assisted laparoscopy, which is a hybrid of the open and laparoscopic techniques. Surgeons have reported that the da Vinci surgical system’s capabilities may enable a large number of these procedures to be performed through a minimally invasive technique, conferring the benefits of MIS to a broader range of partial nephrectomy patients. Treatment guidelines for patients with localized renal cancer recommend partial nephrectomy due to the benefits that nephron-sparing surgery has in long-term patient outcomes. Published clinical literature has shown that the presence of a da Vinci surgical system is associated with a higher-proportion of patients receiving a guideline-recommended partial nephrectomy.
Gynecologic Surgery
Hysterectomy. Removal of the uterus is one of the most commonly performed surgeries in gynecology and is performed for a variety of underlying benign and cancerous conditions. Hysterectomies can be performed using open surgery (laparotomy) or MIS techniques, which include vaginal, laparoscopic, and robotic-assisted approaches. Prior to the clearance of the da Vinci surgical system for use in gynecological procedures in 2005, the majority of hysterectomies performed were open surgeries. We believe that robotic-assisted surgery with the da Vinci surgical system provides patients the opportunity to receive a minimally invasive treatment as an alternative to an open hysterectomy.
Sacrocolpopexy. The abdominal (open) sacrocolpopexy is one of the operations performed to treat vaginal vault prolapse. Sacrocolpopexy involves suturing a synthetic mesh that connects and supports the vagina to the sacrum (tailbone). A sacrocolpopexy can be performed using a conventional laparoscopic technique; however, it is generally described as difficult and cumbersome to perform. Surgeons have reported that the da Vinci surgical system’s capabilities may enable a larger number of these procedures to be performed through a minimally invasive technique, conferring the benefits of MIS to a broader range of sacrocolpopexy patients.
Cardiothoracic Surgery
Thoracic Surgery. Conventional approaches to surgical procedures in the thorax include both open and video-assisted thoracoscopic approaches. Procedures performed via these methods include pulmonary wedge resection, pulmonary lobectomy, thymectomy, mediastinal mass excision, and esophagectomy. Many thoracic procedures remain open procedures. Surgeons have reported that the use of robotic-assisted surgery with a da Vinci surgical system in thoracic surgery has enabled them to offer MIS approaches to a broader range of thoracic surgery patients and improved clinical outcomes compared to open and video-assisted thoracic surgery in published single-center, multi-center, and national database clinical studies. Also, we believe the EndoWrist 30 stapler and the SureForm 30 stapler may have particular utility in thoracic procedures.
Head and Neck Surgery
Transoral Surgery. Head and neck cancers are typically treated by either surgical resection or chemo-radiation, or a combination of both. Surgical resection performed by an open approach may require a “jaw-splitting” mandibulotomy. This procedure, while effective in treating cancer, is potentially traumatic and disfiguring to the patient. MIS approaches via the mouth (transoral surgery) are challenged by line-of-sight limitations dictated by conventional endoscopic tools. Chemo-radiation as a primary therapy does allow patients to avoid traumatic surgical incisions; however, the literature suggests that this modality diminishes patients’ ability to speak and swallow normally. Surgeons have reported that da Vinci transoral surgery allows them to operate on tumors occurring in the oropharynx (i.e., tonsil and base of tongue) and larynx via the mouth and to overcome some of the line-of-sight limitations of conventional transoral surgery.
Da Vinci Procedure Mix
Our da Vinci procedure business is broadly split into two categories: (1) cancer procedures and (2) procedures for benign conditions. Cancer and other highly complex procedures tend to be reimbursed at higher rates than less complex procedures for benign conditions. Thus, hospitals are more sensitive to the costs associated with treating less complex, benign conditions. Our strategy is to provide hospitals with attractive clinical and economical solutions across the spectrum of procedure complexity. Our fully featured da Vinci 5 and da Vinci Xi surgical systems with advanced instruments (including the da Vinci energy and
da Vinci stapler products) and our Integrated Table Motion product target the more complex procedure segment. Our da Vinci X surgical system is targeted toward price-sensitive markets and procedures. Our da Vinci SP surgical system complements our da Vinci 5, da Vinci X, and Xi surgical systems by enabling surgeons to access narrow workspaces.
Clinical Summary
There are over 70 representative clinical uses for da Vinci surgical systems. We believe that there are numerous additional applications that can be addressed with the da Vinci surgical system, and we work closely with our surgeon customers to refine and explore new techniques in which a da Vinci surgical system may bring value. As of December 31, 2024, we had an installed base of 9,902 da Vinci surgical systems, including 5,807 in the U.S., 1,867 in Europe, 1,745 in Asia, and 483 in the rest of the world. We estimate that surgeons using our technology completed approximately 2,683,000 surgical procedures of various types in hospitals throughout the world during the year ended December 31, 2024.
Additionally, over time, we believe that there are numerous additional applications that can be addressed with our Ion endoluminal system. As of December 31, 2024, we had an installed base of 805 Ion systems, 784 of which are located in the U.S. We plan to seek additional clearances, certifications, or approvals for Ion in OUS markets over time.
Sales and Customer Support
Sales Model
We provide our products through direct sales organizations in the U.S., Europe (excluding Spain, Portugal, Italy, Greece, and Eastern European countries), China, Japan, South Korea, India, Taiwan, and Canada. We provide products and services in China through our majority-owned joint venture (“Joint Venture”) with Shanghai Fosun Pharmaceutical (Group) Co., Ltd. (“Fosun Pharma”) and its affiliates. See “Item 7. Management’s Discussion and Analysis of Financial Condition and Results of Operations” for further details on the Joint Venture. In the remainder of our markets outside of the U.S., we provide our products through distributors. During the years ended December 31, 2024, 2023, and 2022, domestic revenue accounted for 67%, 66%, and 67%, respectively, of total revenue, while revenue from our OUS markets accounted for 33%, 34%, and 33%, respectively, of total revenue.
Our direct sales organization is composed of a capital sales team, responsible for selling systems, and a clinical sales team, responsible for supporting the systems used in procedures performed at our hospital accounts. Our hospital accounts include both individual hospitals and healthcare facilities as well as hospitals and healthcare facilities that are part of an integrated delivery network (“IDN groups”). The initial system sale into an account is a major capital equipment purchase by our customers and typically has a lengthy sales cycle that can be affected by macroeconomic factors, capital spending prioritization, the timing of budgeting cycles, and the evaluation of alternative products. Capital sales activities include educating surgeons or physicians and hospital staff across multiple specialties on the benefits of robotic-assisted surgery with a da Vinci surgical system or robotic-assisted bronchoscopy with an Ion endoluminal system, total treatment costs, and the clinical applications that our technology enables. We also train our sales organization to educate hospital management on the potential benefits of adopting our technology, including the clinical benefits of robotic-assisted surgery with a da Vinci surgical system or robotic-assisted bronchoscopy with an Ion endoluminal system, in support of their Quintuple Aim objectives.
Our clinical sales team works on site at hospitals, interacting with surgeons or physicians, operating room staff, and hospital administrators to develop and sustain successful robotic-assisted surgery or bronchoscopy programs. They assist the hospital in identifying surgeons or physicians who have an interest in robotic-assisted surgery or bronchoscopy and the potential benefits provided by the da Vinci surgical system and the Ion endoluminal system. Our clinical sales team provides current clinical information on robotic-assisted surgery or bronchoscopy practices and new product applications to the hospital teams. Our clinical sales team has grown with the expanded installed bases of da Vinci surgical systems and Ion endoluminal systems as well as the total number of procedures performed. We expect this organization to continue to grow as our business expands.
Our customers place orders to replenish their supplies of instruments and accessories on a regular basis. Orders received are typically shipped within one business day. New direct customers who purchase a system typically place an initial stocking order of instruments and accessories soon after they receive their system.
Our business is subject to seasonal fluctuations. Historically, placements of our da Vinci surgical systems have tended to be heavier in the fourth quarter and lighter in the first quarter, as hospital budgets are reset. In addition, we have historically experienced lower procedure volume in the first and third quarters and higher procedure volume in the second and fourth quarters. More than half of da Vinci procedures performed are for benign conditions. These benign procedures and other short-term elective procedures tend to be more seasonal than cancer procedures and surgeries for other life-threatening conditions. In the U.S., volumes for procedures associated with benign conditions are typically seasonally higher in the fourth quarter when more patients have met annual deductibles and lower in the first quarter when deductibles are reset. Seasonality outside of the U.S. varies and is more pronounced around local holidays and vacation periods, which have lower procedure volume. The
timing of procedures and changes in procedure volume impact the timing of instruments and accessories and capital purchases. As a result of factors outlined in “Item 7. Management’s Discussion and Analysis of Financial Condition and Results of Operations—COVID-19 Pandemic” below, including the past and potential future recommendations of authorities to defer elective procedures, historical procedure patterns have been and may continue to be disrupted.
Customer Support
We have a network of field service and technical support engineers across the U.S., Canada, Europe, and Asia and maintain relationships with various distributors around the globe. This infrastructure of service and support specialists, along with advanced service tools and solutions, offers a full complement of services for our customers, including installation, repair, maintenance, 24/7 technical support, and proactive system health monitoring. We generate service revenue by providing these services to our customers through comprehensive service contracts and time and material programs.
Research and Development
We focus our research and development efforts on innovation and improvement for products and services that align with our mission: We believe that minimally invasive care is life-enhancing care. Through ingenuity and intelligent technology, we believe that we can expand the potential of physicians to heal without constraints. We employ engineering and research and development staff to focus on delivering future innovations and sustaining improvements that advance our mission. In certain instances, we complement our research and development effort through collaborations with other companies, such as our Integrated Table Motion product offering developed with Hillrom (now a part of Baxter International Inc.).
Manufacturing
We manufacture our systems at our facilities in Sunnyvale, California, and Peachtree Corners, Georgia, as well as at our Joint Venture’s facility in Shanghai, China. Our instruments and accessories are produced at our facilities in Sunnyvale, California, and Mexicali, Mexico. Additionally, we have Ion-related manufacturing in Blacksburg, Virginia, and Shanghai, China, and endoscope-related manufacturing at multiple sites in Germany. We are also planning to open a new manufacturing facility in Bulgaria.
We purchase both custom and off-the-shelf components from a large number of suppliers and subject them to stringent quality specifications and processes. Some of the components necessary for the assembly of our products are currently provided to us by sole-sourced suppliers (the only recognized supply source available to us) or single-sourced suppliers (the only approved supply source for us among other sources). We purchase the majority of our components and major assemblies through purchase orders rather than long-term supply agreements and generally do not maintain large volumes of finished goods relative to our anticipated demand.
Competition
We face competition in the forms of existing open surgery, conventional MIS, drug therapies, radiation treatment, and other emerging diagnostic and interventional surgical approaches. Some of these procedures are widely accepted in the medical community and, in many cases, have a long history of use. Our success depends on continued clinical and technical innovation, quality, and reliability, as well as educating hospitals, surgeons, and patients on the demonstrated results associated with robotic-assisted medical procedures using da Vinci surgical systems or Ion endoluminal systems and their value relative to other techniques. We also face competition from several companies that have introduced or are developing new approaches and products for the MIS market. We believe that the entrance or emergence of competition validates MIS and robotic-assisted surgery or robotic-assisted bronchoscopy.
Moreover, as we add new robotically controlled products (e.g., da Vinci stapling and da Vinci energy products) that compete with product offerings traditionally within the domains of open surgery and/or conventional MIS, we face greater competition from larger and well-established companies, such as Johnson & Johnson and Medtronic plc.
Additionally, we currently face, or anticipate facing, competition from companies with products used in open or MIS surgeries, including laparoscopy and alternative multi-port, single-port, or endoluminal systems. We also compete with companies providing other therapeutic approaches for addressing target clinical conditions, as well as companies developing diagnostic solutions that could serve as alternatives to current or planned Intuitive offerings. Companies that have introduced products in the field of robotic-assisted medical procedures, or have made explicit statements about their efforts to enter the field, include, but are not limited to, the following: Beijing Surgerii Robotics Company Limited; CMR Surgical Ltd.; Distalmotion SA; Harbin Sizhe Rui Intelligent Medical Equipment Co., Ltd.; Johnson & Johnson; Karl Storz SE & Co. KG; Medicaroid Corporation; Medtronic plc; meerecompany Inc.; Noah Medical; Shandong Weigao Group Medical Polymer Company Ltd.; Shanghai Microport Medbot (Group) Co., Ltd.; Shenzhen Edge Medical Co., Ltd.; and SS Innovations International, Inc. Other companies with substantial experience in industrial robotics could potentially expand into the field of medical robotics and become a competitor. In addition, research efforts utilizing computers and robotics for medical procedures
are underway at various companies and research institutions. Our revenues may be adversely impacted as our competitors announce their intent to enter our markets and as our customers anticipate the availability of competing products. We may not be able to maintain or improve our competitive position against current or potential competitors, especially those with greater resources.
Intellectual Property
We place considerable importance on obtaining and maintaining patent, copyright, trademark, and trade secret protection for significant new technologies, products, and processes.
We generally rely upon a combination of intellectual property laws, confidentiality procedures, and contractual provisions to protect our proprietary technology. For example, we have trademarks, both registered and unregistered, that provide distinctive identification of our products in the marketplace. We also have exclusive and non-exclusive patent licenses with various third parties to supplement our own robust patent portfolio.
As of December 31, 2024, we owned more than 5,300 patents granted and still in force and more than 2,400 patents pending worldwide. We intend to continue filing new patent applications in the U.S. and foreign jurisdictions to seek protection for our technology. Patents have finite terms. The expiration of a patent ends the exclusive rights accorded by the patent for the invention claimed.
Government Regulation
Our products and operations are subject to regulation in the U.S. by the FDA and the State of California as well as by other countries and regions in which we market and promote our products. In addition, our products must meet the requirements of a large and growing body of international regulations and standards, which govern the design, manufacture, materials content and sourcing, testing, certification, packaging, installation, use, and disposal of our products. We must continually keep abreast of these regulations, standards, and requirements and integrate our compliance into the development and regulatory documentation for our products. Failure to meet these requirements could limit our ability to market our products in those regions that require compliance with such regulations and standards. Examples of standards to which we are subject include electrical safety standards, such as those of the International Electrotechnical Commission (e.g., IEC 60601-ss series of standards), and composition regulations, such as the Reduction of Hazardous Substances (“RoHS”) and the Waste Electrical and Electronic Equipment (“WEEE”) Directives applicable in the European Union (“EU”).
U.S. Regulation
FDA
Our products are subject to regulation as medical devices in the United States under the Federal Food, Drug, and Cosmetic Act (“FFDCA”), as implemented and enforced by the FDA. The FDA regulates the development, design, non-clinical and clinical research, manufacturing, safety, efficacy, labeling, packaging, storage, installation, recordkeeping, complaint and adverse event reporting, clearance, approval, certification, promotion, marketing, export, import distribution, and service of medical devices in the U.S. to ensure that medical devices distributed domestically are safe and effective for their intended uses.
Under the FFDCA, medical devices are classified into one of three classes—Class I, Class II, or Class III—depending on the degree of risk associated with each medical device and the extent of control needed to ensure safety and effectiveness. Our current products are Class II medical devices.
Class II medical devices are those that are subject to general controls, and most require premarket demonstration of adherence to certain performance standards or other special controls, as specified by the FDA, and special controls as deemed necessary by the FDA to ensure the safety and effectiveness of the device. These special controls can include performance standards, post-market surveillance, patient registries, and FDA guidance documents.
Manufacturers of most Class II devices are required to submit to the FDA a premarket notification under Section 510(k) of the FFDCA requesting authorization to commercially distribute the device. The FDA’s authorization to commercially distribute a device subject to a 510(k) premarket notification is generally known as 510(k) clearance. Our current products are subject to premarket notification and clearance under section 510(k) of the FFDCA. To obtain 510(k) clearance, we must submit to the FDA a premarket notification submission demonstrating that the proposed device is “substantially equivalent” to a legally marketed predicate device.
The FDA may require additional information, including clinical data, to make a determination regarding substantial equivalence. In addition, the FDA collects user fees for certain medical device submissions and annual fees for medical device establishments.
If the FDA agrees that the device is substantially equivalent to a predicate device, it will grant clearance to commercially market the device in the U.S. The FDA has a statutory 90-day period to respond to a 510(k) submission; however, as a practical
matter, clearance often takes longer. The FDA may require further information, including clinical data, to make a determination regarding substantial equivalence. If the FDA determines that the device, or its intended use, is not “substantially equivalent,” the device may be designated as a Class III device. The device sponsor must then fulfill more rigorous PMA requirements or can request a risk-based classification determination for the device in accordance with the de novo classification pathway, which is a route to market for novel medical devices that are low to moderate risk and are not substantially equivalent to a predicate device.
The PMA process is more demanding than the 510(k) premarket notification process. In a PMA application, the manufacturer must demonstrate that the device is safe and effective, and the PMA application must be supported by extensive data, including data from preclinical studies and human clinical trials. The FDA, by statute and regulation, has 180 days to review a PMA application, although the review more often occurs over a significantly longer period of time and can take up to several years. In approving a PMA application or clearing a 510(k) submission, the FDA may also require some additional manufacturing controls, design control activities and approvals, as well as specific post-market surveillance requirements when necessary to protect the public health or to provide additional safety and effectiveness data for the device. In such cases, the manufacturer might be required to follow certain patient groups for a number of years and make periodic reports to the FDA on the clinical status of those patients.
Clinical trials are almost always required to support a PMA or de novo request and are sometimes required to support a 510(k) submission. All clinical investigations designed to determine the safety and effectiveness of a medical device must be conducted in accordance with the FDA’s investigational device exemption (“IDE”) regulations, which govern investigational device labeling, prohibit the promotion of the investigational device, and specify an array of recordkeeping, reporting and monitoring responsibilities of study sponsors and study investigators. Regardless of the degree of risk presented by the medical device, clinical studies must be approved by, and conducted under the oversight of, an Institutional Review Board (“IRB”) for each clinical site. During a study, the sponsor is required to comply with the applicable FDA requirements, including, for example, trial monitoring, selecting clinical investigators and providing them with the investigational plan, ensuring IRB review, adverse event reporting, record keeping, and prohibitions on the promotion of investigational devices or on making safety or effectiveness claims for them. The clinical investigators in the clinical study are also subject to the FDA’s regulations and must obtain patient informed consent, rigorously follow the investigational plan and study protocol, control the disposition of the investigational device, and comply with all reporting and recordkeeping requirements. Additionally, after a trial begins, we, the FDA, or the IRB could suspend or terminate a clinical trial at any time for various reasons, including a belief that the risks to study subjects outweigh the anticipated benefits.
After a device receives 510(k) clearance, any modification that could significantly affect its safety or effectiveness, or that would constitute a major change or modification in its intended use, will require a new 510(k) clearance or, depending on the modification, PMA approval or de novo classification. The FDA requires each manufacturer to determine whether a proposed change requires submission of a 510(k), de novo classification, or a PMA or PMA supplement in the first instance, but the FDA can review any such decision and disagree with a manufacturer’s determination. If the FDA disagrees with a manufacturer’s determination, the FDA can require the manufacturer to cease marketing and/or request the recall of the modified device until it receives the appropriate marketing authorization. Also, in these circumstances, the manufacturer may be subject to significant regulatory fines or penalties.
In addition, the FDA may place significant limitations upon the intended use of our products as a condition of granting marketing authorization. Moreover, after a device is placed on the market, numerous FDA and other regulatory requirements continue to apply. These requirements include establishment registration and device listing with the FDA; compliance with medical device reporting regulations, which require that manufacturers report to the FDA if their device caused or contributed, or may have caused or contributed, to a death or serious injury or malfunctioned in a way that would likely cause or contribute to a death or serious injury if it were to recur; compliance with corrections and removal reporting regulations, which require that manufacturers report to the FDA field corrections and product recalls or removals if undertaken to reduce a risk to health posed by the device or to remedy a violation of the FFDCA that may present a risk to health; the FDA’s recall authority, whereby the agency can order device manufacturers to recall from the market a product that is in violation of governing laws and regulations; and post-market surveillance activities and regulations, which apply when deemed by the FDA to be necessary to protect the public health or to provide additional safety and effectiveness data for the device. In addition, the FDA and the Federal Trade Commission also regulate the advertising and promotion of our products to ensure that the claims we make are consistent with our regulatory clearances, that there is scientific data to substantiate the claims, and that our advertising is neither false nor misleading. In general, we may not promote or advertise our products for uses not within the scope of our intended use statement in our clearances or make unsupported safety and effectiveness claims.
Our manufacturing processes are required to comply with the Quality System Regulation (“QSR”). The QSR covers, among other things, the methods used in, and the facilities and controls used for, the design, testing, controlling, documenting, manufacture, packaging, labeling, storage, installation, and servicing of all medical devices intended for human use. The QSR also requires maintenance of extensive records, which demonstrate compliance with the FDA regulation, the manufacturer’s
own procedures, specifications, and testing, as well as distribution and post-market experience. Compliance with the QSR is necessary for a manufacturer to be able to continue to market cleared or approved product offerings in the U.S. A company’s facilities, records, and manufacturing processes are subject to periodic scheduled or unscheduled inspections by the FDA. Failure to maintain compliance with applicable QSR requirements could result in the shut-down of, or restrictions on, manufacturing operations and the recall or seizure of marketed products. If the FDA determines that a manufacturer has failed to comply with applicable regulatory requirements, it can take a variety of compliance or enforcement actions, which may result in any of the following sanctions:
•warning letters, untitled letters, fines, injunctions, consent decrees, administrative penalties, and civil or criminal penalties;
•recalls, withdrawals, or administrative detention or seizure of our products;
•operating restrictions or partial suspension or total shutdown of production;
•refusing or delaying requests for 510(k) marketing clearance or PMA approvals of new products or modified products;
•withdrawing 510(k) clearances or PMA approvals that have already been granted;
•refusal to grant export approvals for our products; or
•criminal prosecution.
In addition, the discovery of previously unknown problems with any marketed products, including unanticipated adverse events or adverse events of increasing severity or frequency, whether resulting from the use of the device within the scope of its clearance or off-label by a physician in the practice of medicine, could result in restrictions on the device, including the removal of the product from the market or voluntary or mandatory device recalls.
Products manufactured outside of the U.S. by or for us are subject to U.S. Customs and FDA inspection upon entry into the U.S. We must demonstrate compliance of such products with U.S. regulations and carefully document the eventual distribution or re-exportation of such products. Failure to comply with all applicable regulations could prevent us from having access to products or components critical to the manufacture of finished products and lead to shortages and delays.
Other Healthcare Regulatory Laws
We are subject to broadly applicable fraud and abuse and other healthcare laws and regulations that may constrain the business or financial arrangements and relationships through which we research, market, sell and distribute our products. Restrictions under applicable federal and state healthcare laws and regulations, include the following:
•the federal Anti-Kickback Statute, which prohibits, among other things, individuals and entities from knowingly and willfully soliciting, offering, receiving or providing remuneration, directly or indirectly, in cash or in kind, to induce or reward, or in return for, either the referral of an individual for, or the purchase, order or recommendation of, any good or service, for which payment may be made, in whole or in part, under a federal and state healthcare program such as Medicare and Medicaid. A person or entity does not need to have actual knowledge of the statute or specific intent to violate it in order to have committed a violation;
•the federal criminal and civil false claims laws, including the federal False Claims Act, which can be enforced through civil whistleblower or qui tam actions against individuals or entities, and the Federal Civil Monetary Penalties Laws, which prohibit, among other things, knowingly presenting, or causing to be presented, to the federal government, claims for payment that are false or fraudulent, knowingly making, using or causing to be made or used, a false record or statement material to a false or fraudulent claim, or from knowingly making a false statement to avoid, decrease or conceal an obligation to pay money to the federal government. In addition, certain marketing practices, including off-label promotion, may also violate false claims laws. Moreover, the government may assert that a claim including items and services resulting from a violation of the federal Anti-Kickback Statute constitutes a false or fraudulent claim for purposes of the federal False Claims Act;
•the Health Insurance Portability and Accountability Act (“HIPAA”), which imposes criminal and civil liability, prohibits, among other things, knowingly and willfully executing, or attempting to execute a scheme to defraud any healthcare benefit program, or knowingly and willfully falsifying, concealing or covering up a material fact or making any materially false statement in connection with the delivery of or payment for healthcare benefits, items or services; similar to the federal Anti-Kickback Statute, a person or entity does not need to have actual knowledge of the statute or specific intent to violate it in order to have committed a violation;
•the Physician Payments Sunshine Act, which requires certain manufacturers of covered drugs, devices, biologics, and medical supplies that are reimbursable under Medicare, Medicaid, or the Children’s Health Insurance Program, with certain exceptions, to report annually to the Centers for Medicare & Medicaid Services (“CMS”) information on certain payments and other transfers of value to physicians (defined to include doctors, dentists, optometrists, podiatrists, and chiropractors), teaching hospitals, and certain other health care providers (such as physician assistants and nurse practitioners), as well as ownership and investment interests held by physicians and their immediate family members;
•analogous state and foreign laws and regulations, such as state anti-kickback and false claims laws, which may apply to sales or marketing arrangements and claims involving healthcare items or services reimbursed by non-governmental third-party payors, including private insurers; and
•certain state laws that require medical device manufacturers to comply with the industry’s voluntary compliance guidelines and the relevant compliance guidance promulgated by the federal government in addition to requiring such manufacturers to report information related to payments to clinicians and other healthcare providers or marketing expenditures.
Violations of any of these laws may result in significant penalties, including but not limited to the following: civil, criminal, and administrative penalties; damages; fines; disgorgement; imprisonment; the curtailment or restructuring of operations; loss of eligibility to obtain approvals from the FDA; exclusion from participation in government contracting, healthcare reimbursement, or other government programs, including Medicare and Medicaid; integrity oversight and reporting obligations; or reputational harm.
Foreign Regulation
In order for us to market our products in countries outside the United States, we must obtain regulatory approvals or certifications and comply with extensive product quality system and composition regulations in other countries. These regulations, including the requirements for approvals, clearance, or certifications and the time required for regulatory review, vary from country to country. Some countries have regulatory review processes that are substantially longer than U.S. processes. Failure to obtain regulatory approval or certification in a timely manner and meet all of the local requirements, including language and specific safety standards, in any foreign country in which we plan to market our products could prevent us from marketing products in such countries or subject us to sanctions and fines.
China
China has its own regulatory agency, the National Medical Products Administration (“NMPA”). They require regulatory approvals and compliance with extensive safety and quality system regulations. Failure to obtain regulatory approval or failure to comply with any regulation may negatively impact our ability to generate revenue and harm our business. In addition to product registration approvals, our system sales into China are also dependent on obtaining importation authorizations and provincial approvals, as well as hospitals completing a tender and hospital listing process under the authorization. In June 2023, the China National Health Commission published the 14th five-year plan quota for major medical equipment to be sold in China on its official website (the “2023 Quota”). Under the 2023 Quota, the government will allow for the sale of 559 new surgical robots into China, which could include da Vinci surgical systems as well as surgical systems introduced by others. Sales of da Vinci surgical systems under the quota are uncertain, as they are dependent on hospitals completing a tender process and receiving associated approvals.
Japan
Most medical devices must undergo thorough safety examinations and demonstrate medical efficacy before they receive regulatory approval to be sold in Japan. We obtained approval from the Japanese Ministry of Health, Labor, and Welfare (“MHLW”) for our da Vinci Si surgical system in October 2012, for our da Vinci Xi surgical system in March 2015, and for our da Vinci X surgical system in April 2018. In September 2022, we received regulatory clearance for the da Vinci SP surgical system in Japan for the same set of procedures as can be performed on the da Vinci Xi surgical system in Japan. We have received national reimbursement status in Japan for a number of procedures since the approval of our first da Vinci surgical system in 2012. An additional eight da Vinci procedures were granted reimbursement in April 2022, including colon resection, and an additional five da Vinci procedures were granted reimbursement in April 2024, including lobectomy for benign conditions. In addition, we received higher reimbursement for da Vinci gastrectomy procedures, as compared to open and conventional laparoscopic procedure reimbursements, and higher reimbursement for certain da Vinci rectal resection procedures, as compared to open procedure reimbursements. The additional reimbursed procedures have varying levels of conventional laparoscopic penetration and will generally be reimbursed at rates equal to the conventional laparoscopic procedures. Given the reimbursement level and laparoscopic penetration for these additional procedures, there can be no assurance that the adoption pace for these procedures will be similar to prostatectomy or partial nephrectomy, given their higher reimbursement, or any other da Vinci procedure. If these procedures are not adopted and we are not successful in obtaining adequate procedure reimbursements for additional procedures, then the demand for our products in Japan could be limited. The
process of reimbursement for new da Vinci surgical procedures in Japan is led by the surgical societies. The societies submit for reimbursement or incremental reimbursement to the MHLW for their evaluation. The decision to reimburse requires in-country clinical data and is fixed in April of even-numbered years.
European Union
The EU has adopted specific directives and regulations regulating the design, manufacture, clinical investigation, conformity assessment, labeling, and adverse event reporting for medical devices. Until and including May 25, 2021, medical devices were regulated by Council Directive 93/42/EEC (the “EU Medical Devices Directive” or “MDD”), which has been repealed and replaced by Regulation (EU) No 2017/745 (the “EU Medical Devices Regulation” or “MDR”). Some of our current certificates have been granted under the MDD. However, as of May 26, 2021, some of the MDR requirements apply in place of the corresponding requirements of the MDD with regard to the registration of economic operators and of devices, post-market surveillance, and vigilance.
Medical Devices Directive
Under the EU Medical Devices Directive, all medical devices placed on the market in the EU must meet the essential requirements laid down in Annex I to the EU Medical Devices Directive, including the requirement that a medical device must be designed and manufactured in such a way that it will not compromise the clinical condition or safety of patients or the safety and health of users and others. In addition, the device must achieve the performance intended by the manufacturer and be designed, manufactured, and packaged in a suitable manner. The European Commission has adopted various standards applicable to medical devices. These include standards governing common requirements, such as the sterilization and safety of medical electrical equipment and product standards for certain types of medical devices. There are also harmonized standards relating to design and manufacture. While not mandatory, compliance with these standards is viewed as the easiest way to satisfy the essential requirements as a practical matter, as it creates a rebuttable presumption that the device satisfies the essential requirements.
Except for low-risk medical devices (Class I non-sterile, non-measuring devices), where the manufacturer can self-assess the conformity of its products with the essential requirements (except for any parts that relate to sterility or metrology), a conformity assessment procedure requires the intervention of a notified body. Notified bodies are independent organizations designated by EU member states to assess the conformity of devices before being placed on the market. A notified body would typically audit and examine a product’s technical dossiers and the manufacturer’s quality system (the notified body must presume that quality systems that implement the relevant harmonized standards, which is ISO 13485:2016 for Medical Devices Quality Management Systems, conform to these requirements). If satisfied that the relevant product conforms to the relevant essential requirements, the notified body issues a certificate of conformity, which the manufacturer uses as a basis for its own declaration of conformity. The manufacturer may then apply the European Conformity mark (“CE mark”) to the device, which allows the device to be placed on the market throughout the EU.
Throughout the term of the certificate of conformity, the manufacturer will be subject to periodic surveillance audits to verify continued compliance with the applicable requirements. In particular, there will be a new audit by the notified body before it will renew the relevant certificate(s).
Medical Devices Regulation
On April 5, 2017, the MDR was adopted with the aim of ensuring better protection of public health and patient safety. The MDR establishes a uniform, transparent, predictable, and sustainable regulatory framework across the EU for medical devices and ensures a high level of safety and health while supporting innovation. Unlike directives, regulations are directly applicable in EU member states without the need for member states to implement into national law. This aims at increasing harmonization across the EU.
The MDR became effective on May 26, 2021. In accordance with its recently extended transitional provisions, both (i) devices lawfully placed on the market pursuant to the MDD prior to May 26, 2021, and (ii) legacy devices lawfully placed on the EU market from May 26, 2021, in accordance with the MDR transitional provisions may generally continue to be made available on the market or put into service, provided that the requirements of the transitional provisions are fulfilled. However, even in this case, manufacturers must comply with a number of new or reinforced requirements set forth in the MDR, in particular the obligations described below.
The MDR requires that, before placing a device on the market, other than a custom-made device, manufacturers (as well as other economic operators, such as authorized representatives and importers) must register by submitting identification information to the European database on medical devices (EUDAMED), unless they have already registered. The information to be submitted by manufacturers (and authorized representatives) also includes the name, address, and contact details of the person or persons responsible for regulatory compliance. The MDR also requires that, before placing a device on the market, other than a custom-made device, manufacturers must assign a unique identifier to the device and provide it along with other core data to the unique device identifier (“UDI”) database. These new requirements aim at ensuring better identification and
traceability of the devices. Each device – and as applicable, each package – will have a UDI composed of two parts: a device identifier (“UDI-DI”), specific to a device, and a production identifier (“UDI-PI”) to identify the unit producing the device. Manufacturers are also notably responsible for entering the necessary data on EUDAMED, which includes the UDI database, and for keeping it up to date. The obligations for registration in EUDAMED are expected to become applicable in the first fiscal quarter of 2026 (as EUDAMED is not yet fully functional). Until EUDAMED is fully functional, the corresponding provisions of the MDD continue to apply for the purpose of meeting the obligations laid down in the provisions regarding exchange of information, including, and in particular, information regarding registration of devices and economic operators.
All manufacturers placing medical devices on the market in the EU must comply with the EU medical device vigilance system, which has been reinforced by the MDR. Under this system, serious incidents and Field Safety Corrective Actions (“FSCAs”) must be reported to the relevant authorities of the EU member states. These reports will have to be submitted through EUDAMED (once functional) and aim to ensure that, in addition to reporting to the relevant authorities of the EU member states, other actors, such as the economic operators in the supply chain, will also be informed. Until EUDAMED is fully functional, the corresponding provisions of the MDD continue to apply. Manufacturers are required to take FSCAs, which are defined as any corrective action for technical or medical reasons to prevent or reduce a risk of a serious incident associated with the use of a medical device that is made available on the market. A serious incident is any malfunction or deterioration in the characteristics or performance of a device on the market (e.g., inadequacy in the information supplied by the manufacturer, undesirable side-effect, etc.), which, directly or indirectly, might lead to either the death or serious deterioration of the health of a patient, user, or other persons, or to a serious public health threat.
The EU has multiple laws and regulations related to composition of materials, their procurement practices, manufacturing, and disposal, such as the RoHS and WEEE Directives. These laws and regulations broadly cover requirements and risk related to health, safety, and the environment. The laws and regulations can impose restrictions on the use of certain substances (such as, in totality or by composition, percentage weight limits or parts per million limits) and have required reporting to the respective EU authorities, requirements around importations into the EU, requirements around recovery and disposal, as well as disclosure requirements.
The advertising and promotion of medical devices are subject to some general principles set forth in EU legislation. According to the MDR, only devices that are CE marked may be marketed and advertised in the EU in accordance with their intended purpose. Directive 2006/114/EC concerning misleading and comparative advertising and Directive 2005/29/EC on unfair commercial practices, while not specific to the advertising of medical devices, also apply to the advertising thereof and contain general rules, for example, requiring that advertisements are evidenced, balanced, and not misleading. Specific requirements are defined at a national level. EU member states’ laws related to the advertising and promotion of medical devices, which vary between jurisdictions, may limit or restrict the advertising and promotion of products to the general public and may impose limitations on promotional activities with healthcare professionals.
Many EU member states have adopted specific anti-gift statutes that further limit commercial practices for medical devices, in particular vis-à-vis healthcare professionals and organizations. Additionally, there has been a recent trend of increased regulation of payments and transfers of value provided to healthcare professionals or entities and many EU member states have adopted national “Sunshine Acts,” which impose reporting and transparency requirements (often on an annual basis), similar to the requirements in the United States, on medical device manufacturers. Certain countries also mandate implementation of commercial compliance programs.
In the EU, regulatory authorities have the power to carry out announced and, if necessary, unannounced inspections of companies, as well as suppliers and/or sub-contractors and, where necessary, the facilities of professional users. Failure to comply with regulatory requirements (as applicable) could require time and resources to respond to the regulatory authorities’ observations and to implement corrective and preventive actions, as appropriate. Regulatory authorities have broad compliance and enforcement powers and, if such issues cannot be resolved to their satisfaction, can take a variety of actions, including untitled or warning letters, fines, consent decrees, injunctions, or civil or criminal penalties.
The aforementioned EU rules are generally applicable in the EEA, which consists of the 27 EU Member States as well as Iceland, Liechtenstein, and Norway.
Brexit and the UK Regulatory Framework
Since January 1, 2021, the Medicines and Healthcare Products Regulatory Agency (“MHRA”) has been the sovereign regulatory authority responsible for the Great Britain (i.e., England, Wales, and Scotland) medical device market. Following the end of the Brexit transitional period on January 1, 2021, new regulations require all medical devices to be registered with the MHRA before being placed on the Great Britain market. From January 1, 2022, non-UK manufacturers were required to appoint a UK Responsible Person for the purposes of registering devices placed on the Great Britain market. Under the terms of the Protocol on Ireland/Northern Ireland, the MDR applies to medical devices placed on the Northern Ireland market in the same way as it applies to medical devices marketed in the EU. In addition, the Trade Deal between the UK and the EU generally provides for cooperation and exchange of information between the parties in the areas of product safety and
compliance, including market surveillance, enforcement activities and measures, standardization-related activities, exchanges of officials, and coordinated product recalls. As such, processes for compliance and reporting should reflect requirements from regulatory authorities.
On June 26, 2022, the MHRA published its response to a 10-week consultation on the future regulation of medical devices in the UK, and the MHRA has stated that it remains its intention to implement the proposals from such consultation through secondary legislation. In addition, on November 14, 2024, the MHRA launched a new consultation on proposals to update the regulatory framework for medical devices in Great Britain, covering four topics, namely (1) a new international reliance scheme to enable swifter market access for certain devices that have already been approved in a comparable regulator country; (2) the new UK Conformity Assessed (“UKCA”) mark and, in particular, proposals to remove the requirement to place such UKCA marking on devices; (3) conformity assessment procedures for in vitro diagnostic devices; and (4) maintaining in UK law certain pieces of “assimilated” EU law, which are due to sunset in 2025. The MHRA consultation is open until January 5, 2025, and it is expected that secondary legislation implementing the proposals will be introduced later in 2025.
Other countries
Regulations in other countries, including the requirements for approvals, certification, or clearance and the time required for regulatory review, vary from country to country. Certain countries, such as South Korea, Brazil, Australia, India, and Canada, have their own regulatory agencies. These countries typically require regulatory approvals and compliance with extensive safety and quality system regulations included in the MDSAP (Medical Device Single Audit Program) that we comply with every year as part of our annual audit program. Failure to obtain regulatory approval in any foreign country in which we plan to market our products, or failure to comply with any regulation in any foreign country in which we market our products may negatively impact our ability to generate revenue and harm our business.
In addition, local regulations may apply, which govern the use of our products and which could have an adverse effect on our product utilization if they are unfavorable. All such regulations are revised from time to time and, in general, are increasing in complexity and in the scope and degree of documentation and testing required. There can be no assurance that the outcomes from such documentation and testing will be acceptable to any particular regulatory agency or will continue to be acceptable over time. There are further regulations governing the importation, marketing, sale, distribution, use, and service as well as the removal and disposal of medical devices in the regions in which we operate and market our products. Failure to comply with any of these regulations could result in sanctions or fines and could prevent us from marketing our products in these regions.
Data Privacy and Security Laws
Numerous state, federal, and foreign laws, regulations, and standards govern the collection, use, access to, confidentiality, and security of health-related and other personal information and could apply now or in the future to our operations or the operations of our partners. In the U.S., numerous federal and state laws and regulations, including data breach notification laws, health information privacy and security laws, and consumer protection laws and regulations govern the collection, use, disclosure, and protection of health-related and other personal information. In addition, certain foreign laws govern the privacy and security of personal data, including health-related data. Privacy and security laws, regulations, and other obligations are constantly evolving, may conflict with each other to complicate compliance efforts, and can result in investigations, proceedings, or actions that lead to significant civil and/or criminal penalties and restrictions on data processing.
We collect, process, share, disclose, transfer, and otherwise use data, some of which contains personal information about identifiable individuals including, but not limited to, our employees, clinical trial participants, partners, and vendors. Therefore, we are subject to U.S. (federal, state, local) and international laws and regulations, including those in the European Economic Area (“EEA”) and the United Kingdom (“UK”) regarding data privacy and security and our use of such data.
We are subject to the European Union General Data Protection Regulation 2016/679 and applicable national supplementing laws (collectively, the “EU GDPR”) and to the United Kingdom General Data Protection Regulation and Data Protection Act 2018 (collectively, the “UK GDPR”) (the EU GDPR and UK GDPR together referred to as the “GDPR”). The GDPR imposes comprehensive data privacy compliance obligations in relation to our collection, processing, sharing, disclosure, transfer, and other use of data relating to an identifiable living individual or “personal data,” including a principle of accountability and the obligation to demonstrate compliance through policies, procedures, training, and audit.
The EU GDPR and UK GDPR also regulate cross-border transfers of personal data out of the EEA and the UK. Recent legal developments in Europe have created complexity and uncertainty regarding such transfers, in particular in relation to transfers to the United States.
Third-Party Coverage and Payment
Our customers, including physicians, hospitals, and outpatient facilities, typically bill third-party payors for the costs and fees associated with the procedures in which our products are used. In the U.S., in order to receive payment for the procedures performed using our products, our customers must report codes that describe the services or products furnished and determine the medical necessity of the service or whether the service is included in the payors’ policy. In the U.S. and most markets globally where we sell our products, payment for medical services and surgical procedures to hospitals, outpatient facilities, and surgeons (collectively “providers”) is determined by the government, commercial payors (insurers), or both.
In the U.S., the CMS and its fiscal intermediaries (Medicare Administrative Contractors) and state Medicaid programs establish reimbursement policies for medical and surgical services at the state and federal level for the Medicare and Medicaid programs. Third-party payors often rely upon Medicare coverage policy and payment limitations in setting their own coverage and payment policies but also have their own methods and approval processes. Commercial payors in non-capitated contracts commonly establish payment to providers based on a percentage of the Medicare payment rate.
Physicians and outpatient facilities bill for medical and surgical services by reporting a combination of billing codes. Current Procedural Terminology (“CPT”) codes are created by the American Medical Association (“AMA”) with input from CMS and commercial payors to describe medical and surgical procedures. CPT codes currently exist for minimally invasive surgical procedures, which may involve the da Vinci surgical system, as well as for robotic-assisted bronchoscopy, which may involve the Ion endoluminal system. In general, the majority of payors, including Medicare, consider robotic assistance as a tool used to perform the procedure and do not pay providers more for a procedure that involves robotic assistance using the da Vinci, Ion, or any other robotic system. Because there is often no separate payment for the use of our products, the additional cost associated with the use of our products can affect the profit margin of the hospital or surgery center where the procedure is performed. If hospitals do not obtain sufficient payment from third-party payors for procedures performed with our products or if governmental and private payors’ policies do not cover surgical procedures performed using our products, hospital adoption or utilization of our products could be negatively impacted, and we may not be able to generate the revenue necessary to support our business.
Hospitals bill for inpatient services by reporting ICD-10-PCS codes. CMS is primarily responsible for overseeing changes and modifications to ICD-10-PCS codes. Medicare payments to hospitals for services provided during an inpatient stay are based on the Inpatient Prospective Payment System (“IPPS”). Under the IPPS, each patient discharge is categorized into a Medicare Severity Adjusted Diagnosis-Related Group (“MS-DRG” or “DRG”). Each DRG has an assigned payment weight based on the average resources used for Medicare patients in that DRG, taking into account the patient’s principal diagnosis, surgical procedures, age, discharge status, and additional or secondary diagnoses, among other things. The DRG is a single, bundled payment intended to cover all costs associated with the inpatient admission.
The use of robotic technology does not influence the MS-DRG assignment or payment for an inpatient admission related to a surgical procedure. CMS annually updates hospital inpatient and outpatient payments based on hospitals’ charge data. Hospital inpatient and outpatient payments are also adjusted based on whether the hospital is a teaching hospital, its geographic location, and any failures to meet certain quality metrics, among other factors.
Commercial payors commonly establish inpatient facility payment for providers using published Medicare DRG rates as a benchmark. In some uncommon cases, commercial payors pay for inpatient hospital admissions on a per diem basis. Commercial payment to providers varies depending on the procedure performed, geographic location, contractual allowances, and other factors.
Medicare and commercial payor payments to facilities for medical and surgical services may not always fully reimburse providers for all costs associated with furnishing these procedures. If payment is insufficient for procedures involving our technology, hospitals and physicians may decide not to use our products.
In countries outside of the U.S., payment for surgical services to physicians and facilities differs considerably and varies by country. In some markets, there is a single public payor who provides a global annual budget to hospitals to provide all care to the population served in a designated geographic area. In other markets, private insurance can be purchased or is provided by employers to supplement public health insurance. In some countries, patients may be permitted to pay directly for surgical services; however, such “co-pay” practices are not common (or allowed) in many countries. Further, in many global markets, access to procedures and technology is governed or heavily influenced by Health Technology Assessment (“HTA”) organizations, which conduct periodic and extensive evidence-based reviews of the clinical value and cost effectiveness of a new technology. To effectively conduct our business, we may need to seek OUS reimbursement approvals, and we do not know if these required approvals will be obtained in a timely manner or at all. In addition, in some markets, HTA organizations may publish reports with mixed conclusions about the clinical and economic value of our products to the population. Such reviews could negatively impact hospital adoption of our technology.
Healthcare Reform
In the U.S., there have been, and continue to be, legislative initiatives designed to contain healthcare costs. In March 2010, the Patient Protection and Affordable Care Act, as amended by the Health Care and Education Reconciliation Act (collectively, the “ACA”), was enacted. The ACA made changes that have significantly impacted healthcare providers, insurers, pharmaceutical companies, and medical device manufacturers. The ACA contained provisions designed to generate the revenues necessary to fund health insurance coverage expansion and appropriated funding to research the comparative effectiveness of healthcare treatments and strategies. To date, this research has had a negligible effect on Medicare coverage and reimbursement decisions as well as influence on other third-party payor coverage and reimbursement policies.
Since its enactment, there have been judicial, executive, and Congressional challenges to certain aspects of the ACA. On June 17, 2021, the U.S. Supreme Court dismissed the most recent judicial challenge to the ACA brought by several states without specifically ruling on the constitutionality of the ACA. Thus, the ACA remained in effect in its current form.
In addition, other legislative changes have been proposed and adopted since the ACA became law. These changes included an aggregate reduction in Medicare payments, which went into effect on April 1, 2013, and will remain in effect through 2032, unless additional Congressional action is taken, with the exception of a temporary suspension due to the COVID-19 pandemic from May 1, 2020, through March 31, 2022. Individual states in the U.S. have also become increasingly aggressive in passing legislation and implementing regulations designed to control product pricing, including price or patient reimbursement constraints and discounts, and require marketing cost disclosure and transparency measures.
In the U.S. and abroad, reimbursement is dynamic and subject to change annually by public and private payors. Congress and government agencies may also intervene and pass legislation that is intended to reduce healthcare spending, which could impact market access. Such legislative interventions can vacillate significantly based on government leadership. Other federal or state healthcare reform measures that may be adopted in the future could have a material adverse effect on our business. Any regulatory or legislative developments in domestic or foreign markets that eliminate or reduce reimbursement rates for procedures performed with our products could harm our ability to sell our products or cause downward pressure on the prices of our products, either of which would adversely affect our business, financial condition, and results of business operations.
Similar reform measures may be adopted in foreign jurisdictions. For instance, on December 13, 2021, the EU Regulation No 2021/2282 on HTA, amending Directive 2011/24/EU, was adopted. While the Regulation entered into force in January 2022, it will only begin to apply from January 2025 onwards, with preparatory and implementation-related steps to take place in the interim. Once applicable, it will have a phased implementation depending on the concerned products. This Regulation intends to boost cooperation among EU member states in assessing health technologies, including certain high-risk medical devices, and provide the basis for cooperation at the EU level for joint clinical assessments in these areas. It will permit EU member states to use common HTA tools, methodologies, and procedures across the EU, working together in four main areas, including joint clinical assessment of the innovative health technologies with the highest potential impact for patients, joint scientific consultations whereby developers can seek advice from HTA authorities, identification of emerging health technologies to identify promising technologies early, and continuing voluntary cooperation in other areas. Individual EU member states will continue to be responsible for assessing non-clinical (e.g., economic, social, and ethical) aspects of health technology and making decisions on pricing and reimbursement.
Human Capital
Delivering on our mission depends on our ability to attract, engage, retain, and further develop top talent around the globe. We strive to enable this by making Intuitive an inclusive, diverse, and safe workplace with opportunities for our employees to grow and develop in their careers. Intuitive provides competitive compensation, benefits, and programs that encourage employee health and wellness as well as foster connections between our employees, the communities, and the customers we serve.
As of December 31, 2024, we had approximately 15,638 full-time employees, with approximately 2,076 in research and development, 7,057 in manufacturing operations, 4,413 in commercial and service operations, and 2,092 in administrative activities. During 2024, the number of employees increased by approximately 1,962. Our employees are based in 29 different countries around the world. Our global workforce consists of a diverse range of highly skilled talent. During 2024, our turnover rate was approximately 8.9%.
Inclusion and Diversity
Intuitive’s inclusion and diversity (“I&D”) mission is to work to build an environment where every individual can belong and flourish – in our company and the communities we serve.
We believe that everyone should feel included and fairly treated, and we embrace the unique qualities that make people who they are. This includes all genders and gender identities, races, ethnicities, ages, national origins, native languages,
disabilities, sexual orientations, body sizes, military backgrounds, cognitive styles, socioeconomic backgrounds, religions, and family structures. We believe in seeking the difference to propel innovation and creativity forward.
We have a four-part strategy to guide our I&D efforts: ensuring an inclusive experience, where employees from all backgrounds feel welcome, supported, and valued; building a diverse workforce to fuel innovation and better mirror the customers and patients we serve; continuously investing in and enhancing the fairness of our people practices and sharing progress; and strengthening industry engagement through collaboration with our customers, the broader healthcare community, and shareholders. We aim to pursue this strategy through various initiatives, including assessing our efforts through a compliance lens; our policies prohibit unlawful discrimination against individuals on the basis of any protected characteristic.
Details of our employee workforce composition, including a link to our Employer Information Report (“EEO-1”) submission to the U.S. Equal Employment Opportunity Commission (“EEOC”), are available on our website. Although we reference the availability of our EEO-1 on our website in this Annual Report on Form 10-K, our EEO-1 and any other materials on our website are not incorporated by reference into this Annual Report on Form 10-K or any of our other filings under the Securities Act of 1933, as amended, or the Exchange Act. While matters discussed in such EEO-1 and other website materials may be significant, any significance should not be read as necessarily rising to the level of materiality used for the purposes of our compliance with the U.S. federal securities laws, even if we use the word “material” or “materiality” in such materials.
From a governance perspective, maintaining a mix of backgrounds and experience in our Board composition is essential to being able to understand, represent, and reflect the needs of our diverse stakeholders. Currently, five of our 12 Board members (42%) are women, and five of our 12 board members (42%) self-identify as individuals from underrepresented communities (defined as an individual who self-identifies as Black, African American, Hispanic, Latino, Asian, Pacific Islander, Native American, Native Hawaiian, or Alaska Native, or LGBTQ+).
Health, Safety, and Wellness
The health, safety, and wellness of our employees is a priority in which we continue to invest and expand. We provide our employees and their families with access to a variety of innovative, flexible, and convenient health and wellness programs. Program benefits are intended to provide protection, peace of mind, and security, including workplace health and safety best practices integrated into everyday activities and programs that support employee time away from work, family care, mental health, or financial well-being.
We continue to evolve our programs in an effort to respond to the interests of our changing workforce, as well as the communities in which we operate, in compliance with government regulations. Each Intuitive location manages overall safety with guidance based on regional, country, and local regulations and best practices.
Compensation and Benefits
We provide compensation and benefits programs to help meet the needs of our employees. In addition to base compensation, these programs, which vary by country and region, include short-term incentives in the form of annual bonuses and commissions, long-term incentives in the form of stock or cash-based awards, an Employee Stock Purchase Plan, retirement savings plans, healthcare, income protection benefits, paid time off, family leave, family care resources, and flexible work schedules, among many others.
We aim to support fair and equitable pay for our employees. Our executive team and Board strongly support this effort. We regularly review pay for internal equity, including with regard to race/ethnicity and gender, and to assess the appropriateness of our compensation structure. We also engage outside counsel to assess compliance with pay equity laws. When we identify potential differences in pay, we research those differences and take actions to resolve them if we deem appropriate.
In 2024, we conducted a full pay equity audit for our full-time U.S. workforce, adjusting for job role and location among other factors. Evaluating total target cash compensation, our audit found that our adjusted pay gap relative to self-identified gender was women earn 99.5% of men and our adjusted pay gap relative to U.S. self-identified race/ethnicity was employees of color earn 100.0% of white employees. We are proud to have strong pay practices and policies in place that have helped us to achieve this level of pay equity.
Employees are encouraged to share any pay equity concerns with management, Human Resources, or confidentially through our reporting hotline, including anonymously. Intuitive has a non-retaliation policy for raising any workplace concerns in good faith, including around pay.
Talent Development
At Intuitive, we believe that all employees have the potential to grow. To support this growth, we offer a diverse range of development opportunities designed to help employees acquire and apply new technical, functional, and leadership skills.
Employee development at Intuitive commences from the first day and includes comprehensive onboarding programs that teach about our business, our culture, and the skills needed to successfully perform at Intuitive. Subsequently, employees have access to a variety of online learning courses, as well as classroom and cohort-based programs.
For people leaders, we provide a 12-month, blended learning curriculum, called the Manager Acceleration Program (“MAP”). MAP is delivered globally and aims to teach our people leaders what it takes to successfully lead and manage at Intuitive. The program covers key leadership expectations as well as fundamental leadership skills. Additional virtual, instructor-led workshops provide timely classes aimed at assisting leaders with important employee processes, such as performance and compensation conversations.
Furthermore, our talent development initiatives include various team effectiveness assessments and solutions tailored to meet the needs of our growing global teams. These solutions range from cross-cultural dexterity programs to assessing and leveraging individual and team strengths. We gather feedback from our teams annually through our Employee Experience survey, holding leaders accountable for taking action based on the feedback received. In 2024, Intuitive achieved a 92% employee engagement score, signaling a strong employee commitment to our mission and the work we do each day.
Community Programs
We believe that building connections between our employees, their families, and our communities creates a more meaningful, fulfilling, and enjoyable workplace. Through our engagement programs, our employees can pursue their interests and hobbies, connect to volunteering and giving opportunities, and enjoy unique recreational experiences with family members.
The Intuitive Foundation is a nonprofit organization established in 2018 and funded by Intuitive. Since its founding, the Intuitive Foundation has been dedicated to promoting health, advancing education, and reducing human suffering. The Foundation supports outreach programs financially while we provide the volunteers and mentors from within our company. Since its inception, we have contributed $170 million to the Intuitive Foundation to fulfill its mission.
We encourage you to review our 2024 Environmental, Social, and Governance (“ESG”) Report (to be made available in the “About Us — Investors” section of our website at https://isrg.intuitive.com) for more detailed information regarding our Human Capital programs and initiatives. Although we reference our ESG Report in this report, the ESG report and any other materials on our corporate website are not incorporated by reference into this Annual Report or any other filing of the Company under the Securities Act of 1933, as amended, or the Exchange Act. While matters discussed in such ESG Report and website materials may be significant, any significance should not be read as necessarily rising to the level of materiality used for the purposes of our compliance with the U.S. federal securities laws, even if we use the word “material” or “materiality” in such materials.
General
We make our periodic and current reports, including our Annual Reports on Form 10-K, Quarterly Reports on Form 10-Q, Current Reports on Form 8-K, and any amendments to those reports, available free of charge on our website as soon as practicable after such material is electronically filed or furnished with the Securities and Exchange Commission (the “SEC”). Our website address is www.intuitive.com, and the reports are filed under “SEC Filings” on the Company — Investor Relations portion of our website. Periodically, we webcast Company announcements, product launch events, and executive presentations, which can be viewed via our Investor Relations page on our website. In addition, we provide notifications of our material news, including SEC filings, investor events, and press releases as part of our Investor Relations page on our website. The contents of our website are not intended to be incorporated by reference into this report or in any other report or document we file, and any references to our website are intended to be inactive textual references only. The SEC maintains an internet site that contains reports, proxy and information statements, and other information regarding issuers that file electronically with the SEC at www.sec.gov. The contents of these websites are not incorporated into this filing. Further, references to the URLs for these websites are intended to be inactive textual references only.
We operate our business as one segment, as defined by U.S. generally accepted accounting principles. Our financial results for the years ended December 31, 2024, 2023, and 2022 are discussed in “Item 7. Management’s Discussion and Analysis of Financial Condition and Results of Operations” and “Item 8. Financial Statements and Supplementary Data” of this Annual Report.
Intuitive Surgical, Inc. was founded in 1995. We are a Delaware corporation with our principal executive offices located at 1020 Kifer Road, Sunnyvale, California 94086. Our telephone number is (408) 523-2100, and our website address is www.intuitive.com.
ITEM 1A. RISK FACTORS
You should consider each of the following risk factors, which could materially affect our business, financial condition, or future results of operations. Additional risks and uncertainties not currently known to us or that we currently deem to be immaterial also may materially adversely affect our business, financial condition, or future results of operations. In addition, the global economic environment may amplify many of these risks.
RISKS RELATING TO OUR BUSINESS
OUR MARKETS ARE HIGHLY COMPETITIVE, AND CUSTOMERS MAY CHOOSE TO PURCHASE OUR COMPETITORS’ PRODUCTS OR SERVICES OR MAY NOT ACCEPT ROBOTIC-ASSISTED MEDICAL PROCEDURES, WHICH COULD RESULT IN REDUCED REVENUE AND LOSS OF MARKET SHARE.
Robotic-assisted surgery with a da Vinci surgical system or robotic-assisted bronchoscopy with an Ion endoluminal system are technologies that compete with established and emerging treatment options in reconstructive medical procedures or disease management. These competitive treatment options include open surgery, conventional MIS, drug therapies, radiation treatment, and other emerging diagnostic and interventional surgical approaches. Some of these procedures are widely accepted in the medical community and, in many cases, have a long history of use. Technological advances could make such treatment options more effective or less expensive than using our products, which could render our products obsolete or unmarketable. Also, studies could be published that show that other treatment options are more beneficial and/or cost-effective than robotic-assisted medical procedures. We cannot be certain that physicians, or their patients, will choose our products to replace or supplement established treatment options or that our products will continue to be competitive with current or future technologies. For example, in 2023, certain drugs initially approved for use in diabetes patients gained market acceptance for use in weight loss treatment following FDA approvals for weight loss indications. The availability and effectiveness of weight loss drugs have reduced the number of bariatric procedures performed, including those bariatric procedures performed using our da Vinci surgical system, as some patients reconsider the surgical treatment option. At this time, it is difficult to predict the long-term market impact of these drugs, including their long-term efficacy as weight loss drugs and potential drawbacks.
Additionally, we currently face, or anticipate facing, competition from companies with products used in open or MIS surgeries, including laparoscopy and alternative multi-port, single-port, or endoluminal systems. We also compete with companies providing other therapeutic approaches for addressing target clinical conditions, as well as companies developing diagnostic solutions that could serve as alternatives to current or planned Intuitive offerings. Companies that have introduced products in the field of robotic-assisted medical procedures, or have made explicit statements about their efforts to enter the field, include, but are not limited to, the following: Beijing Surgerii Robotics Company Limited; CMR Surgical Ltd.; Distalmotion SA; Harbin Sizhe Rui Intelligent Medical Equipment Co., Ltd.; Johnson & Johnson; Karl Storz SE & Co. KG; Medicaroid Corporation; Medtronic plc; meerecompany Inc.; Noah Medical; Shandong Weigao Group Medical Polymer Company Ltd.; Shanghai Microport Medbot (Group) Co., Ltd.; Shenzhen Edge Medical Co., Ltd.; and SS Innovations International, Inc. Other companies with substantial experience in industrial robotics could potentially expand into the field of medical robotics and become competitors. Additionally, we expect increasing competition within China for robotic-assisted surgical systems. We may not be able to maintain or improve our competitive position against current or potential competitors, especially those with greater resources. Our revenues may be reduced due to pricing pressure if our competitors develop and market products that are more effective or less expensive than our products. If we are unable to compete successfully, our revenues will suffer, which could have a material adverse effect on our business, financial condition, or result of operations.
In addition, third-party service providers that service da Vinci surgical system and Ion endoluminal system operators may emerge and compete with us on price or offerings. To date, substantially all of our customers have sourced services on their systems from us through service contract commitments or time and materials contracts. Furthermore, there are third-party service providers offering consulting services targeted at analyzing the cost-effectiveness of hospitals’ robotic-assisted medical programs, including procedures performed, placement of systems, and consumption of instruments and accessories. We currently provide similar services and analysis to our customers, but it is difficult to assess the impact that this may have on our business. If we are unable to compete successfully with any third-party service providers, our revenues may suffer, which could have a material adverse effect on our business, financial condition, or result of operations.
WE ARE SUBJECT TO A VARIETY OF RISKS DUE TO OUR OPERATIONS OUTSIDE OF THE U.S.
We manufacture, perform research and development activities, and distribute our products in OUS markets. Revenue from OUS markets accounted for approximately 33%, 34%, and 33% of our revenue for the years ended December 31, 2024, 2023, and 2022, respectively. Our OUS operations are, and will continue to be, subject to a number of risks including:
•the failure to obtain or maintain the same degree of protection against infringement of our intellectual property rights due to differing intellectual property protection laws in OUS countries from those in the U.S.;
•multiple OUS regulatory requirements that are subject to change and that could impact our ability to manufacture and sell our products;
•changes in tariffs, trade barriers, and regulatory requirements, such as the enactment of tariffs on goods imported into the U.S. including, but not limited to, the proposed tariff on goods imported from Mexico where we manufacture a significant majority of our instruments and accessories that we sell;
•protectionist laws, policies, and business practices and nationalistic campaigns that favor local competitors or lead non-U.S. customers to favor domestic technology solutions over imports, which could slow our growth, increase our costs, or make our products less competitive in OUS markets;
•local or national regulations that make it difficult or impractical to market or use our products;
•U.S. relations with the governments of the other countries in which we operate;
•the inability or regulatory limitations on our ability to move goods across borders;
•the risks associated with foreign currency exchange rate fluctuations;
•the difficulty in establishing, staffing, and managing OUS operations, including differing labor relations;
•the expense of establishing facilities and operations in new foreign markets;
•the building and maintenance of an organization capable of supporting geographically dispersed operations, including appropriate business procedures and controls;
•compliance with anti-corruption laws, such as the U.S. Foreign Corrupt Practices Act (“FCPA”), UK Bribery Act of 2010 (“UK Bribery Act”), and other local laws prohibiting corrupt payments to government officials;
•adherence to antitrust and anti-competition laws;
•economic weakness, including inflation, or political instability in particular foreign economies and markets, including exposure to a higher degree of financial risk if we extend credit to customers in these economies; and
•business interruptions due to natural disasters, outbreak of disease, climate change, and other events beyond our control.
We have increased, and will continue to increase, our operations in China. There is inherent risk, based on the complex relationships between China and the U.S., that political, diplomatic, military, or other events could result in business disruptions, including increased regulatory enforcement against companies, tariffs, trade embargoes, or export restrictions. Tariffs increase the cost of our products and the components and raw materials that go into making them. These increased costs adversely impact the gross margin that we earn on our products. Tariffs can also make our products more expensive for customers, which could make our products less competitive and reduce consumer demand. Countries may also adopt other measures, such as controls on imports or exports of goods, technology, or data, which could adversely impact our operations and supply chain and limit our ability to offer our products and services as designed. These measures can require us to take various actions, including changing suppliers and restructuring business relationships. Changing our operations in accordance with new or changed trade restrictions can be expensive, time-consuming, disruptive to our operations and distracting to management. Such restrictions can be announced with little or no advance notice, and we may not be able to effectively mitigate all adverse impacts from such measures. Political uncertainty surrounding trade and other international disputes could also have a negative effect on consumer confidence and spending. Additionally, our joint venture works with and relies on a number of dealers, distributors, and other third parties to commercialize and deliver our products. Any of these events could reduce customer demand, increase the cost of our products and services, or otherwise have a materially adverse impact on our customers’ and suppliers’ businesses or results of operations.
For example, in 2020, the U.S. government amended the Entity List rules to expand the requirement to obtain a license prior to the export of certain technologies. In addition, in 2020, a new U.S. regulation seeks to prohibit the U.S. government from contracting with companies who use the products or services of certain Chinese companies. Based on our current understanding of these regulations, they do not materially adversely impact our business at this time. However, we cannot predict the impact that additional regulatory changes may have on our business in the future. These actions or similar actions may result in policies and regulations in response that could adversely affect our business operations in China or may otherwise limit our ability to offer our products and services in China and other parts of the world.
In China, we have seen increasing competition in the robotic-assisted surgical system industry from domestic companies as well as a broader central government focus on systematic governance. For example, in July 2023, the Chinese government launched a campaign targeting the healthcare sector. This campaign has resulted in heightened scrutiny by medical institutions with respect to initiating tenders, with some tenders being canceled or delayed without a timeline. The extent and impact of this campaign on our business remains uncertain. In 2024, the effects of this campaign, combined with the competitive dynamics in China, contributed to fewer systems being placed in China than we anticipated. Currently, the extent and impact of this campaign and the competitive dynamics in China on our business remains uncertain.
In Israel, we have certain research and development operations primarily related to digital products. Depending on the length and extent of conflicts in the Middle East, including Israel and Iran, there may be adverse impacts to certain research and development timelines.
In the UK, following a national referendum and enactment of legislation by the government, the UK formally withdrew from the EU and ratified a trade and cooperation agreement governing its relationship with the EU. The EU–UK Trade and Cooperation Agreement (the “TCA”) was applied provisionally as of January 1, 2021, and entered into force on May 1, 2021. The TCA does not specifically refer to medical devices. However, as a result of Brexit, the EU Medical Devices Regulation will not be implemented in the UK, and previous legislation that sought to mirror the EU Medical Devices Regulation in the UK law has been revoked. The regulatory regime for medical devices in Great Britain continues to be based on the requirements derived from previous EU legislation, and the UK may choose to retain regulatory flexibility or align with the EU Medical Devices Regulation going forward. On January 9, 2024, the MHRA published a roadmap setting out its plans and timelines towards the reform of the regulatory framework for medical devices in the UK. Regulations implementing core elements of the new framework are intended to be in place by 2025.
Pending such reform of the UK regulatory framework, the Government has confirmed that general medical devices compliant with the EU Medical Devices Directive with a valid declaration and CE marking can be placed on the Great Britain market up until the sooner of expiry of certificate or June 30, 2028. Medical devices, including custom-made devices, compliant with the EU Medical Devices Regulation can be placed on the Great Britain market up until June 30, 2030. The rules for placing medical devices on the market in Northern Ireland, which is part of the UK, differ from those in Great Britain (England, Scotland and Wales) and continue to be based on EU law. The TCA does provide for cooperation and exchange of information in the area of product safety and compliance, including market surveillance, enforcement activities and measures, standardization-related activities, exchanges of officials, and coordinated product recalls (or other similar actions). For medical devices that are locally manufactured but use components from other countries, the “rules of origin” criteria will need to be reviewed. Depending on which countries products will ultimately be sold in, manufacturers may start seeking alternative sources for components if this would allow them to benefit from no tariffs. The rules for placing medical devices on the Northern Ireland market will differ from those in Great Britain. These developments, or the perception that any related developments could occur, have had and may continue to have a material adverse effect on global economic conditions and financial markets, and our business would likely be impacted and the demand for our products could be depressed.
The U.S. federal government has made changes to the U.S. trade policy, including entering into a successor to the North American Free Trade Agreement (“NAFTA”), known as the United States-Mexico-Canada Agreement (“USMCA”), effective as of July 1, 2020. In addition, the U.S. federal government has implemented tariffs on certain foreign goods and may implement additional tariffs on foreign goods. For example, on January 20, 2025, the U.S. presidential administration re-confirmed its intention to impose a 25% tariff on imports from Mexico and Canada into the United States as early as February 1, 2025. As we currently manufacture a significant majority of our instruments and accessories in Mexicali, Mexico, a 25% tariff on all imports from Mexico would increase the costs of our products manufactured in Mexico and adversely impact our gross profit. Such tariffs and, if enacted, any further legislation or actions taken by the U.S. federal government that restrict trade, such as additional tariffs, trade barriers, and other protectionist or retaliatory measures taken by governments in Europe, Asia, and other countries, could adversely impact our ability to sell products and services in our OUS markets. Tariffs could increase the cost of our products and the components and raw materials that go into making them. These increased costs could adversely impact the gross margin that we earn on our products, which could make our products less competitive and reduce consumer demand. Countries may also adopt other protectionist measures that could limit our ability to offer our products and services. The ultimate impact of any tariffs will depend on various factors, including if any tariffs are ultimately implemented, the timing of implementation, and the amount, scope, and nature of the tariffs.
In certain markets, our OUS sales are denominated in U.S. dollars. As a result, an increase in the value of the U.S. dollar relative to foreign currencies could make our products less competitive and/or less affordable in those OUS markets.
If we are unable to meet and manage these risks noted above, our OUS operations may not be successful, which would limit the growth of our business and could have a material adverse effect on our business, financial condition, or result of operations.
WE ARE SUBJECT TO LITIGATION, INVESTIGATIONS, AND OTHER LEGAL PROCEEDINGS RELATING TO OUR PRODUCTS, CUSTOMERS, COMPETITORS, AND GOVERNMENT REGULATORS THAT COULD MATERIALLY ADVERSELY AFFECT OUR FINANCIAL CONDITION, DIVERT MANAGEMENT’S ATTENTION, AND HARM OUR BUSINESS.
We are, and may become, subject to various legal proceedings and claims that arise in or outside the ordinary course of business. Certain current lawsuits and pending proceedings to which we are party, including purported class actions, product liability litigation, and patent litigation, are described in Note 8 to the Consolidated Financial Statements included in Part II, Item 8.
In particular, our business exposes us to significant risks of patent claims, product liability claims, and competition claims (including antitrust claims), many of which are common in the medical device industry. For example, product liability claims have been brought against us by, or on behalf of, individuals alleging that they have sustained personal injuries and/or death as
a result of purported product defects, the alleged failure to warn, and/or the alleged inadequate training by us of physicians regarding the use of the da Vinci surgical systems. The individuals who have brought the product liability claims seek recovery for their alleged personal injuries and, in many cases, punitive damages. Product liability claims have resulted in negative publicity regarding our Company, and ongoing or future product liability or negligence claims or product recalls could also harm our reputation. Refer to our risk factor titled “Negative publicity, whether accurate or inaccurate, concerning our products or our company could reduce market acceptance of our products and could result in decreased product demand and reduced revenues” for additional risks related to the potential effects of negative publicity on our business. Also, antitrust claims have been brought against us by third parties looking to compete in the instruments or servicing space and by certain customers.
The outcome of these product liability claims and other legal proceedings cannot be predicted with certainty. We purchase and maintain business insurance for certain liabilities and self-insure our product liability claims through a fronting policy. We cannot determine whether our existing business insurance program would be sufficient to cover the costs or potential losses related to our lawsuits and legal proceedings or otherwise be excluded under the terms of any insurance policy. Additionally, regardless of merit, litigation may be time-consuming and disruptive to our operations and cause significant legal costs (including settlements, judgments, legal fees, and other related defense costs) and diversion of management attention. We could also be subject to governmental investigations in connection with some of these claims. If we do not prevail in these legal proceedings, we may be faced with significant monetary damages or injunctive relief against us that could have a material adverse effect on our business, financial condition, or results of operations.
WE OFFER USAGE-BASED ARRANGEMENTS, INCLUDING ALTERNATIVE CAPITAL ACQUISITION APPROACHES; AS A RESULT, WE ARE EXPOSED TO AN INCREASED RISK OF LOSSES OF REVENUE AND INCREASED CREDIT RISK, WHICH COULD ADVERSELY AFFECT OUR BUSINESS, FINANCIAL CONDITION, OR RESULTS OF OPERATIONS.
We are increasingly offering usage-based arrangements as part of our business model. As a result, we are exposed to an increased risk of losses of revenue in any period where the usage decreases. Moreover, our pricing is generally set based on the expected usage of the technology. Therefore, if utilization of our technology falls short of the anticipated levels, we may not be able to recover the costs associated with the technology, which could adversely affect our business, financial condition, or results of operations.
We believe customer financing through leasing is an important consideration for some of our customers and have experienced an increase in demand for customer financing. Lease financing arrangements have the effect of reducing cash flows at lease commencement and, instead, spread them over the life of the lease term, which increases the time taken to recover our product costs and can impact our liquidity. We may experience losses from a customer’s failure to make payments according to the contractual lease terms. Our exposure to the credit risks relating to our lease financing arrangements may increase if our customers are adversely affected by changes in healthcare laws, coverage, and reimbursement, economic pressures or uncertainty, or other customer-specific factors. Although we have programs in place that are designed to monitor and mitigate the associated risks, there can be no assurance that such programs will be effective in reducing credit risks relating to these lease financing arrangements. If the level of credit losses we experience in the future exceeds our expectations, such losses could have a material adverse effect on our financial condition or results of operations.
We also lease our systems to certain qualified customers where the lease payments are based on their usage of the systems. If customers do not perform a sufficient number of procedures on our systems leased under usage-based arrangements, it could impact our profitability on those arrangements and our overall results of operations. Moreover, the usage of those systems and related billings could vary from quarter to quarter, which could result in higher variability in our revenue under those arrangements, including a significant reduction in revenue if the usage ends, fluctuations in our gross profit margins if utilization is different than our expectations, and unpredictable cash flows. Moreover, there is risk in forecasting future utilization of a system and, therefore, we may not set our usage-based rates high enough to maintain our gross profit margins. Additionally, certain of our leasing arrangements allow customers to cancel, return, or upgrade the systems leased prior to the end of the lease term without incurring a financial penalty, which could have a material adverse effect on our business, financial condition, or results of operations. If systems that are not fully depreciated are returned, we could also incur additional losses, as we may not be able to recover the remaining value of those returned assets, thereby negatively impacting our financial results.
While leases, including usage-based arrangements, enable our customers to upgrade and get access to new technologies faster, it may also enable competitors to more easily induce customers to switch to such competitors’ systems. Furthermore, depending on the timing and terms of the upgrade transaction, the amount of revenue generated on the initial and upgraded lease arrangements may not, in the aggregate, generate the same amount of revenue that a traditional sale and trade-in transaction would.
OUR RELIANCE ON SOLE- AND SINGLE-SOURCED SUPPLIERS AND ABILITY TO PURCHASE AT ACCEPTABLE PRICES A SUFFICIENT SUPPLY OF MATERIALS COULD HARM OUR ABILITY TO MEET PRODUCT DEMAND IN A TIMELY MANNER OR WITHIN BUDGET.
Some of the components necessary for the assembly of our products are currently provided to us by sole-sourced suppliers or single-sourced suppliers. We generally purchase components through purchase orders rather than long-term supply agreements and generally do not maintain large volumes of components within our inventory. While alternative suppliers exist and could be identified for single-sourced components, the disruption or termination of the supply of components, or inflationary pressure in our supply chain, could cause a significant increase in the costs of these components, which could affect our operating results. Certain of our sole-sourced suppliers or single-sourced suppliers could be adversely affected by the macroeconomic conditions, such as liquidity concerns in the broader financial services industry, that could result in delayed access or loss of access to their uninsured deposits or loss of their ability to draw on existing credit facilities involving a troubled or failed financial institution. A disruption or termination in the supply of components could also result in our inability to meet demand for our products, which could harm our ability to generate revenues, lead to customer dissatisfaction, and damage our reputation and our brand. Furthermore, if we are required to change the manufacturer of a key component of our products, we may be required to verify that the new manufacturer maintains facilities and procedures that comply with quality standards and with all applicable regulations and guidelines. The time and processes associated with the verification of a new manufacturer could delay our ability to manufacture our products on schedule or within budget, which may have a material adverse impact on our business, financial condition, or results of operations.
In addition, our ability to meet customers’ demands depends, in part, on our ability to timely obtain an adequate delivery of quality materials, parts, and components from our suppliers. An information technology systems interruption, including cyberattacks, could adversely affect the ordering, distribution, and manufacturing processes of our suppliers. Current supply chain constraints include difficulties in obtaining a sufficient supply of engineered raw materials and certain subcontract suppliers being operationally challenged to meet our production requirements. Additionally, prices of materials for some components remain elevated from historical levels due to strong market demand or supply chain cost inflation. If such supply chain constraints and price increases in important supply-chain materials continue, we could also fail to meet product demand, which would adversely impact our business, financial condition, or results of operations.
NEW PRODUCT DEVELOPMENTS AND INTRODUCTIONS MAY ADVERSELY AFFECT OUR BUSINESS, FINANCIAL CONDITION, OR RESULTS OF OPERATIONS.
We develop and introduce new products with enhanced features and extended capabilities from time to time. We may introduce new products that target different markets than what our existing products target. The success of new product introductions depends on a number of factors including, but not limited to, timely and successful research and development, regulatory clearances, approvals, or certifications, establishment or maintenance of intellectual property rights, pricing, competition, market and consumer acceptance, effective forecasting and management of product demand, inventory levels, management of manufacturing costs and capacity, management of supply costs, including mitigation of unforeseen supply chain disruptions for materials and components, and the risk that new products may have quality or other defects in the early stages of introduction.
We invest substantially in various research and development projects to expand our product offerings. Our research and development efforts are critical to our future success, and such research and development projects may not be successful. We may be unable to successfully develop and market new products, and the products we invest in and develop may not be well-received by customers or meet our expectations. Our research and development investments may not contribute to our future operating results for several years or ultimately generate significant operating income, and such future contributions may not meet our expectations or even cover the costs of such investments. In addition, the introduction or announcement of new products or product enhancements may shorten the life cycle of our existing products or reduce the demand for our current products, thereby offsetting any benefits of successful product introductions and potentially leading to challenges in managing our inventory of existing products.
Our products are subject to various regulatory processes, and we must obtain and maintain regulatory approvals and certifications in order to sell our new products. If a potential purchaser believes that we plan to introduce a new product in the near future or is located in a country where a new product that we have introduced has not yet received regulatory clearance or certification, planned purchases may be deferred or delayed. In the past, we have experienced a slowdown in the demand for existing products in advance of new product introductions, and we may experience a slowdown in such demand in the future as well. It is also possible that a new product introduction could cause downward pressure on the prices of our existing products or require us to change how we sell our products, either of which could have material adverse effects on our revenues.
If we fail to effectively develop new products and manage new product introductions in the future, our business, financial condition, or results of operations could be adversely impacted.
WE MAY ENCOUNTER MANUFACTURING PROBLEMS OR DELAYS THAT COULD RESULT IN LOST REVENUE.
Manufacturing our products is a complex process. We (or our critical suppliers) may encounter difficulties in scaling up or maintaining production of our products, including:
•problems involving production yields;
•quality control and assurance;
•component supply shortages;
•import or export restrictions on components, materials, or technology;
•shortages of qualified personnel; and
•compliance with state, federal, and foreign regulations.
If demand for our products exceeds our manufacturing capacity, we could develop a substantial backlog of customer orders. If we are unable to develop or maintain larger-scale manufacturing capabilities or build new manufacturing capabilities or facilities on schedule or within budget, our ability to generate revenue and maintain gross profit margins as expected will be limited and our reputation in the marketplace could be damaged, all of which may have a material adverse impact on our business, financial condition, or results of operations.
In addition, as we build new facilities for manufacturing capacity, the development of these facilities is subject to risks relating to our ability to complete our projects on schedule or within budget. Refer to our risk factor titled “We are subject to risks associated with real estate construction and development” for additional risks related to building our new manufacturing facilities.
Also, after new manufacturing facilities are completed, we may encounter difficulties transferring our production lines from our existing facilities to the new facilities, which require qualification, validation, and regulatory approval and is subject to all of the risks highlighted above. Moreover, certain new manufacturing facilities are in foreign countries and in locations where we have not previously had manufacturing sites, both of which could increase the risks related to transferring our production lines. The facility transfers may require an increase in safety stock inventory to support the production line transfers, create a substantial backlog of customer orders, or increase costs while the production lines mature, all of which may have a material adverse impact on our business, financial condition, or results of operations.
WE EXPECT GROSS PROFIT MARGINS TO VARY OVER TIME, AND CHANGES IN OUR GROSS PROFIT MARGINS COULD ADVERSELY AFFECT OUR BUSINESS, FINANCIAL CONDITION, OR RESULTS OF OPERATIONS.
Our gross profit margins have fluctuated from period to period, and we expect that they will continue to fluctuate in the future. Our gross profit margins may be adversely affected by numerous factors, including:
•changes in customer, geographic, or product mix, including the mix of systems sold or leased;
•changes in the mix of fixed payment or usage-based operating lease arrangements;
•changes in the portion of sales involving a trade-in of another system and the amount of trade-in credits given;
•our introduction of new products, which may have lower margins than our existing products;
•our inability to maintain or reduce production costs;
•changes in our pricing strategy;
•fluctuations in foreign currency exchange rates;
•competition;
•changes in production volume driven by demand for our products;
•changes in material, labor, or other manufacturing-related costs, including the impact of foreign exchange rate fluctuations for foreign currency-denominated costs;
•changes to U.S. and foreign trade policies, such as the enactment of tariffs on goods imported into the U.S. including, but not limited to, the proposed tariff on goods imported from Mexico where we manufacture a significant majority of our instruments and accessories that we sell;
•inventory obsolescence, which may result from maintaining significant inventories of raw materials, components, and finished goods;
•product recall charges; and
•market conditions.
If we are unable to offset the unfavorable impact of the factors noted above by increasing the volume of products shipped, reducing product manufacturing costs, or otherwise, our business, financial condition, or results of operations may be adversely affected.
MACROECONOMIC CONDITIONS COULD MATERIALLY ADVERSELY AFFECT OUR BUSINESS, FINANCIAL CONDITION, OR RESULTS OF OPERATIONS.
Macroeconomic conditions, such as inflationary pressure, changes to monetary policy, elevated interest rates, volatile currency exchange rates, credit and sovereign debt concerns, concerns about slowed growth in China and other OUS markets, decreasing consumer confidence and spending, including capital spending, the introduction of or changes in tariffs or trade barriers, and global or local recessions can adversely impact demand for our products, which could negatively impact our business, financial condition, or results of operations. Recent macroeconomic conditions have been adversely impacted by geopolitical instability and military hostilities in multiple geographies (including the conflict between Russia and Ukraine and conflicts in the Middle East, including Israel and Iran), monetary and financial uncertainties, and the COVID-19 pandemic.
The results of these macroeconomic conditions, and the actions taken by governments, central banks, companies, and consumers in response, have previously resulted in, and may again in the future result in, higher inflation in the U.S. and globally, which could, in turn, lead to an increase in costs and may cause changes in fiscal and monetary policy, including additional increases in interest rates. Other adverse impacts of recent macroeconomic conditions have been, and may continue to be, supply chain constraints, logistics challenges, liquidity concerns in the broader financial services industry, and fluctuations in labor availability.
We have experienced, and may continue to experience, supply chain constraints due to the current supply chain environment, including difficulties obtaining a sufficient supply of component materials used in our products. If interest rates remain elevated, access to credit may become more difficult, which may result in the insolvency of key suppliers, including single-source suppliers, which would exacerbate supply chain challenges. Cybersecurity breaches also remain a threat to our sustained supply continuity. Such supply chain constraints could cause us to fail to meet product demand, which could result in deferred or canceled procedures.
Adverse developments that affect financial institutions, transactional counterparties, or other third parties, or concerns or rumors about these events, have in the past led to, and may in the future lead to, market-wide liquidity problems. For example, in 2023, Silicon Valley Bank (“SVB”) was closed by the California Department of Financial Protection and Innovation, which appointed the U.S. Federal Deposit Insurance Corporation (“FDIC”) as receiver. Similarly, other institutions have been, and may continue to be, swept into receivership. Uncertainty may remain over liquidity concerns in the broader financial services industry, and there may be unpredictable impacts to our business and our industry.
In a higher inflationary environment, we may be unable to raise the prices of our products and services sufficiently to keep up with the rate of inflation. Impacts from inflationary pressures could be more pronounced and materially adversely impact aspects of our business where revenue streams and cost commitments are linked to contractual agreements that extend further into the future, as we may not be able to quickly or easily adjust pricing, reduce costs, or implement countermeasures. A higher inflationary environment can also negatively impact raw material, component, and logistics costs that, in turn, may increase the costs of producing and distributing our products.
Furthermore, hospitals and distributors may choose to postpone or reduce spending due to financial difficulties or difficulties in obtaining credit to finance purchases of our products due to elevated interest rates and restraints on credit. Hospitals and distributors may also be adversely affected by liquidity concerns in the broader financial services industry, as described above, that could result in delayed access or loss of access to uninsured deposits or loss of their ability to draw on existing credit facilities involving a troubled or failed financial institution. Certain hospitals are experiencing, and may continue to experience, financial and operational pressures as a result of staffing shortages, the supply chain environment, a decrease in government funding in healthcare, and elevated inflation, which could impact their ability to access capital markets and other funding sources, increase the cost of funding, or impede their ability to comply with debt covenants, all of which could impede their ability to provide patient care, defer elective surgeries, and impact their profitability. To the extent that hospitals face financial pressures, delayed access or loss of access to uninsured deposits, delayed access or loss of ability to draw on existing credit facilities, reductions in government spending, or higher interest rates, hospitals’ ability or willingness to spend on capital equipment may be adversely impacted, all of which could have a material adverse effect on our business, financial condition, or results of operations. Additionally, with economic uncertainty, an increase in unemployment rates, and increasing health insurance premiums, co-payments and deductibles may result in cost-conscious consumers pursuing fewer elective surgical procedures, which, in turn, could adversely affect procedure volumes and system demand.
We are unable to predict the impact of efforts by central banks and federal, state, and local governments to combat elevated levels of inflation. If their efforts to create downward pressure on inflation are too aggressive, they may lead to a recession. Alternatively, if they are insufficient or are not sustained long enough to bring inflation to lower, more acceptable levels, hospitals’ ability or willingness to spend on capital equipment may be impacted for a prolonged period of time. If a recession
occurs, economies weaken, or inflationary trends continue, our business and results of operations could be materially adversely affected.
INFORMATION TECHNOLOGY SYSTEM FAILURES, CYBERATTACKS, OR DEFICIENCIES IN OUR CYBERSECURITY COULD HARM OUR BUSINESS, CUSTOMER RELATIONS, FINANCIAL CONDITION, OR RESULTS OF OPERATIONS.
Our information technology systems are critical to the success of our products, help us operate effectively and efficiently, interface with customers, maintain our supply chain and manufacturing operations, maintain financial accuracy and efficiency, and help us produce our Annual Report on Form 10-K and our other filings with the Securities and Exchange Commission. If we do not allocate and effectively manage the resources necessary to build and sustain the proper information technology infrastructure, we could be subject to transaction errors, processing inefficiencies, the loss of existing customers, difficulty attracting new customers, business operation disruptions, diversion of the attention of management and key information technology resources, security breaches, or the unauthorized access to, loss of, or damage to intellectual property, confidential information, or personal information. Our information technology systems, and those of our third-party service providers, strategic partners, and other contractors or consultants, are vulnerable to attack, damage, or interruption from a variety of sources. These sources include computer viruses and malware (e.g., ransomware), malicious code, hacking, cyberattacks, phishing attacks and other social engineering schemes, employee theft or misuse, human error, fraud, natural disasters, terrorism, war, telecommunication and electrical failures, denial or degradation of service attacks, sophisticated nation-state and nation-state-supported actors, or unauthorized access or use by persons inside our organization, or persons with access to systems inside our organization. Cyberattacks and other security breaches or disruptions continue to increase in frequency, sophistication, and intensity and are becoming increasingly difficult to detect for periods of time, especially as they relate to attacks on third-party providers or their vendors. Such attacks are often carried out by motivated and highly skilled actors, who are increasingly well-resourced. Techniques used to compromise or sabotage systems, including the use of advanced technologies, such as machine learning or generative artificial intelligence (“AI”), change frequently, may originate from less regulated and remote areas of the world, may be difficult to detect, and generally are not recognized until after they are launched against a target. As a result, we may be unable to anticipate these techniques or implement adequate preventative measures. If our information technology systems, or those of our critical third-party vendors, do not effectively and securely collect, store, process, and report relevant data for the operation of our business, our ability to effectively plan, forecast, and execute our business plan and comply with applicable laws and regulations could be impaired. Any such impairment could materially and adversely affect our financial condition, results of operations, and the timeliness with which we report our internal and external operating results.
Our business requires us to use and store customer, employee, and business partner personal information. This may include names, addresses, phone numbers, email addresses, contact preferences, tax identification numbers, and payment account information. We have implemented, and our critical third-party vendors may implement, various controls, systems, and processes intended to secure our information technology systems and the information on it. For example, we require usernames and passwords in order to access our information technology systems and use encryption and authentication technologies to secure the transmission and storage of data. We also have programs in place to detect, contain, and respond to data security incidents, and we make ongoing improvements to our information-sharing products in order to minimize vulnerabilities, in accordance with industry and regulatory standards. However, we cannot guarantee that these measures will be effective or that attempted security breaches or disruptions would not be successful or damaging. These security measures may be compromised as a result of security breaches by unauthorized persons, employee error, malfeasance, faulty password management, or other irregularity and result in persons obtaining unauthorized access to our data or accounts. Third parties may attempt to fraudulently induce employees or customers into disclosing usernames, passwords, or other sensitive information or otherwise attempt to hack into our information technology systems to obtain personal data relating to patients or employees, our confidential or proprietary information, or confidential information we hold on behalf of third parties. In addition, with the prolific use of AI technologies, there is an increased risk of unauthorized or accidental disclosure. For example, our employees, third-party service providers, strategic partners, or other contractors or consultants may input inappropriate or confidential information into an AI system (in particular, a system that is managed, owned, or controlled by a third party), thereby compromising our business operations. Even if the vulnerabilities that may lead to the foregoing are identified, we may be unable to adequately investigate or remediate due to attackers increasingly using tools and techniques that are designed to circumvent controls, avoid detection, and remove or obfuscate forensic evidence. The occurrence of any of these events may cause business operation disruptions, diversion of the attention of management and key information technology resources, and possibly lead to security breaches of, or the unauthorized access to, our confidential information or other business data. If the unauthorized persons successfully hack into or interfere with our connected products or services, they may create issues with product functionality that could pose a risk of the loss of data, a risk to patient safety, and a risk of product recall or field action, which could adversely impact our business and reputation. We may also face increased cybersecurity risks due to our reliance on internet technology and the number of our employees who are working remotely, which may create additional opportunities for cybercriminals to exploit vulnerabilities.
As described above, we also rely on external vendors to supply and/or support certain aspects of our information technology systems. The systems of these external vendors may contain defects in design or manufacture or other problems that could unexpectedly compromise the security of our own information technology systems, and we are dependent on these third parties to deploy appropriate security programs to protect their systems. In addition to potential exposure to data breaches, security and cybersecurity incidents, or other actions that may compromise the security of or interfere with the function of our systems, defects or vulnerabilities in the software or systems of our external vendors may expose failures in our internal controls and risk management processes, which may adversely impact our business, financial condition, or results of operations and may also harm our reputation, brand, and customer relationships.
While we devote significant resources to network security, data encryption, and other security measures to protect our systems and data, these security measures cannot provide absolute security. We and certain of our service providers are, from time to time, subject to cyberattacks and security breaches and incidents. We consider such cyberattacks or security breaches and incidents to be in the ordinary course of business for a company of our size in our industry. While we do not believe that we have experienced any significant system failure, accident, or security breach to date, if such an event were to occur, it could impair our ability to attract and retain customers for our products, impact the price of our stock, materially damage commercial relationships, and expose us to litigation or government investigations, which could result in penalties, fines, or judgments against us. The costs to us to eliminate or alleviate network security problems, bugs, viruses, worms, ransomware and other malicious software programs, and security vulnerabilities could be significant. Our efforts to address these problems may not be successful and could result in unexpected interruptions, delays, cessation of service, and harm to our business operations. Moreover, if a security breach affects our systems or results in the unauthorized release of personal information, our reputation and brand could be materially damaged, and use of our products and services could decrease. We would also be exposed to a risk of loss, litigation and potential liability, and regulatory scrutiny, which could have a material adverse impact on our business, financial condition, or results of operations.
Furthermore, we may implement changes to information technology systems that could have significant impacts on our manufacturing, sales, and finance functions, among other teams. These impacts may include, but are not limited to, (i) operational disruptions resulting from the slow adaptation of the new information technology systems by employees, whether due to inadequate training or resistance to change, or data loss during the transition to the updated information technology system, including critical customer data, or improper planning leading to the loss of essential software features needed for specific business requirements; (ii) inaccurate financial reporting due to inaccurate data transfer or technical issues; (iii) financial losses due to system failures or cost overruns; (iv) security risks involving potential data breaches, unauthorized access, or loss of sensitive information; (v) compliance risks arising should the updated technology fail to meet regulatory requirements or industry standards; and (vi) strategic risks if the technology implementation fails to deliver the expected benefits.
While we maintain cyber insurance coverage that is intended to address data security risks, such insurance coverage may be insufficient to cover all losses or claims that may arise.
IF OUR PRODUCTS DO NOT ACHIEVE AND MAINTAIN MARKET ACCEPTANCE, WE WILL NOT BE ABLE TO GENERATE THE REVENUE NECESSARY TO SUPPORT OUR BUSINESS.
The da Vinci surgical systems, Ion endoluminal system, and our other products represent a novel and advanced approach to performing medical procedures. Achieving and maintaining physician, patient, and third-party payor acceptance of robotic-assisted medical procedures as a preferred method of performing these procedures is crucial to our success. If our products fail to achieve or maintain market acceptance, customers will not purchase our products, and we will not be able to generate the revenue necessary to support our business. We believe that physicians’ and third-party payors’ acceptance of the benefits of procedures performed using our products will be essential for acceptance of our products by patients. Physicians will not recommend the use of our products unless we can demonstrate that they produce results comparable or superior to existing techniques. Even if we can prove the effectiveness of our products through clinical studies, physicians may elect not to use our products for any number of other reasons. For example, cardiologists may continue to recommend conventional heart surgery simply because such surgery is already widely accepted. In addition, physicians may be slow to adopt our products because of the perceived liability risks arising from the use of new products and the uncertainty of reimbursement from third-party payors, particularly in light of ongoing healthcare reform initiatives and the evolving U.S. healthcare environment.
Broad use of our products requires thorough training of patient care teams on their safe and effective use. We expect that there will continue to be a learning process involved for such care teams to become proficient in the use of our products. Market acceptance could be delayed by the time required to complete this training. We may not be able to rapidly train patient care teams in numbers sufficient to generate adequate demand for our products.
IF HOSPITALS ARE UNABLE TO OBTAIN COVERAGE AND REIMBURSEMENT FOR PROCEDURES USING OUR PRODUCTS, IF REIMBURSEMENT IS INSUFFICIENT TO COVER THE COSTS OF PURCHASING OUR PRODUCTS, OR IF LIMITATIONS ARE IMPOSED BY GOVERNMENTS ON THE AMOUNT HOSPITALS CAN CHARGE FOR CERTAIN PROCEDURES, WE MAY BE UNABLE TO GENERATE SUFFICIENT SALES TO SUPPORT OUR BUSINESS.
In the U.S., hospitals generally bill for the services performed with our products to various third-party payors, such as Medicare, Medicaid, other government programs, and private insurance plans. If hospitals do not obtain sufficient reimbursement from third-party payors for procedures performed with our products, or if government and private payors’ policies do not cover surgical procedures performed using our products, we may not be able to generate the revenues necessary to support our business. In addition, to the extent that there is a shift from an inpatient setting to outpatient settings, we may experience pricing pressure and a reduction in the number of procedures performed. Our success in OUS markets also depends on the eligibility of our products for coverage and reimbursement through government-sponsored healthcare payment systems and third-party payors. Reimbursement practices vary significantly by country. Many OUS markets have government-managed healthcare systems that control reimbursement for new products and procedures. Other foreign markets have both private insurance systems and government-managed systems that control reimbursement for new products and procedures. Market acceptance of our products may depend on the availability and level of coverage and reimbursement in a country within a particular time. In addition, healthcare cost containment efforts similar to those in the U.S. are prevalent in many of the other countries in which we sell, and intend to sell, our products, and these efforts are expected to continue. Refer to our risk factor titled “Changes in healthcare legislation and policy may have an adverse effect on our business, financial condition, or results of operations” for additional risks related to the ability of hospitals to obtain reimbursements.
In China, since 2022, several provinces have implemented significant limits on what hospitals can charge patients for surgeries using robotic surgical technology, including soft tissue surgery. To date, these limits have impacted the number of procedures performed in those provinces, which has impacted our instruments and accessories revenue. Companies providing robotic surgical technology, including our joint venture in China, have been meeting with Chinese government healthcare agencies to discuss these developments and to provide feedback. We cannot assure you that additional provincial or national healthcare agencies and administrations will not impose similar limits, and we expect to continue to face increased pricing pressure, both of which could further impact the number of procedures performed and our instruments and accessories revenue in China.
IF OUR PRODUCTS CONTAIN DEFECTS OR ENCOUNTER PERFORMANCE PROBLEMS, WE MAY HAVE TO RECALL OUR PRODUCTS AND OUR REPUTATION MAY SUFFER.
Our success depends on the quality and reliability of our products. While we subject components sourced and products manufactured to stringent quality specifications and processes, our products incorporate mechanical parts, electrical components, optical components, and computer software, any of which may contain errors or exhibit failures, especially when products are first introduced. Component failures, manufacturing flaws, design defects, or inadequate disclosure of product-related risks with respect to our products could result in an unsafe condition for, injury to, or death of a patient. In addition, new products or enhancements may contain undetected errors or performance problems that, despite testing, are discovered only after commercial shipment. Because our products are designed to be used to perform complex surgical procedures, due to the serious and costly consequences of product failure, we and our customers have an increased sensitivity to such defects. In the past, we have voluntarily recalled certain products. Although our products are subject to stringent quality processes and controls, we cannot provide assurance that our products will not experience component aging, errors, or performance problems. If we experience product flaws or performance problems, any or all of the following could occur:
•delays in product shipments;
•loss of revenue;
•delay in market acceptance;
•diversion of our resources;
•damage to our reputation;
•product recalls, including, but not be limited to, product withdrawals from the market, labeling changes, design changes, customer notifications, and notifications to global regulatory bodies;
•regulatory actions;
•increased service or warranty costs; or
•product liability claims.
Costs associated with defects or performance problems of our products could have a material adverse effect on our business, financial condition, or results of operations.
WE UTILIZE DISTRIBUTORS FOR A PORTION OF OUR SALES AND SERVICE OF OUR PRODUCTS IN CERTAIN COUNTRIES, WHICH SUBJECTS US TO A NUMBER OF RISKS THAT COULD HARM OUR BUSINESS, FINANCIAL CONDITION, OR RESULTS OF OPERATIONS.
We have strategic relationships with several key distributors for the sale and service of our products in certain countries. If these strategic relationships are terminated and not replaced, our revenues and/or ability to sell or service our products in the markets serviced by these distributors could be adversely affected. In addition, we may be named as a defendant in lawsuits against our distributors related to sales or service of our products performed by them. Refer to our risk factor titled “We are subject to litigation, investigations, and other legal proceedings relating to our products, customers, competitors, and government regulators that could materially adversely affect our financial condition, divert management’s attention, and harm our business.” Our distributors may affect our ability to effectively market our products in certain countries or regulatory jurisdictions if a distributor holds the regulatory authorization or certification in such countries or within such regions and causes, by action or inaction, the suspension of such marketing authorization or certification or sanctions for non-compliance. It may be difficult, expensive, and time-consuming for us to re-establish market access or regulatory compliance in such cases.
THE FAILURE TO ATTRACT AND RETAIN KEY PERSONNEL COULD HARM OUR ABILITY TO COMPETE, AND CHANGES IN OUR EXISTING LABOR RELATIONSHIPS COULD MATERIALLY ADVERSELY IMPACT OUR BUSINESS, FINANCIAL CONDITION, OR RESULTS OF OPERATIONS.
We are highly dependent on the principal members of our management and scientific staff. For example, our product development plans depend, in part, on our ability to attract and retain software, mechanical, electrical, manufacturing, and robotics engineers. Attracting and retaining qualified personnel is critical to our success, and competition for qualified personnel is intense. We may not be able to attract and retain personnel on acceptable terms given the constrained labor market and competition for such personnel. Furthermore, as market competition intensifies, there is an increased risk that our current or emerging competitors may attempt to hire our key personnel, which could be achieved through offers of substantial financial incentives or strategic opportunities, aiming to capitalize on their knowledge to accelerate their own product development initiatives. In addition, many of our tenured employees are retirement eligible and have significant historical knowledge or expertise that must be transferred to other employees. If we are unable to effectively safeguard our human capital or mitigate the risks associated with knowledge transfer, our business, financial condition, or results of operations could be adversely impacted, and there could be a detrimental effect on our competitive position.
Additionally, as a result of any volatility in our stock price, certain long-term incentive benefits, such as stock-based compensation, may be viewed as having less value and, accordingly, could lead to higher attrition. Moreover, we may also encounter higher costs of labor through recruiting expenses, wage rates, retention benefits, or the potential existence of different employee/employer relationships, such as work councils and/or labor unions.
Fluctuations in labor availability globally, including labor shortages and staff burnout and attrition, may also impact our ability to hire and retain personnel critical to our manufacturing, logistics, and commercial operations. The extent and duration of the impact of labor market challenges are subject to numerous factors, including the availability of qualified and highly skilled persons in the markets where we operate and unemployment levels within these markets, behavioral changes, such as fully engaging employees, including those working from home or in a hybrid fashion, prevailing wage rates, health and other insurance and benefit costs, inflation, adoption of new or revised employment and labor laws and regulations or government programs, safety levels of our operations, and our reputation within the labor market. The loss of any of our qualified personnel or our inability to attract and retain qualified personnel could harm our business and our ability to compete, and related expenses could adversely affect our business, financial condition, or results of operations.
Moreover, if we fail to attract, motivate, or retain personnel or if we relax our standards in order to meet the demands of our growth, our corporate culture, our ability to achieve our strategic objectives, and our compliance with obligations under our internal controls and other requirements may be harmed. We believe that a critical contributor to our success has been our corporate culture, which we believe fosters innovation, teamwork, and a focus on execution, as well as facilitates critical knowledge transfer and knowledge sharing. We could also be subject to union or council efforts to organize our employees. These organizational efforts, if successful, decrease operational flexibility and could adversely affect our operating efficiency. In addition, our response to any organizational efforts could be perceived negatively and harm our business and reputation.
PUBLIC HEALTH CRISES OR EPIDEMIC DISEASES, OR THE PERCEPTION OF THEIR EFFECTS, COULD MATERIALLY ADVERSELY AFFECT OUR BUSINESS, FINANCIAL CONDITION, OR RESULTS OF OPERATIONS.
Our global operations expose us to risks arising from public health crises and outbreaks of epidemic, pandemic, or contagious diseases, such as, historically, the COVID-19 pandemic, the Ebola virus, Middle East Respiratory Syndrome (MERS), Severe Acute Respiratory Syndrome (SARS), and the H1N1 virus. These public health crises can divert medical resources and priorities toward disease treatment and adversely affect global economies and financial markets, which can negatively impact the number of procedures performed and our customers’ capital expenditures. Furthermore, public health
crises can cause significant business disruptions, including temporary closures of our facilities and those of our suppliers, as well as reduced access to customers due to measures like travel restrictions. These impacts can have a material adverse effect on our business, financial condition, or results of operations.
For example, the COVID-19 pandemic, which first emerged in late 2019, adversely impacted our operations, supply chains, and expenses. These impacts resulted from a number of impacts and measures, including, but not limited to, healthcare customers diverting resources and priorities towards disease treatment, hospital staffing shortages and supply chain disruptions that impaired their ability to provide patient care, and precautionary measures implemented by governments, businesses, and ourselves. Due to these factors, we experienced significant and unpredictable reductions in the demand for our products as customers delayed or cancelled planned procedures and capital expenditures. Furthermore, the COVID-19 pandemic also caused widespread business disruptions, including travel restrictions, reduced access to our customers, and temporary closures of our facilities and those of our suppliers. For instance, California, where many of our operations and manufacturing facilities are located, implemented risk-reduction orders that limited our employees’ ability to produce and move products through the supply chain. Such disruptions negatively impacted our business, financial condition, and results of operations. Similar effects may occur in the event of a resurgence of COVID-19 or the emergence of another public health crisis.
Also, any delays in elective surgeries caused by a public health crisis, outbreak of epidemic, pandemic, or contagious disease may create patient backlogs. The patients in such backlogs may or may not use our products when their surgeries are ultimately performed.
In addition, public health crises and outbreaks of epidemic, pandemic, or contagious diseases can negatively impact global economies and financial markets, leading to economic slowdowns or recessions. Such conditions may reduce hospital spending, delay product demand, and increase the risk of customer payment defaults or agreement terminations due to liquidity constraints or funding issues. These factors create material uncertainties and risks to our business, financial condition, and results of operations.
NEGATIVE PUBLICITY, WHETHER ACCURATE OR INACCURATE, CONCERNING OUR PRODUCTS OR OUR COMPANY COULD REDUCE MARKET ACCEPTANCE OF OUR PRODUCTS AND COULD RESULT IN DECREASED PRODUCT DEMAND AND REDUCED REVENUES.
There have been reports and articles published questioning patient safety and efficacy associated with robotic-assisted surgery with the da Vinci surgical systems, their cost relative to other disease management methods, and the adequacy of surgeon training. Negative publicity, including statements made by public officials, whether accurate or inaccurate, concerning our products or our Company could reduce market acceptance of our products and could result in decreased product demand and a decline in revenues. In addition, significant negative publicity could result in an increased number of product liability claims, regardless of whether these claims are meritorious. The number of claims could be further increased by plaintiffs’ law firms that use a wide variety of media to advertise their services and solicit clients for product liability cases against us.
WE COULD BE SUBJECT TO SIGNIFICANT, UNINSURED LOSSES, WHICH MAY HAVE A MATERIAL ADVERSE IMPACT ON OUR BUSINESS, FINANCIAL CONDITION, OR RESULTS OF OPERATIONS.
For certain risks, we do not maintain insurance coverage due to cost and/or availability. For example, we self-insure our product liability risks. We also indemnify our directors and officers for third-party claims but do not carry insurance beyond basic Side A liability coverage to cover that indemnity or the related underlying potential losses. Furthermore, we do not carry, among other types of coverage, earthquake insurance. In the future, we may not continue to maintain certain existing insurance coverage or adequate levels of coverage. Premiums for many types of insurance have increased significantly in recent years and, depending on market conditions and our circumstances, certain types of insurance, such as directors’ and officers’ insurance, may not be available in the future on acceptable terms or at all. Because we retain some portion of our insurable risks and, in some cases, we are entirely self-insured, unforeseen or catastrophic losses in excess of insurance coverage could require us to pay substantial amounts, which may have a material adverse impact on our business, financial condition, or results of operations.
WE EXPERIENCE LONG AND VARIABLE CONTRACTING CYCLES AND SEASONALITY IN OUR BUSINESS, WHICH MAY CAUSE FLUCTUATIONS IN OUR FINANCIAL RESULTS.
The contracting cycle of our systems is lengthy, because the systems are major capital items and their purchase generally requires the approval of senior management of hospitals, their parent organizations, purchasing groups, and/or government bodies. In addition, sales to some of our customers are subject to competitive bidding or public tender processes. These approval and bidding processes can be lengthy. As a result, hospitals may delay or accelerate system purchases in conjunction with the timing of their capital budget timelines. Further, IDN groups are creating larger networks of system users with increasing purchasing power and are increasingly evaluating their robotic-assisted programs to optimize the efficiency of surgeries and bronchoscopies using da Vinci surgical systems and the Ion endoluminal system, respectively. Further, the introduction of new products could adversely impact our contracting cycle as customers take additional time to assess the
benefits and costs of such products. As a result, it is difficult for us to predict the length of contracting cycles and, therefore, the exact timing of capital sales. Historically, placements of our da Vinci surgical systems have tended to be heavier in the fourth quarter and lighter in the first quarter, as hospital budgets are reset.
We have experienced higher procedure growth for a number of benign conditions, including cholecystectomies, hernia repairs, hysterectomies, and certain other surgeries. Many of these types of surgeries may be postponed in the short term by patients to avoid vacation periods and for other personal scheduling reasons. Patients may also accelerate procedures to take advantage of insurance funding cut-off dates. Historically, we have experienced lower procedure volume growth from the prior quarter in the first and third quarters of the year and higher procedure volume growth from the prior quarter in the second and fourth quarters of the year. The timing of procedures and changes in procedure growth directly affect the timing of instruments and accessories and capital purchases by customers.
The above factors may contribute to substantial fluctuations in our quarterly operating results. Because of these fluctuations, it is possible that, in future periods, our operating results will fall below the expectations of securities analysts or investors. If that happens, the market price of our stock would likely decrease. These fluctuations, among other factors, also mean that our operating results in any particular period may not be relied upon as an indication of future performance.
THIRD PARTIES MAY OFFER TO SELL REMANUFACTURED OR UNAUTHORIZED INSTRUMENTS AND ACCESSORIES TO OUR CUSTOMERS OR PROVIDE UNAUTHORIZED SERVICE ON OUR SYSTEMS, WHICH COULD ADVERSELY IMPACT SAFETY, OUR FINANCIAL RESULTS, AND OUR REPUTATION.
A significant portion of our revenue is generated through our sales of instruments and accessories. Third parties have offered, and may continue to offer, customers counterfeit instruments and accessories and/or instruments and accessories that have been remanufactured and/or are unauthorized, including instruments that have been remanufactured to support the use of some of our limited-use instruments beyond their labeled useful life. As of the filing date, we are unaware that the FDA or any other regulatory agency has granted 510(k) or equivalent market authorization for the remanufacturing of any instruments for use with a da Vinci 5, da Vinci X, or da Vinci Xi surgical system, but we understand that the FDA has granted 510(k) clearance to two different companies for one remanufactured EndoWrist instrument each used with our da Vinci Si surgical system. Additionally, third parties have provided, and may continue to provide, unauthorized service and maintenance on our da Vinci surgical systems and Ion endoluminal system. While we generally do not approve the use by our customers of unauthorized and unapproved instruments and accessories that lack FDA clearance or other applicable regulatory approval or certification with our systems or the unauthorized service or maintenance on our systems, such activities could potentially result in reduced revenue, increased patient safety risks, and negative publicity for us if these products cause injuries and/or do not function as intended when used, any of which could have a material adverse effect on our business, financial condition, or results of operations. In addition, we may be subject to laws that regulate or attempt to regulate the manner in which third-party instruments and accessories or third-party service providers interact with our systems, and such laws could also negatively impact our business, financial condition, or results of operations.
OUR BUSINESS IS SUBJECT TO COMPLEX AND EVOLVING LAWS AND REGULATIONS REGARDING DATA PRIVACY, DATA PROTECTION, ARTIFICIAL INTELLIGENCE, AND RESPONSIBLE USE OF DATA.
There are numerous laws and regulations that require Intuitive to protect the personal data it generates, collects, shares, and processes on behalf of itself and/or its customers. In addition to U.S. federal and state privacy laws, there are various comprehensive privacy laws across the globe that we are or may become subject to and that impact our business whether related to customers, employees, products, clinical trials, recruitment, or product research and development. We may be subject to significant consequences, including penalties, fines, restrictions on processing personal information, and/or reputational harm for a data breach or failure to comply with such legal requirements.
For example, in the EU, the GDPR requires controllers and processors of data relating to an identifiable living individual or “personal data” to adhere to certain key principles whenever accessing or processing personal data. The EU Data Protection Authorities have been active in their commitment to enforcing the GDPR. The European Data Protection Board, as well as individual member states, continues to refine requirements under the GDPR resulting in increased obligations to demonstrate compliance through policies, procedures, training, transfer impact assessments, privacy notices, and audits. Among other requirements, the GDPR regulates transfers of personal data subject to the GDPR to third countries that have not been found to provide adequate protection to such personal data, including the United States, and the efficacy and longevity of current transfer mechanisms between the EEA and the United States remains uncertain. The GDPR provides that EEA member states may, in some circumstances, make their own laws that are more restrictive or prescriptive than GDPR, such as has occurred in France and Germany. Failure to comply with the requirements of the GDPR and the applicable EEA member state laws may result in significant fines, regulatory investigations, reputational damage, orders to cease/change our data processing activities, enforcement notices, assessment notices (for a compulsory audit), and/or civil claims (including class actions). Compliance with data protection obligations imposed by the GDPR and EEA member state laws may be onerous and adversely affect our business, financial condition, or results of operations.
We are subject to the privacy laws in our direct and indirect markets including, but not limited to, South Korea, Japan, Taiwan, India, Brazil, Canada, and the UK.
In the United States, the Health Insurance Portability and Accountability Act of 1996, as amended by the Health Information Technology for Economic and Clinical Health Act of 2009, and regulations implemented thereunder, or HIPAA, imposes privacy, security, and breach notification obligations on covered entities and their business associates to ensure the confidentiality, integrity, and availability of individually identifiable health information. Entities that are found to be in violation of HIPAA, as a result of a breach of unsecured protected health information, a complaint about privacy practices, or an audit by the U.S. Department of Health and Human Services (“HHS”), may be subject to significant civil, criminal, and administrative fines and penalties and/or additional reporting and oversight obligations if they are required to enter into a resolution agreement and corrective action plan with HHS through settlement agreements.
Further, in the U.S., when HIPAA does not apply, according to the Federal Trade Commission (the “FTC”), violating consumers’ privacy rights or failing to take appropriate steps to keep consumers’ personal information secure may constitute unfair and/or deceptive acts or practices in violation of Section 5(a) of the FTC Act. The FTC has the authority to initiate enforcement actions against entities that make deceptive statements about privacy and data sharing in privacy policies, fail to limit third-party use of personal health information, fail to implement policies to protect personal health information, or engage in other unfair practices that harm customers or that may violate Section 5(a) of the FTC Act. The FTC expects a company’s data security measures to be reasonable and appropriate in proportion to the sensitivity and volume of consumer information it holds, the size and complexity of its business, and the cost of available tools to improve security and reduce vulnerabilities. Additionally, federal and state consumer protection laws are increasingly being applied by the FTC and states’ attorneys general to regulate the collection, use, storage, and disclosure of personal information, through websites or otherwise, and to regulate the presentation of website content.
At the state level, multiple states have comprehensive consumer privacy laws enacted. Notably, the California Consumer Privacy Act, as amended by the California Privacy Rights Act (“CCPA”) gives California residents expanded rights to access, correct, and delete their personal information, opt out of certain personal information sharing, and receive detailed information about how their personal information is used. The CCPA allows for significant fines by the California attorney general as well as a private right of action from individuals in relation to certain security breaches. Similar laws have passed in other states and are continuing to be proposed at the state and federal level, reflecting the continuing trend toward more stringent privacy legislation in the U.S. These developments are increasing our compliance obligations and risk, including risks of regulatory fines, litigation, and associated reputational harm.
In China, we are also subject to various aspects of the country’s data compliance regime, including the Cybersecurity Law, the Data Security Law, and the Personal Information Protection Law (“PIPL”). In addition to national laws, regulatory departments, provincial and municipal governments, and Free Trade Zones are left to identify “important data,” the definitions of which may impact our reporting, data protection, and data transfer obligations. Draft guidelines related to medical device and equipment data from the State Administration for Market Regulation and other unpublished rules and guidelines from other regulatory departments may impact Onsite data collection and transfers. With the possibility of more stringent medical data transfer rules in China, customers’ appetite for our digital products including Onsite, Telepresence, and Case Insights may become impacted in the future.
Any failure, or perceived failure, by us to comply with or make effective modifications to our policies or to comply with any federal, state, or international privacy, data-retention, or data-protection-related laws, regulations, orders, or industry self-regulatory principles could result in proceedings or actions against us by governmental entities or others, a loss of customer confidence, damage to our brand and reputation, and a loss of customers, any of which could have an adverse effect on our business. In addition, various federal, state, and foreign legislative or regulatory bodies may enact new or additional laws and regulations concerning privacy, data-retention, and data-protection issues, including laws or regulations mandating disclosure to domestic or international law enforcement bodies, which could adversely impact our business or our reputation with customers. For example, some countries have adopted laws mandating that some personal information regarding customers in their country be maintained solely in their country. Having to maintain local data centers and redesign products, services, and business operations to limit personal information processing to within individual countries could increase our operating costs significantly.
The European Strategy for Data includes a collection of laws focused on ensuring fundamental principles (including doing business in an ethical way, respecting fundamental rights of individuals, not exploiting individuals, and transparency in collection and use of data) are promoted and adhered to in support of innovation for the benefit of the community. In particular, the AI Act, European Health Data Space, and Data Act and Data Governance Acts regulate personal and non-personal data as well as artificial intelligence. These laws are meant to be read and interpreted together (and in concert with the GDPR), ensuring that innovation respects individuals’ fundamental rights and that businesses act with integrity. The Data Act and European Health Data Space Act provide individual and organizational users of certain systems and devices the right to access a broad range of information not previously available and include, in some cases, rights to secondary uses of such data. These
obligations may be interpreted in ways that require us to modify our business practices and products to maintain compliance, potentially increasing costs and operational complexity.
Moreover, some of the AI features of our products involve, or may involve, the processing of personal data and may be subject to laws, policies, legal obligations, and codes of conduct related to privacy and data protection, each of which may be interpreted in ways that may affect the way in which we engage with machine learning and require us to make changes to our business practices and products to comply with such obligations. Our use of AI technologies may involve the storage and transmission of confidential or sensitive information, including personal information of employees, customers, and others, as well as protected health information of clients’ patients. In addition, due to the sensitive nature of the information, the security features of our computers and systems, network, and communications systems infrastructure are critical to the success of our business.
ONGOING AND FUTURE GLOBAL CONFLICTS COULD ADVERSELY AFFECT OUR BUSINESS, FINANCIAL CONDITION, OR RESULTS OF OPERATIONS.
In February 2022, armed conflict escalated between Russia and Ukraine. Russia’s military actions against Ukraine have resulted in substantial expansion of sanction programs imposed by the United States, the European Union, and other countries against Russia, Belarus, the Crimea Region of Ukraine, the so-called Donetsk People’s Republic, and the so-called Luhansk People’s Republic.
In response, the Russian authorities also imposed significant currency control measures, restrictions on transacting with non-Russian parties, export controls, and other economic and financial restrictions. Related sanctions, export controls, or other actions that may be initiated by countries including the U.S., the European Union, or Russia (e.g., potential cyberattacks, disruption of energy flows, etc.) could adversely affect the global economy, financial markets, energy supply and prices, certain critical materials and metals, supply chains, and global logistics and could adversely affect our business, financial condition and liquidity, or results of operations.
Additionally, in October 2023, armed conflict escalated between Israel and Hamas. Hostilities between Israel and Hamas could persist, escalate, or expand to involve more countries and regions in the Middle East. As a result of such disruptions, we may experience in the future extended lead times, delays in supplier deliveries, and increased freight costs. The risk of ongoing supply disruptions may further result in delayed deliveries of our products.
We are actively monitoring the situation in Ukraine and Russia and the conflict between Israel and Hamas and assessing the impacts on our business, including our business partners and customers. To date, we have not experienced any material interruptions in our infrastructure, supplies, technology systems, or networks needed to support our operations. We cannot predict the progress, outcome, or consequences of the military conflicts in Ukraine and the Israel-Gaza regions or their impacts on the global economy.
The length, impact, and outcome of ongoing military conflicts is highly unpredictable and could lead to significant market and other disruptions, including significant volatility in commodity prices and supply of energy resources, instability in financial markets, supply chain interruptions, political and social instability, trade disputes or trade barriers, changes in consumer or purchaser preferences, an increase in global shipping expenses, greater volatility in foreign exchange and interest rates, an increase in cyberattacks and espionage, and other unforeseen business disruptions. The extent and duration of the military action, sanctions, other consequences, such as restrictions on transactions or banning the export of energy products, including natural gas, and the resulting market disruptions could be significant and could potentially have substantial impact on the global economy and our business for an unknown period of time. Impacts to our business may include, but are not limited to, a reduction in procedures performed, reduced demand for our products, limitations on hospitals’ ability to spend on capital equipment and in healthcare spending in general, and supply disruption. Any such disruption may also magnify the impact of other risks described in this “Risk Factors” section.
INCORPORATING ARTIFICIAL INTELLIGENCE TECHNOLOGIES INTO OUR PRODUCTS, SERVICES, AND OPERATIONS MAY RESULT IN LEGAL AND REGULATORY RISKS OR HAVE OTHER ADVERSE CONSEQUENCES TO OUR BUSINESS, FINANCIAL CONDITION, OR RESULTS OF OPERATIONS.
Our current operations, products, and services use AI technologies, including machine learning. Examples of our current uses of machine learning include (i) using algorithms to process video and machine data to identify surgical activities and surgical indicators to support learning, teaching, and practice management, and (ii) using algorithms to support surgical planning and navigation. Future innovations in our products and services will likely continue to incorporate AI, and these applications may become important in our operations over time, for example, our development of machine learning-enabled medical devices (“MLMDs”).
As with many technological innovations, there are significant risks and challenges involved in maintaining and deploying these technologies, and there can be no assurance that the usage of such technologies will enhance our products or services or be beneficial to our business, including our efficiency or profitability.
Our ability to continue to maintain or use such technologies may be dependent on access to specific third-party software and infrastructure, such as processing hardware, and we cannot control the availability or pricing of such third-party software and infrastructure, especially in a highly competitive environment. Our products and services may not compete effectively with alternative products and services if we are not able to source and integrate the latest technologies into our products and services. In addition, several aspects of intellectual property protection in the field of AI are currently under development, and there is uncertainty and ongoing litigation in different jurisdictions as to the degree and extent of protection warranted for AI technologies and relevant system input and outputs. If we fail to obtain protection for the intellectual property rights concerning our AI technologies, or later have our intellectual property rights invalidated or otherwise diminished, our competitors may be able to take advantage of our research and development efforts to develop competing products, which could adversely affect our business, reputation, financial condition, or results of operations. Refer to our risk factor titled “If we are unable to fully protect and successfully defend our intellectual property from use by third parties, our ability to compete in the market may be harmed” for additional risks related to intellectual property.
The regulatory landscape surrounding AI is also evolving, and the use of machine learning technologies may expose us to an increased risk of regulatory enforcement and litigation. As the FDA and other regulatory authorities continue to develop and incorporate such principles into their regulation of machine learning medical devices, it is possible that medical products using AI and machine learning will become subject to significant additional oversight, including with respect to premarket review, modification, monitoring, maintenance, and device performance.
In the U.S., an executive order was issued in October 2023 on the Safe, Secure and Trustworthy Development and Use of AI, emphasizing the need for transparency, accountability, and fairness in the development and use of AI, including in the healthcare industry. The order seeks to balance fostering innovation with addressing risks associated with AI by providing eight guiding principles and priorities, such as ensuring that consumers are protected from fraud, discrimination, and privacy risks related to AI. The order also calls for future regulations from various agencies, such as the Department of Commerce (to draft guidance for detecting and authenticating AI content) and the Federal Trade Commission (to ensure fair competition and reduce consumer harm). In alignment with the order, other agencies have published guidance. Agencies such as the Department of Commerce and the Federal Trade Commission have also issued proposed rules governing the use and development of AI technologies. Further, legislation related to AI technologies has been introduced at the federal level and is advancing at the state level. For example, on March 13, 2024, Utah passed the Utah AI Policy Act, which took effect in May 2024, imposing certain disclosure requirements on the use of AI and, on May 17, 2024, Colorado enacted the Colorado AI Act, which will take effect in February 2026. Further, the California Privacy Protection Agency is currently in the process of finalizing regulations under the CCPA regarding the use of automated decision-making. Such additional regulations may impact our ability to develop, use, and commercialize AI technologies in the future.
Apart from the U.S., policymakers in key jurisdictions, such as the EU, are actively working on legislation and regulations to encourage the development and use of ethical and safe AI technologies. For example, on May 21, 2024, the European Union legislators approved the EU Artificial Intelligence Act (“EU AI Act”), which establishes a comprehensive, risk-based governance framework for AI in the EU market. The EU AI Act enters into force on August 2, 2024, and the majority of the substantive requirements will apply from August 2, 2026. The EU AI Act will apply to companies that develop, use, and/or provide AI in the EU and includes requirements around transparency, conformity assessments and monitoring, risk assessments, human oversight, security, accuracy, general purpose AI, and foundation models, and proposes fines for breach of up to 7% of worldwide annual turnover. In addition, on September 28, 2022, the European Commission proposed two Liability Directives seeking to establish a harmonized civil liability regime for AI in the EU in order to facilitate civil claims in respect of harm caused by AI and to include AI-enabled products within the scope of the EU’s existing strict product liability regime. These Liability Directives were published in the Official Journal of the EU on July 12, 2024, and entered into force on August 1, 2024. The EU AI Act and the Liability Directives will have a material impact on the way AI is regulated in the EU. Recent case law from the CJEU has also taken an expansive view of the scope of the GDPR’s requirements around automated decision-making and introduced uncertainty in the interpretation of these rules. The EU AI Act and developing interpretation and application of the GDPR in respect of automated decision-making, together with developing guidance and/or decisions in this area, may affect our use of AI technologies and our ability to provide, improve, or commercialize our business, require additional compliance measures and changes to our operations and processes, result in increased compliance costs and potential increases in civil claims against us, and could adversely affect our business, financial condition, or results of operations.
Other jurisdictions where we operate have already or are also expected to introduce guidelines and regulations around the use of AI within the next few years. The regulations may impose onerous obligations and may require us to rework or reevaluate improvements to be compliant, potentially increasing costs.
A breach or failure in our security measures could occur from a variety of circumstances and events, including third-party action, employee negligence or error, malfeasance, computer viruses, cyberattacks, or ransom-related attacks by computer hackers, failures during the process of upgrading or replacing software and databases, power outages, hardware failures, telecommunication failures, user errors, or catastrophic events, and any of the foregoing events could have a material adverse
effect on our business, financial condition, or results of operations. For more information on risks associated with the processing of confidential and sensitive information, including personal information, refer to our risk factor titled “Information technology system failures, cyberattacks, or deficiencies in our cybersecurity could harm our business, customer relations, financial condition, or results of operations.”
Though we have taken steps to be thoughtful in our development, training, and implementation of machine learning, including taking steps to comply with the laws and frameworks discussed above that are currently in effect, our machine learning-related processing could pose certain risks to our customers, including patients, clinicians, and healthcare institutions, and it is not guaranteed that regulators will agree with our approach to limiting these risks or to our compliance more generally. Risks can include, but are not limited to, the potential for errors or inaccuracies in the algorithms or models used by the MLMDs, the potential for bias or inaccuracies in the data used to train the MLMDs, the potential for improper processing of personal information that could lead to deprecation of our algorithms, and the potential for cybersecurity breaches that could compromise patient data or device functionality. Such risks could negatively affect the performance of our products, services, and business, as well as our reputation and the reputations of our customers, and we could incur liability through the violation of laws or contracts to which we are a party or civil claims.
DISRUPTIONS AT THE FDA AND OTHER GOVERNMENT AGENCIES OR NOTIFIED BODIES COULD HINDER THEIR ABILITY TO HIRE, RETAIN, OR DEPLOY PERSONNEL, OR OTHERWISE PREVENT PRODUCTS FROM BEING DEVELOPED, CLEARED, CERTIFIED, APPROVED, OR COMMERCIALIZED IN A TIMELY MANNER OR AT ALL, WHICH MAY ADVERSELY AFFECT OUR BUSINESS, FINANCIAL CONDITION, OR RESULTS OF OPERATIONS.
Hospitals, health systems, and physicians depend on a number of government agencies and services to effectively deliver healthcare to their patients. A prolonged government shutdown could impact inspections, regulatory review and certifications, grants, or approvals or could cause other situations that could impede their ability to effectively deliver healthcare, including attempts to reduce payments and other reimbursements to hospitals by federal healthcare programs. These situations could adversely affect our customers’ ability to perform procedures with our devices and/or their decisions to purchase additional products from us.
In addition, the ability of the FDA, foreign authorities, and notified bodies to review and clear, approve, or certify new products can be affected by a variety of factors, including government budget and funding levels, the ability to hire and retain key personnel and accept the payment of user fees, and statutory, regulatory, and policy changes. In addition, government funding of other government agencies that fund research and development activities is subject to the political process, which is inherently fluid and unpredictable. Disruptions at the FDA and other agencies or notified bodies, including a prolonged government shutdown, may cause significant regulatory delays and, therefore, delay our efforts to seek clearances, approvals, or certifications from the FDA, foreign authorities, and notified bodies and adversely affect business travel and the import and export of products, all of which could have a material adverse effect on our business, financial condition, or results of operations. For example, over the last several years, the U.S. government has shut down several times, and certain regulatory agencies, such as the FDA, have had to furlough critical FDA employees and stop critical activities.
If a prolonged government shutdown occurs, or if global health concerns prevent the FDA, other regulatory authorities, or notified bodies from conducting their regular inspections, reviews, or other regulatory activities, it could significantly impact the ability of the FDA, other regulatory authorities, or notified bodies to timely review and process our regulatory submissions, which could have a material adverse effect on our business. For example, in response to the COVID-19 pandemic that began in 2019, the FDA postponed most inspections of domestic and foreign manufacturing facilities at various points. Separately, in the EU, their designation process experienced considerable delays during the COVID-19 pandemic. In the EU, notified bodies must be officially designated to certify products and services in accordance with the EU Medical Devices Regulation. Despite the increase in designations, the current number of notified bodies designated under the EU Medical Devices Regulation remains significantly lower than the number of notified bodies designated under the previous regime. The current designated notified bodies are, therefore, facing a backlog of requests, and review times have lengthened. This situation could impact our ability to grow our business in the EU and EEA.
WE MAY INCUR LOSSES ASSOCIATED WITH CURRENCY FLUCTUATIONS AND MAY NOT BE ABLE TO EFFECTIVELY HEDGE OUR EXPOSURE.
Our operating results are subject to volatility due to fluctuations in foreign currency exchange rates. Our primary exposure to fluctuations in foreign currency exchange rates relates to revenue and operating expenses denominated in currencies other than the U.S. dollar. The weakening of foreign currencies relative to the U.S. dollar adversely affects our foreign currency-denominated revenue. Gross profit margins on foreign currency-denominated revenue could also be materially adversely affected by foreign currency exchange rate fluctuations, as we may not be able to raise local prices to fully offset the strengthening of the U.S. dollar. Conversely, the strengthening of foreign currencies relative to the U.S. dollar, while generally beneficial to our foreign currency-denominated revenue and earnings, may cause us to reduce pricing on our products in
markets that are not priced in U.S. dollars and may cause us to incur losses on our foreign currency hedging instruments, thereby limiting the benefit that strengthened foreign currencies could have on our results of operations.
We attempt to mitigate a portion of these risks through foreign currency hedging, based on our judgment of the appropriate trade-offs among risk, opportunity, and expense. Although we have established a hedging program to partially hedge our exposure to foreign currency exchange rate fluctuations, primarily related to transactions denominated in the Euro, the British Pound, the Japanese Yen, the Korean Won, the New Taiwan Dollar, and the Swiss Franc, and we regularly review our hedging program and make adjustments as necessary, our hedging activities may not offset all of the adverse financial impact caused by unfavorable movement in foreign currency exchange rates, which could materially adversely affect our financial condition or results of operations. See “Item 7A. Quantitative and Qualitative Disclosures About Market Risk” for additional discussion on the impact of foreign exchange risk.
IF WE DO NOT SUCCESSFULLY MANAGE OUR COLLABORATION, LICENSING, JOINT VENTURE, STRATEGIC ALLIANCE, OR PARTNERSHIP ARRANGEMENTS WITH THIRD PARTIES, WE MAY NOT REALIZE THE EXPECTED BENEFITS FROM SUCH ARRANGEMENTS, WHICH MAY HAVE A MATERIAL ADVERSE EFFECT ON OUR BUSINESS, FINANCIAL CONDITION, OR RESULTS OF OPERATIONS.
From time to time, we enter into collaborations, in-licensing arrangements, joint ventures, strategic alliances, or partnerships to complement or augment our research and development, product development, training, procedure development, marketing, and commercialization efforts. For example, in 2016, we entered into an agreement to form the Joint Venture. In 2019, the Joint Venture acquired certain assets related to the da Vinci distribution business of Chindex, a subsidiary of Shanghai Fosun Pharmaceutical (Group) Co. Ltd. (“Fosun Pharma”), following which the Joint Venture began direct distribution operations for da Vinci surgical system products and services in China. There can be no assurance that we and the Joint Venture can successfully complete development of robotic-assisted medical devices or that we and the Joint Venture will successfully commercialize such products. There can also be no assurance that the Joint Venture will not require additional contributions to fund its business, that the Joint Venture will remain profitable, or that the expected benefits of the acquisition of certain assets of Chindex will be realized.
Proposing, negotiating, and implementing collaborations, in-licensing agreements, joint ventures, strategic alliances, or partnerships may be a lengthy and complex process. In addition, other companies, including those with substantially greater financial, marketing, sales, technology, or other business resources, may compete with us for these opportunities or arrangements. As a result, we may not identify, secure, or complete any such arrangements in a timely manner, on a cost-effective basis, or on otherwise favorable terms, if it all. There can be no assurance that we will realize the expected benefits from these alliances. In addition, we may not be in a position to exercise sole decision-making authority regarding any collaboration or other arrangement, which could create the potential risk of creating impasses on decisions, and our alliances may have economic or business interests that are, or that may become, inconsistent with our interests. It is possible that conflicts may arise in these relationships, such as conflicts concerning the achievement of performance milestones or the interpretation of significant terms under any agreement, such as those related to financial obligations, termination rights, or the ownership or control of intellectual property developed during the collaboration. These alliances can be difficult to manage, given the potentially different interests of the parties involved, and we could suffer delays in product development or other operational difficulties.
These alliances may also involve significant costs and divert the focus and attention of our management and other key personnel. Any of these relationships may require us to incur non-recurring and other charges, increase our near- and long-term expenditures, or disrupt our ordinary business activities. Such arrangements may also expose us to numerous known and unknown risks, including unique risks with respect to the economic, political, and regulatory environment of any foreign entities with whom we partner, including Fosun Pharma. Any of the foregoing may have a material adverse effect on our business, financial condition, or results of operations.
IF WE FAIL TO SUCCESSFULLY ACQUIRE OR INTEGRATE NEW BUSINESSES, PRODUCTS, AND TECHNOLOGY, WE MAY NOT REALIZE EXPECTED BENEFITS, OR OUR BUSINESS MAY BE HARMED.
We need to grow our business in response to changing technologies, customer demands, and competitive pressures. In some circumstances, we may decide to grow our business through the acquisition of complementary businesses, products, or technologies rather than through internal development.
Identifying suitable acquisition candidates can be difficult, time-consuming, and costly, and we may not be able to identify appropriate candidates or successfully complete identified acquisitions. In addition, completing an acquisition can divert our management and key personnel from our business operations, which could harm our business and affect our financial results. Even if we complete an acquisition, we may not be able to successfully integrate newly acquired organizations, products, technologies, or employees into our operations or may not fully realize some of the expected synergies. An acquired company may have deficiencies in product quality, regulatory marketing authorizations or certifications, or intellectual property protections, which are not detected during due diligence activities or are unasserted at the time of acquisition. It may be
difficult, expensive, and time-consuming for us to re-establish market access, regulatory compliance, or cure such deficiencies in product quality or intellectual property protection in such cases, which may have a material adverse impact on our business, financial condition, or results of operations.
Integrating an acquisition can also be expensive and time-consuming and may strain our resources. In many instances, integrating a new business will also involve implementing or improving internal controls appropriate for a public company at a business that lacks them. In addition, we may be unable to retain the employees of acquired companies or the acquired company’s customers, suppliers, distributors, or other partners for a variety of reasons, including that these entities may be our competitors or may have close relationships with our competitors. Furthermore, acquired companies may have less mature or less sophisticated information technology systems, securities practices, or training, which may result in an increased risk of security and cybersecurity incidents when such companies are integrated. For example, in 2020, we acquired Orpheus Medical Ltd. and its wholly owned subsidiaries (“Orpheus Medical”) to deepen and expand our integrated informatics platform. The integration of this acquisition involved complex operations across different geographic locations and new products, distribution networks, and legal jurisdictions. Failure to successfully integrate our acquisitions may have a material adverse impact on our business, financial condition, or results of operations.
WE ARE EXPOSED TO CREDIT RISK AND FLUCTUATIONS IN THE MARKET VALUE OF OUR INVESTMENTS.
Our investment portfolio includes both domestic and international investments. The credit ratings and pricing of our investments can be negatively affected by liquidity concerns, credit deterioration, financial results, economic risk, political risk, or other factors. As a result, the value and liquidity of our cash equivalents and marketable securities could fluctuate substantially. Our other income and expense could also vary materially from expectations depending on gains or losses realized on the sale or exchange of investments, impairment charges resulting from revaluations of debt and equity securities and other investments, changes in interest rates, increases or decreases in cash balances, volatility in foreign exchange rates, and changes in the fair value of derivative instruments. Increased volatility in the financial markets and overall economic uncertainty could increase the risk that actual amounts realized on our investments may differ significantly from the fair values currently assigned to them.
The value of our investments may also decline due to instability in the global financial markets, which may reduce the liquidity of securities included in our portfolio. For example, the closure of SVB and other institutions swept into receivership and the appointment of the FDIC as receiver in 2023 created bank-specific and broader financial institution liquidity risk and concerns. We maintain the majority of our cash and cash equivalents in accounts with major U.S. and multi-national financial institutions, and our deposits exceed insured limits. Future adverse developments with respect to these financial institutions or the broader financial services industry may impair our ability to access capital needed to support near-term working capital needs, whether from our existing investment and deposit accounts and credit facilities or otherwise, and may lead to market-wide liquidity shortages and create additional market and economic uncertainty. Any decline in available funding or access to our cash and liquidity resources could also result in breaches of our financial and/or contractual obligations.
Our two Intuitive Ventures funds invest in early-stage companies, which involve substantial risks and uncertainties. These risks and uncertainties include, among other things, uncertainties inherent in research and development; uncertainties regarding the ability of Intuitive Ventures to identify investment candidates; uncertainties regarding the success of Intuitive Ventures’ investments; uncertainties and variables inherent in the operating and financial performance in investments made, including, among other things, competitive developments and general economic, political, business, industry, regulatory and market conditions; future exchange and interest rates; and changes in tax and other laws, regulations, rates and policies.
There can be no assurance that we will realize a positive return on our strategic investments. Further, if we invest in privately held companies, valuations of such companies are inherently complex due to the lack of readily available market data. If we determine that our investments in privately held companies have experienced a decline in value, we may be required to record impairments, which could be material and have an adverse effect on our results of operations.
While we have not realized any significant losses on our cash equivalents, marketable securities, or other investments, future fluctuations in their value could have a material adverse impact on our business, financial condition, or results of operations.
CHANGES IN OUR EFFECTIVE TAX RATE MAY ADVERSELY AFFECT OUR BUSINESS, FINANCIAL CONDITION, OR RESULTS OF OPERATIONS.
We are subject to taxes in the U.S. and other jurisdictions around the world. Tax rates in these jurisdictions may be subject to significant change due to economic and/or political conditions. A number of other factors may also impact our future effective tax rate, including:
•the jurisdictions in which profits are determined to be earned and taxed;
•the resolution of issues arising from tax audits with various tax authorities;
•changes in the valuation of our deferred tax assets and liabilities;
•increases in expenses not deductible for tax purposes, including write-offs of acquired intangibles and impairment of goodwill in connection with acquisitions;
•changes in the availability of tax credits, tax holidays, and tax deductions;
•changes in share-based compensation;
•changes in tax laws or the interpretation of such tax laws; and
•changes in generally accepted accounting principles.
We are unable to predict what changes to the tax laws of the U.S. and other jurisdictions may be enacted in the future or what effect such changes would have on our business, including tax law changes resulting from the base erosion and profit shifting (“BEPS”) project and the Two Pillar Solution undertaken by the Organization for Economic Co-operation and Development (“OECD”), which includes a global minimum tax rate. Various countries have adopted, or have announced plans to adopt, new tax laws to align with the global minimum tax. These changes could increase tax uncertainty and may adversely impact our provision for income taxes. Any significant increase in our future effective tax rate could have a material adverse impact on our business, financial condition, or results of operations.
WE ARE SUBJECT TO RISKS ASSOCIATED WITH REAL ESTATE CONSTRUCTION AND DEVELOPMENT.
The development of our facilities is subject to risks relating to our ability to complete our projects on schedule or within budget. Factors that may result in a development project being prevented or delayed from completion or exceeding budget include, but are not limited to (i) construction delays due to labor challenges, poor weather, defects, or cost overruns, which may increase project development costs; (ii) cost escalations associated with materials, including changes in availability, proximity, and cost of materials, such as steel, cement, concrete, aggregates, oil, fuel, and other construction materials, including potential risks arising from geopolitical conflicts, changes in U.S. trade policies and retaliatory responses from other countries, changes in foreign exchange rates, as well as cost escalations associated with subcontractors and labor; (iii) the discovery of hazardous or toxic substances, or other environmental, culturally-sensitive, or related issues; (iv) an inability to obtain, or a significant delay in obtaining, zoning, construction, occupancy, and other required governmental permits and authorizations; (v) difficulty in complying with local, city, county, and state rules and regulations regarding permitting, zoning, subdivision, utilities, and water quality, as well as federal rules and regulations regarding air and water quality and protection of endangered species and their habitats; (vi) insufficient infrastructure (e.g., water, sewer, and roads) capacity or availability to serve the needs of our projects; (vii) failure to achieve or sustain anticipated occupancy levels; (viii) condemnation of all or parts of development or operating properties, which could adversely affect the value or viability of such projects; and (ix) natural disasters and other extreme weather conditions, including, but not limited to, hurricanes, tornadoes, earthquakes, wildfires, or flooding.
CLIMATE CHANGE, NATURAL DISASTERS, OR OTHER EVENTS BEYOND OUR CONTROL COULD DISRUPT OUR BUSINESS, FINANCIAL CONDITION, OR RESULTS OF OPERATIONS.
Natural disasters, terrorist activities, and other events beyond our control including, but not limited to, internet security threats and violence motivated by political or social causes, could adversely affect our business, financial condition, or results of operations. Moreover, global climate change could result in certain types of natural disasters occurring more frequently or with more intense effects. The impacts of climate change may include physical risks (such as frequency and severity of extreme weather conditions), social and human effects (such as population dislocations or harm to health and well-being), compliance costs, transition risks, shifts in market trends, and other adverse effects. Such impacts may disrupt parties in our supply chain, our customers, and our operations. For example, the March 2011 earthquake and tsunami in Japan, and their aftermath, created economic uncertainty and disrupted economic activities in Japan, including a reduction in hospital spending. More recently in September and October 2024, Hurricane Helene and Hurricane Milton caused economic uncertainty and business disruptions in the Southeast region of the U.S.
Physical risks associated with climate change are subject to increasing societal, regulatory, and political focus in the U.S., the EU, and globally. Shifts in weather patterns caused by climate change are expected to increase the frequency, severity, or duration of certain adverse weather conditions and natural disasters, such as hurricanes, tornadoes, earthquakes, wildfires, droughts, extreme temperatures, or flooding, which could cause more significant business and supply chain interruptions, damage to our products and facilities as well as the infrastructure of hospitals, medical care facilities, and other customers, reduced workforce availability, increased costs or reduced supply of raw materials and components, increased liabilities, and decreased revenues than what we have experienced in the past from such events. The geographic location of our California headquarters and many of our manufacturing facilities, as well as the facilities of certain of our key suppliers and service providers, subject them to earthquake, drought, and wildfire risks. If a major earthquake, wildfire, or other natural disaster were to damage our facilities or the facilities of our suppliers and service providers, or impact the ability of our employees or the employees of our suppliers and service providers to travel to their workplace, we may experience potential impacts ranging
from production and shipping delays to lost revenues and increased costs, which could harm our business. Moreover, periods with increased drought and annual periods of wildfire danger may increase the probability of planned power outages in the communities where we work and live. For example, in October 2019, Pacific Gas and Electric, the public electric utility in the Northern California region, used planned power outages to avoid and contain wildfires sparked during strong wind events by downed power lines or equipment failure. If prolonged or frequent, such planned blackouts could impact our operations and the operations of our suppliers and service providers located in the Northern California region. While this danger has a low assessed risk of disrupting normal business operations, it has a potential impact on our employees’ abilities to commute to work or to work from home and stay connected effectively. We do not have multiple-site capacity for all of our operations in the event of a business disruption, and we are predominantly self-insured and may not be able to sufficiently cover losses or additional expenses that we may sustain. Furthermore, the impacts of global climate change on water resources may result in water scarcity, which could impact our ability to access sufficient quantities of water in certain locations and result in increased costs.
In addition, the increasing concern over climate change has resulted, and may continue to result, in more legal and regulatory requirements designed to mitigate the effects of climate change on the environment, including regulating greenhouse gas emissions, alternative energy policies, and sustainability initiatives. If such laws or regulations are more stringent than current legal or regulatory requirements, we may experience increased compliance burdens and costs to meet our regulatory obligations. For example, under the EU’s Corporate Sustainability Reporting Directive (“CSRD”), we will be required to make certain disclosures in 2026 relating to our ESG impacts, risks, and opportunities for 2025, which may require that we change the processes by which we currently collect ESG-related data about our business. Furthermore, as ESG-related laws continue to evolve in scope and complexity, we may need to change the processes by which we currently operate our business and manage our supply chain to comply with these evolving legal and regulatory requirements, which, in turn, may have a material adverse effect on our business, financial condition, or results of operations. For instance, changes in requirements may adversely affect raw material sourcing from suppliers, our manufacturing operations and those of our suppliers, and the distribution of our products. Further, there may be increasing scrutiny and changing expectations from the market and other stakeholders with respect to ESG practices. Any such regulatory changes or increased market expectations could also have a significant effect on our operating and financial decisions, including those involving capital expenditures to reduce emissions and comply with other regulatory requirements or stakeholder expectations. If we fail to comply with certain ESG-related laws, our products become non-compliant with such laws, or we fail to meet the expectations of our stakeholders on ESG-related matters, it could result in a loss of market access or a decline in our success in competitive bidding or public tender processes, and we could incur costs or face other sanctions, such as restrictions on our products entering certain jurisdictions, fines, and/or civil or criminal sanctions.
CONSOLIDATION IN THE HEALTHCARE INDUSTRY COULD HAVE AN ADVERSE EFFECT ON OUR BUSINESS, FINANCIAL CONDITION, OR RESULTS OF OPERATIONS.
The healthcare industry has been consolidating, and organizations continue to consolidate purchasing decisions for many of our healthcare provider customers. Numerous initiatives and reforms by legislators, regulators, and third-party payers to curb the rising cost of healthcare have catalyzed a consolidation of aggregate purchasing power within the markets in which we sell our products. As the healthcare industry consolidates, competition to provide products and services is expected to continue to intensify, resulting in pricing pressures and decreased average selling prices. In addition, for smaller hospitals or groups that do not consolidate with larger networks, these entities may face increasing cost and/or competitive pressures, which could impact their ability to purchase additional products and services from us or make contractual payments over time. We expect that market demand, government regulation, third-party payor coverage and reimbursement policies, government contracting requirements, new entrants, technology, and societal pressures will continue to change the worldwide healthcare industry, resulting in further consolidation, which may exert further downward pressure on prices of our products and services and may have a material adverse impact on our business, financial condition, or results of operations.
WE USE ESTIMATES, MAKE JUDGMENTS, AND APPLY CERTAIN METHODS IN DETERMINING OUR FINANCIAL RESULTS AND IN MEASURING THE PROGRESS OF OUR BUSINESS. AS THESE ESTIMATES, JUDGMENTS, AND METHODS CHANGE, OUR RESULTS OF OPERATIONS AND OUR ASSESSMENT OF THE PROGRESS OF OUR BUSINESS COULD VARY.
The methods, estimates, and judgments we use in applying our accounting policies have a significant impact on our results of operations. Such methods, estimates, and judgments are, by their nature, subject to substantial risks, uncertainties, and assumptions, and factors may arise over time that may lead us to change our methods, estimates, and judgments. Changes in any of our assumptions may adversely affect our reported financial results.
We utilize methods for determining surgical market sizes, the number and type (cancerous or benign) of certain procedures performed, and the installed base of our systems that involve estimates and judgments, which are, by their nature, subject to substantial risks, uncertainties, and assumptions. Our estimates of surgical market sizes, the number and type of procedures performed, or the installed base of our systems do not have an impact on our results of operations but are used to estimate the
progress of our business. Estimates and judgments for determining surgical market sizes, the number and type of procedures, and the installed base of our systems and the accuracy of these estimates may be impacted over time with changes in treatment modalities, hospital reporting behavior, system internet connectivity, distributor reporting behavior, increases in procedures per field employee, and other factors. In addition, from time to time, we may change the method for determining market sizes, the number and type of procedures, and the installed base of our systems, causing variation in our reporting.
RISKS RELATING TO OUR REGULATORY ENVIRONMENT
COMPLYING WITH FDA AND FOREIGN REGULATIONS IS A COMPLEX PROCESS, AND OUR FAILURE TO FULLY COMPLY COULD SUBJECT US TO SIGNIFICANT ENFORCEMENT ACTIONS.
Because our products are commercially distributed, numerous quality and post-market regulatory requirements apply, including the following:
•continued compliance with the FDA’s QSR, which requires manufacturers to follow design, testing, control, documentation, and other quality assurance procedures during the development and manufacturing process;
•labeling regulations, including the FDA’s general prohibition against false or misleading statements in the labeling or promotion of products for unapproved or “off-label” uses;
•stringent complaint reporting and Medical Device Reporting regulations, which require that manufacturers keep detailed records of investigations or complaints against their devices and report to the FDA if their device may have caused or contributed to a death or serious injury or malfunctioned in a way that would likely cause or contribute to a death or serious injury if it were to recur;
•adequate use of the corrective and preventive actions process to identify and correct or prevent significant, systemic failures of products or processes or in trends that suggest the same; and
•the reporting of corrections, recalls, and removals, which requires that manufacturers report to the FDA recalls and field corrective actions taken to reduce a risk to health or to remedy a violation of the FFDCA that may pose a risk to health.
We are subject to inspection and marketing surveillance by the FDA to determine our compliance with regulatory requirements. If the FDA finds that we have failed to comply, it can institute a wide variety of enforcement actions, ranging from inspectional observations (as set forth on FDA Form-483) to a public Warning Letter to more severe civil and criminal sanctions, including the seizure of our products and equipment or ban on the import or export of our products. The FDA has, in the past, issued and could, in the future, issue Warning Letters or other adverse communications to us. If we fail to satisfy or remediate the matters discussed in any such Warning Letters or communications, the FDA could take further enforcement actions, including prohibiting the sale or marketing of the affected product. Our failure to comply with applicable requirements could lead to an enforcement action that may have an adverse effect on our financial condition or results of operations. The receipt of a Warning Letter could place certain limits on the ability to obtain FDA-issued Certificates to Foreign Government (“CFGs”) used for new and re-registration of products in certain other countries.
The FDA also strictly regulates labeling, advertising, promotion, and other activities relating to the marketing of our products. Medical devices may be promoted only for their cleared or approved indications and in accordance with the provisions of the cleared or approved label. It is possible that federal or state enforcement authorities might take action if they consider our promotional or training materials to constitute promotion of an unapproved use, which could result in significant fines or penalties under a variety of statutory authorities, including under the FFDCA, as well as laws prohibiting false claims for reimbursement.
In addition, any modification or change of medical devices cleared for the market requires the manufacturer to make a determination whether the change is significant enough to require new 510(k) clearance. We have created labeling, advertising, and user training for the da Vinci surgical systems to describe specific surgical procedures that we believe are fully within the scope of our existing 510(k) indications for use stated in our 510(k) clearances. Although we have relied on expert in-house and external staff, consultants, and advisors we cannot provide assurance that the FDA would agree that all such specific procedures are within the scope of the existing general clearance. If the FDA or any comparable regulatory authority determines that our promotion of our products for any such procedures represents promotion of an off-label use, the FDA or such regulator could request that we modify our labeling or promotional materials, or otherwise subject us to regulatory or enforcement actions, including warning letters, untitled letters, injunctions, seizures, civil fines, or criminal penalties. In addition, from time to time, we modify our products, including the hardware and software in the da Vinci surgical systems, after we obtain 510(k) clearance from the FDA for the devices in ways that we do not believe require new 510(k) clearance. We cannot provide assurance that the FDA would agree in all cases with our determinations not to seek new 510(k) clearance for any of these changes. If the FDA disagrees with our assessments that a new 510(k) clearance was not required prior to commercializing the devices with these changes or modifications, then the FDA could impose enforcement sanctions, require the recall of any modified products,
and/or require us to obtain 510(k) clearance or other FDA marketing authorization before permitting the commercialization of any modified products, and we may be unable to obtain any such marketing authorizations in a timely manner or at all.
We have a wholly owned manufacturing facility located in Mexicali, Mexico, which manufactures reusable and disposable surgical instruments. This facility is registered with the FDA as well as with Mexican authorities. The facility is operated under U.S. and international quality system regulations, including those applicable to Canada, the EU, Brazil, and Japan, among others. This facility has an FDA Establishment Registration but has not been inspected by the FDA to date. If the FDA were to identify non-conformances in our product documentation or quality system compliance, it could hold indefinitely the importation of instruments at the border, which would deprive us of the ability to sell and supply the majority of our customers until the FDA requirements have been satisfied. Similar supply disruptions could occur if key suppliers outside of the U.S. were to encounter non-conformances with their documentation or quality system compliance.
OUR PRODUCTS ARE SUBJECT TO A LENGTHY AND UNCERTAIN DOMESTIC REGULATORY REVIEW PROCESS. IF WE DO NOT OBTAIN AND MAINTAIN THE NECESSARY DOMESTIC REGULATORY AUTHORIZATIONS, WE WILL NOT BE ABLE TO SELL OUR PRODUCTS IN THE U.S.
Our products and operations are subject to extensive regulation in the U.S. by the FDA. The FDA regulates the development and clinical testing, manufacturing, labeling, storage, record keeping, promotion, sales, distribution, and post-market support and medical device reporting in the U.S. to ensure that medical products distributed domestically are safe and effective for their intended uses. In order for us to market products for use in the U.S., we generally must first obtain clearance from the FDA pursuant to Section 510(k) of the FFDCA or approval of the product through the PMA pathway. Clearance under Section 510(k) requires demonstration that a new device is substantially equivalent to another device with 510(k) clearance or grandfathered (“pre-amendment”) status and for which a PMA is not required. If we develop products in the future that are not considered to be substantially equivalent to a device with 510(k) clearance or grandfathered status, we may be required to obtain marketing authorization through the more burdensome PMA process or alternatively through the de novo classification process, which is a path to market for novel devices that are low to moderate risk and for which a predicate device is not available.
Although our current products have generally been cleared through the 510(k) clearance process, we may decide to seek approval for future products through a PMA submission or through the de novo classification process. A PMA is typically a much more complex, lengthy, and burdensome application than a 510(k) and generally takes from one to three years, or even longer, from the time the application is submitted to the FDA. In the PMA process, the FDA must determine that a proposed device is safe and effective for its intended use based, in part, on extensive data, including, but not limited to, technical, preclinical, clinical study, manufacturing, and labeling data. The PMA process is typically required for devices that are deemed to pose the greatest risk, such as life-sustaining, life-supporting, or implantable devices. In the de novo classification process, a manufacturer whose novel device under the FFDCA would otherwise be automatically classified as Class III and require the submission and approval of a PMA prior to marketing is able to request down-classification of the device to Class I or Class II on the basis that the device presents a low or moderate risk.
Similarly, although the FDA has a statutory deadline of 120 days to review a de novo submission, in practice, the review may take much longer. In addition, a PMA application or de novo classification requests generally requesre the performance of one or more clinical studies. In some cases, such studies may also be required to support a 510(k) application, and any requirements to conduct clinical studies beyond those we anticipate for our current or future products could add significantly to our costs and have a material adverse effect on our business.
The FDA may not act favorably or quickly in its review of any marketing application submissions, or we may encounter significant difficulties and costs in our efforts to obtain marketing authorization from the FDA, either of which could delay or preclude the sale of new products in the U.S. In addition, the FDA may place significant limitations upon the intended use of our products as a condition of granting marketing authorization. Product applications can also be denied or withdrawn due to failure to comply with regulatory requirements or the occurrence of unforeseen problems following marketing authorization. Any delays or failure to obtain FDA marketing authorization for new or modified products that we develop, any limitations imposed by the FDA on new product use, or the costs of obtaining FDA clearance or approvals could have a material adverse effect on our business, financial condition, or results of operations.
In addition, the FDA or other regulatory agencies may change their policies, adopt additional regulations, revise existing regulations, or take other actions that may prevent or delay approval or clearance of our products under development or impact our ability to modify our currently approved or cleared products on a timely basis. We may be found non-compliant as a result of future changes in, or interpretations of, regulations by the FDA or other regulatory agencies. For example, in February 2024, the FDA issued a final rule to amend and replace the QSR, which sets forth the FDA’s current good manufacturing practice requirements for medical devices, to align more closely with the International Organization for Standardization (“ISO”) standards. Specifically, this final rule, which the FDA expects to go into effect on February 2, 2026, establishes the “Quality Management System Regulation” (“QMSR”), which among other things, incorporates by reference the quality management
system requirements of ISO 13485:2016. Although the FDA has stated that the standards contained in ISO 13485:216 are substantially similar to those set forth in the QSR, it is unclear the extent to which this final rule, once effective, could impose additional or different regulatory requirements on us that could increase the costs of compliance or otherwise negatively affect our business. If we are unable to comply with QMSR, once effective, or with any other changes in the laws or regulations enforced by FDA or comparable regulatory authorities, we may be subject to enforcement action, which could have an adverse effect on our business, financial condition, or results of operations.
Additionally, in September 2019, the FDA issued revised guidance describing an optional “safety and performance based” premarket review pathway for manufacturers of “certain, well-understood device types” to demonstrate substantial equivalence under the 510(k) clearance pathway by showing that such device meets objective safety and performance criteria established by the FDA, thereby obviating the need for manufacturers to compare the safety and performance of their medical devices to specific predicate devices in the clearance process. The FDA maintains a list of device types appropriate for the “safety and performance based” pathway and continues to develop product-specific guidance documents that identify the performance criteria for each such device type, as well as the recommended testing methods, where feasible. The FDA may establish performance criteria for classes of devices for which we or our competitors seek or currently have received clearance, and it is unclear the extent to which such performance standards, if established, could impact our ability to obtain new 510(k) clearances or otherwise create competition that may negatively affect our business.
In order to conduct a clinical investigation involving human subjects for the purpose of demonstrating the safety and effectiveness of a medical device, a company must, among other things, apply for and obtain IRB approval of the proposed investigation. In addition, if the clinical study involves a “significant risk” (as defined by the FDA) to human health, the sponsor of the investigation must also submit and obtain FDA approval of an IDE application. Many of our products to date have been or would be considered significant risk devices requiring IDE approval prior to investigational use. We may not be able to obtain FDA and/or IRB approval to undertake clinical trials in the U.S. for any new devices that we intend to market in the U.S. in the future.
Even if we obtain such approvals, we may not be able to conduct studies that comply with the IDE and other regulations governing clinical investigations or the data from any such trials may not support clearance or approval of the investigational device. Clinical testing is difficult to design and implement, can take many years, can be expensive, and carries uncertain outcomes and, if we fail to complete our planned or ongoing clinical trials or if such clinical trials produce negative or inconclusive results, we may be delayed or prevented from obtaining regulatory clearances or approvals to commercialize our products for new or expanded indications. Additionally, we may experience delays in our ongoing clinical trials for any number of reasons, which could adversely affect the costs, timing, or successful completion of our clinical trials. If we fail to complete our planned and ongoing clinical trials or if such clinical trials produce negative or inconclusive results, we may be delayed or prevented from obtaining regulatory clearances or approvals to commercialize our products for new or expanded indications, which may limit the market for our products.
Certainty that clinical trials will meet desired endpoints, produce meaningful or useful data, and be free of unexpected adverse effects or that the FDA will accept the validity of foreign clinical study data cannot be assured, and such uncertainty could preclude or delay market clearance or authorizations resulting in significant financial costs and reduced revenue. Failure to obtain such approvals or to comply with such regulations could have a material adverse effect on our business, financial condition, or results of operations.
OUR PRODUCTS MAY CAUSE OR CONTRIBUTE TO ADVERSE MEDICAL EVENTS OR BE SUBJECT TO FAILURES OR MALFUNCTIONS THAT WE ARE REQUIRED TO REPORT TO THE FDA AND FOREIGN REGULATORY AUTHORITIES AND, IF WE FAIL TO DO SO, WE WOULD BE SUBJECT TO SANCTIONS THAT COULD HARM OUR REPUTATION, BUSINESS, FINANCIAL CONDITION, OR RESULTS OF OPERATIONS.
We are subject to the FDA’s medical device reporting regulations and similar foreign regulations, which require us to report to the FDA and foreign regulatory authorities when we receive or become aware of information that reasonably suggests that one or more of our products may have caused or contributed to a death or serious injury or malfunctioned in a way that, if the malfunction were to recur, it could cause or contribute to a death or serious injury. The timing of our obligation to report is triggered by the date we become aware of the adverse event as well as the nature of the event. We may fail to report adverse events of which we become aware within the prescribed time frame. We may also fail to recognize that we have become aware of a reportable adverse event, especially if it is not reported to us as an adverse event or if it is an adverse event that is unexpected or removed in time from the use of the product. If we fail to comply with our reporting obligations, the FDA or foreign regulatory authorities could take action, including warning letters, untitled letters, administrative actions, criminal prosecution, imposition of civil monetary penalties, revocation of our device clearance, approval, or certification, seizure of our products or delay in clearance, approval, or certification of future products.
The FDA and foreign regulatory bodies have the authority to require the recall of commercialized products in the event of material deficiencies or defects in the design or manufacture of a product or in the event that a product poses an unacceptable risk to health. The FDA’s authority to require a recall must be based on a finding that there is reasonable probability that the device could cause serious injury or death. We may also choose to voluntarily recall a product if any material deficiency is found. A government‑mandated or voluntary recall by us could occur as a result of an unacceptable risk to health, component failures, malfunctions, manufacturing defects, labeling or design deficiencies, packaging defects, or other deficiencies or failures to comply with applicable regulations. Product defects or other errors may occur in the future.
Depending on the corrective action we take to redress a product’s deficiencies or defects, the FDA or foreign regulatory authorities may require, or we may decide, that we will need to obtain new clearances, approvals, or certifications for the device before we may market or distribute the corrected device. Seeking such clearances, approvals, or certifications may delay our ability to replace the recalled devices in a timely manner. Moreover, if we do not adequately address problems associated with our devices, we may face additional regulatory enforcement actions, including FDA or foreign regulatory authorities warning letters, product seizure, injunctions, administrative penalties, or civil or criminal fines.
Companies are required to maintain certain records of recalls and corrections, even if they are not reportable to the FDA or foreign regulatory authorities. We may initiate voluntary withdrawals or corrections for our products in the future that we determine do not require notification of the FDA or foreign regulatory authorities. If the FDA or foreign regulatory authorities disagree with our determinations, it could require us to report those actions as recalls, and we may be subject to enforcement actions. A future recall announcement could harm our reputation with customers, potentially lead to product liability claims against us, and negatively affect our sales. Any corrective action, whether voluntary or involuntary, as well as defending ourselves in a lawsuit, would require the dedication of our time and capital, distract management from operating our business, and may harm our reputation, financial condition, or results of operations.
IF OUR MANUFACTURING FACILITIES DO NOT CONTINUE TO MEET FEDERAL, STATE, OR OTHER MANUFACTURING REGULATIONS AND STANDARDS, WE MAY BE REQUIRED TO TEMPORARILY CEASE ALL OR PART OF OUR MANUFACTURING OPERATIONS, IMPORT/EXPORT OF OUR PRODUCTS, AND/OR RECALL SOME PRODUCTS, WHICH COULD RESULT IN SIGNIFICANT PRODUCT DELIVERY DELAYS AND LOST REVENUE.
Our manufacturing facilities are subject to periodic inspection by regulatory authorities and audit by notified bodies, and our operations will continue to be regulated and inspected by the FDA and other regulatory agencies and notified bodies for compliance with Good Manufacturing Practice requirements contained in the QSR and other regulatory requirements. We are also required to comply with ISO quality system standards as well as EU legislation and norms in order to produce products for sale in the EU. In addition, many countries, such as Canada and Japan, have very specific additional regulatory requirements for quality assurance and manufacturing. If we fail to continue to comply with Good Manufacturing Practice requirements, as well as ISO or other regulatory standards, we may be required to cease all or part of our operations until we comply with these regulations.
We continue to be subject to FDA and certain other inspections by other regulatory authorities and notified bodies at any time. Maintaining such compliance is difficult and costly. We cannot be certain that our facilities will be found to comply with Good Manufacturing Practice requirements or ISO standards and other regulatory requirements in future inspections and audits by regulatory authorities and notified bodies.
We are currently participating in the Medical Device Single Audit Program (“MDSAP”), which allows an MDSAP-recognized auditing organization to conduct a single regulatory audit of a medical device manufacturer that evaluates our quality system to assess compliance with the requirements of multiple regulatory jurisdictions, including the U.S., Japan, Brazil, Australia, and Canada. The information collected in an MDSAP audit is shared and reviewed amongst all the regulatory authorities participating in the MDSAP, who may or may not determine that additional information or auditing is required.
Our Sunnyvale, California facility is licensed by the State of California to manufacture medical devices. We have been subject to periodic inspections by the California Department of Health Services Food and Drug Branch and, if we are unable to maintain this license following any future inspections, we will be unable to manufacture or ship some products, which would have a material adverse effect on our results of operations. In addition, both our Sunnyvale, California and Mexicali, Mexico facilities are subject to periodic inspections by other regulatory bodies, including third-party auditors on behalf of national regulatory authorities. Compliance with multiple regulatory standards is complex, difficult, and costly to maintain, and material deficiencies could result in significant limitations on our ability to manufacture, transport, and sell our products in one or more countries.
OUR PRODUCTS ARE SUBJECT TO INTERNATIONAL REGULATORY PROCESSES AND APPROVAL OR CERTIFICATION REQUIREMENTS. IF WE DO NOT OBTAIN AND MAINTAIN THE NECESSARY REGULATORY REQUIREMENTS, WE WILL NOT BE ABLE TO SELL OUR PRODUCTS IN OTHER COUNTRIES.
To be able to sell our products in other countries, we must obtain regulatory approvals or certifications and comply with the regulations of those countries, which may differ substantially from those of the U.S. These regulations, including the requirements for approvals or certifications and the time required for regulatory review, vary from country to country. Obtaining and maintaining foreign regulatory approvals or certifications is complex, and the time to obtain clearances or certifications in other countries varies; therefore, we cannot be certain that we will receive regulatory approvals or certifications in any other country in which we plan to market our products or obtain such approvals or certifications on a favorable schedule. If we fail to obtain or maintain regulatory approval or certification in any other country in which we plan to market our products, our ability to generate revenue will be harmed. In particular, if the FDA refuses to provide CFGs, our ability to register products or renew such registrations may be delayed or denied.
For instance, one of the most significant changes in the regulatory landscape is in the EU; more specifically, the regulation of medical devices has evolved and may be subject to further developments in 2025. The EU Medical Devices Regulation, which repealed and replaced the EU Medical Devices Directive, became applicable on May 26, 2021. In accordance with transitional provisions, both (i) devices lawfully placed on the market pursuant to the EU Medical Devices Directive prior to May 26, 2021, and (ii) legacy devices lawfully placed on the EU market from May 26, 2021, in accordance with the EU Medical Devices Regulation transitional provisions may generally continue to be made available on the market or put into service until December 31, 2028 (at the very latest and depending on the product risk classification) per the EU Medical Devices Regulation extended transitional provisions, provided that the requirements of the transitional provisions are fulfilled. However, since May 26, 2021, manufacturers must already comply with a number of new, or reinforced, requirements set forth in the EU Medical Devices Regulation, including registration of economic operators and of devices control plan, Periodic Safety Update Report (“PSUR”), notify body periodic vigilance report, post-market surveillance, clinical periodic review report, and vigilance requirements, such as the Post Market Clinical Follow-Up (“PMCF”) or Clinical Evaluation Plan (“CEP”).
Subject to the transitional provisions, in order to sell our products in EU member states, our products must comply with the general safety and performance requirements of the EU Medical Devices Regulation. Compliance with these requirements is a prerequisite to be able to affix the CE mark to our products, without which they cannot be sold or marketed in the EU. All medical devices placed on the market in the EU must meet the general safety and performance requirements laid down in Annex I to the EU Medical Devices Regulation, including the requirement that a medical device must be designed and manufactured in such a way that, during normal conditions of use, it is suitable for its intended purpose. It is the responsibility of the (manufacturer) Person Responsible for Regulatory Compliance (“PRRC”) to ensure such requirements are fulfilled and in place in the company. Medical devices must be safe and effective and must not compromise the clinical condition or safety of patients or the safety and health of users and, where applicable, other persons, provided that any risks that may be associated with their use constitute acceptable risks when weighed against the benefits to the patient and are compatible with a high level of protection of health and safety, taking into account the generally acknowledged state of the art. To demonstrate compliance with the general safety and performance requirements, we must undergo a conformity assessment procedure, which varies according to the type of medical device and its (risk) classification and may include a technical documentation assessment and an onsite audit. Except for low-risk medical devices (Class I), where the manufacturer can self-assess the conformity of its products with the general safety and performance requirements (except for any parts that relate to sterility, metrology, or reuse aspects), a conformity assessment procedure requires the intervention of a notified body. The notified body would typically audit and examine the technical file and the quality system for the manufacture, design, and final inspection of our devices. If satisfied that the relevant product conforms to the relevant general safety and performance requirements and we have the organizational structure to support it (i.e., PRRC), the notified body issues a certificate of conformity, which the manufacturer uses as a basis for its own declaration of conformity. The manufacturer may then apply the CE mark to the device, which allows the device to be placed on the market throughout the EU. If we fail to comply with applicable laws and regulations, we would be unable to affix the CE mark to our products, which would prevent us from selling them within the EU or any countries recognizing the CE mark. The aforementioned EU rules are generally applicable in the EEA.
We have gained certification under the EU Medical Devices Regulation and, where appropriate, maintained our certificates granted under the former EU Medical Devices Directive for all medical devices that we intend to continue to market in the EU and EEA.
Further, Switzerland, which is the country from which we import our products into the EU and where our EU regulatory team is based, has not yet entered into a Mutual Recognition Agreement with the EU that covers the EU Medical Device Regulation and allows medical devices to move freely between Switzerland and the EU. Therefore, for future needs, we will adjust the manner in which we bring our products into the EU market. Any such adjustments could cause temporary disruptions in and have adverse financial implications to our business in Europe.
In Japan, to date, we received approvals from the Japanese Ministry of Health, Labor and Welfare for our da Vinci Si, Xi, X, and SP surgical systems and various associated instruments and accessories for use in certain da Vinci procedures. We may seek additional approvals for other products and/or indications; however, there can be no assurance that such approvals will be granted. In addition, because not all of our instruments have received product approvals and reimbursement is an additional process to generate market acceptance, it is possible that procedures will be adopted slowly or not at all. Sales of our products depend, in part, on the extent to which the costs of our products are reimbursed by governmental health administration authorities. There are multiple pathways to obtain reimbursement for procedures including those that require in-country clinical data and which are considered for reimbursed status in April of even-numbered years. If we are not successful in obtaining the necessary reimbursement approvals or obtaining approvals for future products and procedures, then the demand for our products could be limited. These limitations could eliminate a significant market opportunity for our products in Japan.
In China, our capital sales are subject to importation authorizations and purchasing tender processes. In June 2023, the China National Health Commission published the 2023 Quota. Under the 2023 Quota, the government will allow for the sale of 559 new surgical robots into China, which could include da Vinci surgical systems as well as surgical systems introduced by others. As of December 31, 2024, including systems that were sold in prior quarters, we have placed 121 da Vinci surgical systems under the 2023 Quota. Our ability to track the number of systems that could be sold under these quotas in the future is limited by provincial and national agencies making such information publicly available. Future system sales and our ability to grow future procedure volumes are dependent on the completion of these purchasing tender authorizations. The timing and magnitude of these future authorizations, which may determine our system placements in future years, is not certain, and we expect to continue to experience variability in the timing of capital sales in China.
CHANGES IN HEALTHCARE LEGISLATION AND POLICY MAY HAVE AN ADVERSE EFFECT ON OUR BUSINESS, FINANCIAL CONDITION, OR RESULTS OF OPERATIONS.
In the U.S., there have been, and continue to be, a number of legislative initiatives to contain healthcare costs. In March 2010, the ACA was enacted, which made changes that have impacted and are expected to significantly impact the pharmaceutical and medical device industries.
The ACA contained a number of provisions designed to generate the revenues necessary to fund health insurance coverage expansions among other things. This included a number of Medicare payment system reforms, including a national pilot program on payment bundling to encourage hospitals, physicians, and other providers to improve the coordination, quality, and efficiency of certain healthcare services through bundled payment models and appropriated funding for comparative effectiveness research.
Since its enactment, there have been judicial, executive branch, and Congressional challenges to certain aspects of the ACA. On June 17, 2021, the U.S. Supreme Court dismissed the most recent judicial challenge to the ACA brought by several states without specifically ruling on the constitutionality of the ACA. Thus, the ACA will remain in effect in its current form.
In addition, other legislative changes have been proposed and adopted since the ACA became law. These changes included an aggregate reduction in Medicare payments, which went into effect on April 1, 2013, and will remain in effect through 2032, unless additional Congressional action is taken, with the exception of a temporary suspension due to the COVID-19 pandemic from May 1, 2020, through March 31, 2022. Individual states in the U.S. have also become increasingly aggressive in passing legislation and implementing regulations designed to control product pricing, including price or patient reimbursement constraints and discounts, and require marketing cost disclosure and transparency measures.
We expect additional state and federal healthcare reform measures to be adopted in the future that could have a material adverse effect on our industry generally and on our customers. Any changes to, or uncertainty with respect to, future reimbursement rates or changes in hospital admission rates could impact our customers’ demand for our products and services, which, in turn, could have a material adverse effect on our business, financial condition, or results of operations.
Further, the federal, state, and local governments, Medicare, Medicaid, managed-care organizations, and foreign governments have, in the past, considered, are currently considering, and may, in the future, consider healthcare policies and proposals intended to curb rising healthcare costs, including those that could significantly affect both private and public reimbursement for healthcare services. Future significant changes in the healthcare systems in the U.S. or other countries, including retroactive and prospective rate and coverage criteria changes, competitive bidding or tender processes for certain products and services, and other changes intended to reduce expenditures along with uncertainty about whether and how changes may be implemented, could have a negative impact on the demand for our products. We are unable to predict whether other healthcare policies, including policies stemming from legislation or regulations affecting our business may be proposed or enacted in the future, what effect such policies would have on our business, or what effect ongoing uncertainty about these matters will have on the purchasing decisions of our customers.
For instance, in December 2021, the EU Regulation No. 2021/2282 on Health Technology Assessment, amending Directive 2011/24/EU, was adopted. While the Regulation entered into force in January 2022, it will only begin to apply from
January 2028 onwards, with preparatory and implementation-related steps to take place in the interim. Once applicable, it will have a phased implementation depending on the concerned products. This Regulation intends to boost cooperation among EU member states in assessing health technologies, including certain high-risk medical devices, and provide the basis for cooperation at the EU level for joint clinical assessments in these areas. It will permit EU member states to use common HTA tools, methodologies, and procedures across the EU, working together in four main areas, including joint clinical assessment of the innovative health technologies with the highest potential impact for patients, joint scientific consultations whereby developers can seek advice from HTA authorities, identification of emerging health technologies to identify promising technologies early, and continuing voluntary cooperation in other areas. Individual EU member states will continue to be responsible for assessing non-clinical (e.g., economic, social, ethical, etc.) aspects of health technology and making decisions on pricing and reimbursement.
WE ARE SUBJECT TO FEDERAL, STATE, AND FOREIGN LAWS GOVERNING OUR BUSINESS PRACTICES, WHICH, IF VIOLATED, COULD RESULT IN SUBSTANTIAL PENALTIES. ADDITIONALLY, CHALLENGES TO, OR INVESTIGATION INTO, OUR PRACTICES COULD CAUSE ADVERSE PUBLICITY AND BE COSTLY TO RESPOND TO AND, THUS, COULD HARM OUR BUSINESS, FINANCIAL CONDITION, OR RESULTS OF OPERATIONS.
The Dodd-Frank Wall Street Reform and Consumer Protection Act requires us to track and disclose the source of any tantalum, tin, gold, and tungsten used in manufacturing that may originate in the Democratic Republic of the Congo or adjoining regions (so called “conflict minerals”). These metals are central to the technology industry and are present in some of our products as component parts. In most cases, no acceptable alternative material exists that has the necessary properties that our products require. Because it is not possible to determine the source of the metals by analysis, we must obtain a good faith description of the source of the intermediate components and raw materials from parties in our supply chain. The components that incorporate those metals may originate from many sources, and we purchase fabricated products from manufacturers who may have a long and difficult-to-trace supply chain. As the spot price of these materials varies, producers of the metal intermediates can be expected to change the mix of sources used. Accordingly, components and assemblies we buy may have a mix of sources as their origin. We are required to carry out a diligent effort to determine and disclose the source of these materials. There can be no assurance that we can obtain this information accurately or reliably, or at all, from intermediate producers who may be unwilling or unable to provide this information or further identify their sources of supply or to notify us if these sources change. In addition, these metals are subject to price fluctuations and shortages that can affect our ability to obtain the manufactured materials that we rely on at favorable terms or from consistent sources. These changes could have an adverse impact on our ability to manufacture and market our devices and products.
We are subject to healthcare regulation and enforcement by the federal government and the states and foreign governments where we conduct our business. The healthcare laws and regulations that may affect our ability to operate include the federal Anti-Kickback Statute, which prohibits the payment of remuneration to induce or reward hospitals, physicians, or other healthcare professionals either to refer patients or to purchase, lease, order, or arrange for or recommend the purchase, lease, or order of healthcare products or services for which payment may be made under the federal healthcare programs, such as Medicare, Medicaid, and other third-party payor programs. Further, a person or entity does not need to have actual knowledge of this statute or specific intent to violate it in order to have committed a violation. Similar laws must be complied with at the state level and in foreign jurisdictions.
We must comply with the federal civil and criminal false claims laws, including the federal False Claims Act, and civil monetary penalties laws, which prohibit, among other things, individuals or entities from knowingly presenting, or causing to be presented, claims for payment from Medicare, Medicaid, or other federal healthcare programs that are false or fraudulent. Although we do not submit claims directly to government payors, manufacturers can be held liable under the federal False Claims Act if they are deemed to “cause” the submission of false or fraudulent claims by, for example, providing inaccurate billing or coding information to customers or promoting a product off-label. In addition, the government may assert that a claim including items or services resulting from a violation of the federal Anti-Kickback Statute constitutes a false or fraudulent claim for purposes of the False Claims Act.
The Health Insurance Portability and Accountability Act of 1996, which created additional federal criminal statutes prohibit, among other things, executing a scheme to defraud any healthcare benefit program and making false statements relating to healthcare matters. Similar to the federal Anti-Kickback Statute, a person or entity does not need to have actual knowledge of the statute or specific intent to violate it to have committed a violation.
These laws may affect our sales, marketing, and other promotional activities by limiting the kinds of financial arrangements that we may have with hospitals, physicians, or other potential purchasers of our products. They particularly impact how we structure our sales offerings, including discount practices, customer support, speaker, education, and training programs, physician consulting, and other service arrangements. These laws are broadly written, and it is often difficult to determine precisely how these laws will be applied to specific circumstances. Violating anti-kickback laws and false claims laws can result in civil and criminal fines and penalties, which can be substantial and include monetary damages and penalties,
imprisonment, and exclusion from government healthcare programs. Even an unsuccessful challenge or investigation into our practices could cause adverse publicity and be costly to defend and, thus, could harm our business, financial condition, or results of operations.
The federal Physicians Payments Sunshine Act imposes reporting and disclosure requirements on certain device manufacturers for any “transfer of value” made or distributed to physicians (including family members), as defined by statute, certain non-physician practitioners, including physician assistants and nurse practitioners, and teaching hospitals. Such information must be made publicly available in a searchable format. In addition, device manufacturers are required to report and disclose any ownership or investment interests held by physicians and their immediate family members, as well as any transfers of value made to such physician owners and investors, during the preceding calendar year. Similar requirements apply in foreign jurisdictions. Failure to submit required information may result in civil monetary penalties for all payments, transfers of value, or ownership or investment interests not reported in an annual submission. Device manufacturers are required to submit reports to CMS by the 90th day of each calendar year.
Many states have similar laws and regulations, such as anti-kickback and false claims laws, which may be broader in scope and may apply regardless of payor, in addition to items and services reimbursed under Medicaid and other state programs. Certain states mandate implementation of commercial compliance programs to ensure compliance with these laws, impose restrictions on device manufacturer marketing practices, and/or require the tracking and reporting of gifts, compensation, and other remuneration to physicians or marketing expenditures and pricing information. The shifting commercial compliance environment and the need to build and maintain robust and expandable systems to comply with multiple jurisdictions with different compliance and/or reporting requirements increases the possibility that a healthcare company may be found out of compliance with one or more of the requirements, subjecting us to significant civil monetary penalties.
Additionally, to the extent that our product is sold in a foreign country, we may be subject to similar foreign laws.
Compliance with complex foreign and U.S. laws and regulations that apply to our OUS operations increases our cost of doing business in foreign jurisdictions and could expose us or our employees to fines and penalties in the U.S. and/or abroad. These numerous, and sometimes conflicting, laws and regulations include U.S. laws, such as the FCPA, and similar laws in other countries, such as the UK Bribery Act. Violations of these laws and regulations could result in fines, criminal sanctions against us, our officers, or our employees, prohibitions on the conduct of our business, and damage to our reputation. Although we have implemented policies and procedures designed to ensure compliance with these laws, there can be no assurance that our employees, contractors, or agents will not violate our policies.
Our operations are subject to certain antitrust and competition laws in the jurisdictions in which we conduct our business, in particular the U.S. and the EU. These laws prohibit, among other things, anticompetitive agreements and practices. If any of our commercial agreements or practices are found to violate or infringe such laws, we may be subject to civil and other penalties. We may also be subject to third-party claims for damages. Further, agreements that infringe upon these antitrust and competition laws may be void and unenforceable, in whole or in part, or require modification in order to be lawful and enforceable. If we are unable to enforce our commercial agreements, whether at all or in material part, our business, financial condition, or results of operations could be adversely affected.
We are also subject to claims, lawsuits, and government investigations involving labor and employment. Such claims, lawsuits, and government investigations are inherently uncertain. Regardless of the outcome, any of these types of legal proceedings can have an adverse impact on us because of legal costs, diversion of management resources, and other factors.
We are also exposed to the risk that our employees, independent contractors, consultants, manufacturers, suppliers, and any other third parties that we may engage in connection with the development and commercialization of our products may engage in fraudulent or illegal activity. Misconduct by these parties could include intentional, reckless, and/or negligent conduct or disclosure of unauthorized activities to us that violates: (i) the laws of the FDA and other similar regulatory authorities, including those laws requiring the reporting of true, complete, and accurate information to such authorities; (ii) manufacturing standards; (iii) data privacy, security, fraud, and abuse laws and regulations; or (iv) laws that require the true, complete, and accurate reporting of financial information or data. Activities subject to these laws could also involve the improper use or misrepresentation of information obtained in the course of clinical trials or the creation of fraudulent data in clinical trials, which could result in regulatory sanctions and cause serious harm to our reputation. It is not always possible to identify and deter misconduct by employees and other third parties, and the precautions we take to detect and prevent this activity may not be effective in controlling unknown or unmanaged risks or losses or in protecting us from governmental investigations or other actions or lawsuits stemming from a failure to comply with such laws or regulations.
Additionally, we are subject to the risk that a person or government could allege fraud or other misconduct, even if none occurred. If any such actions are instituted against us and we are not successful in defending ourselves or asserting our rights, those actions could have a significant impact on our business or results of operations, including the imposition of significant civil, criminal, and administrative penalties, damages, monetary fines, disgorgements, possible exclusion from participation in Medicare, Medicaid, other U.S. federal healthcare programs, or healthcare programs in other jurisdictions, integrity oversight
and reporting obligations to resolve allegations of non-compliance, imprisonment, other sanctions, contractual damages, reputational harm, diminished profits and future earnings, and curtailment of our operations.
IF HOSPITALS AND OTHER SURGICAL FACILITIES DO NOT CONTINUE TO MEET FEDERAL, STATE, OR OTHER REGULATORY STANDARDS, THEY MAY BE REQUIRED TO TEMPORARILY CEASE ALL OR PART OF THEIR SYSTEM UTILIZATION.
Our global customers are subject to periodic inspection by regulatory authorities. Our customers are required to comply with applicable regulations, including with respect to the reprocessing of our instruments and accessories. Hospitals may not follow cleaning and sterilization instructions properly, or equipment used for cleaning and sterilization may malfunction or be used improperly. If our customers deviate from cleaning and sterilization instructions, regulatory authorities may require them to suspend the use of our systems.
RISKS RELATING TO OUR INTELLECTUAL PROPERTY
IF WE ARE UNABLE TO FULLY PROTECT AND SUCCESSFULLY DEFEND OUR INTELLECTUAL PROPERTY FROM USE BY THIRD PARTIES, OUR ABILITY TO COMPETE IN THE MARKET MAY BE HARMED.
Our commercial success depends in part on obtaining patent protection for the proprietary technologies contained in our products and on successfully defending our patents against infringing products and/or services in litigation or administrative proceedings, including patent oppositions, reviews, or reexaminations. We incur substantial costs in obtaining patents and, if necessary, defending our patent rights. We do not know whether we will be successful in obtaining the desired patent protection for our new proprietary technologies or that the protection we do obtain will be found valid and enforceable when challenged. The success of defending our proprietary rights can be highly uncertain, because it involves complex and often evolving legal issues and procedures that are dependent on the particular facts of each case.
In addition to patents, we also rely on other intellectual property rights, such as trade secret, copyright, and trademark laws to protect proprietary technologies. We further utilize nondisclosure agreements and other contractual provisions as well as technical measures to protect our proprietary technologies. Nevertheless, these measures may be inadequate in protecting our technologies. If these measures prove to be inadequate in protecting our technologies, our competitive advantages may be reduced. Moreover, we may not have adequate remedies for potential breaches by employees, consultants, and others who participate in developing our proprietary technologies against their agreements with us regarding intellectual property. As a result, our trade secrets may be lost. Notwithstanding our efforts to protect our intellectual property, our competitors may independently develop similar or alternative technologies or products that are equal to or superior to our technologies without infringing any of our intellectual property, which would harm our ability to compete in the market.
As foreign markets become more significant in revenue for us, our foreign operations and strategic alliances with foreign entities will likely increase. Our exposure to risks associated with these operations requires us to increase our reliance on protecting our intellectual property against infringing products and/or services in markets outside of the U.S. The laws and judicial systems in these countries may introduce yet another level of uncertainty in our effort to obtain the desired protection as well as defending our rights.
OTHERS MAY BE SUCCESSFUL IN ASSERTING THAT OUR PRODUCTS INFRINGE THEIR INTELLECTUAL PROPERTY RIGHTS, WHICH MAY CAUSE US TO PAY SUBSTANTIAL DAMAGES AND/OR ENJOIN US FROM COMMERCIALIZING OUR PRODUCTS.
As we continue to introduce and commercialize new products and technologies, there may be U.S. and foreign patents issued to third parties that relate to our products. Some of these patents may be broad enough to cover one or more aspects of our products. We do not know whether any of these patents, if challenged, would be held valid, enforceable, and infringed. From time to time, we receive, and likely will continue to receive, letters from third parties accusing us of infringing and/or inviting us to license their patents. We may be sued by, or become involved in an administrative proceeding with, one or more of these third parties.
We cannot be certain that a court or administrative body would agree with any arguments or defenses that we may have concerning invalidity, unenforceability, or non-infringement of any third-party patent. In addition, other parties may have filed or will file patent applications covering products that are similar to or identical to ours. We cannot be certain that patents issuing from our own patent applications covering our products will have a priority date over any patents issuing from applications filed by a third party.
The medical device industry has experienced extensive intellectual property litigation and administrative proceedings. If third parties assert infringement claims or institute administrative proceedings against us, our technical and management personnel will need to spend significant time and effort, and we will incur large expenses in defending against these attacks. We cannot be certain that we will prevail in defending against infringement, validity, or enforceability claims against us. If
plaintiffs in patent administrative proceedings are successful, our patent portfolio may be adversely affected. If plaintiffs in any patent action are successful, we may be enjoined from selling or importing our products, we may have to pay substantial damages, including treble damages, or we may be required to obtain a license that requires us to pay substantial royalties or relocate our manufacturing facilities. In addition, any public announcements related to litigation or administrative proceedings initiated or threatened against us could cause our stock price to decline.
OUR PRODUCTS MAY RELY ON LICENSES FROM THIRD PARTIES, WHICH MAY NOT BE AVAILABLE TO US ON COMMERCIALLY REASONABLE TERMS OR AT ALL. IF WE LOSE ACCESS TO THESE TECHNOLOGIES, OUR REVENUES COULD DECLINE.
Our products may rely on technology that we license from others, including technology that is integral to our products. There is no assurance that we can obtain or retain licenses on acceptable terms or at all. The license agreements we have entered into with several industry partners may be terminated for breach. If any of these agreements are terminated, we may be unable to reacquire the necessary license on satisfactory terms or at all. The failure to obtain, retain, or maintain licenses could prevent or delay further development or commercialization of our products, which may have a material adverse effect on our business, financial condition, or results of operations.
GENERAL RISK FACTORS
OUR FUTURE OPERATING RESULTS MAY BE BELOW EXPECTATIONS, WHICH COULD CAUSE OUR STOCK PRICE TO DECLINE.
Due to the nascent nature of our industry, we have limited insight into trends that may emerge in our market and affect our business. The revenue and income potential of our market are unproven, and we may be unable to maintain or grow our revenue or income. Our products typically have lengthy sales cycles. In addition, our costs may be higher than we anticipated. If we fail to generate sufficient revenues or our costs are higher than we expect, our results of operations may be materially adversely affected. Further, future revenue from sales of our products is difficult to forecast, because the market for new surgical technologies is still evolving. Our results of operations could be impacted by numerous factors, including:
•the extent to which our products achieve and maintain market acceptance;
•actions relating to regulatory matters;
•product quality and supply problems;
•inflationary pressures on the cost of producing and distributing our products;
•our timing and ability to develop our manufacturing and sales and marketing capabilities;
•demand for our products;
•the utilization of our systems placed under usage-based operating lease arrangements;
•the size and timing of particular sales and any collection delays related to those sales;
•the progress of surgical training in the use of our products;
•our ability to develop, introduce, and market new or enhanced versions of our products on a timely basis;
•third-party payor reimbursement policies;
•our ability to protect our proprietary rights and defend against third-party challenges;
•our ability to license additional intellectual property rights; and
•the progress and results of any clinical trials.
Our operating results in any particular period will not be a reliable indication of our future performance. It is possible that, in future periods, our operating results will be below the expectations of securities analysts or investors. If this occurs, the price of our common stock and the value of your investment will likely decline.
OUR STOCK PRICE HAS BEEN, AND WILL LIKELY CONTINUE TO BE, VOLATILE.
The market price of our common stock has experienced fluctuations and may fluctuate significantly in the future. For example, during 2022, the adjusted closing price of our common stock reached a high of $360.00 and a low of $183.06; during 2023, it reached a high of $354.93 and a low of $224.75; and, during 2024, it reached a high of $550.62 and a low of $322.13. Our stock price can fluctuate for a number of reasons, including:
•announcements about us or our competitors;
•variations in our operating results and financial guidance;
•our introduction or abandonment of new technologies or products;
•regulatory approvals and enforcement actions;
•changes in our product pricing policies;
•changes in earnings estimates or recommendations by analysts;
•economic changes and overall market volatility;
•announcements relating to product quality and the supply chain for our products;
•litigation;
•media coverage, whether accurate or inaccurate, fair or misleading;
•political uncertainties;
•short sales on shares of our common stock or other activities by short sellers; and
•our stock repurchase program.
Future stock repurchase programs will be contingent on a variety of factors, including our financial condition, results of operations, and business requirements. There can be no assurance that we will continue repurchasing our common stock in the future, consistent with historical levels or at all, or that our stock repurchase programs will have a beneficial impact on our stock price.
In addition, stock markets generally have experienced, and in the future may experience, significant price and volume volatility. This volatility has a substantial effect on the market prices of securities of many public companies for reasons frequently unrelated or disproportionate to the operating performance of the specific companies. Further, the securities of many medical device companies, including us, have historically been subject to extensive price and volume fluctuations that may affect the market price of their common stock. If these broad market fluctuations continue, it may have a material adverse impact on the market price of our common stock.
CHANGES TO FINANCIAL ACCOUNTING STANDARDS MAY AFFECT OUR REPORTED RESULTS OF OPERATIONS.
A change in accounting standards can have a significant effect on our reported results and may retroactively affect previously reported results. New accounting pronouncements and varying interpretations of accounting pronouncements have occurred and may occur in the future. Changes to existing standards or the reevaluation of current practices may adversely affect our reported financial results or the way we conduct our business.
ITEM 1B. UNRESOLVED STAFF COMMENTS
None.
ITEM 1C. CYBERSECURITY
CYBERSECURITY RISK MANAGEMENT AND STRATEGY
We have developed and implemented a cybersecurity risk management program intended to protect the confidentiality, integrity, and availability of our critical systems and information. Our cybersecurity risk management program includes a cybersecurity incident response plan.
We design and assess our program based on various cybersecurity frameworks, such as the National Institute of Standards and Technology (“NIST”) and the Center for Internet Security (“CIS”), as well as information security standards issued by the International Organization for Standardization, including ISO 27001 and ISO 27002. In 2022, our cybersecurity systems and processes achieved ISO 27001 certification. We use these cybersecurity frameworks and information security standards as a guide to help us identify, assess, and manage cybersecurity risks relevant to our business.
Our cybersecurity risk management program is integrated into our overall enterprise risk management program and shares common methodologies, reporting channels, and governance processes that apply across the enterprise risk management program to other legal, compliance, strategic, operational, and financial risk areas.
Our cybersecurity risk management program includes:
•risk assessments designed to help identify material cybersecurity risks to our critical systems, information, products, services, and our broader enterprise information technology environment;
•a security team principally responsible for managing (1) our cybersecurity risk assessment processes, (2) our security controls, and (3) our response to cybersecurity incidents;
•the use of external service providers, where appropriate, to assess, test, or otherwise assist with aspects of our security controls;
•cybersecurity awareness training for our employees, incident response personnel, and senior management;
•a cybersecurity incident response plan that includes procedures for responding to cybersecurity incidents; and
•a third-party risk management process for service providers, suppliers, and vendors.
We have not identified any risks from known cybersecurity threats, including as a result of any prior cybersecurity incidents, that have materially affected or are reasonably likely to materially affect us, including our operations, business strategy, results of operations, or financial condition.
CYBERSECURITY GOVERNANCE
Our Board considers cybersecurity risk as part of its risk oversight function and has delegated oversight of cybersecurity and other information technology risks to the Audit Committee. The Audit Committee oversees management’s implementation of the cybersecurity risk management program.
The Audit Committee receives quarterly reports from management on our cybersecurity risks. In addition, management updates the Audit Committee, as necessary, regarding any material cybersecurity incidents, as well as any incidents with lesser potential impact.
The Audit Committee reports to the full Board regarding its activities, including those related to cybersecurity. The full Board also receives briefings from management on our cybersecurity risk management program. Board members receive presentations on cybersecurity topics from our IT management team, internal security staff, or external experts as part of the Board’s continuing education. Seven members of our Board have information security expertise, including Joseph C. Beery, Lewis Chew, Gary S. Guthart, Ph.D., Amal M. Johnson, Sreelakshmi Kolli, Keith R. Leonard, Jr., and Mark J. Rubash.
Our management team, including our IT management team, is responsible for assessing and managing our material risks from cybersecurity threats. The team has primary responsibility for our overall cybersecurity risk management program and supervises both our internal cybersecurity personnel and our retained external cybersecurity consultants. Our management team has certifications from various organizations, such as ISC2 (Certified Information Security Systems Professional or “CISSP”), Global Information Assurance (“GIAC”), and the EC-Council.
Our management team oversees efforts to prevent, detect, mitigate, and remediate cybersecurity risks and incidents through various means, which may include briefings from internal security personnel, threat intelligence and other information obtained from governmental, public, or private sources, including external consultants engaged by us, and alerts and reports produced by security tools deployed in the information technology environment.
ITEM 2. PROPERTIES
As of December 31, 2024, we own approximately 2.1 million square feet of space on 128 acres of land in Sunnyvale, California, where we house our principal headquarters, research and development, service, and support functions, as well as certain of our manufacturing operations.
Outside of Sunnyvale, California, we own facilities in other U.S. locations that are used for sales, training, manufacturing, engineering, and administrative functions, including approximately 1.1 million square feet of space on 69 acres of land in Peachtree Corners, Georgia. We also lease approximately 740,000 square feet of space for certain manufacturing, engineering, warehousing, and support functions at various locations in the U.S.
Outside of the U.S., we own and/or lease properties in Mexicali, Mexico, Germany, and Bulgaria, primarily for manufacturing operations, and Aubonne, Switzerland, primarily for our international headquarters. In China, our Joint Venture leases facilities for research and development, manufacturing, and sales operations. In Israel, we lease facilities for research and development. In addition, we lease various international facilities for sales and other operations.
ITEM 3. LEGAL PROCEEDINGS
ITEM 4. MINE SAFETY DISCLOSURES
Not applicable.
PART II
ITEM 5. MARKET FOR REGISTRANT’S COMMON EQUITY, RELATED STOCKHOLDER MATTERS AND ISSUER PURCHASES OF EQUITY SECURITIES
COMMON STOCK
Our common stock is traded on The Nasdaq Global Select Market under the symbol “ISRG.”
As of January 27, 2025, there were 124 stockholders of record of our common stock, although there are a significantly larger number of beneficial owners of our common stock.
DIVIDENDS
We have never declared or paid any cash dividends on our common stock. We currently intend to retain earnings for use in the operation and expansion of our business. In addition, we may use a portion of our retained earnings to repurchase shares of our common stock, if appropriate.
SECURITIES AUTHORIZED FOR ISSUANCE UNDER EQUITY COMPENSATION PLANS
Please see Item 12. “Security Ownership of Certain Beneficial Owners and Management and Related Stockholder Matters” under Part III of this Annual Report on Form 10-K for information on where to find information required by Item 201(d) of Regulation S-K.
RECENT SALES OF UNREGISTERED SECURITIES
None.
ISSUER PURCHASES OF EQUITY SECURITIES
The table below summarizes our common stock repurchase activity for the quarter ended December 31, 2024.
| | | | | | | | | | | | | | | | | | | | | | | |
| Fiscal Period | Total Number of
Shares
Repurchased | | Average
Price Paid
Per Share | | Total Number of
Shares Purchased As
Part of a Publicly
Announced Program | | Approximate Dollar
Amount of Shares That
May Yet be Purchased
Under the Program (1) |
| October 1 to October 31, 2024 | — | | | $ | — | | | — | | | $ | 1.1 | billion |
| November 1 to November 30, 2024 | — | | | $ | — | | | — | | | $ | 1.1 | billion |
| December 1 to December 31, 2024 | — | | | $ | — | | | — | | | $ | 1.1 | billion |
| Total during quarter ended December 31, 2024 | — | | | $ | — | | | — | | | |
(1)Since March 2009, we have had an active stock repurchase program (the “Repurchase Program”). As of December 31, 2024, our Board of Directors (our “Board”) had authorized an aggregate amount of up to $10.0 billion for stock repurchases, of which the most recent authorization occurred in July 2022, when our Board increased the authorized amount available under our Repurchase Program to $3.5 billion. The remaining amount available to repurchase shares under the authorized Repurchase Program as of December 31, 2024, was $1.1 billion. The authorized Repurchase Program does not have an expiration date.
STOCK PERFORMANCE GRAPH
This graph is not “soliciting material” or deemed “filed” with the SEC or subject to Regulation 14A or 14C (17 CFR 240.14a-1–240.14a-104 or 240.14c-1–240.14c-101) for purposes of Section 18 of the Exchange Act, or otherwise subject to liabilities under that Section, and shall not be deemed incorporated by reference into any filings of Intuitive Surgical, Inc. under the Securities Act of 1933, as amended, whether made before or after the date hereof and irrespective of any general incorporation language in any such filing.
The graph set forth below compares the cumulative total stockholder return on our common stock between December 31, 2019, and December 31, 2024, with the cumulative total return of (i) the Nasdaq Composite Index, (ii) the S&P 500 Healthcare Index, and (iii) the S&P 500 Index over the same period. This graph assumes an investment of $100.00 on December 31, 2019, in our common stock, the Nasdaq Composite Index, the S&P Healthcare Index, and the S&P 500 Index and assumes the re-investment of dividends, if any.
The comparisons shown in the graph below are based on historical data. We caution that the stock price performance shown in the graph below is not necessarily indicative of, nor is it intended to forecast, the potential future performance of our common stock.
| | |
| COMPARISON OF CUMULATIVE TOTAL RETURN AMONG INTUITIVE, NASDAQ COMPOSITE, S&P HEALTHCARE INDEX, AND S&P 500 INDEX |
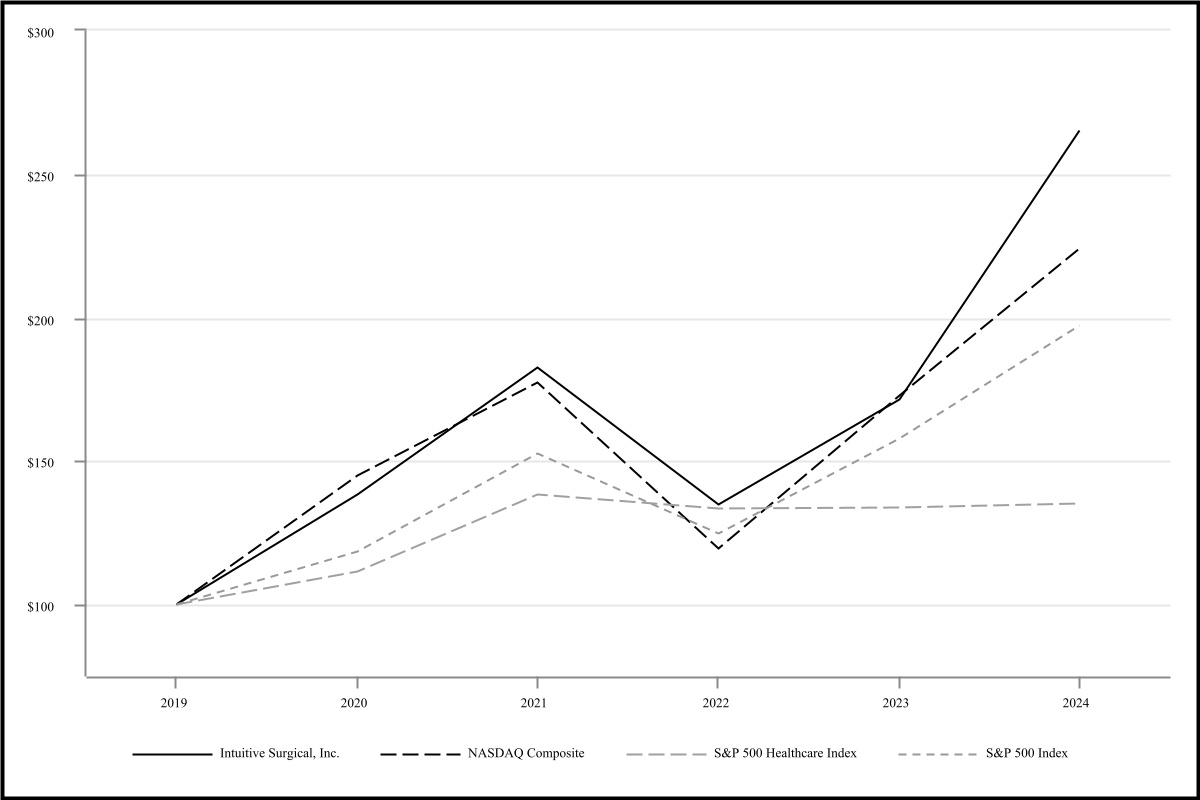
| | | | | | | | | | | | | | | | | | | | | | | | | | | | | | | | | | | |
| December 31, |
| 2019 | | 2020 | | 2021 | | 2022 | | 2023 | | 2024 |
| Intuitive Surgical, Inc. | $ | 100.00 | | | $ | 138.39 | | | $ | 182.34 | | | $ | 134.66 | | | $ | 171.21 | | | $ | 264.89 | |
| Nasdaq Composite | $ | 100.00 | | | $ | 144.92 | | | $ | 177.06 | | | $ | 119.45 | | | $ | 172.77 | | | $ | 223.87 | |
| S&P 500 Healthcare Index | $ | 100.00 | | | $ | 111.43 | | | $ | 138.35 | | | $ | 133.44 | | | $ | 133.85 | | | $ | 135.06 | |
| S&P 500 Index | $ | 100.00 | | | $ | 118.40 | | | $ | 152.39 | | | $ | 124.79 | | | $ | 157.59 | | | $ | 197.02 | |
ITEM 6.
[RESERVED]
ITEM 7. MANAGEMENT’S DISCUSSION AND ANALYSIS OF FINANCIAL CONDITION AND RESULTS OF OPERATIONS
Overview
Open surgery remains a prevalent form of surgery and is used in almost every area of the body. However, the large incisions required for open surgery create trauma to patients, typically resulting in longer hospitalization and recovery times, increased hospitalization costs, and additional pain and suffering relative to minimally invasive surgery, where MIS is available. For over four decades, MIS has reduced trauma to patients by allowing selected surgeries to be performed through small ports rather than large incisions. MIS has been widely adopted for certain surgical procedures.
Da Vinci surgical systems enable surgeons to extend the benefits of MIS to many patients who would otherwise undergo a more invasive surgery by using computational, robotic, and imaging technologies to overcome many of the limitations of traditional open surgery or conventional MIS. Surgeons using a da Vinci surgical system operate while seated comfortably at a console viewing a 3D, high-definition image of the surgical field. This immersive console connects surgeons to the surgical field and their instruments. While seated at the console, the surgeon manipulates instrument controls in a natural manner, similar to open surgical technique. Our technology is designed to provide surgeons with a range of articulation of the surgical instruments used in the surgical field analogous to the motions of a human wrist, while filtering out the tremor inherent in a surgeon’s hand. In designing our products, we focus on making our technology easy and safe to use.
Our da Vinci products fall into five broad categories: da Vinci surgical systems, da Vinci instruments and accessories, da Vinci stapling, da Vinci energy, and da Vinci vision, including Firefly fluorescence imaging systems and da Vinci endoscopes. We provide a comprehensive suite of systems, learning, and services offerings. Digitally enabled for nearly three decades, these three offerings aim to decrease variability by providing dependable, consistent functionality and an integrated user experience. Our systems category includes robotic platforms, software, vision, energy, and instruments and accessories. Our learning category includes learning and enabling technology, such as simulation and telepresence, as well as technical training programs and personalized peer-to-peer learning opportunities. We have a global network of field service engineers and distributors through which we deliver a suite of services, including installation, repair, maintenance, around-the-clock technical support, and system monitoring. We also offer customized analytics and consultation to hospitals for program optimization.
We have commercialized the following da Vinci surgical systems: the da Vinci standard surgical system in 1999, the da Vinci S surgical system in 2006, the da Vinci Si surgical system in 2009, the fourth-generation da Vinci Xi surgical system in 2014, and the fifth-generation da Vinci 5 surgical system in 2024. We extended our fourth-generation platform by adding the da Vinci X surgical system, commercialized in 2017, and the da Vinci SP surgical system, commercialized in 2018. The da Vinci SP surgical system accesses the body through a single incision, while the other da Vinci surgical systems access the body through multiple incisions. All da Vinci systems include a surgeon’s console (or consoles), imaging electronics, a patient-side cart, and computational hardware and software.
We are in the early stages of launching our da Vinci SP surgical system, and we have an installed base of 273 da Vinci SP surgical systems as of December 31, 2024. We have received FDA clearance for the da Vinci SP surgical system for urologic, colorectal, general thoracoscopic, and certain transoral procedures. Additionally, the da Vinci SP surgical system has received regulatory clearance in South Korea for a broad set of procedures. The da Vinci SP surgical system has also received regulatory clearance in Japan for the same set of procedures that are currently allowed with the da Vinci Xi surgical system in Japan. In January 2024, the da Vinci SP surgical system received European certification in accordance with Regulation (EU) 2017/745 of the European Parliament and of the Council of 5 April 2017 on medical devices (the “EU MDR”) for use in endoscopic abdominopelvic, thoracoscopic, transoral otolaryngology, transanal colorectal, and breast surgical procedures, and we are commercializing the da Vinci SP surgical system in select major European countries as part of a measured rollout strategy. In August 2024, we obtained regulatory clearance in Taiwan for our da Vinci SP surgical system for use in endoscopic abdominopelvic, thoracoscopic, transoral otolaryngology, transanal colorectal, transanal total mesorectal excision, and breast surgical procedures. We plan to seek FDA clearances for additional indications for the da Vinci SP surgical system and expand the system’s regulatory approvals (including for additional indications) in other OUS markets over time. The success of the da Vinci SP surgical system is dependent on positive experiences and improved clinical outcomes for the procedures for which it has been cleared as well as securing additional clinical clearances.
In March 2024, we obtained FDA clearance for our da Vinci 5 surgical system, our next-generation multi-port robotic system, for use in all surgical specialties and procedures indicated for da Vinci Xi, except for cardiac and pediatric indications. In October 2024, we obtained regulatory clearance in South Korea for the da Vinci 5 surgical system for use in urologic, general, gynecologic, thoracoscopic, thoracoscopically-assisted cardiotomy, and transoral otolaryngology surgical procedures. We are in the early stages of launching da Vinci 5, and we have an installed base of 362 da Vinci 5 surgical systems as of December 31, 2024. We are in the midst of a phased launch over several quarters, giving us time to mature our supply and manufacturing processes for the new system. Additionally, we are in the regulatory process in Japan and Europe for da Vinci 5.
We offer approximately 70 different multi-port da Vinci instruments to provide surgeons with flexibility in choosing the types of tools needed to perform a particular surgery. These multi-port instruments are generally robotically controlled and provide end effectors (tips) that are similar to those used in either open or laparoscopic surgery. We offer advanced instrumentation for the da Vinci 5, da Vinci X, and da Vinci Xi surgical systems, including da Vinci energy and da Vinci stapler products, to provide surgeons with sophisticated, computer-aided tools to precisely and efficiently interact with tissue. The da Vinci 5, da Vinci X, and da Vinci Xi surgical systems generally share the same instruments, whereas the da Vinci Si surgical system uses instruments that are not compatible with the da Vinci 5, da Vinci X, and da Vinci Xi systems. Additionally, we have introduced a unique set of force feedback instruments that are only compatible with our da Vinci 5 surgical system. We also currently offer nine core instruments on our da Vinci SP surgical system. We plan to expand our da Vinci SP instrument offering over time.
Our learning and enabling technology offerings facilitate access to education and training on our products. Our enabling technologies include telepresence and Advanced Insights Suite (which includes Case Insights and Insights Engine), and our learning technology solutions include Intuitive Learning, SimNow, customized training models, remote case observations, and remote proctoring.
In 2019, we commercialized our Ion endoluminal system, which is a flexible, robotic-assisted, catheter-based platform that utilizes instruments and accessories for which the first cleared indication is minimally invasive biopsies in the lung. Our Ion system extends our commercial offering beyond surgery into diagnostic, endoluminal procedures. The system features an ultra-thin, ultra-maneuverable catheter that can articulate 180 degrees in all directions and allows navigation far into the peripheral lung and provides the stability necessary for precision in a biopsy. Many suspicious lesions found in the lung may be small and difficult to access, which can make diagnosis challenging, and Ion helps physicians obtain tissue samples from deep within the lung, which could help enable earlier diagnosis. Our Ion endoluminal system has received FDA clearance, and OUS regulatory clearances include European certification in accordance with the EU MDR, regulatory clearance in South Korea, and NMPA regulatory clearance in China. We plan to seek additional clearances, approvals, and certifications for our Ion endoluminal system in OUS markets over time.
The success of new product introductions depends on a number of factors including, but not limited to, pricing, competition, geographic market and consumer acceptance, the effective forecasting and management of product demand, inventory levels, the management of manufacturing and supply costs, and the risk that new products may have quality or other defects in the early stages of introduction.
Macroeconomic Environment
Our future results of operations and liquidity could be materially adversely affected by uncertainty surrounding macroeconomic and geopolitical factors in the U.S. and globally characterized by the supply chain environment, inflationary pressure, elevated interest rates, disruptions in the commodities’ markets as a result of the conflict between Russia and Ukraine and conflicts in the Middle East, including Israel and Iran, and the introduction of or changes in tariffs or trade barriers.
Supply chain constraints have generally improved to pre-COVID-19 pandemic levels, with some isolated residual stresses, particularly for engineered raw materials and at certain subcontract suppliers that are operationally challenged to meet our production requirements. These isolated instances did not have a material impact during 2024. Additionally, material and labor prices to produce some components remain elevated from historical levels due to market dynamics, demand mix, or general cost inflation within the supply chain. With elevated interest rates, access to credit is more difficult, and any insolvency of certain suppliers, including sole- and single-sourced suppliers, may have heightened continuity risks. Incidents of cybersecurity breaches, which have not significantly impacted our supply chain to date, also remain an active threat to sustained supply continuity. We are actively engaged in activities that seek to mitigate the impact of any supply chain risks and disruptions on our operations.
Some hospitals continue to experience challenges with staffing and cost pressures that could affect their ability to provide patient care. Additionally, certain hospitals are facing significant financial pressure as supply chain constraints and inflation have driven up operating costs and elevated interest rates have made access to credit more expensive. Hospitals may also be adversely affected by the liquidity concerns as a result of the broader macroeconomic environment. Any or all of these factors could negatively impact the number of da Vinci procedures performed or surgical systems placed and have a material adverse effect on our business, financial condition, or results of operations.
COVID-19 Pandemic
COVID-19 has had a negative impact on our procedure volumes during periods with COVID-19 outbreaks due to patient delays in both the diagnosis and treatment of diseases. While such delays have negatively impacted our procedure volumes in periods with COVID-19 outbreaks, we believe that these delays have also resulted in increased procedure volumes during those periods following such outbreaks, due to the treatment of patients in backlogs that were created during the COVID-19 outbreak.
In the first fiscal quarter of 2023, COVID-19 resurgences in China negatively impacted our procedure volumes in the region. However, as infections and hospitalization decreased, our procedure volumes recovered. We did not experience significant procedure volume disruptions due to COVID-19 outbreaks in any of our geographic markets during the remainder of 2023. Instead, throughout 2023, we saw a positive impact on procedure volumes and believe that such positive impacts were partially attributable to patients who had deferred treatment returning for diagnosis and treatment.
During 2024, we did not experience noticeable procedure volume disruptions due to COVID-19. We also believe that a large portion of the patients in the backlog that required treatment during the COVID-19 pandemic have now been treated. Therefore, we believe that the impact of patient backlogs was less significant on procedure volumes in 2024 than what was experienced in 2023.
Business Model
Overview
We generate up-front revenue from the placement of da Vinci surgical systems through sales or sales-type lease arrangements and recurring revenue over time through fixed-payment or usage-based operating lease arrangements. We also earn recurring revenue from the sales of instruments, accessories, and services.
The da Vinci surgical system generally sells for between $0.7 million and $3.1 million, depending on the model, configuration, and geography, and represents a significant capital equipment investment for our customers when purchased. Our instruments and accessories have limited lives and will either expire or wear out as they are used in surgery, at which point they need to be replaced. We generally earn between $800 and $3,600 of instruments and accessories revenue per surgical procedure performed, depending on the type and complexity of the specific procedures performed and the number and type of instruments used. We typically enter into service contracts at the time systems are sold or leased at an annual fee between $100,000 and $225,000, depending on the configuration of the underlying system and the composition of the services offered under the contract. Our system sale arrangements generally include a five-year period of service, with the first year of service provided for free. These service contracts have generally been renewed at the end of the initial contractual service periods.
We generate revenue from our Ion endoluminal system in a business model consistent with the da Vinci surgical system model described above. We generate up-front revenue from the placement of Ion systems through sales or sales-type lease arrangements and recurring revenue over time through fixed-payment or usage-based operating lease arrangements. We also earn recurring revenue from the sales of instruments, accessories, and services. The Ion endoluminal system generally sells for between $500,000 and $815,000. Our instruments and accessories have limited lives and will either expire or wear out as they are used in procedures, at which point they need to be replaced. We typically enter into service contracts at the time systems are sold or leased at an annual fee between $55,000 and $80,000.
Additionally, as part of our ecosystem of products and services, we provide a portfolio of learning offerings and digital solutions. We do not currently generate material revenue from these offerings.
Recurring Revenue
Recurring revenue consists of instruments and accessories revenue, service revenue, and operating lease revenue. Recurring revenue increased to $7.04 billion, or 84% of total revenue in 2024, compared to $5.94 billion, or 83% of total revenue in 2023, and $4.92 billion, or 79% of total revenue in 2022.
Instruments and accessories revenue has grown at a faster rate than systems revenue over time. Instruments and accessories revenue increased to $5.08 billion in 2024, compared to $4.28 billion in 2023 and $3.52 billion in 2022. The increase in instruments and accessories revenue largely reflects continued procedure adoption.
Service revenue was $1.31 billion in 2024, compared to $1.17 billion in 2023 and $1.02 billion in 2022. The increase in service revenue was primarily driven by the growth of the base of installed da Vinci surgical systems producing service revenue. The installed base of da Vinci surgical systems grew 15% to approximately 9,902 as of December 31, 2024; 14% to approximately 8,606 as of December 31, 2023; and 12% to approximately 7,544 as of December 31, 2022.
We use the installed base, number of placements, and utilization of systems as metrics for financial and operational decision-making and as a means to evaluate period-to-period comparisons. Management believes that the installed base, number of placements, and utilization of systems provide meaningful supplemental information regarding our performance, as management believes that the installed base, number of placements, and utilization of systems are indicators of the rate of adoption of our robotic-assisted medical procedures as well as an indicator of future recurring revenue. Management believes that both it and investors benefit from referring to the installed base, number of placements, and utilization of systems in assessing our performance and when planning, forecasting, and analyzing future periods. The installed base, number of placements, and utilization of systems also facilitate management’s internal comparisons of our historical performance. We believe that the installed base, number of placements, and utilization of systems are useful to investors as metrics, because (1)
they allow for greater transparency with respect to key metrics used by management in its financial and operational decision-making, and (2) they are used by institutional investors and the analyst community to help them analyze the performance of our business. The vast majority of our installed systems are connected via the internet. System logs can also be accessed by field engineers for systems that are not connected to the internet. We utilize this information as well as other information from agreements and discussions with our customers that involve estimates and judgments, which are, by their nature, subject to substantial uncertainties and assumptions. Estimates and judgments for determining the installed base, number of placements, and utilization of systems may be impacted over time by various factors, including system internet connectivity, hospital and distributor reporting behavior, and inherent complexities in new agreements. Such estimates and judgments are also susceptible to technical errors. In addition, the relationship between the installed base, number of placements, and utilization of systems and our revenues may fluctuate from period to period, and growth in the installed base, number of placements, and utilization of systems may not correspond to an increase in revenue. The installed base, number of placements, and utilization of systems are not intended to be considered in isolation or as a substitute for, or superior to, revenue or other financial information prepared and presented in accordance with U.S. generally accepted accounting principles (“GAAP”).
Intuitive System Leasing
Since 2013, we have entered into sales-type and fixed-payment operating lease arrangements directly with certain qualified customers as a way to offer customers flexibility in how they acquire systems and expand their robotic-assisted programs while leveraging our balance sheet. These leases generally have commercially competitive terms as compared to other third-party entities that offer equipment leasing. We also enter into usage-based operating lease arrangements with qualified customers that have committed da Vinci programs where we charge for the system and service as procedures are performed, offering greater predictability in costs for customers. We believe that all of these alternative financing structures have been effective and well-received, and we are willing to expand the proportion of any of these structures based on customer needs and demand.
We include systems placed under fixed-payment and usage-based operating lease arrangements, as well as sales-type lease arrangements, in our system placement and installed base disclosures. We exclude operating lease-related revenue, including usage-based revenue, and Ion system revenue from our da Vinci surgical system average selling price (“ASP”) computations.
The following table summarizes our system placements under leasing arrangements for the years ended December 31, 2024, 2023, and 2022:
| | | | | | | | | | | | | | | | | |
| Year Ended December 31, |
| 2024 | | 2023 | | 2022 |
| Da Vinci System Placements Under Leasing Arrangements | | | | | |
| Fixed-payment operating lease arrangements | 309 | | | 304 | | | 276 | |
| Usage-based operating lease arrangements | 467 | | | 355 | | | 216 | |
| Total da Vinci system placements under operating lease arrangements | 776 | | | 659 | | | 492 | |
| % of Total da Vinci system placements | 51 | % | | 48 | % | | 39 | % |
| Sales-type lease arrangements | 88 | | | 45 | | | 99 | |
| Total da Vinci system placements under leasing arrangements | 864 | | | 704 | | | 591 | |
| | | | | |
| Ion System Placements Under Leasing Arrangements | | | | | |
| Fixed-payment operating lease arrangements | 85 | | | 63 | | | 61 | |
| Usage-based operating lease arrangements | 68 | | | 54 | | | 40 | |
| Total Ion system placements under operating lease arrangements | 153 | | | 117 | | | 101 | |
| % of Total Ion system placements | 56 | % | | 55 | % | | 53 | % |
| Sales-type lease arrangements | 4 | | | 5 | | | 11 | |
| Total Ion system placements under leasing arrangements | 157 | | | 122 | | | 112 | |
Variable lease revenue recognized from usage-based operating lease arrangements has been included in our operating lease metrics herein. Operating lease revenue has grown at a faster rate than overall systems revenue and was $654 million, $501 million, and $377 million for the years ended December 31, 2024, 2023, and 2022, respectively, of which $338 million, $217 million, and $133 million, respectively, was variable lease revenue related to our usage-based operating lease arrangements.
Revenue for systems sold or placed under a sales-type lease arrangement is recognized upfront whereas revenue for fixed-payment operating lease arrangements is recognized on a straight-line basis over time. Therefore, in a period when the number of operating lease placements increases as a proportion of total system placements, total systems revenue is reduced, which can create volatility in the systems revenue recognized in any given period. We generally set fixed-payment and usage-based
operating lease arrangements’ pricing at a modest premium relative to purchased systems reflecting the time value of money and, in the case of usage-based operating lease arrangements, the risk that system utilization may fall short of anticipated levels.
Revenue for usage-based operating lease arrangements is recognized as the system is used to perform procedures. Variable usage-based arrangements create better matching of reimbursements and cost for our customers. They also reduce our customers’ overall risk and need for capital outlay. However, because the number of procedures performed in any given period can vary significantly for many reasons, including but not limited to healthcare emergencies, alternative treatment options, and patient preferences, revenue recognized from these arrangements can be highly volatile.
Customers generally do not have the right to exit or terminate a fixed-payment lease without incurring a penalty. Generally, lease transactions generate similar gross profit margins as our sale transactions. However, because of the variability in revenue recognized for usage-based lease arrangements, including our customers’ ability to exit or cancel those arrangements prior to the end of the lease term, there is no guarantee that we will recuperate the cost of the leased system, which, in turn, could adversely impact our gross profit margins if utilization of those systems are different than our expectations.
The following table summarizes our systems installed at customers under operating leasing arrangements for the years ended December 31, 2024, 2023, and 2022:
| | | | | | | | | | | | | | | | | |
| Year Ended December 31, |
| 2024 | | 2023 | | 2022 |
| Da Vinci System Installed Base under Operating Leasing Arrangements | | | | | |
| Fixed-payment operating lease arrangements | 1,307 | | | 1,204 | | | 1,018 | |
| Usage-based operating lease arrangements | 1,492 | | | 1,023 | | | 665 | |
| Total da Vinci system installed base under operating lease arrangements | 2,799 | | | 2,227 | | | 1,683 | |
| | | | | |
| | | | | |
| | | | | |
| Ion System Installed Base under Operating Leasing Arrangements | | | | | |
| Fixed-payment operating lease arrangements | 126 | | | 96 | | | 72 | |
| Usage-based operating lease arrangements | 193 | | | 118 | | | 60 | |
| Total Ion system installed base under operating lease arrangements | 319 | | | 214 | | | 132 | |
| | | | | |
| | | | | |
Our exposure to the credit risks relating to our lease financing arrangements may increase if our customers are adversely affected by economic pressures or uncertainty, changes in healthcare laws, coverage and reimbursement, or other customer-specific factors. As a result of these macroeconomic factors impacting our customers, we may be exposed to defaults under our lease financing arrangements. Moreover, usage-based operating lease arrangements generally contain no minimum payments; therefore, customers may exit such arrangements without paying a financial penalty to us.
For some operating lease arrangements, our customers are provided with the right to purchase the leased system at certain points during and/or at the end of the lease term. Revenue generated from customer purchases of systems under operating lease arrangements (“Lease Buyouts”) was $109 million, $74 million, and $72 million for the years ended December 31, 2024, 2023, and 2022, respectively. We expect that revenue recognized from customer exercises of buyout options will fluctuate based on the timing of when, and if, customers choose to exercise such buyout options.
Systems Revenue
System placements are driven by procedure growth in most geographic markets. In some markets, system placements are constrained by regulation. In geographies where da Vinci procedure adoption is in an early stage or system placements are constrained by regulation, system sales will precede procedure growth. System placements also vary due to seasonality, largely aligned with hospital budgeting cycles. On an annual basis, we typically place a higher proportion of systems in the fourth quarter and a lower proportion in the first quarter as many customer budgets are reset. Systems revenue is also affected by the proportion of system placements under operating lease arrangements, recurring fixed-payment and usage-based operating lease revenue, Lease Buyouts, product mix, ASPs, trade-in activities, customer mix, and specified-price trade-in rights. We generally do not provide specified-price trade-in rights or upgrade rights at the time of a system purchase; however, we expect that the number of arrangements that may contain these specified-price trade-in rights will increase as we continue the phased launch of our next-generation multi-port platform, da Vinci 5. For trade-in activities involving operating lease upgrades, depending on the timing and terms of the upgrade transaction, the amount of revenue generated on the initial and new lease arrangements may not, in the aggregate, generate the same amount of revenue that a traditional sale and trade-in transaction would. Systems revenue increased 17% to $1.97 billion in 2024. Systems revenue remained flat at $1.68 billion in 2023. Systems revenue declined 1% to $1.68 billion in 2022.
Procedure Mix / Products
Our da Vinci surgical systems are generally used for soft tissue surgery for areas of the body between the pelvis and the neck, primarily in general, gynecologic, urologic, cardiothoracic, and head and neck surgical procedures. Within these categories, procedures range in complexity from cancer and other highly complex procedures to less complex procedures for benign conditions. Cancer and other highly complex procedures tend to be reimbursed at higher rates than less complex procedures for benign conditions. Thus, hospitals are more sensitive to the costs associated with treating less complex, benign conditions. Our strategy is to provide hospitals with attractive clinical and economical solutions across the spectrum of procedure complexity. Our fully featured da Vinci 5 and da Vinci Xi surgical systems with advanced instruments (including da Vinci energy and da Vinci stapler products) and our Integrated Table Motion product target the more complex procedure segment. Our da Vinci X surgical system is targeted toward price-sensitive geographic markets and procedures. Our da Vinci SP surgical system complements the da Vinci 5, da Vinci X, and da Vinci Xi surgical systems by enabling surgeons to access narrow workspaces.
Procedure and Placement Seasonality
More than half of the da Vinci procedures performed are for benign conditions, most notably hernia repairs, hysterectomies, and cholecystectomies. These benign procedures and other short-term elective procedures tend to be more seasonal than cancer operations and surgeries for other life-threatening conditions. Seasonality in the U.S. for procedures for benign conditions typically results in higher fourth quarter procedure volume when more patients have met annual deductibles and lower first quarter procedure volume when deductibles are reset. Seasonality outside of the U.S. varies and is more pronounced around local holidays and vacation periods, which have lower procedure volume.
In addition, historically, placements of our da Vinci surgical systems have tended to be heavier in the fourth quarter and lighter in the first quarter, as hospital budgets are reset.
Distribution Channels
We provide our products through direct sales organizations in the U.S., Europe (excluding Italy, Spain, Portugal, Greece, and Eastern European countries), China (through our Intuitive-Fosun Pharma Joint Venture), Japan, South Korea, India, Taiwan, and Canada. In the remainder of our OUS markets, we provide our products through distributors.
Regulatory Activities
Overview
Our products must meet the requirements of a large and growing body of international regulations and standards that govern the product safety, efficacy, advertising, labeling, safety reporting design, manufacture, materials content and sourcing, testing, certification, packaging, installation, use, and disposal of our products. Examples of such standards include electrical safety standards, such as those of the International Electrotechnical Commission, and composition standards, such as the Reduction of Hazardous Substances and the Waste Electrical and Electronic Equipment Directives in the EU. Failure to meet these standards could limit our ability to market our products in those regions that require compliance with such standards.
Our products and operations are also subject to increasingly stringent medical device, privacy, and other regulations by regional, federal, state, and local authorities. After a device is placed on the market, numerous FDA and comparable foreign regulatory requirements continue to apply. These requirements include establishment registration and device listing with the FDA or other foreign regulatory authorities and compliance with medical device reporting regulations, which require that manufacturers report to the FDA or other foreign regulatory authorities if their device caused or contributed, or may have caused or contributed, to a death or serious injury or malfunctioned in a way that would likely cause or contribute to a death or serious injury if it were to recur.
We anticipate that timelines for the introduction of new products and/or indications may be extended relative to past experience as a result of these regulations. For example, we have seen elongated regulatory approval timelines in the U.S. and Europe.
Clearances, Approvals, and Certifications
We have generally obtained the regulatory clearances, approvals, and certifications required to market our products associated with our da Vinci multi-port surgical systems (da Vinci S, da Vinci Si, da Vinci Xi, and da Vinci X systems) for our targeted surgical specialties within the U.S., South Korea, Japan, and the European markets in which we operate. We have additionally obtained regulatory clearances, approvals, and certifications for the following products over the past several years:
•In December 2024, we obtained FDA clearance for the use of our da Vinci SP surgical system in colorectal surgical procedures. In July 2024, we obtained FDA clearance for the use of our da Vinci SP surgical system in general thoracoscopic surgical procedures. In April 2023, we obtained FDA clearance for the use of our da Vinci SP surgical
system in simple prostatectomy procedures. We also obtained FDA clearance for the use of our da Vinci SP surgical system in transvesical approaches to simple and radical prostatectomy.
•In December 2024, we obtained European certification in accordance with the EU MDR for our E-200 generator. In July 2023, we received regulatory clearance for our E-200 generator in Japan and South Korea. In November 2022, we obtained FDA clearance for our E-200 generator. The E-200 generator can be used in da Vinci robotic procedures, as well as non-robotic open and laparoscopic procedures, to deliver high-frequency energy for cutting, coagulation, and vessel sealing of tissues. The E-200 generator includes the same advanced energy capability as the E-100 generator and supports the same vessel sealing instruments.
•In October 2024, we obtained regulatory clearance in South Korea for our da Vinci 5 surgical system, our next-generation multi-port robotic system, for use in urologic, general, gynecologic, thoracoscopic, thoracoscopically-assisted cardiotomy, and transoral otolaryngology surgical procedures. In March 2024, we obtained FDA clearance for our da Vinci 5 surgical system for use in all surgical specialties and procedures indicated for da Vinci Xi, except for cardiac and pediatric indications as well as one contraindication related to the use of force feedback in hysterectomy and myomectomy surgical procedures. Da Vinci 5 was made available to customers in the U.S. who had collaborated with us during the development period and those with mature robotic surgery programs. We will continue working with surgeons to generate additional data on the system’s use and on expansion of our manufacturing and supply capacity before a wider commercial introduction.
•In September 2024, we obtained FDA clearance for our redesigned 8 mm SureForm 30 stapler and 8 mm SureForm 30 Curved-Tip stapler instruments and reloads for use in general, thoracic, gynecologic, urologic, and pediatric surgical procedures. In April 2024, we obtained European certification in accordance with the EU MDR for our redesigned 8 mm SureForm 30 stapler and 8 mm SureForm 30 Curved-Tip stapler instruments and reloads for use in general, thoracic, gynecologic, urologic, and pediatric surgical procedures.
•In August 2024, we obtained regulatory clearance in Taiwan for our da Vinci SP surgical system for use in endoscopic abdominopelvic, thoracoscopic, transoral otolaryngology, transanal colorectal, transanal total mesorectal excision, and breast surgical procedures. In January 2024, we obtained European certification in accordance with the EU MDR for our da Vinci SP surgical system for use in endoscopic abdominopelvic, thoracoscopic, transoral otolaryngology, transanal colorectal, and breast surgical procedures. We are commercializing the da Vinci SP surgical system in select major European countries as part of a measured rollout. In September 2022, we obtained regulatory clearance for our da Vinci SP surgical system in Japan for use in general, thoracic (excluding cardiac procedures and intercostal approaches), urologic, gynecologic, and transoral head and neck surgical procedures.
•In April 2024, we obtained FDA clearance to extend the number of uses of our catheter instrument used with our Ion endoluminal system from five to eight uses.
•In March 2024, we received NMPA regulatory clearance for our Ion endoluminal system in China. We placed our first Ion systems in China during the third quarter of 2024 and will continue our rollout of the Ion system in China in a measured fashion while we optimize training pathways and collect additional clinical data. In September 2023, we received regulatory clearance in South Korea for our Ion endoluminal system. We expect the introduction of the Ion system in South Korea to follow the refinement of our training pathways in the region and the gathering of local clinical and economic data. In March 2023, we obtained European certification in accordance with the EU MDR for our Ion endoluminal system. In Europe, we continued commercialization in the UK and are beginning to place Ion systems in continental Europe with a similar approach of initially focusing on the collection of clinical data in support of our European reimbursement strategy.
•In August 2023, following approval by China’s NMPA for a local version of our da Vinci Xi surgical system in June 2023, our Intuitive-Fosun Pharma Joint Venture received a manufacturing license that permits the Joint Venture to manufacture our da Vinci Xi surgical system for sale to customers in China.
•In March 2022, we received regulatory clearance in China to market our da Vinci Endoscope Plus. We have also received regulatory clearances in Japan and South Korea to market our da Vinci Endoscope Plus in May 2020 and December 2019, respectively. In July 2019, we obtained FDA clearance for our da Vinci Endoscope Plus, and in June 2019, we obtained European certification for our da Vinci Endoscope Plus for the da Vinci Xi and da Vinci X surgical systems.
•In February 2022, we received regulatory clearance in China to market both our 12 mm SureForm 45 stapler and SureForm 60 stapler and corresponding reloads.
•In January 2022, we received regulatory clearance in China to market our da Vinci Vessel Sealer Extend with up to 7 mm vascular indications.
Refer to the descriptions of our new products that received regulatory clearances, approvals, or certifications in 2024, 2023, and 2022 in the Recent Product Introductions section below.
In June 2023, the China National Health Commission published the 2023 Quota. Under the 2023 Quota, the government will allow for the sale of 559 new surgical robots into China, which could include da Vinci surgical systems as well as surgical systems introduced by others. As of December 31, 2024, including systems that were sold in prior quarters, we have placed 121 da Vinci surgical systems under the 2023 Quota. Future sales of da Vinci surgical systems under this and any previously published open quotas are uncertain, as they are open to other medical device companies that have introduced robotic-assisted surgical systems and are dependent on hospitals completing a tender process and receiving associated approvals. Our ability to track the number of systems that could be sold under these quotas in the future is limited by provincial and national agencies making such information publicly available.
Since 2022, several provinces in China have implemented significant limits on what hospitals can charge patients for surgeries using robotic surgical technology, including soft tissue surgery. These limits have significantly impacted the number of procedures performed and have impacted our instruments and accessories revenue in those provinces. However, as of the date of this report, these limits have not had a material impact on our business, financial condition, or results of operations, as only a small portion of our installed base in China is currently located in the impacted provinces. Companies providing robotic surgical technology, including our Joint Venture in China, have been meeting with Chinese government healthcare agencies to discuss these developments and to provide feedback. We cannot assure you that additional provincial or national healthcare agencies and administrations will not impose similar limits, and we expect to continue to face increased pricing pressure, both of which could further impact the number of procedures performed and our instruments and accessories revenue in China.
The Japanese MHLW considers reimbursement for procedures in April of even-numbered years. The process for obtaining reimbursement requires Japanese university hospitals and surgical societies, with our support, to seek reimbursement. There are multiple pathways to obtain reimbursement for procedures, including those that require in-country clinical and economic data. An additional five da Vinci procedures were granted reimbursement in April 2024, including lobectomy for benign conditions. In addition, we received higher reimbursement for certain da Vinci rectal resection procedures, as compared to open procedure reimbursements. The additional reimbursed procedures have varying levels of conventional laparoscopic penetration and will generally be reimbursed at rates equal to the conventional laparoscopic procedures. Given the reimbursement level and laparoscopic penetration for these additional procedures, there can be no assurance that the adoption pace for these procedures will be similar to prostatectomy or partial nephrectomy, given their higher reimbursement, or any other da Vinci procedure.
Field Actions, Recalls, and Corrections
Medical device companies have regulatory obligations to correct or remove medical devices in the field that could pose a risk to health. The definition of “recalls and corrections” is expansive and includes repair, replacement, inspections, relabeling, and issuance of new or additional instructions for use or reinforcement of existing instructions for use and training when such actions are taken for specific reasons of safety or compliance. These field actions require stringent documentation, reporting, and monitoring worldwide. There are other actions that a medical device manufacturer may take in the field without reporting including, but not limited to, routine servicing and stock rotations.
As we determine whether a field action is reportable in any regulatory jurisdiction, we prepare and submit notifications to the appropriate regulatory agency for the particular jurisdiction. Regulators can require the expansion, reclassification, or change in scope and language of the field action. In general, upon submitting required notifications to regulators regarding a field action that is a recall or correction, we will notify customers regarding the field action, provide any additional documentation required in their national language, and arrange, as required, the return or replacement of the affected product or a field service visit to perform the correction.
Field actions, as well as certain outcomes from regulatory activities, can result in adverse effects on our business, including damage to our reputation, delays by customers of purchase decisions, reduction or stoppage of the use of installed systems, and reduced revenue as well as increased expenses.
Procedures
We model patient value as equal to procedure efficacy / invasiveness. In this equation, procedure efficacy is defined as a measure of the success of the procedure in resolving the underlying disease, and invasiveness is defined as a measure of patient pain and disruption of regular activities. When the patient value of a robotic-assisted procedure is greater than that of alternative treatment options, patients may benefit from seeking out surgeons or physicians and hospitals that offer robotic-assisted medical procedures, which could potentially result in a local market share shift. Adoption of robotic-assisted procedures occurs by procedure and by market and is driven by the relative patient value and total treatment costs of robotic-assisted procedures as compared to alternative treatment options for the same disease state or condition.
We use the number and type of procedures as metrics for financial and operational decision-making and as a means to evaluate period-to-period comparisons. Management believes that the number and type of procedures provide meaningful supplemental information regarding our performance, as management believes procedure volume is an indicator of the rate of adoption of our robotic-assisted medical procedures as well as an indicator of future revenue (including revenue from usage-
based operating lease arrangements). Management believes that both it and investors benefit from referring to the number and type of procedures in assessing our performance and when planning, forecasting, and analyzing future periods. The number and type of procedures also facilitate management’s internal comparisons of our historical performance. We believe that the number and type of procedures are useful to investors as metrics, because (1) they allow for greater transparency with respect to key metrics used by management in its financial and operational decision-making, and (2) they are used by institutional investors and the analyst community to help them analyze the performance of our business. The vast majority of our installed systems are connected via the internet. System logs can also be accessed by field engineers for systems that are not connected to the internet. We utilize certain methods that rely on information collected from the installed systems for determining the number and type of procedures performed that involve estimates and judgments, which are, by their nature, subject to substantial uncertainties and assumptions. Estimates and judgments for determining the number and type of procedures may be impacted over time by various factors, including changes in treatment modalities, hospital and distributor reporting behavior, and system internet connectivity. Such estimates and judgments are also susceptible to algorithmic or other technical errors. In addition, the relationship between the number and type of procedures and our revenues may fluctuate from period to period, and procedure volume growth may not correspond to an increase in revenue. The number and type of procedures are not intended to be considered in isolation or as a substitute for, or superior to, revenue or other financial information prepared and presented in accordance with GAAP.
Da Vinci Procedures
The adoption of robotic-assisted surgery using the da Vinci surgical system has the potential to grow for those procedures that offer greater patient value than to non-da Vinci alternatives and competitive total economics for healthcare providers. Our da Vinci surgical systems are used primarily in general, gynecologic, urologic, cardiothoracic, and head and neck surgical procedures. We focus our organization and investments on developing, marketing, and training products and services for procedures in which da Vinci can bring patient value relative to alternative treatment options and/or economic benefit to healthcare providers. Target procedures in general surgery include hernia repair (both ventral and inguinal), colorectal, cholecystectomy, and bariatric procedures. Target procedures in urology include prostatectomy and partial nephrectomy. Target procedures in gynecology include hysterectomy for both cancer and benign conditions and sacrocolpopexy. In cardiothoracic surgery, target procedures include lung resection. In head and neck surgery, target procedures include transoral surgery. Not all indications, procedures, or products described may be available in a given country or region or on all generations of da Vinci surgical systems. Surgeons and their patients need to consult the product labeling in their specific country and for each product in order to determine the cleared uses, as well as important limitations, restrictions, or contraindications.
In 2024, approximately 2,683,000 surgical procedures were performed with da Vinci surgical systems, compared to approximately 2,286,000 and 1,875,000 surgical procedures performed with da Vinci surgical systems in 2023 and 2022, respectively. The increase in our overall procedure volume in 2024 was largely attributable to growth in U.S. general surgery, OUS general surgery (particularly cancer), OUS urologic surgery, and U.S. gynecologic surgery procedures. The overall procedure volume in the 2022 comparative year reflects disruption caused by the COVID-19 pandemic.
U.S. da Vinci Procedures
Overall U.S. procedure volume with da Vinci surgical systems grew to approximately 1,757,000 in 2024, compared to approximately 1,532,000 in 2023 and approximately 1,282,000 in 2022. General surgery was our largest and fastest growing U.S. specialty in 2024 with procedure volume that grew to approximately 1,063,000 in 2024, compared to approximately 896,000 in 2023 and approximately 720,000 in 2022. Gynecology was our second largest U.S. surgical specialty in 2024 with procedure volume that grew to approximately 423,000 in 2024, compared to approximately 390,000 in 2023 and approximately 341,000 in 2022. Urology was our third largest U.S. surgical specialty in 2024 with procedure volume that grew to approximately 186,000 in 2024, compared to approximately 173,000 in 2023 and approximately 162,000 in 2022.
OUS da Vinci Procedures
Overall OUS procedure volume with da Vinci surgical systems grew to approximately 926,000 in 2024, compared to approximately 754,000 in 2023 and approximately 593,000 in 2022. Urology was our largest OUS surgical specialty in 2024 with procedure volume that grew to approximately 435,000 in 2024, compared to approximately 381,000 in 2023 and approximately 316,000 in 2022. General surgery was our second largest and fastest growing OUS specialty in 2024 with procedure volume that grew to approximately 254,000 in 2024, compared to approximately 188,000 in 2023 and approximately 133,000 in 2022. Gynecology was our third largest OUS surgical specialty in 2024 with procedure volume that grew to approximately 142,000 in 2024, compared to approximately 110,000 in 2023 and approximately 86,000 in 2022.
Ion Procedures
The adoption of robotic-assisted bronchoscopy using the Ion endoluminal system has the potential to grow if it can offer greater patient value than non-Ion alternatives and competitive total economics for healthcare providers.
In 2024, approximately 95,500 biopsy procedures were performed with Ion systems, compared to approximately 53,800 in 2023 and approximately 23,500 in 2022. The increase in our overall procedure volume in 2024 reflects a larger installed base of approximately 805 systems, an increase of 51% compared to the installed base of approximately 534 systems as of 2023. Currently, the vast majority of Ion biopsy procedures are performed in the U.S.
Recent Business Events and Trends
Procedures
Overall. Total da Vinci procedures performed by our customers grew approximately 17% in 2024, compared to approximately 22% in 2023. We believe that the growth in the comparative 2023 procedure results for both U.S. and OUS procedures partially reflected a benefit from procedures performed related to the backlog of patient treatments that resulted from COVID-19, as noted in the COVID-19 Pandemic section above. The 2024 procedure growth was largely attributable to growth in U.S. general surgery, OUS general surgery (particularly cancer), OUS urologic surgery, and U.S. gynecologic surgery procedures.
U.S. Procedures. U.S. da Vinci procedures grew approximately 15% in 2024, compared to approximately 19% in 2023. The 2024 U.S. procedure growth was largely attributable to strong growth in general surgery procedures, most notably cholecystectomy, hernia repair, and colorectal procedures. The number of U.S. da Vinci bariatric procedures performed declined modestly in 2024 compared to 2023. It is unclear whether the overall decline in the U.S. for surgical bariatric procedures will continue as patients evaluate new drug therapies and, if the decline continues, it is unclear what the rate of decline will be.
U.S. General Surgery. General surgery procedures in the U.S. grew approximately 19% in 2024, compared to approximately 25% in 2023. Cholecystectomy, inguinal and ventral hernia repair, and colorectal procedures contributed the most incremental procedures in both 2024 and 2023.
Given the already very high level of laparoscopic techniques used in cholecystectomy, it remains unclear to what extent robotic-assisted surgery using da Vinci may continue to be adopted.
We believe that growth in hernia repair using da Vinci reflects improved clinical outcomes within certain patient populations, as well as potential cost benefits relative to certain alternative treatments. We believe that hernia repair procedures represent a significant opportunity with the potential to drive growth in future periods. However, given the differences in surgical complexity associated with the treatment of various hernia patient populations and varying surgeon opinions regarding optimal surgical technique, it is difficult to estimate the timing of and to what extent hernia repair procedure volume will grow in the future. We expect a large portion of hernia repairs will continue to be performed via different modalities of surgery.
The adoption of da Vinci for colorectal procedures, which includes several underlying procedures, such as low anterior resections for rectal cancers and certain colon procedures for benign and cancerous conditions, has been ongoing for several years and is supported by certain technologies, such as our da Vinci energy and da Vinci stapler products as well as our Integrated Table Motion product.
U.S. Gynecology. Gynecology procedures in the U.S. grew approximately 8% in 2024, compared to approximately 15% in 2023. Benign hysterectomy procedures contributed the most incremental procedures in 2024 and 2023. The growth in benign hysterectomy procedures has been largely driven by new surgeon training.
OUS Procedures. OUS da Vinci procedures grew approximately 23% in 2024, compared to approximately 27% in 2023. The 2024 OUS procedure growth was driven by growth in general surgery procedures, most notably colorectal and hernia repair procedures, urologic procedures, most notably prostatectomy and partial nephrectomy procedures, and gynecologic procedures. The 2024 OUS procedure growth rate reflects continued da Vinci adoption in European and Asian markets. We saw strong procedure growth in Germany, the UK, India, and Italy during 2024. We believe that growth in these global markets is being driven by increased acceptance among surgeons and health systems, supported by expanded global evidence validating the clinical and economic value of da Vinci procedures as well as increased surgeon training. In South Korea, we believe that the number of procedures performed were significantly negatively impacted by doctor strikes in the country during 2024. The extent of the continued impact of these strikes on procedures in South Korea remains uncertain.
OUS General Surgery. OUS general surgery procedures grew approximately 35% in 2024, compared to approximately 42% in 2023. Colorectal procedures contributed the most incremental procedures in 2024 and 2023, aided by improved clinical outcomes relative to open and laparoscopic techniques within certain patient populations, along with enabling technologies, such as our da Vinci energy and da Vinci stapler products as well as our Integrated Table Motion product.
OUS Urology. OUS urology procedures have been a consistent contributor to our overall procedure growth. OUS urology procedures grew approximately 14% in 2024, compared to approximately 21% in 2023. In the U.S., da Vinci is the standard of care for the surgical treatment of prostate cancer, and we believe that the growth is largely aligned with surgical volumes of prostate cancer. In OUS markets, prostatectomy is at varying states of adoption in different areas of the world but is the largest overall da Vinci procedure. In 2024, we saw more moderate growth in OUS prostatectomy procedures compared to higher growth in 2023, as we are further up the adoption curve.
Kidney cancer procedures have also been a strong contributor to our recent global urology procedure growth. Clinical publications have demonstrated that the use of a da Vinci system increases the likelihood that a patient will receive nephron sparing surgery through a partial nephrectomy, which is typically the surgical society guideline recommended therapy.
System Demand
We placed 1,526 da Vinci surgical systems in 2024, compared to 1,370 systems in 2023. The increase in system placements reflects incremental demand for our next-generation da Vinci 5 system and continued demand for additional capacity by our customers as a result of procedure growth, partially offset by a smaller number of third-generation da Vinci systems available for trade-in. During 2024, we placed 362 da Vinci 5 systems.
We continue to see some customers challenged by staffing shortages, decreased government funding in healthcare (particularly in Europe), and other financial pressures. As a result, we expect our customers to continue to be cautious in their overall capital spending. In addition, system demand in China has been impacted by increasing robotic-assisted surgical system competition from domestic companies as well as a broader central government focus on systematic governance. Targeting the healthcare sector, this campaign was initially launched by the Chinese government in July 2023 and has resulted in heightened scrutiny by medical institutions with respect to initiating tenders, with some tenders being canceled or delayed without a timeline. In 2024, the effects of this campaign, combined with the competitive dynamics in China, contributed to fewer systems being placed in China than we anticipated. Currently, the extent and impact of this campaign and the competitive dynamics in China on our business remains uncertain.
We expect that future placements of da Vinci surgical systems will be impacted by a number of factors: supply chain risks; economic and geopolitical factors; inflationary pressures; high interest rates; hospital staffing shortages; procedure growth rates; evolving system utilization and point-of-care dynamics; capital replacement trends, including a declining number of older generation systems available for trade-in transactions; additional reimbursements in various global markets, such as in Japan; the timing around governmental tenders and authorizations, as well as governmental actions impacting the tender process, such as the governance campaign in China; hospitals’ response to the evolving healthcare environment; the timing of when we receive regulatory clearance in our other OUS markets for our da Vinci 5, da Vinci X, da Vinci Xi, and da Vinci SP surgical systems and related instruments; and the market response.
Demand may also be impacted by the competition we currently face, or expect to face, from companies offering products for open or MIS surgeries, companies providing other therapeutic approaches for target clinical conditions, and companies developing diagnostic solutions that could serve as alternatives to current or planned Intuitive offerings. Companies that have introduced products in the field of robotic-assisted medical procedures, or have made explicit statements about their efforts to enter the field, include, but are not limited to, the following: Beijing Surgerii Robotics Company Limited; CMR Surgical Ltd.; Distalmotion SA; Harbin Sizhe Rui Intelligent Medical Equipment Co., Ltd.; Johnson & Johnson; Karl Storz SE & Co. KG; Medicaroid Corporation; Medtronic plc; meerecompany Inc.; Noah Medical; Shandong Weigao Group Medical Polymer Company Ltd.; Shanghai Microport Medbot (Group) Co., Ltd.; Shenzhen Edge Medical Co., Ltd.; and SS Innovations International, Inc.
Many of the above factors will also impact future demand for our Ion endoluminal system, as we extend our commercial offering into diagnostics, along with additional factors associated with a new product introduction, including, but not limited to, our ability to optimize manufacturing and our supply chain, competition, clinical data to demonstrate value, and market acceptance.
Recent Product Introductions
Da Vinci 5. Da Vinci 5 builds on da Vinci Xi’s highly functional design, featuring force feedback technology and instruments that enable surgeons to sense and measure the force exerted on tissue during surgery. It also includes new surgeon controllers, powerful vibration and tremor controls, a next-generation 3D display and image system, and throughput and workflow enhancements, such as an integrated electrosurgical unit and insufflation capabilities technology. Da Vinci 5 has more than 10,000 times the computing power of da Vinci Xi, allowing for innovative new system capabilities and advanced digital experiences, including integration with our My Intuitive app, SimNow (virtual reality simulator), Case Insights (computational observer), and Intuitive Hub (edge computing system). Additionally, the redesigned console provides greater surgeon comfort with customizable positioning, allowing surgeons to find their best fit for surgical viewing and comfort, including the ability to sit completely upright.
E-200 Generator. The E-200 generator is an advanced electrosurgical generator designed to provide high-frequency energy for cutting, coagulation, and vessel sealing of tissues. The E-200 generator is integrated with the da Vinci 5 surgical system, is compatible with the da Vinci X and Xi surgical systems, and can also function as a standalone electrosurgical generator. When connected to a da Vinci system, the E-200 delivers high-frequency energy to da Vinci instruments, with control and status messages communicated through an Ethernet cable. The E-200 generator is also compatible with third-party handheld monopolar and bipolar instruments, as well as fingerswitch-equipped instruments and Intuitive-provided auxiliary footswitches.
The E-200 generator includes the same advanced energy capability as the E-100 generator and supports the same vessel sealing instruments.
SureForm 30 Curved-Tip Stapler and Reloads. The 8 mm SureForm 30 Curved-Tip stapler and reloads (gray, white, and blue) was designed to help surgeons better visualize and reach anatomy through a combination of the 8 mm diameter instrument shaft and jaws, 120-degree cone of wristed articulation, and the curved tip. As it fits through the 8 mm da Vinci surgical system instrument cannula, the stapler allows different angles for surgeons to approach patient anatomy. Consistent with our other SureForm staplers, the 8 mm SureForm 30 Curved-Tip stapler integrates SmartFire technology, which makes automatic adjustments to the firing process as staples are formed and the transection is made. The technology makes more than 1,000 measurements per second, helping achieve a consistent staple line.
Intuitive Ventures
In 2020, we launched Intuitive Ventures Fund I, an inaugural $100 million fund focused on investment opportunities in companies that share Intuitive’s commitment to advancing positive outcomes in healthcare. As of December 31, 2024, we have invested $63 million of the $100 million.
In late 2023, we launched Intuitive Ventures Fund II, a $150 million fund focused on investment opportunities in companies reimagining the future of minimally invasive care. As of December 31, 2024, we have invested $5 million of the $150 million.
2024 Operational and Financial Highlights
•Total revenue increased by 17% to $8.4 billion for the year ended December 31, 2024, compared to $7.1 billion for the year ended December 31, 2023.
•Approximately 2,683,000 da Vinci procedures were performed during the year ended December 31, 2024, an increase of 17% compared to approximately 2,286,000 da Vinci procedures for the year ended December 31, 2023.
•Approximately 95,500 Ion procedures were performed during the year ended December 31, 2024, an increase of 78% compared to approximately 53,800 Ion procedures for the year ended December 31, 2023.
•Instruments and accessories revenue increased by 19% to $5.08 billion for the year ended December 31, 2024, compared to $4.28 billion for the year ended December 31, 2023.
•Systems revenue increased by 17% to $1.97 billion for the year ended December 31, 2024, compared to $1.68 billion for the year ended December 31, 2023.
•1,526 da Vinci surgical systems were placed during the year ended December 31, 2024, an increase of 11% compared to 1,370 systems during the year ended December 31, 2023.
•As of December 31, 2024, we had a da Vinci surgical system installed base of approximately 9,902 systems, an increase of 15% compared to the installed base of approximately 8,606 systems as of December 31, 2023.
•Utilization of da Vinci surgical systems, measured in terms of procedures per system per year, increased 2% relative to 2023.
•271 Ion systems were placed during the year ended December 31, 2024, an increase of 27% compared to 213 systems during the year ended December 31, 2023.
•As of December 31, 2024, we had an Ion system installed base of approximately 805 systems, an increase of 51% compared to the installed base of approximately 534 systems as of December 31, 2023.
•Gross profit as a percentage of revenue was 67.5% for the year ended December 31, 2024, compared to 66.4% for the year ended December 31, 2023.
•Operating income increased by 33% to $2.35 billion for the year ended December 31, 2024, compared to $1.77 billion for the year ended December 31, 2023. Operating income included $688 million and $598 million of share-based compensation expense related to employee stock plans and $22.6 million and $31.2 million of intangible asset-related charges for the years ended December 31, 2024, and 2023, respectively.
•As of December 31, 2024, we had $8.83 billion in cash, cash equivalents, and investments. Cash, cash equivalents, and investments increased by $1.49 billion, compared to $7.34 billion as of December 31, 2023, primarily as a result of cash provided by operating activities and proceeds from stock option exercises and employee stock purchases, partially offset by cash used for capital expenditures and taxes paid related to net share settlements of equity awards.
Results of Operations
The following discussion should be read in conjunction with our Consolidated Financial Statements and Notes thereto. This section of the Annual Report on Form 10-K generally discusses 2024 and 2023 items and year-to-year comparisons between 2024 and 2023. Discussions of 2022 items and year-to-year comparisons between 2023 and 2022 that are not included in this report on Form 10-K can be found in “Management’s Discussion and Analysis of Financial Condition and Results of Operations” in Part II, Item 7 of the Company’s Annual Report on Form 10-K for the fiscal year ended December 31, 2023.
The following table sets forth, for the years indicated, certain Consolidated Statements of Income information (in millions, except percentages):
| | | | | | | | | | | | | | | | | | | | | | | | | | | | | | | | | | | |
| | Years Ended December 31, |
| | 2024 | | % of total Revenue | | 2023 | | % of total Revenue | | 2022 | | % of total Revenue |
| Revenue: | | | | | | | | | | | |
| Product | $ | 7,045.0 | | | 84 | % | | $ | 5,956.3 | | | 84 | % | | $ | 5,198.0 | | | 84 | % |
| Service | 1,307.1 | | | 16 | % | | 1,167.8 | | | 16 | % | | 1,024.2 | | | 16 | % |
| Total revenue | 8,352.1 | | | 100 | % | | 7,124.1 | | | 100 | % | | 6,222.2 | | | 100 | % |
| Cost of revenue: | | | | | | | | | | | |
| Product | 2,313.1 | | | 28 | % | | 2,041.8 | | | 29 | % | | 1,700.3 | | | 28 | % |
| Service | 404.8 | | | 5 | % | | 352.8 | | | 5 | % | | 325.9 | | | 5 | % |
| Total cost of revenue | 2,717.9 | | | 33 | % | | 2,394.6 | | | 34 | % | | 2,026.2 | | | 33 | % |
| Product gross profit | 4,731.9 | | | 56 | % | | 3,914.5 | | | 55 | % | | 3,497.7 | | | 56 | % |
| Service gross profit | 902.3 | | | 11 | % | | 815.0 | | | 11 | % | | 698.3 | | | 11 | % |
| Gross profit | 5,634.2 | | | 67 | % | | 4,729.5 | | | 66 | % | | 4,196.0 | | | 67 | % |
| Operating expenses: | | | | | | | | | | | |
| Selling, general and administrative | 2,140.0 | | | 25 | % | | 1,963.9 | | | 27 | % | | 1,739.9 | | | 28 | % |
| Research and development | 1,145.3 | | | 14 | % | | 998.8 | | | 14 | % | | 879.0 | | | 14 | % |
| Total operating expenses | 3,285.3 | | | 39 | % | | 2,962.7 | | | 41 | % | | 2,618.9 | | | 42 | % |
| Income from operations | 2,348.9 | | | 28 | % | | 1,766.8 | | | 25 | % | | 1,577.1 | | | 25 | % |
| Interest and other income, net | 324.9 | | | 4 | % | | 192.1 | | | 3 | % | | 29.7 | | | 1 | % |
| Income before taxes | 2,673.8 | | | 32 | % | | 1,958.9 | | | 28 | % | | 1,606.8 | | | 26 | % |
| Income tax expense | 336.3 | | | 4 | % | | 141.6 | | | 2 | % | | 262.4 | | | 4 | % |
| Net income | 2,337.5 | | | 28 | % | | 1,817.3 | | | 26 | % | | 1,344.4 | | | 22 | % |
| Less: net income attributable to noncontrolling interest in joint venture | 14.9 | | | — | % | | 19.3 | | | 1 | % | | 22.1 | | | 1 | % |
| Net income attributable to Intuitive Surgical, Inc. | $ | 2,322.6 | | | 28 | % | | $ | 1,798.0 | | | 25 | % | | $ | 1,322.3 | | | 21 | % |
| | | | | | | | | | | |
| | | | | | | | | | | |
| | | | | | | | | | | |
| | | | | | | | | | | |
| | | | | | | | | | | |
| | | | | | | | | | | |
| | | | | | | | | | | |
| | | | | | | | | | | |
| | | | | | | | | | | |
| | | | | | | | | | | |
| | | | | | | | | | | |
| | | | | | | | | | | |
Total Revenue
Total revenue increased by 17% to $8.4 billion for the year ended December 31, 2024, compared to $7.1 billion for the year ended December 31, 2023. Total revenue for the year ended December 31, 2023, increased by 14% compared to $6.2 billion for the year ended December 31, 2022. The increase in total revenue for the year ended December 31, 2024, resulted from 19% higher instruments and accessories revenue, 17% higher systems revenue, and 12% higher service revenue.
We generally sell our products and services in local currencies where we have direct distribution channels. Revenue denominated in foreign currencies as a percentage of total revenue was approximately 24%, 25%, and 24% for the years ended December 31, 2024, 2023, and 2022, respectively. Fluctuations in foreign currency exchange rates had an unfavorable impact on OUS total revenue of $34 million for the year ended December 31, 2024, as compared to 2023. Fluctuations in foreign currency exchange rates had an unfavorable impact on OUS total revenue of $29 million for the year ended December 31, 2023, as compared to 2022. The impact of fluctuations in foreign currency exchange rates was determined by comparing current period revenue converted to USD using exchange rates that were effective in the comparable prior year period, net of the impacts from foreign currency hedging.
Revenue generated in the U.S. accounted for 67%, 66%, and 67% of total revenue for the years ended December 31, 2024, 2023, and 2022, respectively. We believe that U.S. revenue has accounted for the large majority of total revenue due to U.S. patients’ ability to choose their provider and method of treatment, reimbursement structures supportive of innovation and MIS, and our initial investments focused on U.S. infrastructure. We have been investing in our business in OUS markets, and our OUS procedures have grown faster in proportion to U.S. procedures. We expect that our OUS procedures and revenue will make up a greater portion of our business in the long term.
The following table summarizes our revenue and system unit placements for the years ended December 31, 2024, 2023, and 2022, respectively (in millions, except percentages and unit placements):
| | | | | | | | | | | | | | | | | |
| | Years Ended December 31, |
| | 2024 | | 2023 | | 2022 |
| Revenue | | | | | |
| Instruments and accessories | $ | 5,079.0 | | | $ | 4,276.6 | | | $ | 3,517.9 | |
| Systems | 1,966.0 | | | 1,679.7 | | | 1,680.1 | |
| Total product revenue | 7,045.0 | | | 5,956.3 | | | 5,198.0 | |
| Services | 1,307.1 | | | 1,167.8 | | | 1,024.2 | |
| Total revenue | $ | 8,352.1 | | | $ | 7,124.1 | | | $ | 6,222.2 | |
| U.S. | $ | 5,589.4 | | | $ | 4,688.6 | | | $ | 4,157.6 | |
| OUS | 2,762.7 | | | 2,435.5 | | | 2,064.6 | |
| Total revenue | $ | 8,352.1 | | | $ | 7,124.1 | | | $ | 6,222.2 | |
| % of Revenue — U.S. | 67% | | 66% | | 67% |
| % of Revenue — OUS | 33% | | 34% | | 33% |
| | | | | |
| Instruments and accessories | $ | 5,079.0 | | | $ | 4,276.6 | | | $ | 3,517.9 | |
| Services | 1,307.1 | | | 1,167.8 | | | 1,024.2 | |
| Operating lease revenue | 654.2 | | | 500.5 | | | 376.5 | |
| Total recurring revenue | $ | 7,040.3 | | | $ | 5,944.9 | | | $ | 4,918.6 | |
| % of Total revenue | 84% | | 83% | | 79% |
| | | | | |
| Da Vinci Surgical System Placements by Region | | | | | |
| U.S. unit placements | 800 | | | 666 | | | 692 | |
| OUS unit placements | 726 | | | 704 | | | 572 | |
| Total unit placements* | 1,526 | | | 1,370 | | | 1,264 | |
| *Systems placed under fixed-payment operating lease arrangements (included in total unit placements) | 309 | | | 304 | | | 276 | |
| *Systems placed under usage-based operating lease arrangements (included in total unit placements) | 467 | | | 355 | | | 216 | |
| | | | | |
| Da Vinci Surgical System Placements involving System Trade-ins | | | | | |
| Unit placements involving trade-ins | 150 | | | 240 | | | 345 | |
| Unit placements not involving trade-ins | 1,376 | | | 1,130 | | | 919 | |
| | | | | |
Ion System Placements** | 271 | | | 213 | | | 192 | |
| **Systems placed under fixed-payment operating lease arrangements (included in total unit placements) | 85 | | | 63 | | | 61 | |
| **Systems placed under usage-based operating lease arrangements (included in total unit placements) | 68 | | | 54 | | | 40 | |
Product Revenue
Product revenue increased by 18% to $7.05 billion for the year ended December 31, 2024, compared to $5.96 billion for the year ended December 31, 2023. Product revenue for the year ended December 31, 2023, increased by 15% compared to $5.20 billion for the year ended December 31, 2022.
Instruments and accessories revenue increased by 19% to $5.08 billion for the year ended December 31, 2024, compared to $4.28 billion for the year ended December 31, 2023. The increase in instruments and accessories revenue was primarily driven by approximately 17% higher da Vinci procedure volume, approximately 78% higher Ion procedure volume, and higher pricing for da Vinci instruments and accessories, partially offset by customer buying patterns. The 2024 U.S. da Vinci procedure growth was approximately 15%, driven primarily by strong growth in general surgery procedures, most notably cholecystectomy, hernia repair, and colorectal procedures. The number of U.S. da Vinci bariatric procedures performed declined modestly in 2024 compared to 2023. It is unclear whether the overall decline in the U.S. for surgical bariatric procedures will continue as patients evaluate new drug therapies and, if the decline continues, it is unclear what the rate of decline will be. The 2024 OUS da Vinci procedure growth was approximately 23%, driven by growth in general surgery procedures, most notably colorectal and hernia repair procedures, urologic procedures, most notably prostatectomy and partial nephrectomy procedures, and gynecologic procedures. Geographically, the 2024 OUS da Vinci procedure growth was driven by several markets with particular strength in Germany, the UK, India, and Italy.
Systems revenue increased by 17% to $1.97 billion for the year ended December 31, 2024, compared to $1.68 billion for the year ended December 31, 2023. The higher system revenue for the year ended December 31, 2024, was primarily driven by an increase in da Vinci system placements, higher operating lease revenue, higher ASPs, and higher lease buyout revenue, partially offset by a higher proportion of da Vinci system placements under operating leases.
During 2024, 1,526 da Vinci surgical systems were placed compared to 1,370 systems during 2023. By geography, 800 systems were placed in the U.S., 309 in Europe, 321 in Asia, and 96 in other OUS markets during 2024, compared to 666 systems placed in the U.S., 308 in Europe, 305 in Asia, and 91 in other OUS markets during 2023. The increase in system placements was primarily driven by 362 da Vinci 5 system placements and continued demand for additional capacity by our customers as a result of procedure growth, partially offset by a smaller number of third-generation da Vinci systems available for trade-in. As of December 31, 2024, we had a da Vinci surgical system installed base of approximately 9,902 systems, compared to an installed base of approximately 8,606 systems as of December 31, 2023. The incremental system installed base reflects continued procedure growth and further customer validation that robotic-assisted surgery addresses their Quintuple Aim objectives.
The following table summarizes our da Vinci system placements and systems installed at customers under leasing arrangements for the years ended December 31, 2024, and 2023:
| | | | | | | | | | | |
| Year Ended December 31, |
| 2024 | | 2023 |
| Da Vinci System Placements under Leasing Arrangements | | | |
| Fixed-payment operating lease arrangements | 309 | | | 304 | |
| Usage-based operating lease arrangements | 467 | | | 355 | |
| Total da Vinci system placements under operating lease arrangements | 776 | | | 659 | |
| % of Total da Vinci system placements | 51% | | 48% |
| Sales-type lease arrangements | 88 | | | 45 | |
| Total da Vinci system placements under leasing arrangements | 864 | | | 704 | |
| | | |
| Da Vinci System Installed Base under Operating Leasing Arrangements | | | |
| Fixed-payment operating lease arrangements | 1,307 | | | 1,204 | |
| Usage-based operating lease arrangements | 1,492 | | | 1,023 | |
| Total da Vinci system installed base under operating leasing arrangements | 2,799 | | | 2,227 | |
Operating lease revenue, including the contribution from Ion systems, was $654 million for the year ended December 31, 2024, of which $338 million was variable lease revenue related to usage-based arrangements, compared to $501 million for the year ended December 31, 2023, of which $217 million was variable lease revenue related to usage-based arrangements. Revenue from Lease Buyouts was $108.9 million for the year ended December 31, 2024, compared to $74.2 million for the year ended December 31, 2023. We expect revenue from Lease Buyouts to fluctuate period to period depending on the timing of when, and if, customers choose to exercise buyout options embedded in their leases.
The da Vinci surgical system ASP, excluding systems placed under fixed-payment or usage-based operating lease arrangements, Ion systems, and the impact of specified-price trade-in rights, was approximately $1.50 million for the year ended December 31, 2024, compared to approximately $1.42 million for the year ended December 31, 2023. The higher ASP for the year ended December 31, 2024, was largely driven by favorable product mix, including from da Vinci 5 sales, and fewer trade-ins, partially offset by higher pricing discounts. ASP fluctuates from period to period based on geographic and product mix, product pricing, systems placed involving trade-ins, and changes in foreign exchange rates.
During 2024, 271 Ion systems were placed compared to 213 systems during 2023. By geography, 253 systems were placed in the U.S., 14 in Europe, and 4 in Asia during 2024, compared to 211 systems placed in the U.S. and 2 systems in Europe during 2023. The increase in system placements was primarily driven by the demand for additional capacity by our customers due to the procedure growth and OUS expansion. As of December 31, 2024, we had an Ion system installed base of approximately 805 systems, compared to an installed base of approximately 534 systems as of December 31, 2023.
The following table summarizes our Ion system placements and systems installed at customers under leasing arrangements for the years ended December 31, 2024, and 2023:
| | | | | | | | | | | |
| Year Ended December 31, |
| 2024 | | 2023 |
| Ion System Placements under Leasing Arrangements | | | |
| Fixed-payment operating lease arrangements | 85 | | | 63 | |
| Usage-based operating lease arrangements | 68 | | | 54 | |
| Total Ion system placements under operating lease arrangements | 153 | | | 117 | |
| % of Total Ion system placements | 56% | | 55% |
| Sales-type lease arrangements | 4 | | | 5 | |
| Total Ion system placements under leasing arrangements | 157 | | | 122 | |
| | | |
| Ion System Installed Base under Operating Leasing Arrangements | | | |
| Fixed-payment operating lease arrangements | 126 | | | 96 | |
| Usage-based operating lease arrangements | 193 | | | 118 | |
| Total Ion system installed base under operating leasing arrangements | 319 | | | 214 | |
| | | |
| | | |
Service Revenue
Service revenue increased by 12% to $1.31 billion for the year ended December 31, 2024, compared to $1.17 billion for the year ended December 31, 2023. The increase in service revenue for the year ended December 31, 2024, was primarily driven by a larger installed base of systems producing service revenue, partially offset by a higher proportion of early-stage usage-based operating lease arrangements where procedures are ramping up.
Gross Profit
Product
Product gross profit for the year ended December 31, 2024, increased by 21% to $4.73 billion, representing 67.2% of product revenue, compared to $3.91 billion, representing 65.7% of product revenue, for the year ended December 31, 2023. The higher product gross profit margin for the year ended December 31, 2024, was primarily driven by leverage on fixed overhead costs, lower logistics costs, and lower excess and obsolete inventory charges, partially offset by higher costs associated with our da Vinci 5 surgical system launch.
Product gross profit for the years ended December 31, 2024, and 2023, included share-based compensation expense of $98.5 million and $83.4 million, respectively, and intangible assets amortization expense of $11.5 million and $13.5 million, respectively.
Our capital expenditures increased during 2024, as we continued to build the infrastructure needed to scale our business. As a result, beginning in 2025, we expect depreciation expense to increase, which may impact our future gross profit margin.
In 2025, the new U.S. presidential administration has proposed new and incremental tariffs on goods imported to the U.S. Specifically, tariffs of 25% could be imposed on imports from Mexico where a significant majority of our instruments and accessories are manufactured. In addition, we import raw materials and finished goods from sources outside of the U.S., which could also be subject to tariffs, such as our endoscopes, which are primarily manufactured in Germany. If the tariffs are implemented as proposed and noted above, we expect that the estimated decrease in our gross profit in 2025 could be material.
The ultimate impact of any tariffs will depend on various factors, including if any tariffs are ultimately implemented, the timing of implementation, and the amount, scope, and nature of the tariffs.
Service
Service gross profit for the year ended December 31, 2024, increased by 11% to $0.90 billion, representing 69.0% of service revenue, compared to $0.82 billion, representing 69.8% of service revenue, for the year ended December 31, 2023. The higher service gross profit for the year ended December 31, 2024, was primarily driven by higher service revenue, reflecting a larger installed base of systems, and a lower service gross profit margin. The lower service gross profit margin for the year ended December 31, 2024, was primarily driven by an unfavorable repair mix and higher excess and obsolete inventory charges, partially offset by fixed cost leverage from higher repair volume.
Service gross profit for the years ended December 31, 2024, and 2023, included share-based compensation expense of $30.5 million and $28.2 million, respectively, and intangible assets amortization expense of $0.8 million and $0.9 million, respectively.
Selling, General and Administrative Expenses
Selling, general and administrative expenses include costs for sales, marketing, and administrative personnel, sales and marketing activities, trade show expenses, legal expenses, regulatory fees, and general corporate expenses.
Selling, general and administrative expenses for the year ended December 31, 2024, increased by 9% to $2.14 billion, compared to $1.96 billion for the year ended December 31, 2023. The increase in selling, general and administrative expenses for the year ended December 31, 2024, was primarily driven by higher headcount and personnel-related expenses, including share-based compensation expense, higher litigation charges, and higher legal expenses. In 2024, we made a charitable contribution of $45 million to the Intuitive Foundation, a not-for-profit organization whose mission is to reduce the global burden of disease and suffering through research, education, and philanthropy aimed at better outcomes for patients around the globe. In 2023, we made a charitable contribution of $40 million to the Intuitive Foundation.
Selling, general and administrative expenses for the years ended December 31, 2024, and 2023, included share-based compensation expense of $305 million and $275 million, respectively, and intangible assets amortization expense of $2.4 million and $3.3 million, respectively.
Research and Development Expenses
Research and development costs are expensed as incurred. Research and development expenses include costs associated with the design, development, testing, and significant enhancement of our products. Our main product development initiatives include multi-port, Ion, and SP platform investments and our digital products and services.
Research and development expenses for the year ended December 31, 2024, increased by 15% to $1.15 billion, compared to $1.00 billion for the year ended December 31, 2023. The increase in research and development expenses for the year ended December 31, 2024, was primarily driven by higher headcount and personnel-related expenses, including share-based compensation expense, and other project costs incurred to support a broader set of product development initiatives.
Research and development expenses for the years ended December 31, 2024, and 2023, included share-based compensation expense of $255 million and $212 million, respectively, and intangible asset-related charges of $7.8 million and $13.5 million, respectively.
Research and development expenses fluctuate with project timing. Based upon our broader set of product development initiatives and the stage of the underlying projects, we expect to continue to make substantial investments in research and development and anticipate that research and development expenses will continue to increase in the future.
Interest and Other Income, Net
Interest and other income, net, for the year ended December 31, 2024, increased by 69% to $325 million, compared to $192 million for the year ended December 31, 2023. Interest and other income, net increased by 547% for the year ended December 31, 2023, compared to $30 million for the year ended December 31, 2022. The increase in interest and other income, net, for the year ended December 31, 2024, was primarily driven by higher interest income earned (due to higher average interest rates and higher average cash and investment balances).
We held an equity investment in preferred shares of Broncus Holding Corporation (“Broncus”), which was reflected in our Consolidated Financial Statements on a cost basis. In September 2021, Broncus completed an initial public offering (“IPO”) of common shares on the Stock Exchange of Hong Kong. Upon completion of the IPO, the preferred shares were converted to common shares in Broncus. For the year ended December 31, 2022, we recognized a loss on this investment of approximately
$21 million. For the year ended December 31, 2023, we sold our shares in this investment, recognizing an additional nominal loss.
Income Tax Expense
Income tax expense was $336 million and $142 million for the years ended December 31, 2024, and 2023, respectively. Our effective tax rate for 2024 was approximately 12.6% compared to 7.2% for 2023.
Our higher effective tax rate for the year ended December 31, 2024, compared to the year ended December 31, 2023, was primarily due to the fact that the year ended December 31, 2023, had a benefit for certain Swiss deferred tax assets, partially offset by higher excess tax benefits associated with employee equity plans in 2024 compared to 2023.
Our provision for income taxes for 2023 reflected Swiss tax benefits of $92.3 million, net of a $67.3 million valuation allowance, related to certain tax assets recorded by our Swiss entity. In addition, a one-time net benefit of $67.1 million was recorded from the re-measurement of our Swiss deferred tax assets resulting from the Swiss cantonal tax rate increase enacted in December 2023 for years after 2024 as well as a Swiss cantonal tax rate increase from the discontinuation of our 2017 Swiss tax ruling, which was deemed effective as of January 1, 2023.
Our provision for income taxes for 2024 and 2023 included excess tax benefits associated with employee equity plans of $223 million and $108 million, respectively, which reduced our effective tax rate by 8.4 and 5.5 percentage points, respectively. The amount of excess tax benefits or deficiencies will fluctuate from period to period based on the price of our stock, the volume of share-based awards settled or vested, and the value assigned to employee equity awards under GAAP, which results in increased income tax expense volatility.
In 2021, the OECD established an inclusive framework on base erosion and profit shifting and agreed on a two-pillar solution to global taxation, focusing on global profit allocation and a 15% global minimum effective tax rate (“Pillar Two”). The OECD issued Pillar Two model rules and continues to release guidance on these rules. Various countries, including Switzerland and EU member states, have enacted or have announced plans to enact new tax laws to implement the global minimum tax. We considered the applicable tax law changes on Pillar Two implementation in the relevant countries, and there is no material impact to our tax provision for the year ended December 31, 2024. We will continue to evaluate the impact of these tax law changes on future reporting periods.
We file federal, state, and foreign income tax returns in many jurisdictions in the U.S. and OUS. Years before 2017 are considered closed for significant jurisdictions. Certain of our unrecognized tax benefits could change due to activities of various tax authorities, including evolving interpretations of existing tax laws in the jurisdictions in which we operate, potential assessment of additional tax, possible settlement of audits, or through normal expiration of various statutes of limitations, which could affect our effective tax rate in the period in which they change.
We are subject to the examination of our income tax returns by the Internal Revenue Service and other tax authorities. The outcome of these audits cannot be predicted with certainty. Management regularly assesses the likelihood of adverse outcomes resulting from these examinations to determine the adequacy of our provision for income taxes. If any issues addressed in our tax audits are resolved in a manner not consistent with management’s expectations, we could be required to adjust our provision for income taxes in the period such resolution occurs.
Net Income Attributable to Noncontrolling Interest in Joint Venture
The Company’s Joint Venture with Fosun Pharma was initially established to research, develop, manufacture, and sell robotic-assisted, catheter-based medical devices. The Joint Venture is owned 60% by us and 40% by Fosun Pharma and is located in China. In 2019, the Joint Venture acquired certain assets, including distribution rights, customer relationships, and certain personnel, from Chindex and its affiliates, a subsidiary of Fosun Pharma, and began direct operations for da Vinci products and services in China. Following approval in June 2023 by China’s NMPA for a local version of our da Vinci Xi surgical system, in August 2023, our Intuitive-Fosun Pharma Joint Venture received a manufacturing license that permits the Joint Venture to manufacture our da Vinci Xi surgical system for sale to customers in China.
Net income attributable to noncontrolling interest in Joint Venture for the year ended December 31, 2024, was $14.9 million, compared to $19.3 million for the year ended December 31, 2023.
Liquidity and Capital Resources
Sources and Uses of Cash and Cash Equivalents
Our principal source of liquidity is cash provided by our operations and by the issuance of common stock through the exercise of stock options and our employee stock purchase program. Cash and cash equivalents plus short- and long-term investments increased by $1.49 billion to $8.83 billion as of December 31, 2024, from $7.34 billion as of December 31, 2023, primarily as a result of cash provided by operating activities and proceeds from stock option exercises and employee stock purchases, partially offset by cash used for capital expenditures and taxes paid related to net share settlements of equity awards.
Our cash requirements depend on numerous factors, including market acceptance of our products, the resources we devote to developing and supporting our products, and other factors. We expect to continue to devote substantial resources to expand procedure adoption and acceptance of our products. We have made substantial investments in our commercial operations, product development activities, facilities, and intellectual property. Based on our business model, we anticipate that we will continue to be able to fund future growth through cash provided by our operations. We believe that our current cash, cash equivalents, and investment balances, together with income to be derived from our business, will be sufficient to meet our liquidity requirements for the foreseeable future. However, we may experience reduced cash flow from operations as a result of macroeconomic and geopolitical headwinds.
As of December 31, 2024, $558 million of our cash, cash equivalents, and investments was held by foreign subsidiaries. We intend to repatriate earnings from our Swiss and Dutch subsidiaries and our joint venture in Hong Kong, as needed, since the U.S. and foreign tax implications of such repatriations are not expected to be significant. We will continue to indefinitely reinvest earnings from the rest of our foreign subsidiaries and do not expect the tax implications of repatriating these earnings to be significant.
See “Item 7A. Quantitative and Qualitative Disclosures About Market Risk” for discussion on the impact of interest rate risk and market risk on our investment portfolio.
Consolidated Cash Flow Data
The following table summarizes our cash flows for the years ended December 31, 2024, 2023, and 2022 (in millions):
| | | | | | | | | | | | | | | | | |
| | Years Ended December 31, |
| | 2024 | | 2023 | | 2022 |
| | | | | |
| Net cash provided by (used in): | | | | | |
| Operating activities | $ | 2,415.0 | | | $ | 1,813.8 | | | $ | 1,490.8 | |
| Investing activities | (3,272.8) | | | (360.1) | | | 1,370.8 | |
| Financing activities | 150.9 | | | (287.6) | | | (2,572.3) | |
| Effect of exchange rates on cash, cash equivalents, and restricted cash | (0.8) | | | 3.3 | | | 5.4 | |
| Net increase (decrease) in cash, cash equivalents, and restricted cash | $ | (707.7) | | | $ | 1,169.4 | | | $ | 294.7 | |
| | | | | |
| | | | | |
| | | | | |
| | | | | |
| | | | | |
| | | | | |
| | | | | |
| | | | | |
| | | | | |
| | | | | |
| | | | | |
| | | | | |
| | | | | |
| | | | | |
| | | | | |
| | | | | |
Operating Activities
For the year ended December 31, 2024, net cash provided by operating activities of $2.42 billion exceeded our net income of $2.34 billion, primarily due to the following factors:
1.Our net income included non-cash charges of $997 million, consisting primarily of share-based compensation of $677 million, depreciation expense and losses on the disposal of property, plant, and equipment of $445 million, and amortization of deferred commissions of $38 million, partially offset by deferred income tax benefits of $135 million and accretion of investment discounts, net of losses on investments of $43 million.
2.The non-cash charges outlined above were partially offset by changes in operating assets and liabilities that resulted in $919 million of cash used in operating activities during the year ended December 31, 2024. Inventory, including the transfer of equipment from inventory to property, plant, and equipment of $615 million, partially offset by the transfer of property, plant, and equipment to inventory of $44 million, increased by $830 million, primarily to address the growth in our business, expand our leasing business, and mitigate risks of disruption that could arise from global supply chain shortages and manufacturing line transfers. Refer to Note 4 to the Consolidated Financial Statements for further details regarding inventory in the supplemental cash flow information.
Cash used in operating activities was also driven by an increase in prepaid and other assets of $232 million, primarily driven by new and extended lessee operating lease arrangements and deferred commissions as a result of operating leasing arrangements with customers. Accounts receivable increased by $96 million, primarily due to increased sales,
as well as the timing of billings and collections. The unfavorable impact of these items on cash provided by operating activities was partially offset by an increase in other liabilities of $108 million, primarily driven by new and extended lessee operating lease arrangements. Also, accrued compensation and employee benefits increased by $99 million, primarily due to higher headcount and higher variable compensation.
For the year ended December 31, 2023, net cash provided by operating activities of $1.81 billion was less than our net income of $1.82 billion, primarily due to the following factors:
1.Our net income included non-cash charges of $774 million, consisting primarily of share-based compensation of $593 million, depreciation expense and losses on the disposal of property, plant, and equipment of $402 million, deferred income tax benefits of $281 million, amortization of deferred commissions of $33 million; and intangible asset amortization of $20 million.
2.The non-cash charges outlined above were partially offset by changes in operating assets and liabilities that resulted in $778 million of cash used in operating activities during the year ended December 31, 2023. Inventory, including the transfer of equipment from inventory to property, plant, and equipment, increased by $713 million, primarily to address the growth in the business as well as to mitigate risks of disruption that could arise from supply or other matters. Refer to the supplemental cash flow information in Note 4 to the Consolidated Financial Statements for further details.
Cash used in operating activities was also driven by an increase in accounts receivable of $186 million, primarily due to the timing of billings and collections. Other accrued liabilities decreased by $33 million, primarily due to timing of income tax payments. The unfavorable impact of these items on cash provided by operating activities was partially offset by an increase in deferred revenue of $53 million, primarily due to collections of payments related to future services. Also, there was an increase in accounts payable by $42 million, primarily due to the timing of billing and payments, an increase in accrued compensation and employee benefits by $35 million, primarily due to higher headcount and higher variable compensation, and a decrease in prepaid expenses and other assets by $24 million, primarily due to a decrease in net investments in sales-type leases.
Investing Activities
Net cash used in investing activities for the year ended December 31, 2024, consisted primarily of purchases of investments, net of proceeds from maturities and sales, of $2.16 billion and $1.11 billion paid for the acquisition of property, plant, and equipment.
Net cash used in investing activities for the year ended December 31, 2023, consisted primarily of $1.06 billion paid for the acquisition of property, plant, and equipment, partially offset by proceeds from maturities and sales of investments, net of purchases, of $0.71 billion.
Net cash provided by investing activities for the year ended December 31, 2022, consisted primarily of proceeds from maturities and sales of investments, net of purchases, of $1.92 billion, partially offset by $532 million paid for the acquisition of property, plant, and equipment.
We invest predominantly in high quality, fixed income securities. Our investment portfolio may, at any time, contain investments in money market funds, U.S. treasury and U.S. government agency securities, high-quality corporate notes and bonds, commercial paper, non-U.S. government agency securities, and taxable and tax-exempt municipal notes.
Financing Activities
Net cash provided by financing activities for the year ended December 31, 2024, consisted primarily of proceeds from stock option exercises and employee stock purchases of $429 million, partially offset by cash used for taxes paid on behalf of employees related to net share settlements of vested employee equity awards of $270 million.
Net cash used in financing activities for the year ended December 31, 2023, consisted primarily of cash used in the repurchase of approximately 1.7 million shares of our common stock for $416 million and taxes paid on behalf of employees related to net share settlements of vested employee equity awards of $165 million, partially offset by proceeds from stock option exercises and employee stock purchases of $296 million.
Net cash used in financing activities for the year ended December 31, 2022, consisted primarily of cash used in the repurchase of approximately 11.2 million shares of our common stock for $2.61 billion, 8.5 million shares of which related to accelerated share buyback programs executed and settled during 2022 and further described in Note 9 to the Consolidated Financial Statements, and taxes paid on behalf of employees related to net share settlements of vested employee equity awards of $194 million, partially offset by proceeds from stock option exercises and employee stock purchases of $234 million.
Capital Expenditures
Our capital expenditures increased in 2024 as we continue to build the infrastructure needed to scale and supply our customers with highly differentiated products manufactured in highly automated factories to facilitate outstanding performance in product quality, availability, and cost. A significant portion of this investment involves the construction of facilities to expand our manufacturing and commercial capabilities. We have also been vertically integrating key technologies to develop a more robust supply chain and bring important products to market at attractive price points. These investments include increased ownership of our imaging pipelines, and investments in strategic instruments and accessories technologies that allow us to serve our customers better. We expect these capital investments to range between $650 million and $800 million in 2025, the majority of which will be facilities-related investments. We intend to fund these capital investments with cash generated from operations.
Contractual Obligations and Commercial Commitments
Operating leases. We lease spaces for our operations in the U.S. as well as in Japan, China, Israel, Mexico, Germany, South Korea, the United Kingdom, India, and other countries. We also lease automobiles for certain sales and field service employees. These leases have varying terms of up to 20 years. Operating lease amounts include future minimum lease payments under all of our non-cancellable operating leases with an initial term in excess of one year. Refer to Note 6 to the Consolidated Financial Statements included in Part II, Item 8 for further details.
Purchase commitments and obligations. Total purchase commitments and obligations as of December 31, 2024, are estimated to be approximately $2.12 billion, of which $1.78 billion is expected to be due within a year. These amounts include an estimate of all open purchase orders and contractual obligations in the ordinary course of business, including commitments with contract manufacturers and suppliers for which we have not received the goods or services, commitments for capital expenditures, including construction-related activities, for which we have not received the goods or services, and commitments for the acquisition and licensing of intellectual property. Approximately one third of our estimated purchase commitments and obligations are facilities-related. Although open purchase orders are considered enforceable and legally binding, the terms generally allow us the option to cancel, reschedule, or adjust our requirements based on our business needs prior to the delivery of goods or performance of services. In addition to the above, we have committed to making potential future milestone payments to third parties as part of licensing, collaboration, and development arrangements. Payments under these agreements generally become due and payable only upon achievement of certain developmental, regulatory, and/or commercial milestones. For instances in which the achievement of these milestones is neither probable nor reasonably estimable, such contingencies have not been recorded on our Consolidated Balance Sheets.
2017 Tax Act deemed repatriation tax. As of December 31, 2024, our obligation associated with the deemed repatriation tax is $67 million. The remaining balance is expected to be paid in 2025.
We estimate making payments of approximately $22 million relating to our unrecognized tax benefits in the next 12 months.
Off-Balance Sheet Arrangements
As of December 31, 2024, we did not have any significant off-balance sheet arrangements, as defined in Item 303(a)(4)(ii) of Regulation S-K promulgated under the Exchange Act.
Critical Accounting Estimates
Our Consolidated Financial Statements are prepared in conformity with GAAP, which requires us to make judgments, estimates, and assumptions. See “Note 2. Summary of Significant Accounting Policies,” in Notes to the Consolidated Financial Statements, which is included in “Item 8. Financial Statements and Supplementary Data,” for a description of our significant accounting policies and methods used in the preparation of our Consolidated Financial Statements. The methods, estimates, and judgments that we use in applying our accounting policies require us to make difficult and subjective judgments, often as a result of the need to make estimates regarding matters that are inherently uncertain. Our most critical accounting estimates include:
•Standalone selling prices used to allocate the contract consideration to the individual performance obligations, which impacts revenue recognition;
•Valuation and recognition of investments, which impacts our investment portfolio balance when we assess fair value and interest and other income, net, when we record impairments;
•Valuation of inventory, which impacts gross profit margins;
•Valuation of and assessment of the recoverability of intangible assets and goodwill and the estimated useful lives of intangible assets, which primarily impacts gross profit margin or operating expenses when we record asset impairments or accelerate their amortization;
•Recognition and measurement of current and deferred income taxes (including the measurement of uncertain tax positions), which impact our provision for taxes; and
•Estimate of probable loss associated with legal contingencies, which impacts accrued liabilities and operating expenses.
Revenue recognition. Our system sale arrangements contain multiple products and services, including system(s), system components, system accessories, instruments, accessories, and services. Other than services, we generally deliver all of the products upfront. Each of these products and services is a distinct performance obligation. System accessories, instruments, accessories, and services are also sold on a standalone basis.
For multiple-element arrangements, revenue is allocated to each performance obligation based on its relative standalone selling price. Standalone selling prices are based on observable prices at which we separately sell the products or services. If a standalone selling price is not directly observable, then we estimate the standalone selling prices considering market conditions and entity-specific factors including, but not limited to, historical pricing data, features and functionality of the products and services, geographies, type of customer, and market conditions. We regularly review standalone selling prices and maintain internal controls over establishing and updating these estimates.
Our system sales arrangements generally include a five-year period of service. The first year of service is generally free and included in the system sale arrangement, and the remaining four years are billed at a stated service price. Revenue that is allocated to the service obligation is deferred and recognized ratably over the service period.
Investments valuation. Our investments may include, at any time, a diversified portfolio of money market funds, U.S. treasury and U.S. government agency securities, high-quality corporate notes and bonds, commercial paper, non-U.S. government agency securities, and taxable and tax-exempt municipal notes, as well as equity investments with and without readily determinable value. The assessment of the fair value of investments can be difficult and subjective. GAAP establishes three levels of inputs that may be used to measure fair value. Each level of input has different levels of subjectivity and difficulty involved in determining fair value. Valuation of Level 1 and 2 instruments generally do not require significant management judgment, and the estimation is not difficult. Level 3 instruments include unobservable inputs that are supported by little or no market activity and that are significant to the fair value of the assets or liabilities. The determination of fair value for Level 3 instruments requires the most management judgment and subjectivity. There were no Level 3 securities for the periods presented.
After determining the fair value of our available-for-sale instruments, we identify instruments with an amortized cost basis in excess of their estimated fair value. Available-for-sale instruments in an unrealized loss position are written down to fair value through a charge to interest and other income, net in the Consolidated Statements of Income, if we intend to sell the security or it is more likely than not we will be required to sell the security before recovery of its amortized cost basis. For the remaining securities, we assess what amount of the excess, if any, is caused by expected credit losses. Factors considered in determining whether a credit-related loss exists include the financial condition and near-term prospects of the investee, the extent of the loss related to the credit of the issuer, and the expected cash flows from the security. These judgments could prove to be wrong, and companies with relatively high credit ratings and solid financial conditions may not be able to fulfill their obligations.
No significant impairment charges were recorded during the years ended December 31, 2024, 2023, and 2022. As of December 31, 2024, and 2023, net unrealized losses on investments of $14.6 million and $29.7 million, net of tax, respectively, were included in accumulated other comprehensive loss.
Inventory valuation. Inventory is stated at the lower of cost or net realizable value on a first-in, first-out basis. The cost basis of our inventory is reduced for any products that are considered excess or obsolete based on assumptions about future demand and market conditions. If actual future demand or market conditions are less favorable than those projected by management, additional inventory write-downs may be required, which could have a material adverse effect on the results of our operations.
Valuation of intangible assets and goodwill. We allocate the fair value of purchase consideration, including contingent consideration, to assets acquired and liabilities assumed in a business combination based on their estimated fair values at the acquisition date. The excess of the fair value of the purchase consideration over the fair value of assets acquired, liabilities assumed, and any noncontrolling interest is recorded as goodwill. When determining the fair value of assets acquired, liabilities assumed, and any noncontrolling interest, management is required to make certain estimates and assumptions, especially with respect to intangible assets. The estimates and assumptions used in valuing intangible assets include, but are not limited to, the amount and timing of projected future cash flows, the discount rate used to determine the present value of these cash flows, and the determination of the assets’ life cycle. These estimates are inherently uncertain and, therefore, actual results may differ from the estimates made.
Our intangible assets include identifiable intangible assets and goodwill. Identifiable intangible assets include developed technology, patents, distribution rights, customer relationships, licenses, and non-competition arrangements. Currently, all of our identifiable intangible assets have finite lives. Goodwill and intangible assets with indefinite lives are subject to an annual impairment review (or more frequent if impairment indicators arise) by applying a fair value-based test. There have been no such impairments.
Identifiable intangible assets with finite lives are subject to impairment testing and are reviewed for impairment when events or circumstances indicate that the carrying value of an asset is not recoverable and its carrying amount exceeds its fair value. We evaluate the recoverability of the carrying value of these identifiable intangible assets based on estimated undiscounted cash flows to be generated from such assets. If the cash flow estimates or the significant operating assumptions upon which they are based change in the future, we may be required to record additional impairment charges.
The valuation and classification of intangible assets and goodwill and the assignment of useful lives for purposes of amortization involves judgments and the use of estimates. The evaluation of these intangible assets and goodwill for impairment under established accounting principles is required on a recurring basis. Changes in business conditions could potentially require future adjustments to the assumptions made. When we determine that the useful lives of assets are shorter than we had originally estimated, we accelerate the rate of amortization over the assets’ new, shorter useful lives. No significant impairment charges or accelerated amortization were recorded for the years ended December 31, 2024, 2023, and 2022. A considerable amount of judgment is required in assessing impairment, which includes financial forecasts. If conditions are different from management’s current estimates, material write-downs of long-lived assets may be required, which would adversely affect our operating results.
Accounting for income taxes. Significant management judgment is required in determining our provision for income taxes, deferred tax assets and liabilities, and any valuation allowance recorded against net deferred tax assets in accordance with GAAP. These estimates and judgments occur in the calculation of tax credits, benefits, and deductions and in the calculation of certain tax assets and liabilities, which arise from differences in the timing of recognition of revenue and expense for tax and financial statement purposes, as well as the interest and penalties related to uncertain tax positions. Significant changes to these estimates may result in an increase or decrease in our tax provision in the current period or subsequent periods.
Also, we must assess the likelihood that we will be able to recover our deferred tax assets. In the event that all or part of our deferred tax assets are not recoverable in the future, we must increase our provision for taxes by recording a valuation allowance to reduce our deferred tax assets to the amount that is more likely than not to be recoverable. In order for our deferred tax assets to be recoverable, we must be able to generate sufficient taxable income in those jurisdictions where the deferred tax assets are located. We consider forecasted income, including income that may be generated as a result of certain tax planning strategies, together with future reversals of existing taxable temporary differences, in determining the need for a valuation allowance. As of December 31, 2024, we believe that it is more likely than not that our deferred tax assets will ultimately be recovered, with the exception primarily of our California deferred tax assets and a portion of our Swiss deferred tax assets. We believe that, due to the computation of California taxes under the single sales factor, it is more likely than not that our California deferred tax assets of $243.2 million will not be realized. Additionally, given certain limitations prescribed by the Swiss tax authority on the utilization of some of our Swiss deferred tax assets, we believe that it is more likely than not that $67.3 million of the Swiss deferred tax assets will not be realized based on the future forecasted income of our Swiss entity. Our ability to realize the deferred tax assets could be reduced in the future if our estimates of future forecasted income do not support the realization of our deferred tax assets. Should there be a change in our ability to realize our deferred tax assets, our tax provision would be affected in the period in which such change takes place.
The calculation of our tax liabilities involves dealing with uncertainties in the application of complex tax regulations. We recognize liabilities for uncertain tax positions based on a two-step process. The first step is to evaluate the tax position for recognition by determining if the weight of available evidence indicates that it is more likely than not that the position will be sustained on audit, including resolution of related appeals or litigation processes, if any. If we determine that a tax position will more likely than not be sustained on audit, then the second step requires us to estimate and measure the tax benefit as the largest amount that is more than 50% likely to be realized upon ultimate settlement. It is inherently difficult and subjective to estimate such amounts, as we have to determine the probability of various possible outcomes. We re-evaluate these uncertain tax positions on a quarterly basis. This evaluation is based on factors including, but not limited to, changes in facts or circumstances, changes in tax law, effective settlement of audit issues, and new audit activity. Such a change in the recognition or measurement would result in the recognition of a tax benefit or an additional charge to the tax provision.
Accounting for legal contingencies. From time to time, we are involved in a number of legal proceedings involving product liability, intellectual property, shareholder derivative actions, securities class actions, employment, and other matters. We record a liability and related charge to earnings in our Consolidated Financial Statements for legal contingencies when the loss is considered probable and the amount can be reasonably estimated. Our assessment is re-evaluated each period and is based on all available information, including discussion with any outside legal counsel that represents us. If a reasonable estimate of a known or probable loss cannot be made, but a range of probable losses can be estimated, the low-end of the range
of losses is recognized if no amount within the range is a better estimate than any other. If a material loss is reasonably possible, but not probable, and can be reasonably estimated, the estimated loss or range of loss is disclosed in the Notes to the Consolidated Financial Statements.
When determining the estimated probable loss or range of losses, significant judgment is required to be exercised in order to estimate the amount and timing of the loss to be recorded. Estimates of probable losses resulting from litigation are inherently difficult to make, particularly when the matters are in early procedural stages with incomplete facts and information. The final outcome of legal proceedings is dependent on many variables and is difficult to predict and, therefore, the ultimate cost to entirely resolve such matters may be materially different than the amount of current estimates. Consequently, new information or changes in judgments and estimates could have a material adverse effect on our business, financial condition, and results of operations or cash flows.
RECENT ACCOUNTING PRONOUNCEMENTS
See “Note 2. Summary of Significant Accounting Policies” of the Notes to Consolidated Financial Statements in “Item 8. Financial Statements and Supplementary Data” for additional information regarding recent accounting pronouncements, including the respective expected dates of adoption and estimated effects, if any, on our Consolidated Financial Statements.
ITEM 7A. QUANTITATIVE AND QUALITATIVE DISCLOSURES ABOUT MARKET RISK
Interest Rate and Market Risk
The primary objective of our investment activities is to preserve principal while supporting our liquidity requirements. To achieve this objective, we maintain a diversified portfolio of cash equivalents and short- and long-term investments in a variety of high-quality securities, including money market funds, U.S. treasury and U.S. government agency securities, high-quality corporate notes and bonds, commercial paper, non-U.S. government agency securities, and taxable and tax-exempt municipal notes. The securities are classified as available-for-sale and consequently are recorded at fair value with unrealized gains or losses reported as a separate component of accumulated other comprehensive loss. The weighted average duration of our portfolio as of December 31, 2024, was approximately 1.3 years. If interest rates rise, the market value of our investments may decline, which could result in a realized loss if we are forced to sell an investment before its scheduled maturity. A hypothetical increase or decrease in interest rates by 25 basis points would have resulted in a decrease or increase in the fair value of our net investment position of approximately $28 million, respectively, as of December 31, 2024. We do not utilize derivative financial instruments to manage our interest rate risks.
Uncertain financial markets could result in a tightening in the credit markets, a reduced level of liquidity in many financial markets, and extreme volatility in fixed income and credit markets. The credit ratings of the securities we have invested in could deteriorate and may have an adverse impact on the carrying value of these investments.
Foreign Exchange Risk
The majority of our revenue, expense, and capital purchasing activities are transacted in U.S. dollars. However, we generally sell our products and services in local currencies where we have direct distribution channels. We operate in a number of markets on a direct sales basis and incur operating expenses in local currencies. We also purchase certain product components from non-U.S. suppliers in local currency. As a result, because a portion of our operations consists of sales activities outside of the U.S., we have foreign exchange exposures to non-U.S. dollar revenues, operating expenses, accounts receivable, accounts payable, and foreign currency bank balances.
For the year ended December 31, 2024, sales denominated in foreign currencies were approximately 24% of total revenue. The objective of our hedging program is to mitigate the impact of changes in currency exchange rates on our net cash flow from foreign currency-denominated sales and expenses. For the year ended December 31, 2024, our revenue would have decreased by approximately $118 million if the U.S. dollar exchange rate strengthened by 10%. We also hedge the net recognized non-functional currency balance sheet exposures with foreign exchange forward contracts to reduce the risk that our earnings and cash flows will be adversely affected by changes in exchange rates. A 10% strengthening of the U.S. dollar exchange rate against all currencies to which we have exposure, after considering foreign currency hedges and offsetting positions as of December 31, 2024, would have resulted in an approximately $12 million increase in the carrying amounts of those net assets. Actual gains and losses in the future may differ materially from the hypothetical gains and losses discussed above based on changes in the timing and amount of foreign currency exchange rate movements and our actual exposure and hedging transactions. Bank counterparties to foreign exchange forward contracts expose us to credit-related losses in the event of their nonperformance. To mitigate that risk, we only contract with counterparties that meet certain minimum requirements under our counterparty risk assessment process. We monitor credit ratings and potential downgrades on at least a quarterly basis. Based on our ongoing assessment of counterparty risk, we will adjust our exposure to various counterparties.
Although we sell to distributors outside of the U.S. in U.S. dollars, strengthening of the dollar can impact our distributors’ margins and could impact the end customers’ ability to purchase our products if our distributors seek to recover the impact of the change in the dollar by increasing product and service prices. Less than 10% of our revenue is conducted through distributors outside of the U.S. Strengthening of the dollar relative to non-U.S. currencies could have an adverse impact on our business.
Our operations outside of the U.S. are subject to risks typical of operations outside of the U.S. including, but not limited to, differing economic conditions, changes in the political climate, differing tax structures, other regulations and restrictions, and foreign exchange rate volatility.
ITEM 8. FINANCIAL STATEMENTS AND SUPPLEMENTARY DATA
Index To Consolidated Financial Statements All other schedules have been omitted, because they are not applicable or the required information is shown in the Consolidated Financial Statements or the Notes thereto.
REPORT OF INDEPENDENT REGISTERED PUBLIC ACCOUNTING FIRM
To the Board of Directors and Stockholders of Intuitive Surgical, Inc.
Opinions on the Financial Statements and Internal Control over Financial Reporting
We have audited the accompanying consolidated balance sheets of Intuitive Surgical, Inc. and its subsidiaries (the “Company”) as of December 31, 2024, and 2023, and the related consolidated statements of income, of comprehensive income, of stockholders’ equity and of cash flows for each of the three years in the period ended December 31, 2024, including the related notes and financial statement schedule listed in the index appearing under Item 15(a)(2) (collectively referred to as the “consolidated financial statements”). We also have audited the Company’s internal control over financial reporting as of December 31, 2024, based on criteria established in Internal Control - Integrated Framework (2013) issued by the Committee of Sponsoring Organizations of the Treadway Commission (COSO).
In our opinion, the consolidated financial statements referred to above present fairly, in all material respects, the financial position of the Company as of December 31, 2024, and 2023, and the results of its operations and its cash flows for each of the three years in the period ended December 31, 2024 in conformity with accounting principles generally accepted in the United States of America. Also in our opinion, the Company maintained, in all material respects, effective internal control over financial reporting as of December 31, 2024, based on criteria established in Internal Control - Integrated Framework (2013) issued by the COSO.
Basis for Opinions
The Company’s management is responsible for these consolidated financial statements, for maintaining effective internal control over financial reporting, and for its assessment of the effectiveness of internal control over financial reporting, included in Management’s Report on Internal Control over Financial Reporting appearing under Item 9A. Our responsibility is to express opinions on the Company’s consolidated financial statements and on the Company’s internal control over financial reporting based on our audits. We are a public accounting firm registered with the Public Company Accounting Oversight Board (United States) (PCAOB) and are required to be independent with respect to the Company in accordance with the U.S. federal securities laws and the applicable rules and regulations of the Securities and Exchange Commission and the PCAOB.
We conducted our audits in accordance with the standards of the PCAOB. Those standards require that we plan and perform the audits to obtain reasonable assurance about whether the consolidated financial statements are free of material misstatement, whether due to error or fraud, and whether effective internal control over financial reporting was maintained in all material respects.
Our audits of the consolidated financial statements included performing procedures to assess the risks of material misstatement of the consolidated financial statements, whether due to error or fraud, and performing procedures that respond to those risks. Such procedures included examining, on a test basis, evidence regarding the amounts and disclosures in the consolidated financial statements. Our audits also included evaluating the accounting principles used and significant estimates made by management, as well as evaluating the overall presentation of the consolidated financial statements. Our audit of internal control over financial reporting included obtaining an understanding of internal control over financial reporting, assessing the risk that a material weakness exists, and testing and evaluating the design and operating effectiveness of internal control based on the assessed risk. Our audits also included performing such other procedures as we considered necessary in the circumstances. We believe that our audits provide a reasonable basis for our opinions.
Definition and Limitations of Internal Control over Financial Reporting
A company’s internal control over financial reporting is a process designed to provide reasonable assurance regarding the reliability of financial reporting and the preparation of financial statements for external purposes in accordance with generally accepted accounting principles. A company’s internal control over financial reporting includes those policies and procedures that (i) pertain to the maintenance of records that, in reasonable detail, accurately and fairly reflect the transactions and dispositions of the assets of the company; (ii) provide reasonable assurance that transactions are recorded as necessary to permit preparation of financial statements in accordance with generally accepted accounting principles, and that receipts and expenditures of the company are being made only in accordance with authorizations of management and directors of the company; and (iii) provide reasonable assurance regarding prevention or timely detection of unauthorized acquisition, use, or disposition of the company’s assets that could have a material effect on the financial statements.
Because of its inherent limitations, internal control over financial reporting may not prevent or detect misstatements. Also, projections of any evaluation of effectiveness to future periods are subject to the risk that controls may become inadequate because of changes in conditions, or that the degree of compliance with the policies or procedures may deteriorate.
Critical Audit Matters
The critical audit matter communicated below is a matter arising from the current period audit of the consolidated financial statements that was communicated or required to be communicated to the audit committee and that (i) relates to accounts or disclosures that are material to the consolidated financial statements and (ii) involved our especially challenging, subjective, or complex judgments. The communication of critical audit matters does not alter in any way our opinion on the consolidated financial statements, taken as a whole, and we are not, by communicating the critical audit matter below, providing a separate opinion on the critical audit matter or on the accounts or disclosures to which it relates.
Determination of Standalone Selling Prices Related to System Sale Arrangements
As described in Notes 2 and 5 to the consolidated financial statements, the Company recognized $1,966.0 million of systems revenue during the year ended December 31, 2024, of which a majority relates to system sale arrangements. The Company’s system sale arrangements include a combination of the following performance obligations: system(s); system components; system accessories; instruments; accessories; and system service. For multiple-element arrangements, revenue is allocated to each performance obligation based on its relative standalone selling price. Standalone selling prices are based on observable prices at which the Company separately sells the products or services. If a standalone selling price is not directly observable, then management estimates the standalone selling price considering market conditions and entity-specific factors including, but not limited to, historical pricing data, features and functionality of the products and services, geographies, and type of customer.
The principal considerations for our determination that performing procedures relating to the determination of standalone selling prices related to system sale arrangements is a critical audit matter are the significant judgment by management when determining estimates of standalone selling prices, which in turn led to a high degree of auditor judgment, subjectivity, and effort in performing procedures and evaluating audit evidence relating to the estimates of standalone selling prices used to allocate the transaction price of an arrangement to each distinct performance obligation.
Addressing the matter involved performing procedures and evaluating audit evidence in connection with forming our overall opinion on the consolidated financial statements. These procedures included testing the effectiveness of controls over the revenue recognition process, including controls over the determination of the estimates of standalone selling prices. These procedures also included, among others, (i) testing management’s process for determining the estimates of standalone selling prices; (ii) evaluating the appropriateness of the overall methodology used by management to develop the estimates, including the appropriateness of the data inputs related to the products and services, geographies, and type of customer used in the methodology; (iii) testing the completeness and accuracy of the data used in the methodology; and (iv) testing the accuracy of management’s calculations of estimated selling prices.
/s/ PricewaterhouseCoopers LLP
San Jose, California
January 31, 2025
We have served as the Company’s auditor since 2014.
INTUITIVE SURGICAL, INC.
CONSOLIDATED BALANCE SHEETS
(IN MILLIONS, EXCEPT PAR VALUE AMOUNTS)
| | | | | | | | | | | |
| December 31, |
| 2024 | | 2023 |
| ASSETS | | | |
| Current assets: | | | |
| Cash and cash equivalents | $ | 2,027.4 | | | $ | 2,750.1 | |
| Short-term investments | 1,985.9 | | | 2,473.1 | |
| Accounts receivable, net of allowances of $30.7 and $27.1 as of December 31, 2024, and 2023, respectively | 1,225.4 | | | 1,130.2 | |
| Inventory | 1,487.2 | | | 1,220.6 | |
| Prepaids and other current assets | 385.1 | | | 314.0 | |
| Total current assets | 7,111.0 | | | 7,888.0 | |
| Property, plant, and equipment, net | 4,646.6 | | | 3,537.6 | |
| Long-term investments | 4,819.1 | | | 2,120.0 | |
| Deferred tax assets | 1,045.1 | | | 910.5 | |
| Intangible and other assets, net | 773.9 | | | 636.7 | |
| Goodwill | 347.5 | | | 348.7 | |
| Total assets | $ | 18,743.2 | | | $ | 15,441.5 | |
| | | |
| LIABILITIES AND STOCKHOLDERS’ EQUITY | | | |
| Current liabilities: | | | |
| Accounts payable | $ | 193.4 | | | $ | 188.7 | |
| Accrued compensation and employee benefits | 535.6 | | | 436.4 | |
| Deferred revenue | 468.8 | | | 446.1 | |
| Other accrued liabilities | 547.5 | | | 587.5 | |
| Total current liabilities | 1,745.3 | | | 1,658.7 | |
| Other long-term liabilities | 468.3 | | | 385.5 | |
| Total liabilities | 2,213.6 | | | 2,044.2 | |
| Commitments and contingencies (Note 8) | | | |
| Stockholders’ equity: | | | |
| Preferred stock, 2.5 shares authorized, $0.001 par value, issuable in series; zero shares issued and outstanding as of December 31, 2024, and 2023 | — | | | — | |
| Common stock, 600.0 shares authorized, $0.001 par value, 356.6 shares and 352.3 shares issued and outstanding as of December 31, 2024, and 2023, respectively | 0.4 | | | 0.4 | |
| Additional paid-in capital | 9,681.3 | | | 8,576.4 | |
| Retained earnings | 6,803.3 | | | 4,743.0 | |
| Accumulated other comprehensive loss | (51.3) | | | (12.2) | |
| Total Intuitive Surgical, Inc. stockholders’ equity | 16,433.7 | | | 13,307.6 | |
| Noncontrolling interest in joint venture | 95.9 | | | 89.7 | |
| Total stockholders’ equity | 16,529.6 | | | 13,397.3 | |
| Total liabilities and stockholders’ equity | $ | 18,743.2 | | | $ | 15,441.5 | |
| | | |
| | | |
| | | |
| | | |
| | | |
| | | |
The accompanying notes are an integral part of these Consolidated Financial Statements.
INTUITIVE SURGICAL, INC.
CONSOLIDATED STATEMENTS OF INCOME
(IN MILLIONS, EXCEPT PER SHARE AMOUNTS)
| | | | | | | | | | | | | | | | | |
| | Years Ended December 31, |
| 2024 | | 2023 | | 2022 |
| Revenue: | | | | | |
| Product | $ | 7,045.0 | | | $ | 5,956.3 | | | $ | 5,198.0 | |
| Service | 1,307.1 | | | 1,167.8 | | | 1,024.2 | |
| Total revenue | 8,352.1 | | | 7,124.1 | | | 6,222.2 | |
| Cost of revenue: | | | | | |
| Product | 2,313.1 | | | 2,041.8 | | | 1,700.3 | |
| Service | 404.8 | | | 352.8 | | | 325.9 | |
| Total cost of revenue | 2,717.9 | | | 2,394.6 | | | 2,026.2 | |
| Gross profit | 5,634.2 | | | 4,729.5 | | | 4,196.0 | |
| Operating expenses: | | | | | |
| Selling, general and administrative | 2,140.0 | | | 1,963.9 | | | 1,739.9 | |
| Research and development | 1,145.3 | | | 998.8 | | | 879.0 | |
| Total operating expenses | 3,285.3 | | | 2,962.7 | | | 2,618.9 | |
| Income from operations | 2,348.9 | | | 1,766.8 | | | 1,577.1 | |
| Interest and other income, net | 324.9 | | | 192.1 | | | 29.7 | |
| Income before taxes | 2,673.8 | | | 1,958.9 | | | 1,606.8 | |
| Income tax expense | 336.3 | | | 141.6 | | | 262.4 | |
| Net income | 2,337.5 | | | 1,817.3 | | | 1,344.4 | |
| Less: net income attributable to noncontrolling interest in joint venture | 14.9 | | | 19.3 | | | 22.1 | |
| Net income attributable to Intuitive Surgical, Inc. | $ | 2,322.6 | | | $ | 1,798.0 | | | $ | 1,322.3 | |
| Net income per share attributable to Intuitive Surgical, Inc.: | | | | | |
| Basic | $ | 6.54 | | | $ | 5.12 | | | $ | 3.72 | |
| Diluted | $ | 6.42 | | | $ | 5.03 | | | $ | 3.65 | |
| Shares used in computing net income per share attributable to Intuitive Surgical, Inc.: | | | | | |
| Basic | 355.2 | | | 351.2 | | | 355.7 | |
| Diluted | 362.0 | | | 357.4 | | | 362.0 | |
| | | | | |
| | | | | |
| | | | | |
| | | | | |
| | | | | |
| | | | | |
| | | | | |
| | | | | |
| | | | | |
| | | | | |
| | | | | |
| | | | | |
| | | | | |
| | | | | |
| | | | | |
The accompanying notes are an integral part of these Consolidated Financial Statements.
INTUITIVE SURGICAL, INC.
CONSOLIDATED STATEMENTS OF COMPREHENSIVE INCOME
(IN MILLIONS)
| | | | | | | | | | | | | | | | | |
| Years Ended December 31, |
| 2024 | | 2023 | | 2022 |
| Net income | $ | 2,337.5 | | | $ | 1,817.3 | | | $ | 1,344.4 | |
| Other comprehensive income (loss), net of tax: | | | | | |
| Change in foreign currency translation gains (losses) | (53.2) | | | 25.7 | | | (0.5) | |
| Available-for-sale securities (net of tax): | | | | | |
| Change in unrealized gains (losses) | 15.0 | | | 124.6 | | | (138.2) | |
| Less: Reclassification adjustment for (gains) losses on securities | 0.1 | | | (0.1) | | | — | |
| Net change | 15.1 | | | 124.5 | | | (138.2) | |
| Hedge instruments (net of tax): | | | | | |
| Change in unrealized gains (losses) | 5.7 | | | (6.6) | | | (35.0) | |
| Less: Reclassification adjustment for losses on hedge instruments | 7.8 | | | 7.0 | | | 27.6 | |
| Net change | 13.5 | | | 0.4 | | | (7.4) | |
| Employee benefit plans (net of tax): | | | | | |
| Change in unrealized gains (losses) | (14.9) | | | (0.6) | | | 5.8 | |
| Less: Reclassification adjustment for (gains) losses on employee benefit plans | (0.3) | | | — | | | 0.2 | |
| Net change | (15.2) | | | (0.6) | | | 6.0 | |
| Other comprehensive income (loss), net of tax | (39.8) | | | 150.0 | | | (140.1) | |
| Total comprehensive income | 2,297.7 | | | 1,967.3 | | | 1,204.3 | |
| Less: comprehensive income attributable to noncontrolling interest | 14.2 | | | 19.0 | | | 20.3 | |
| Total comprehensive income attributable to Intuitive Surgical, Inc. | $ | 2,283.5 | | | $ | 1,948.3 | | | $ | 1,184.0 | |
| | | | | |
| | | | | |
| | | | | |
| | | | | |
| | | | | |
| | | | | |
| | | | | |
| | | | | |
| | | | | |
| | | | | |
| | | | | |
| | | | | |
| | | | | |
| | | | | |
| | | | | |
| | | | | |
| | | | | |
The accompanying notes are an integral part of these Consolidated Financial Statements.
INTUITIVE SURGICAL, INC.
CONSOLIDATED STATEMENTS OF STOCKHOLDERS’ EQUITY
(IN MILLIONS)
| | | | | | | | | | | | | | | | | | | | | | | | | | | | | | | | | | | | | | | | | | | | | | | |
| Common Stock | | Additional
Paid-In
Capital | | Retained
Earnings | | Accumulated
Other
Comprehensive
(Loss)/Income | | Total Intuitive Surgical, Inc. Stockholders’ Equity | | Noncontrolling
Interest
in
Joint
Venture | | Total Stockholders’ Equity |
| Shares | | Amount | | | | | | |
| Balances as of December 31, 2021 | 357.7 | | | $ | 0.4 | | | $ | 7,164.0 | | | $ | 4,760.9 | | | $ | (24.2) | | | $ | 11,901.1 | | | $ | 50.4 | | | $ | 11,951.5 | |
| | | | | | | | | | | | | | | |
| Issuance of common stock through employee stock plans | 4.2 | | | — | | | 233.8 | | | — | | | — | | | 233.8 | | | — | | | 233.8 | |
| Shares withheld related to net share settlement of equity awards | (0.7) | | | — | | | (7.4) | | | (186.8) | | | — | | | (194.2) | | | — | | | (194.2) | |
| Share-based compensation expense related to employee stock plans | — | | | — | | | 524.6 | | | — | | | — | | | 524.6 | | | — | | | 524.6 | |
| Repurchase and retirement of common stock | (11.2) | | | — | | | (211.1) | | | (2,396.3) | | | — | | | (2,607.4) | | | — | | | (2,607.4) | |
| Net income attributable to Intuitive Surgical, Inc. | — | | | — | | | — | | | 1,322.3 | | | — | | | 1,322.3 | | | — | | | 1,322.3 | |
| Other comprehensive income (loss) | — | | | — | | | — | | | — | | | (138.3) | | | (138.3) | | | (1.8) | | | (140.1) | |
| Net income attributable to noncontrolling interest in joint venture | — | | | — | | | — | | | — | | | — | | | — | | | 22.1 | | | 22.1 | |
| Balances as of December 31, 2022 | 350.0 | | | $ | 0.4 | | | $ | 7,703.9 | | | $ | 3,500.1 | | | $ | (162.5) | | | $ | 11,041.9 | | | $ | 70.7 | | | $ | 11,112.6 | |
| Issuance of common stock through employee stock plans | 4.7 | | | — | | | 296.3 | | | — | | | — | | | 296.3 | | | — | | | 296.3 | |
| Shares withheld related to net share settlement of equity awards | (0.7) | | | — | | | (7.2) | | | (157.5) | | | — | | | (164.7) | | | — | | | (164.7) | |
| Share-based compensation expense related to employee stock plans | — | | | — | | | 602.1 | | | — | | | — | | | 602.1 | | | — | | | 602.1 | |
| Repurchase and retirement of common stock | (1.7) | | | — | | | (18.7) | | | (397.6) | | | — | | | (416.3) | | | — | | | (416.3) | |
| Net income attributable to Intuitive Surgical, Inc. | — | | | — | | | — | | | 1,798.0 | | | — | | | 1,798.0 | | | — | | | 1,798.0 | |
| Other comprehensive income (loss) | — | | | — | | | — | | | — | | | 150.3 | | | 150.3 | | | (0.3) | | | 150.0 | |
| Net income attributable to noncontrolling interest in joint venture | — | | | — | | | — | | | — | | | — | | | — | | | 19.3 | | | 19.3 | |
| Balances as of December 31, 2023 | 352.3 | | | $ | 0.4 | | | $ | 8,576.4 | | | $ | 4,743.0 | | | $ | (12.2) | | | $ | 13,307.6 | | | $ | 89.7 | | | $ | 13,397.3 | |
| | | | | | | | | | | | | | | |
| Issuance of common stock through employee stock plans | 5.0 | | | — | | | 429.4 | | | — | | | — | | | 429.4 | | | — | | | 429.4 | |
| Shares withheld related to net share settlement of equity awards | (0.7) | | | — | | | (7.7) | | | (262.3) | | | — | | | (270.0) | | | — | | | (270.0) | |
| Share-based compensation expense related to employee stock plans | — | | | — | | | 683.2 | | | — | | | — | | | 683.2 | | | — | | | 683.2 | |
| | | | | | | | | | | | | | | |
| Net income attributable to Intuitive Surgical, Inc. | — | | | — | | | — | | | 2,322.6 | | | — | | | 2,322.6 | | | — | | | 2,322.6 | |
| Other comprehensive income (loss) | — | | | — | | | — | | | — | | | (39.1) | | | (39.1) | | | (0.7) | | | (39.8) | |
| Cash dividends declared and paid by joint venture | — | | | — | | | — | | | — | | | — | | | — | | | (8.0) | | | (8.0) | |
| Net income attributable to noncontrolling interest in joint venture | — | | | — | | | — | | | — | | | — | | | — | | | 14.9 | | | 14.9 | |
| Balances as of December 31, 2024 | 356.6 | | | $ | 0.4 | | | $ | 9,681.3 | | | $ | 6,803.3 | | | $ | (51.3) | | | $ | 16,433.7 | | | $ | 95.9 | | | $ | 16,529.6 | |
|
|
|
The accompanying notes are an integral part of these Consolidated Financial Statements.
INTUITIVE SURGICAL, INC.
CONSOLIDATED STATEMENTS OF CASH FLOWS
(IN MILLIONS)
| | | | | | | | | | | | | | | | | |
| Years Ended December 31, |
| 2024 | | 2023 | | 2022 |
| Operating activities: | | | | | |
| Net income | $ | 2,337.5 | | | $ | 1,817.3 | | | $ | 1,344.4 | |
| Adjustments to reconcile net income to net cash provided by operating activities: | | | | | |
| Depreciation and loss on disposal of property, plant, and equipment, net | 445.3 | | | 401.6 | | | 338.0 | |
| Amortization of intangible assets | 16.7 | | | 20.2 | | | 27.8 | |
| Gain on sale of business | (1.1) | | | — | | | (3.8) | |
| (Gain) loss on investments and (accretion) amortization of investment discounts and premiums, net | (43.3) | | | 7.3 | | | 49.0 | |
| Deferred income taxes | (135.3) | | | (280.8) | | | (185.3) | |
| Share-based compensation expense | 676.8 | | | 592.8 | | | 513.2 | |
| Amortization of contract acquisition assets | 37.7 | | | 33.0 | | | 26.6 |
| Changes in operating assets and liabilities, net of effects of acquisitions: | | | | | |
| Accounts receivable | (95.9) | | | (186.3) | | | (159.3) | |
| Inventory | (830.0) | | | (712.5) | | | (546.6) | |
| Prepaids and other assets | (231.8) | | | 24.2 | | | (129.2) | |
| Accounts payable | (0.4) | | | 41.7 | | | 21.3 | |
| Accrued compensation and employee benefits | 99.3 | | | 34.8 | | | 51.5 | |
| Deferred revenue | 31.2 | | | 53.4 | | | 21.5 | |
| Other liabilities | 108.3 | | | (32.9) | | | 121.7 | |
| Net cash provided by operating activities | 2,415.0 | | | 1,813.8 | | | 1,490.8 | |
| Investing activities: | | | | | |
| Purchases of investments | (5,139.6) | | | (2,207.4) | | | (1,399.5) | |
| Proceeds from sales of investments | 100.2 | | | 230.3 | | | 61.1 | |
| Proceeds from maturities of investments | 2,878.8 | | | 2,690.1 | | | 3,254.4 | |
| Purchase of property, plant, and equipment | (1,111.2) | | | (1,064.2) | | | (532.4) | |
| Acquisition of businesses, net of cash, and intellectual property and other investing activities | (1.0) | | | (8.9) | | | (12.8) | |
| Net cash provided by (used in) investing activities | (3,272.8) | | | (360.1) | | | 1,370.8 | |
| Financing activities: | | | | | |
| Proceeds from issuance of common stock relating to employee stock plans | 429.4 | | | 296.3 | | | 233.8 | |
| Taxes paid related to net share settlement of equity awards | (270.0) | | | (164.7) | | | (194.2) | |
| Repurchase of common stock | — | | | (416.3) | | | (2,607.4) | |
| Cash dividends paid by joint venture to noncontrolling interest | (8.0) | | | — | | | — | |
| Payment of deferred purchase consideration | (0.5) | | | (2.9) | | | (4.5) | |
| Net cash provided by (used in) financing activities | 150.9 | | | (287.6) | | | (2,572.3) | |
| Effect of exchange rate changes on cash, cash equivalents, and restricted cash | (0.8) | | | 3.3 | | | 5.4 | |
| Net increase (decrease) in cash, cash equivalents, and restricted cash | (707.7) | | | 1,169.4 | | | 294.7 | |
| Cash, cash equivalents, and restricted cash, beginning of year | 2,770.1 | | | 1,600.7 | | | 1,306.0 | |
| Cash, cash equivalents, and restricted cash, end of year | $ | 2,062.4 | | | $ | 2,770.1 | | | $ | 1,600.7 | |
The accompanying notes are an integral part of these Consolidated Financial Statements.
INTUITIVE SURGICAL, INC.
NOTES TO THE CONSOLIDATED FINANCIAL STATEMENTS
NOTE 1. DESCRIPTION OF THE BUSINESS
Intuitive Surgical, Inc. (“Intuitive” or the “Company”) develops, manufactures, and markets da Vinci® surgical systems and the Ion® endoluminal system. The Company’s products and related services enable physicians and healthcare providers to improve the quality of and access to minimally invasive care. The da Vinci surgical system is designed to enable surgeons to perform a wide range of surgical procedures within our targeted general surgery, urologic, gynecologic, cardiothoracic, and head and neck specialties and consists of a surgeon console or consoles, a patient-side cart, and a high-performance vision system. The Ion endoluminal system is a flexible, robotic-assisted, catheter-based platform for which the first cleared indication is minimally invasive biopsies in the lung and consists of a system cart, a controller, a catheter, and a vision probe. Both systems use software, instruments, and accessories.
NOTE 2. SUMMARY OF SIGNIFICANT ACCOUNTING POLICIES
Basis of Presentation
The accompanying Consolidated Financial Statements and accompanying notes have been prepared in accordance with accounting principles generally accepted in the United States of America (“GAAP”) and include the accounts of the Company and its wholly and majority-owned subsidiaries. All intercompany balances and transactions have been eliminated in consolidation.
The Consolidated Financial Statements include the results and balances of the Company’s majority-owned joint ventures, Intuitive Surgical-Fosun Medical Technology (Shanghai) Co., Ltd. and Intuitive Surgical-Fosun (HongKong) Co., Ltd. (collectively, the “Joint Venture”) with Shanghai Fosun Pharmaceutical (Group) Co., Ltd. (“Fosun Pharma”). The Company holds a controlling financial interest in the Joint Venture, and the noncontrolling interest is reflected as a separate component of the consolidated stockholders’ equity. The noncontrolling interest’s share of the earnings in the Joint Venture is presented separately in the Consolidated Statements of Income and Comprehensive Income for the years ended December 31, 2024, 2023, and 2022.
Use of Estimates
The preparation of financial statements in conformity with GAAP requires management to make estimates and assumptions that affect the amounts reported in the Consolidated Financial Statements and accompanying Notes to the Consolidated Financial Statements. The accounting estimates that require management’s most significant, complex, and subjective judgments include the valuation and recognition of investments, the standalone selling prices used to allocate the contract consideration to the individual performance obligations, the valuation of inventory, the valuation of and assessment of the recoverability of intangible assets and goodwill, the recognition and measurement of current and deferred income taxes, including the measurement of uncertain tax positions, and the estimates for legal contingencies. Actual results could differ materially from these estimates.
Concentrations of Credit Risk and Other Risks and Uncertainties
The carrying amounts for financial instruments consisting of cash and cash equivalents, accounts receivable, accounts payable, and accrued liabilities approximate fair value due to their short maturities. Marketable securities and derivative instruments are stated at their estimated fair values, based on quoted market prices for the same or similar instruments. The counterparties to the agreements relating to the Company’s investment securities and derivative instruments consist of various major corporations, financial institutions, municipalities, and government agencies of high credit standing.
The Company’s accounts receivable are primarily derived from billings related to revenue arrangements with customers and distributors located throughout the world. The Company performs credit evaluations of its customers’ financial condition and, generally, requires no collateral from its customers. The Company provides reserves for potential credit losses but has not experienced significant losses to date. As of December 31, 2024, and 2023, 66% and 65%, respectively, of accounts receivable were from domestic customers.
During the years ended December 31, 2024, 2023, and 2022, domestic revenue accounted for 67%, 66%, and 67% of total revenue, respectively, while OUS revenue accounted for 33%, 34%, and 33%, respectively, of total revenue for each of the years then ended.
The Company’s future results of operations and liquidity could be materially adversely affected by uncertainty surrounding macroeconomic and geopolitical factors in the U.S. and globally, characterized by the supply chain environment, inflationary pressure, elevated interest rates, disruptions in the commodities’ markets as a result of the conflict between Russia and Ukraine and conflicts in the Middle East, including Israel and Iran, and the introduction of or changes in tariffs or trade barriers.
Supply chain constraints have generally improved to pre-COVID-19 pandemic levels, with some isolated residual stresses, particularly for engineered raw materials and at certain subcontract suppliers that are operationally challenged to meet the
Company’s production requirements. These isolated instances did not have a material impact during 2024. Additionally, material and labor prices to produce some components remain elevated from historical levels due to market dynamics, demand mix, or general cost inflation within the supply chain. With elevated interest rates, access to credit is more difficult, and any insolvency of certain suppliers, including sole- and single-sourced suppliers, may have heightened continuity risks. Incidents of cybersecurity breaches, which have not significantly impacted the Company’s supply chain to date, also remain an active threat to sustained supply continuity. The Company is actively engaged in activities that seek to mitigate the impact of any supply chain risks and disruptions on its operations.
Some hospitals continue to experience challenges with staffing and cost pressures that could affect their ability to provide patient care. Additionally, certain hospitals are facing significant financial pressure as supply chain constraints and inflation have driven up operating costs, and elevated interest rates have made access to credit more expensive. Hospitals may also be adversely affected by the liquidity concerns as a result of the broader macroeconomic environment. Any or all of these factors could negatively impact the number of da Vinci procedures performed or surgical systems placed and have a material adverse effect on the Company’s business, financial condition, or results of operations. As of the date of issuance of these Consolidated Financial Statements, the extent to which these macroeconomic factors may materially adversely affect the Company’s financial condition, liquidity, or results of operations is uncertain.
Cash and Cash Equivalents
The Company considers all highly liquid investments with an original maturity from the date of purchase of 90 days or less to be cash equivalents.
Restricted Cash
Amounts included in restricted cash primarily relate to the Company’s insurance programs and certain employee-related benefits. Restricted cash included in prepaids and other current assets as of December 31, 2024, and 2023 was $20.0 million and $5.0 million, respectively. Restricted cash included in intangible and other assets, net, as of both December 31, 2024, and 2023, was $15.0 million.
Investments
Available-for-sale debt securities. The Company’s investments may consist of money market funds, U.S. treasury and U.S. government agency securities, high-quality corporate notes and bonds, commercial paper, non-U.S. government agency securities, and taxable and tax-exempt municipal notes. The Company has designated all investments as available-for-sale and, therefore, the investments are subject to periodic impairment under the available-for-sale debt security impairment model. Available-for-sale debt securities in an unrealized loss position are written down to fair value through a charge to interest and other income, net, if the Company intends to sell the security or it is more likely than not the Company will be required to sell the security before recovery of its amortized cost basis. The Company evaluates the remaining securities to determine what amount of the excess, if any, is caused by expected credit losses. A decline in fair value attributable to expected credit losses is recorded to interest and other income, net, while any portion of the loss related to non-credit factors is recorded in accumulated other comprehensive income (loss). For securities sold prior to maturity, the cost of the securities sold is based on the specific identification method. Realized gains and losses on the sale of investments are recorded in interest and other income, net in the Consolidated Statements of Income. Investments with remaining maturities at the date of purchase greater than 90 days and remaining maturities as of the reporting period of less than one year are classified as short-term investments. Investments with remaining maturities greater than one year are classified as long-term investments.
Equity investments. From time to time, the Company holds equity investments with readily determinable fair values and equity investments without readily determinable fair values. The Company recognizes equity investments with readily determinable fair values at the quoted market price with changes in value recorded in interest and other income, net. The Company generally recognizes equity investments that do not have readily determinable fair values at cost minus impairment, if any, plus or minus changes resulting from observable price changes in orderly transactions for the identical or a similar investment of the same issuer.
Fair Value Measurements
The Company measures the fair value of money market funds, certain U.S. treasury securities, and equity investments with readily determinable value based on quoted prices in active markets for identical assets as Level 1 securities. Marketable securities measured at fair value using Level 2 inputs are, or have been, primarily comprised of commercial paper, corporate notes and bonds, U.S. and non-U.S. government agencies, municipal notes, and equity investments without readily determinable value. The Company reviews trading activity and pricing for these investments as of the measurement date. When sufficient quoted pricing for identical securities is not available, the Company uses market pricing and other observable market inputs for similar securities obtained from various third-party data providers. These inputs either represent quoted prices for similar assets in active markets or have been derived from observable market data. This approach results in the Level 2 classification of these securities within the fair value hierarchy.
Inventory
Inventory is stated at the lower of cost or net realizable value on a first-in, first-out basis. Inventory costs include direct materials, direct labor, and normal manufacturing overhead. The cost basis of the Company’s inventory is reduced for any products that are considered excessive or obsolete based upon assumptions about future demand and market conditions. Additionally, the cost basis of the Company’s inventory does not include any unallocated fixed overhead costs associated with abnormally low utilization of its factories.
Property, Plant, and Equipment
Property, plant, and equipment are stated at cost, net of accumulated depreciation. Depreciation is computed on a straight-line basis over the estimated useful lives of the assets, down to the estimated salvage value, if any. The salvage value of operating lease assets is estimated based on a number of factors including, but not limited to, the lease term, technological obsolescence, and the expected future demand for refurbished systems.
Depreciation is recognized over the following estimated useful lives:
| | | | | |
| | Useful Lives |
| Building | Up to 30 years |
| Building improvements | Up to 15 years |
| Leasehold improvements | Lesser of useful life or term of lease |
| Equipment and furniture | 5 years |
| Operating lease assets | 1 to 7 years |
| Computer and office equipment | 3 to 5 years |
| Enterprise-wide software | 5 to 8 years |
| Purchased software | Lesser of 3 years or life of license |
| |
|
Depreciation expense for the years ended December 31, 2024, 2023, and 2022, was $439 million, $382 million, and $326 million, respectively.
Capitalized Software Costs for Internal Use
The Company capitalizes direct costs associated with developing or obtaining internal use software, including enterprise-wide business software, which are incurred during the application development stage. These capitalized costs are recorded as capitalized software within property, plant, and equipment. Costs related to preliminary project activities and post-implementation activities are expensed as incurred. Once the software is ready for its intended use, amounts capitalized are amortized over an estimated useful life of up to 8 years on a straight-line basis.
Implementation Costs in a Cloud Computing Arrangement
The Company capitalizes qualified implementation costs incurred in a hosting arrangement that is a service contract for which it is the customer in accordance with the requirements for capitalizing costs incurred to develop internal-use software. These capitalized implementation costs are recorded within intangible and other assets, net, and are generally amortized over the fixed, non-cancellable term of the associated hosting arrangement on a straight-line basis.
During the years ended December 31, 2024, 2023, and 2022, the Company recognized $10.8 million, $10.2 million, and $6.4 million of amortization expense associated with capitalized implementation costs, respectively.
Business Combinations
The Company accounts for business acquisitions in accordance with ASC 805, Business Combinations. This standard requires the acquiring entity in a business combination to recognize the assets acquired, liabilities assumed, and any noncontrolling interest in the acquiree using acquisition-date fair values. Certain provisions of this standard prescribe, among other things, the determination of acquisition-date fair value of consideration paid in a business combination, including contingent consideration. The excess of the acquisition-date fair value of consideration paid over the fair values of the identifiable assets and liabilities is recorded as goodwill. Acquisition-related costs are recognized separately from the business combination and are expensed as incurred. The Company includes the results of operations of the businesses that are acquired as of the acquisition date.
Goodwill and Intangible Assets
Goodwill and intangible assets with indefinite useful lives are not amortized but are tested for impairment at least annually during the fourth quarter, or if circumstances indicate their value may no longer be recoverable. Goodwill represents the excess
of the purchase price over the fair value of net identifiable assets and liabilities. The Company continues to operate in one segment, which is considered to be the sole reporting unit and, therefore, goodwill was tested for impairment at the enterprise level.
Intangible assets are carried at cost, net of accumulated amortization. The Company does not have intangible assets with indefinite useful lives other than goodwill. Amortization is recorded on a straight-line basis over the intangible assets’ useful lives, which range from approximately 3 to 8 years.
Impairment of Long-lived Assets
The Company evaluates long-lived assets, which include finite-lived intangible and tangible assets, for impairment whenever events or changes in circumstances indicate that the carrying value of long-lived assets may not be recoverable. Recoverability is measured by comparing the net book value to the future undiscounted cash flows attributable to such assets. The Company recognizes an impairment charge equal to the amount by which the net book value exceeds its fair value. No material impairment losses were incurred in the periods presented.
Revenue Recognition
The Company’s revenue consists of product revenue, resulting from the sale of systems, system components, and instruments and accessories, and service revenue. The Company accounts for a contract with a customer when there is a legally enforceable contract between the Company and its customer, the rights of the parties are identified, the contract has commercial substance, and the collectability of the contract consideration is probable. The Company’s revenues are measured based on the consideration specified in the contract with each customer, net of any sales incentives and taxes collected from customers that are remitted to government authorities.
The Company’s system sale arrangements generally contain multiple products and services. For these bundled sale arrangements, the Company accounts for individual products and services as separate performance obligations if they are a distinct product or service that is separately identifiable from other items in bundled packages and if a customer can benefit from the product or service on its own or with other resources that are readily available to the customer. The Company’s system sale arrangements include a combination of the following performance obligations: system(s); system components; system accessories; instruments; accessories; and system service. The Company’s system sale arrangements generally include a five-year period of service. The first year of service is generally free and included in the system sale arrangement, and the remaining four years are generally included at a stated service price. The Company considers the service terms in the arrangements that are legally enforceable to be performance obligations. Other than service, the Company generally satisfies all of the performance obligations at a point in time. System components, system accessories, instruments, accessories, and service are also sold on a stand-alone basis.
For multiple-element arrangements, revenue is allocated to each performance obligation based on its relative standalone selling price. Standalone selling prices are based on observable prices at which the Company separately sells the products or services. If a standalone selling price is not directly observable, then the Company estimates the standalone selling price considering market conditions and entity-specific factors including, but not limited to, historical pricing data, features and functionality of the products and services, geographies, and type of customer. The Company regularly reviews standalone selling prices and updates these estimates, as necessary.
The Company recognizes revenue as the performance obligations are satisfied by transferring control of the product or service to a customer. The Company generally recognizes revenue for the performance obligations in the following manner:
System sales. For systems (including system components and system accessories) sold directly to end customers, revenue is recognized when the Company transfers control to the customer, which is generally at the point when acceptance occurs that indicates customer acknowledgment of delivery or installation, depending on the terms of the arrangement. For systems sold through distributors, revenue is recognized generally at the time of shipment. The Company’s system arrangements generally do not provide a right of return. The systems are generally covered by a one-year warranty. Warranty costs were not material for the periods presented.
Instruments and accessories. Revenue from sales of instruments and accessories is recognized when control is transferred to the customers, which generally occurs at the time of shipment but also could occur at the time of delivery, depending on the customer arrangement. The Company generally allows its customers in the normal course of business to return unused products for a limited period of time subsequent to the initial purchase and records an allowance against revenue for estimated returns.
Service. Service revenue is recognized over the term of the service period, as the customer benefits from the services throughout the service period. Revenue related to services performed on a time-and-materials basis is recognized when performed.
Transactions involving system trade-ins
Customers can negotiate to trade in their older systems for a credit towards the purchase of a newer generation system. Such trade-in transactions are generally not based on any pre-existing rights granted by the Company and are generally negotiated separately based on the circumstances at the time of the trade-in and based on the then-fair value of the underlying system. Accordingly, such trade-ins are generally not considered separate performance obligations.
When a specified-price trade-in right is granted at the time of a system purchase, it generally provides for a trade-in credit that declines over time and requires the customer to enter into a new purchase agreement to exercise that right. The Company accounts for such rights as a guarantee and reduces the total consideration by the fair value of that guarantee. The remaining consideration is then allocated to each performance obligation based on their relative fair value. The liability recognized for these guarantees was not material for any of the years presented.
Traded-in systems can generally be reconditioned and resold. The Company accounts for the fair value of the traded-in system as additional consideration. When there is no market for the traded-in system, no value is assigned. The value of the traded-in system is reported as a component of inventory until resold.
Purchases of system components
Customers have the opportunity to add additional features to their systems at a price that is separately negotiated, for example, by adding a second surgeon console for use with the da Vinci surgical system. Revenue is recognized when the component level features have been provided and all revenue recognition criteria are met.
Assets Recognized from the Cost to Obtain a Contract with a Customer
The Company has determined that certain sales incentives provided to the Company’s sales team are required to be capitalized when the Company expects to generate future economic benefits from the related revenue-generating contracts subsequent to the initial sales transaction. When determining the economic life of the contract acquisition assets recognized, the Company considers historical contract renewal rates, expectations of future contract renewals, and other factors that could impact the economic benefits that the Company expects to generate from that arrangement. Capitalized contract acquisition costs are recorded within intangible and other assets, net and are amortized over their economic life on a straight-line basis. The amounts capitalized as contract acquisition costs were $110.9 million and $89.3 million as of December 31, 2024, and 2023, respectively.
During the years ended December 31, 2024, 2023, and 2022, the Company recognized $37.7 million, $33.0 million, and $26.6 million of amortization expense associated with contract acquisition assets, respectively. The Company did not incur any impairment losses during the periods presented.
Intuitive System Leasing
The Company enters into lease arrangements with certain qualified customers. Leases have terms that generally range from 12 to 84 months and are usually collateralized by a security interest in the underlying assets. The Company also leases systems to certain qualified customers under usage-based arrangements that have terms of up to 84 months. For these usage-based lease arrangements, the lease fee is generally billed monthly in arrears based on a contractual per-use fee where usage is generally defined as the number of procedures performed with the system.
Revenue related to multiple-element arrangements are allocated to lease and non-lease elements based on their relative standalone selling prices as prescribed by the Company’s revenue recognition policy. Lease elements generally include a system or system component, while non-lease elements generally include service. For some lease arrangements, customers are provided with the right to purchase the leased system at some point during and/or at the end of the lease term. Except for usage-based lease arrangements, lease arrangements generally do not provide rights for the customers to exit or terminate the lease without incurring a penalty. Certain lease arrangements may also include upgrade rights that allow customers to upgrade the leased system to newer technology at some point during the lease term. Generally, these upgrade rights do not specify the terms, including the price or structure of the future upgrade transactions and are subject to negotiation and mutual agreement of terms based on the circumstances at the time of the upgrade, including the then-fair value of the system as well as other factors. System upgrade transactions generally will result in a modification of the existing lease. The Company accounts for lease modifications at the time a new or amended contract is executed.
In determining whether a transaction should be classified as a sales-type or operating lease (whether fixed-payment or usage-based), the Company considers the following terms at lease commencement: (1) whether title of the system transfers automatically or for a nominal fee by the end of the lease term; (2) whether the present value of the minimum lease payments equals or exceeds substantially all of the fair value of the leased system; (3) whether the lease term is for the major part of the remaining economic life of the leased system; (4) whether the lease grants the lessee an option to purchase the leased system that the lessee is reasonably certain to exercise; and (5) whether the underlying system is of such a specialized nature that it is expected to have no alternative use to the Company at the end of the lease term.
The Company generally recognizes revenue from sales-type lease arrangements at the time the system is accepted by the customer, assuming all other revenue recognition criteria have been met. Revenue related to lease elements from sales-type leases is presented as product revenue. Revenue related to lease elements from fixed-payment operating lease arrangements is generally recognized on a straight-line basis over the lease term and is presented as product revenue. Revenue related to lease elements from usage-based arrangements is recognized as the customers utilize the systems and is presented as product revenue.
Other Leasing Arrangements
The Company determines if an arrangement contains a lease at inception. For arrangements where the Company is the lessee, operating leases are included in intangible and other assets, net, other accrued liabilities, and other long-term liabilities on the Consolidated Balance Sheet as of December 31, 2024. The Company currently does not have any finance leases.
Operating lease right-of-use (“ROU”) assets and operating lease liabilities are recognized based on the present value of the future minimum lease payments over the lease term at the commencement date. ROU assets also include any initial direct costs incurred and any lease payments made at or before the lease commencement date, less lease incentives received. The Company uses its incremental borrowing rate based on the information available at the commencement date in determining the lease liabilities, as the Company does not have insight into the inputs necessary to calculate the implicit rate of the leases. Lease terms may include options to extend or terminate when the Company is reasonably certain the option will be exercised. Lease expense is recognized on a straight-line basis over the lease term.
The Company also has lease arrangements with lease and non-lease components. The Company elected the practical expedient not to separate non-lease components from lease components for the Company’s real estate and automobile leases. Additionally, the Company applied a portfolio approach to effectively account for the operating lease ROU assets and lease liabilities for the Company’s automobile leases. The Company also elected to apply the short-term lease measurement and recognition exemption in which ROU assets and lease liabilities are not recognized for leases with terms of 12 months or less.
Credit Losses
Trade accounts receivable. The allowance for doubtful accounts is based on the Company’s assessment of the collectibility of customer accounts. The Company regularly reviews the allowance by considering factors such as historical experience, credit quality, age of the accounts receivable balances, and current economic conditions that may affect a customer’s ability to pay. For the years ended December 31, 2024, and 2023, bad debt expense was not material.
Net investment in sales-type leases. The Company enters into sales-type leases with certain qualified customers to purchase its systems. Sales-type leases have terms that generally range from 24 to 84 months and are usually collateralized by a security interest in the underlying assets. The allowance for loan loss is based on the Company’s assessment of the current expected lifetime loss on lease receivables. The Company regularly reviews the allowance by considering factors such as historical experience, credit quality, age of the lease receivable balances, and current economic conditions that may affect a customer’s ability to pay. Lease receivables are considered past due 90 days after invoice.
The Company manages the credit risk of the net investment in sales-type leases using a number of factors relating to our customers, including, but not limited to, the following: size of operations; profitability, liquidity, and debt ratios; payment history; and past due amounts. The Company also uses credit scores obtained from external providers as a key indicator for the purposes of determining credit quality. The following table summarizes the amortized cost basis by year of origination and by credit quality for the net investment in sales-type leases as of December 31, 2024 (in millions):
| | | | | | | | | | | | | | | | | | | | | | | | | | | | | | | | | | | | | | | | | | |
| 2024 | | 2023 | | 2022 | | 2021 | | 2020 | | | Prior | | Net Investment |
| Credit Rating: | | | | | | | | | | | | | | |
| High | $ | 73.2 | | | $ | 30.0 | | | $ | 41.7 | | | $ | 31.4 | | | $ | 7.4 | | | | $ | 0.7 | | | $ | 184.4 | |
| Moderate | 82.8 | | | 23.7 | | | 43.1 | | | 27.5 | | | 11.2 | | | | 1.1 | | | 189.4 | |
| Low | 2.1 | | | 1.0 | | | 0.9 | | | 1.5 | | | 0.2 | | | | — | | | 5.7 | |
| Total | $ | 158.1 | | | $ | 54.7 | | | $ | 85.7 | | | $ | 60.4 | | | $ | 18.8 | | | | $ | 1.8 | | | $ | 379.5 | |
| | | | | | | | | | | | | | |
| | | | | | | | | | | | | | |
| | | | | | | | | | | | | | |
For the year ended December 31, 2024, and 2023, credit losses related to the net investment in sales-type leases were not material.
The Company’s exposure to credit losses may increase if its customers are adversely affected by changes in healthcare laws, procedure coverage, and reimbursement, economic pressures or uncertainty associated with local or global economic recessions, disruption associated with COVID-19, or other customer-specific factors. Although the Company has historically not experienced significant credit losses, it is possible that there could be a material adverse impact from potential adjustments of the carrying amount of trade and lease receivables as hospital cash flows are impacted by macroeconomic factors, including inflation, high interest rates, and staffing shortages.
Available-for-sale debt securities. The Company regularly reviews the securities in an unrealized loss position and evaluates the current expected credit loss by considering factors such as historical experience, market data, financial condition and near-term prospects of the investee, the extent of the loss related to the credit of the issuer, and the expected cash flows from the security. The Company segments its portfolio based on the underlying risk profiles of the securities and has a zero-loss expectation for U.S. treasury and U.S. government agency securities. The basis for this assumption is that these securities have consistently high credit ratings by rating agencies, have a long history with no credit losses, are explicitly guaranteed by a sovereign entity, which can print its own currency, and are denominated in a currency that is routinely held by central banks, used in international commerce, and commonly viewed as a reserve currency. Additionally, all of the Company’s investments in corporate debt securities and municipal securities are in securities with high-quality credit ratings, which have historically experienced low rates of default. For the years ended December 31, 2024, and 2023, credit losses related to available-for-sale debt securities were not material.
Allowance for Sales Returns
The allowance for sales returns is based on the Company’s estimates of potential future returns of certain products related to current period product revenue. The Company analyzes historical returns, current economic trends, and changes in customer demand and acceptance of the Company’s products.
Share-Based Compensation
The Company grants long-term equity awards under its stock-based compensation plans to certain employees and non-employee directors of the Company. These awards include restricted stock units, stock options, and performance stock units. The Company accounts for share-based compensation plans using the fair value recognition and measurement provisions under GAAP. The Company’s share-based compensation cost is measured at the grant date, based on the fair value of the award, and is recognized as expense on a straight-line basis over the requisite service period. The Company estimates expected forfeitures at the time of grant and revises the estimate, if necessary, in subsequent periods if actual forfeitures differ from those estimated.
Restricted stock units. The fair value of restricted stock units (“RSUs”) is determined based on the closing quoted price of the Company’s common stock on the date of the grant.
Stock options. The Black-Scholes-Merton option-pricing model is used to estimate the fair value of stock options granted and utilizes the following inputs: (1) closing quoted price of the Company’s common stock on the date of grant; (2) expected term; (3) expected volatility; and (4) risk-free interest rate.
Expected Term: The expected term represents the weighted-average period that the stock options are expected to be outstanding prior to being exercised. The Company determines expected term based on historical exercise patterns and its expectation of the time that it will take for employees to exercise options still outstanding.
Expected Volatility: The Company uses market-based implied volatility for purposes of valuing stock options granted. Market-based implied volatility is derived based on actively traded options with expirations greater than one year on the Company’s common stock. The extent to which the Company relies on market-based volatility when valuing options depends, among other things, on the availability of traded options on the Company’s stock and the term of such options. Due to a sufficient volume of traded options, the Company used 100% market-based implied volatility to value options granted, which the Company believes is more representative of future stock price trends than historical volatility.
Risk-Free Interest Rate: The risk-free interest rate is based on the U.S. treasury yield curve in effect at the time of grant for the expected term of the stock option.
Performance stock units. Performance stock units (“PSUs”) include predefined performance and market conditions. The fair value of performance stock units with performance conditions is based on the closing quoted price of the Company’s common stock on the date of the grant. The Company estimates the number of awards with performance conditions that will ultimately vest based on the probability of achievement each quarter to determine the amount of compensation expense to recognize each reporting period. The fair value of performance stock units that include a market condition is determined using a Monte Carlo valuation model.
Employee stock purchase plan. The fair value of shares to be issued under the Company’s Employee Stock Purchase Plan (the “ESPP”) is computed using the Black-Scholes-Merton option-pricing model at the commencement of an offering period in February and August of each year utilizing the following inputs: (1) closing quoted price of the Company’s common stock on the initial date of the offering period; (2) expected term; (3) expected volatility; and (4) risk-free interest rate. Share-based compensation for the ESPP is recognized as expense on a straight-line basis over the two-year offering period.
See “Note 10. Share-Based Compensation” for a detailed discussion of the Company’s stock plans and share-based compensation expense.
Computation of Net Income per Share
Basic net income per share attributable to Intuitive Surgical, Inc. is computed using the weighted-average number of shares outstanding during the period. Diluted net income per share attributable to Intuitive Surgical, Inc. is computed using the weighted-average number of the Company’s shares and dilutive potential shares outstanding during the period. Dilutive potential shares primarily consist of RSUs, stock options, PSUs, and shares to be purchased by employees under the Company’s ESPP.
Employee equity share options, non-vested shares, and similar equity instruments granted by the Company are treated as potential common shares outstanding in computing diluted earnings per share. Diluted shares outstanding include the dilutive effect of equity awards, which is calculated based on the average share price for each fiscal period using the treasury stock method. Under the treasury stock method, the amount the employee must pay for exercising stock options and the amount of compensation cost for future service that the Company has not yet recognized are assumed to be used to repurchase shares.
Research and Development Expenses
Research and development costs are expensed as incurred and include amortization of intangible assets, costs associated with co-development research and development licensing arrangements, costs of prototypes, salaries, benefits and other headcount-related costs, contract and other outside service fees, and facilities and overhead costs.
Foreign Currency and Other Hedging Instruments
For subsidiaries whose local currency is their functional currency, their assets and liabilities are translated into U.S. dollars at exchange rates at the balance sheet date, and revenues and expenses are translated using exchange rates in effect during the period. Gains and losses from foreign currency translation are included in accumulated other comprehensive income (loss) within stockholders’ equity in the Consolidated Balance Sheets. For all non-functional currency monetary account balances, the re-measurement of such balances to the functional currency results in either a foreign exchange gain or loss, which is recorded to interest and other income, net in the Consolidated Statements of Income in the same accounting period that the re-measurement occurred.
The Company uses derivatives to partially offset its business exposure to foreign currency exchange risk. The terms of the Company’s derivative contracts are generally thirteen months or shorter. The Company typically hedges portions of its forecasted foreign currency exposure associated with revenue and expenses. The Company may also enter into foreign currency forward contracts to offset the foreign currency exchange gains and losses generated by the re-measurement of certain assets and liabilities denominated in non-functional currencies. The hedging program is not designated for trading or speculative purposes.
The Company’s accounting policies for these instruments are based on whether the instruments are designated as hedging or non-hedging instruments. The Company records all derivatives on the Consolidated Balance Sheets at fair value. The effective portions of cash flow hedges are recorded in other comprehensive income (loss) (“OCI”) until the hedged item is recognized in earnings. Derivative instruments designated as cash flow hedges are de-designated as hedges when it is probable that the forecasted hedged transaction will not occur in the initially identified time period or within a subsequent two-month time period. Gains and losses in OCI associated with such derivative instruments are reclassified immediately into earnings through interest and other income, net. Any subsequent changes in the fair value of such derivative instruments also are reflected in current earnings. Derivatives that are not designated as hedging instruments and the ineffective portions of cash flow hedges are adjusted to fair value through earnings in interest and other income, net.
Income Taxes
Deferred tax assets and liabilities are recognized for the future tax consequences attributable to differences between the financial statement carrying amounts of existing assets and liabilities and their respective tax bases. Deferred tax assets and liabilities are measured using enacted tax rates expected to apply to taxable income in the year in which those temporary differences are expected to be recovered or settled. The effect on deferred tax assets and liabilities of a change in tax rates is recognized in income in the period that includes the enactment date. Valuation allowances are established, when necessary, to reduce deferred tax assets to the amounts that are expected more likely than not to be realized in the future.
The Company recognizes tax benefits from uncertain tax positions only if it is more likely than not that the tax position will be sustained on examination by the taxing authorities, based on the technical merits of the position. The tax benefits recognized in the Consolidated Financial Statements from such positions are then measured based on the largest benefit that has a greater than 50% likelihood of being realized upon ultimate settlement. The Company includes interest and penalty on unrecognized tax benefits as a component of its income tax expense.
The Company recognizes excess tax benefits and tax deficiencies in the provision for income taxes as discrete items in the period when the awards vest or are settled. The Company accounts for Global Intangible Low-Taxed Income (“GILTI”) as period costs when incurred.
Legal Contingencies
From time to time, the Company is involved in a number of legal proceedings involving product liability, intellectual property, shareholder derivative actions, securities class actions, employees, and other matters. A liability and related charge are recorded to earnings in the Company’s Consolidated Financial Statements for legal contingencies when the loss is considered probable and the amount can be reasonably estimated. The assessment is re-evaluated each period and is based on all available information, including discussion with any outside legal counsel that represents the Company. If a reasonable estimate of a known or probable loss cannot be made, but a range of probable losses can be estimated, the low-end of the range of losses is recognized if no amount within the range is a better estimate than any other. If a material loss is reasonably possible but not probable and can be reasonably estimated, the estimated loss or range of loss is disclosed in the Notes to the Consolidated Financial Statements. The Company expenses legal fees as incurred.
When determining the estimated probable loss or range of losses, significant judgment is required to be exercised in order to estimate the amount and timing of the loss to be recorded. Estimates of probable losses resulting from litigation are inherently difficult to make, particularly when the matters are in early procedural stages with incomplete facts and information. The final outcome of legal proceedings is dependent on many variables that are difficult to predict and, therefore, the ultimate cost to entirely resolve such matters may be materially different than the amount of current estimates. Consequently, new information or changes in judgments and estimates could have a material adverse effect on the Company’s business, financial condition, and results of operations or cash flows.
Recently Adopted Accounting Pronouncements
In November 2023, the Financial Accounting Standards Board (“FASB”) issued Accounting Standards Update (“ASU”) 2023-07, Segment Reporting (Topic 280): Improvements to Reportable Segment Disclosures (“ASU 2023-07”), which requires all public entities, including public entities with a single reportable segment, to provide in interim and annual periods one or more measures of segment profit or loss used by the chief operating decision maker to allocate resources and assess performance. Additionally, the standard requires disclosures of significant segment expenses and other segment items as well as incremental qualitative disclosures.
Intuitive adopted ASU 2023-07 effective December 31, 2024, on a retrospective basis. The adoption of 2023-07 did not change the way that the Company identifies its reportable segments and, as a result, did not have a material impact on the Company’s segment-related disclosures. Refer to Note 13 for further information on Intuitive’s reportable segment.
Recently Issued Accounting Pronouncements
In December 2023, the FASB issued ASU 2023-09, Income Taxes (Topic 740): Improvements to Income Tax Disclosures (“ASU 2023-09”), which requires enhanced income tax disclosures, including specific categories and disaggregation of information in the effective tax rate reconciliation, disaggregated information related to income taxes paid, income or loss from continuing operations before income tax expense or benefit, and income tax expense or benefit from continuing operations. The requirements of the ASU are effective for annual periods beginning after December 15, 2024, with early adoption permitted. The Company is currently in the process of evaluating the impact of this pronouncement on our related disclosures.
In November 2024, the FASB issued ASU 2024-03, Income Statement—Reporting Comprehensive Income—Expense Disaggregation Disclosures (Subtopic 220-40): Disaggregation of Income Statement Expenses (“ASU 2024-03”), which requires disclosure about the types of costs and expenses included in certain expense captions presented on the income statement. The new disclosure requirements are effective for the Company’s annual periods beginning after December 15, 2026, and interim periods beginning after December 15, 2027, with early adoption permitted. The Company is currently in the process of evaluating the impact of this pronouncement on our related disclosures.
The Company continues to monitor new accounting pronouncements issued by the FASB and does not believe any accounting pronouncements issued through the date of this report will have a material impact on the Company’s Consolidated Financial Statements.
NOTE 3. FINANCIAL INSTRUMENTS
Cash, Cash Equivalents, and Investments
The following tables summarize the Company’s cash and available-for-sale debt securities’ amortized cost, gross unrealized gains, gross unrealized losses, allowance for credit loss, and fair value by significant investment category reported as cash and cash equivalents, short-term investments, or long-term investments as of December 31, 2024, and 2023 (in millions):
| | | | | | | | | | | | | | | | | | | | | | | | | | | | | | | | | | | | | | | | | | | | | | | |
| | | | | | | | | | | Reported as: |
| Amortized
Cost | | Gross
Unrealized
Gains | | Gross
Unrealized
Losses | | Allowance for Credit Loss | | Fair
Value | | Cash and
Cash
Equivalents | | Short-term
Investments | | Long-term
Investments |
| December 31, 2024 | | | | | | | | | | | | | | | |
| Cash | $ | 479.4 | | | $ | — | | | $ | — | | | $ | — | | | $ | 479.4 | | | $ | 479.4 | | | $ | — | | | $ | — | |
| Level 1: | | | | | | | | | | | | | | | |
| Money market funds | 1,516.1 | | | — | | | — | | | — | | | 1,516.1 | | | 1,516.1 | | | — | | | — | |
| U.S. treasuries | 6,011.5 | | | 13.2 | | | (27.5) | | | — | | | 5,997.2 | | | 31.9 | | | 1,637.4 | | | 4,327.9 | |
| Subtotal | 7,527.6 | | | 13.2 | | | (27.5) | | | — | | | 7,513.3 | | | 1,548.0 | | | 1,637.4 | | | 4,327.9 | |
| Level 2: | | | | | | | | | | | | | | | |
| | | | | | | | | | | | | | | |
| Corporate debt securities | 287.5 | | | 0.1 | | | (3.7) | | | (0.1) | | | 283.8 | | | — | | | 189.7 | | | 94.1 | |
| U.S. government agencies | 552.2 | | | 1.5 | | | (2.4) | | | — | | | 551.3 | | | — | | | 154.2 | | | 397.1 | |
| | | | | | | | | | | | | | | |
| Municipal securities | 4.7 | | | — | | | (0.1) | | | — | | | 4.6 | | | — | | | 4.6 | | | — | |
| Subtotal | 844.4 | | | 1.6 | | | (6.2) | | | (0.1) | | | 839.7 | | | — | | | 348.5 | | | 491.2 | |
| | | | | | | | | | | | | | | |
| | | | | | | | | | | | | | | |
| | | | | | | | | | | | | | | |
| Total assets measured at fair value | $ | 8,851.4 | | | $ | 14.8 | | | $ | (33.7) | | | $ | (0.1) | | | $ | 8,832.4 | | | $ | 2,027.4 | | | $ | 1,985.9 | | | $ | 4,819.1 | |
| | | | | | | | | | | | | | | |
| | | | | | | | | | | | | | | | | | | | | | | | | | | | | | | | | | | | | | | | | | | | | | | |
| | | | | | | | | | | Reported as: |
| Amortized
Cost | | Gross
Unrealized
Gains | | Gross
Unrealized
Losses | | Allowance for Credit Loss | | Fair
Value | | Cash and
Cash
Equivalents | | Short-term
Investments | | Long-term
Investments |
| December 31, 2023 | | | | | | | | | | | | | | | |
| Cash | $ | 526.2 | | | $ | — | | | $ | — | | | $ | — | | | $ | 526.2 | | | $ | 526.2 | | | $ | — | | | $ | — | |
| Level 1: | | | | | | | | | | | | | | | |
| Money market funds | 2,223.9 | | | — | | | — | | | — | | | 2,223.9 | | | 2,223.9 | | | — | | | — | |
| U.S. treasuries | 2,850.2 | | | 20.1 | | | (25.4) | | | — | | | 2,844.9 | | | — | | | 1,276.0 | | | 1,568.9 | |
| Subtotal | 5,074.1 | | | 20.1 | | | (25.4) | | | — | | | 5,068.8 | | | 2,223.9 | | | 1,276.0 | | | 1,568.9 | |
| Level 2: | | | | | | | | | | | | | | | |
| | | | | | | | | | | | | | | |
| Corporate debt securities | 1,300.4 | | | — | | | (25.8) | | | (1.1) | | | 1,273.5 | | | — | | | 974.6 | | | 298.9 | |
| U.S. government agencies | 402.6 | | | 2.0 | | | (7.3) | | | — | | | 397.3 | | | — | | | 149.5 | | | 247.8 | |
| | | | | | | | | | | | | | | |
| Municipal securities | 79.4 | | | — | | | (2.0) | | | — | | | 77.4 | | | — | | | 73.0 | | | 4.4 | |
| Subtotal | 1,782.4 | | | 2.0 | | | (35.1) | | | (1.1) | | | 1,748.2 | | | — | | | 1,197.1 | | | 551.1 | |
| | | | | | | | | | | | | | | |
| | | | | | | | | | | | | | | |
| | | | | | | | | | | | | | | |
| Total assets measured at fair value | $ | 7,382.7 | | | $ | 22.1 | | | $ | (60.5) | | | $ | (1.1) | | | $ | 7,343.2 | | | $ | 2,750.1 | | | $ | 2,473.1 | | | $ | 2,120.0 | |
The following table summarizes the contractual maturities of the Company’s cash equivalents and available-for-sale debt securities (excluding money market funds), as of December 31, 2024 (in millions):
| | | | | | | | | | | |
| Amortized
Cost | | Fair
Value |
| Mature in less than one year | $ | 2,017.8 | | | $ | 2,017.8 | |
| Mature in one to five years | 4,838.1 | | | 4,819.1 | |
| Total | $ | 6,855.9 | | | $ | 6,836.9 | |
| | | |
| | | |
| | | |
| | | |
Actual maturities may differ from contractual maturities, because certain borrowers have the right to call or prepay certain obligations. Gross realized gains and losses recognized on the sale of investments were immaterial for the years ended December 31, 2024, and 2023.
The following tables present the breakdown of the available-for-sale debt securities with unrealized losses as of December 31, 2024, and 2023 (in millions):
| | | | | | | | | | | | | | | | | | | | | | | | | | | | | | | | | | | |
| | Unrealized losses less
than 12 months | | Unrealized losses 12
months or greater | | Total |
| December 31, 2024 | Fair
Value | | Unrealized
Losses | | Fair
Value | | Unrealized
Losses | | Fair
Value | | Unrealized
Losses |
| U.S. treasuries | $ | 2,744.4 | | | $ | (23.3) | | | $ | 190.1 | | | $ | (4.2) | | | $ | 2,934.5 | | | $ | (27.5) | |
| | | | | | | | | | | |
| Corporate debt securities | — | | | — | | | 218.7 | | | (3.7) | | | 218.7 | | | (3.7) | |
| U.S. government agencies | 178.1 | | | (1.2) | | | 106.7 | | | (1.2) | | | 284.8 | | | (2.4) | |
| Municipal securities | — | | | — | | | 4.6 | | | (0.1) | | | 4.6 | | | (0.1) | |
| Total | $ | 2,922.5 | | | $ | (24.5) | | | $ | 520.1 | | | $ | (9.2) | | | $ | 3,442.6 | | | $ | (33.7) | |
| | | | | | | | | | | |
| December 31, 2023 | | | | | | | | | | | |
| U.S. treasuries | $ | 48.5 | | | $ | — | | | $ | 1,112.9 | | | $ | (25.4) | | | $ | 1,161.4 | | | $ | (25.4) | |
| | | | | | | | | | | |
| Corporate debt securities | 54.2 | | | (0.1) | | | 1,219.2 | | | (25.8) | | | 1,273.4 | | | (25.9) | |
| U.S. government agencies | 29.8 | | | — | | | 185.6 | | | (7.3) | | | 215.4 | | | (7.3) | |
| Municipal securities | — | | | — | | | 77.4 | | | (1.9) | | | 77.4 | | | (1.9) | |
| Total | $ | 132.5 | | | $ | (0.1) | | | $ | 2,595.1 | | | $ | (60.4) | | | $ | 2,727.6 | | | $ | (60.5) | |
The current unrealized losses on the Company’s available-for-sale debt securities were caused by interest rate increases. The contractual terms of those investments do not permit the issuer to settle the securities at a price less than the amortized cost basis of the investments. As of December 31, 2024, the Company does not intend to sell the investments in unrealized loss positions, and it is not more-likely-than-not that the Company will be required to sell any of the investments before recovery of their amortized cost basis, which may be at maturity. Therefore, the Company does not expect to realize any losses on these available-for-sale debt securities. Additional factors considered in determining the treatment of unrealized losses include the financial condition and near-term prospects of the investee, the extent of the loss related to the credit of the issuer, and the expected cash flows from the security.
Equity Investments
The following table is a summary of the activity related to equity investments (in millions):
| | | | | | | | | | | | | | | | | | | | | | | | | | | | | | | | | | | |
| | | | | | | | | Reported as: |
| December 31, 2023 Carrying Value | | Changes in Fair Value (1) | | Purchases / Sales / Other (2) | | December 31, 2024 Carrying Value | | Prepaids and other current assets | | Intangible and other assets, net |
| | | | | | | | | | | |
| Equity investments without readily determinable fair value (Level 2) | $ | 74.5 | | | $ | (9.3) | | | $ | 19.4 | | | $ | 84.6 | | | $ | — | | | $ | 84.6 | |
| | | | | | | | | | | |
(1) Recorded in interest and other income, net. |
(2) Other includes foreign currency translation gains/(losses). |
| | | | | | | | | | | |
| | | | | | | | | | | |
| | | | | | | | | | | |
| | | | | | | | | | | |
During 2024, the Company did not hold any equity investments with readily determinable fair values (Level 1).
During 2024, the Company recognized a net decrease in fair value of $9.3 million primarily due to impairments and net decreases in observable price changes for certain equity investments that lack readily determinable market values (Level 2), which were also reflected in interest and other income, net.
Foreign Currency Derivatives
The objective of the Company’s hedging program is to mitigate the impact of changes in currency exchange rates on net cash flow from foreign currency-denominated sales, expenses, intercompany balances, and other monetary assets or liabilities denominated in currencies other than the U.S. dollar (“USD”). The terms of the Company’s derivative contracts are generally thirteen months or shorter. The derivative assets and liabilities are measured using Level 2 fair value inputs.
Cash Flow Hedges. The Company enters into currency forward contracts as cash flow hedges to hedge certain forecasted revenue transactions denominated in currencies other than the USD, primarily the Euro (“EUR”), the British Pound (“GBP”), the Japanese Yen (“JPY”), the Korean Won (“KRW”), the New Taiwan Dollar (“TWD”), and the Indian Rupee (“INR”). The Company also enters into currency forward contracts as cash flow hedges to hedge certain forecasted expense transactions denominated in EUR and the Swiss Franc (“CHF”).
For these derivatives, the Company reports the unrealized after-tax gain or loss from the hedge as a component of accumulated other comprehensive income (loss) in stockholders’ equity and reclassifies the amount into earnings in the same period in which the hedged transaction affects earnings. The amounts reclassified to revenue and expenses related to the hedged transactions and the ineffective portions of cash flow hedges were not material for the periods presented.
Other Derivatives Not Designated as Hedging Instruments. Other derivatives not designated as hedging instruments consist primarily of forward contracts that the Company uses to hedge intercompany balances and other monetary assets or liabilities denominated in currencies other than the USD, primarily the EUR, GBP, JPY, KRW, CHF, TWD, INR, and the Chinese Yuan (“CNY”).
These derivative instruments are used to hedge against balance sheet foreign currency exposures. The related gains and losses were as follows (in millions):
| | | | | | | | | | | | | | | | | |
| Years Ended December 31, |
| 2024 | | 2023 | | 2022 |
| Recognized gains in interest and other income, net | $ | 43.2 | | | $ | 4.8 | | | $ | 26.9 | |
| Foreign exchange losses related to balance sheet re-measurement | $ | (45.9) | | | $ | (8.5) | | | $ | (54.2) | |
| | | | | |
| | | | | |
| | | | | |
| | | | | |
The notional amounts for derivative instruments provide one measure of the transaction volume. Total gross notional amounts (in USD) for outstanding derivatives and the aggregate gross fair value at the end of each period were as follows (in millions):
| | | | | | | | | | | | | | | | | | | | | | | |
| Derivatives Designated as Hedging Instruments | | Derivatives Not Designated as Hedging Instruments |
| December 31,
2024 | | December 31,
2023 | | December 31,
2024 | | December 31,
2023 |
| Notional amounts: | | | | | | | |
| Forward contracts | $ | 382.2 | | | $ | 292.1 | | | $ | 693.5 | | | $ | 699.7 | |
| Gross fair value recorded in: | | | | | | | |
| Prepaids and other current assets | $ | 14.9 | | | $ | 3.1 | | | $ | 13.0 | | | $ | 5.0 | |
| Other accrued liabilities | $ | 2.1 | | | $ | 5.9 | | | $ | 2.4 | | | $ | 6.6 | |
NOTE 4. CONSOLIDATED FINANCIAL STATEMENT DETAILS
Balance Sheet Details
The following tables provide details of selected consolidated financial statement items (in millions):
| | | | | | | | | | | |
| | December 31, |
| Accounts receivable, net | 2024 | | 2023 |
| Trade accounts receivable, net | $ | 1,117.2 | | | $ | 1,042.2 | |
| | | |
| | | |
| Unbilled accounts receivable and other | 138.7 | | | 105.0 | |
| Sales returns and allowances | (30.5) | | | (17.0) | |
| Total accounts receivable, net | $ | 1,225.4 | | | $ | 1,130.2 | |
| | | | | | | | | | | |
| | December 31, |
| Inventory | 2024 | | 2023 |
| Raw materials | $ | 563.9 | | | $ | 454.7 | |
| Work-in-process | 205.7 | | | 159.9 | |
| Finished goods | 717.6 | | | 606.0 | |
| Total inventory | $ | 1,487.2 | | | $ | 1,220.6 | |
| | | | | | | | | | | |
| December 31, |
| Prepaids and other current assets | 2024 | | 2023 |
| Net investment in sales-type leases – short-term | 131.4 | | | 137.3 | |
| | | |
| | | |
| | | |
| | | |
| Other prepaids and other current assets | 253.7 | | | 176.7 | |
| Total prepaids and other current assets | $ | 385.1 | | | $ | 314.0 | |
| | | | | | | | | | | |
| | December 31, |
| Property, plant, and equipment, net | 2024 | | 2023 |
| Land | $ | 476.4 | | | $ | 457.3 | |
| Building and building/leasehold improvements | 1,486.3 | | | 1,002.1 | |
| Machinery and equipment | 886.3 | | | 724.2 | |
| Operating lease assets – Intuitive System Leasing | 1,579.1 | | | 1,149.7 | |
| Computer and office equipment | 184.5 | | | 153.8 | |
| Capitalized software | 283.7 | | | 257.8 | |
| Construction-in-process | 1,631.6 | | | 1,354.7 | |
| Gross property, plant, and equipment | 6,527.9 | | | 5,099.6 | |
| Less: Accumulated depreciation* | (1,881.3) | | | (1,562.0) | |
| Total property, plant, and equipment, net | $ | 4,646.6 | | | $ | 3,537.6 | |
| *Accumulated depreciation associated with operating lease assets – Intuitive System Leasing | $ | (574.5) | | | $ | (434.3) | |
| | | | | | | | | | | |
| December 31, |
| Implementation costs in cloud computing arrangements | 2023 | | 2022 |
| Capitalized implementation costs | $ | 67.6 | | | $ | 50.7 | |
| Less: Accumulated depreciation | (31.1) | | | (20.5) | |
| Total capitalized implementation costs in intangible and other assets, net | $ | 36.5 | | | $ | 30.2 | |
| | | | | | | | | | | |
| | December 31, |
| Other accrued liabilities – short-term | 2024 | | 2023 |
| Income and other taxes payable | $ | 154.4 | | | $ | 111.4 | |
| Accrued construction-related capital expenditures | 57.2 | | | 143.3 | |
| | | |
| | | |
| | | |
| | | |
| Other accrued liabilities | 335.9 | | | 332.8 | |
| Total other accrued liabilities – short-term | $ | 547.5 | | | $ | 587.5 | |
| | | | | | | | | | | |
| | December 31, |
| Other long-term liabilities | 2024 | | 2023 |
| Income taxes – long-term | $ | 239.0 | | | $ | 233.8 | |
| Deferred revenue – long-term | 54.1 | | | 45.6 | |
| Other long-term liabilities | 175.2 | | | 106.1 | |
| Total other long-term liabilities | $ | 468.3 | | | $ | 385.5 | |
Supplemental Cash Flow Information
The following table provides supplemental non-cash investing and financing activities (in millions):
| | | | | | | | | | | | | | | | | |
| Years Ended December 31, |
| 2024 | | 2023 | | 2022 |
| Income taxes paid, net | $ | 466.5 | | | $ | 447.8 | | | $ | 444.2 | |
| Supplemental non-cash investing and financing activities: | | | | | |
| Equipment transfers, including operating lease assets, from inventory to property, plant, and equipment | $ | 614.9 | | | $ | 422.4 | | | $ | 279.2 | |
| | | | | |
| Acquisition of property, plant, and equipment in accounts payable and accrued liabilities | $ | 77.2 | | | $ | 153.7 | | | $ | 73.4 | |
NOTE 5. REVENUE
Revenue from external customers is attributed to individual countries based on customer location. The following table presents revenue disaggregated by geography and type (in millions):
| | | | | | | | | | | | | | | | | | | | |
| | Years Ended December 31, |
| U.S. | | 2024 | | 2023 | | 2022 |
| Instruments and accessories | | $ | 3,626.4 | | | $ | 3,059.8 | | | $ | 2,507.2 | |
| Systems | | 1,122.6 | | | 865.5 | | | 966.0 | |
| Services | | 840.4 | | | 763.3 | | | 684.4 | |
| Total U.S. revenue | | $ | 5,589.4 | | | $ | 4,688.6 | | | $ | 4,157.6 | |
| | | | | | |
| OUS | | | | | | |
| Instruments and accessories | | $ | 1,452.6 | | | $ | 1,216.8 | | | $ | 1,010.7 | |
| Systems | | 843.4 | | | 814.2 | | | 714.1 | |
| Services | | 466.7 | | | 404.5 | | | 339.8 | |
| Total OUS revenue | | $ | 2,762.7 | | | $ | 2,435.5 | | | $ | 2,064.6 | |
| | | | | | |
| Total | | | | | | |
| Instruments and accessories | | $ | 5,079.0 | | | $ | 4,276.6 | | | $ | 3,517.9 | |
| Systems | | 1,966.0 | | | 1,679.7 | | | 1,680.1 | |
| Services | | 1,307.1 | | | 1,167.8 | | | 1,024.2 | |
| Total revenue | | $ | 8,352.1 | | | $ | 7,124.1 | | | $ | 6,222.2 | |
Remaining Performance Obligations
The transaction price allocated to remaining performance obligations relates to amounts allocated to products and services for which revenue has not yet been recognized. A significant portion of these performance obligations relate to service obligations in the Company’s system sale and lease arrangements that will be satisfied and recognized as revenue in future periods. The transaction price allocated to the remaining performance obligations was $2.62 billion as of December 31, 2024. The remaining performance obligations are expected to be satisfied over the term of the system sale, lease, and service arrangements. Approximately 43% of the remaining performance obligations are expected to be recognized in the next 12 months with the remainder recognized thereafter over the term of the system sale, lease, and service arrangements, which are generally up to 5 years.
Contract Assets and Liabilities
The following information summarizes the Company’s contract assets and liabilities (in millions):
| | | | | | | | | | | |
| December 31, |
| 2024 | | 2023 |
| Contract assets | $ | 13.9 | | | $ | 20.2 | |
| Deferred revenue | $ | 522.9 | | | $ | 491.7 | |
The Company invoices its customers based on the billing schedules in its sales arrangements. Payments are generally due 30 to 60 days from the date of invoice. Contract assets for the periods presented primarily represent the difference between the revenue that was recognized based on the relative standalone selling price of the related performance obligations satisfied and the contractual billing terms in the arrangements. Deferred revenue for the periods presented primarily relates to service contracts where the service fees are billed up-front, generally quarterly or annually, prior to those services having been performed. The associated deferred revenue is generally recognized over the term of the service period. The Company did not have any significant impairment losses on its contract assets for the periods presented.
During the year ended December 31, 2024, the Company recognized $422 million of revenue that was included in the deferred revenue balance as of December 31, 2023. During the year ended December 31, 2023, the Company recognized $396 million of revenue that was included in the deferred revenue balance as of December 31, 2022.
Intuitive System Leasing
The following table presents product revenue from Intuitive System Leasing arrangements (in millions):
| | | | | | | | | | | | | | | | | | | | |
| | Years Ended December 31, |
| | 2024 | | 2023 | | 2022 |
| Sales-type lease revenue | | $ | 163.1 | | | $ | 78.4 | | | $ | 156.4 | |
| Operating lease revenue* | | $ | 654.2 | | | $ | 500.5 | | | $ | 376.5 | |
| | | | | | |
| *Variable lease revenue related to usage-based arrangements included within operating lease revenue | | $ | 338.4 | | | $ | 216.5 | | | $ | 133.0 | |
NOTE 6. LEASES
Lessor Information related to Intuitive System Leasing
Sales-type Leases. Lease receivables relating to sales-type lease arrangements are presented on the Consolidated Balance Sheets as follows (in millions):
| | | | | | | | | | | |
| December 31, |
| 2024 | | 2023 |
| Gross lease receivables | $ | 393.4 | | | $ | 384.5 | |
| Unearned income | (13.9) | | | (12.9) | |
| Subtotal | 379.5 | | | 371.6 | |
| Allowance for credit loss | (2.6) | | | (2.7) | |
| Net investment in sales-type leases | $ | 376.9 | | | $ | 368.9 | |
| | | |
| Reported as: | | | |
| Prepaids and other current assets | $ | 131.4 | | | $ | 137.3 | |
| Intangible and other assets, net | 245.5 | | | 231.6 | |
| Net investment in sales-type leases | $ | 376.9 | | | $ | 368.9 | |
Contractual maturities of gross lease receivables as of December 31, 2024, are as follows (in millions):
| | | | | |
| Fiscal Year | Amount |
| 2025 | $ | 139.6 | |
| 2026 | 109.8 | |
| 2027 | 72.2 | |
| 2028 | 41.7 | |
| 2029 | 24.9 | |
| 2030 and thereafter | 5.2 | |
| Total | $ | 393.4 | |
Operating Leases. The Company’s fixed-payment or usage-based operating lease terms are generally less than seven years. Future lease payments (excluding non-lease elements and contingent payments related to usage-based arrangements) related to the non-cancellable portion of operating leases as of December 31, 2024, are as follows (in millions):
| | | | | |
| Fiscal Year | Amount |
| 2025 | $ | 300.7 | |
| 2026 | 240.4 | |
| 2027 | 170.4 | |
| 2028 | 108.5 | |
| 2029 | 44.8 | |
| 2030 and thereafter | 10.2 | |
| Total | $ | 875.0 | |
Lessee Information
The Company enters into operating leases primarily for real estate, automobiles, and certain equipment. Operating lease expense was $33.9 million, $26.8 million, and $25.7 million for the years ended December 31, 2024, 2023, and 2022, respectively. For leases with terms of 12 months or less, the related expense was immaterial for each of the years ended December 31, 2024, 2023, and 2022.
Supplemental cash flow information for the years ended December 31, 2024, 2023, and 2022 related to operating leases was as follows (in millions):
| | | | | | | | | | | | | | | | | | | | |
| Years Ended December 31, | | | |
| 2024 | | 2023 | | 2022 | | | |
| Cash paid for leases that were included within operating cash outflows | $ | 33.2 | | | $ | 30.2 | | | $ | 33.8 | | | | |
| Right-of-use assets recognized related to new lease obligations | $ | 88.6 | | | $ | 27.8 | | | $ | 34.0 | | | | |
| | | | | | | | |
| | | | | | | | |
| | | | | | | | |
| | | | | | | | |
| | | | | | | | |
| | | | | | | | |
| | | | | | | | |
Supplemental balance sheet information related to operating leases, as of December 31, 2024, and 2023, was as follows (in millions, except lease term and discount rate):
| | | | | | | | | | | | | | |
| December 31, | | | |
| 2024 | | 2023 | | | |
| Intangible and other assets, net (Right-of-use assets) | $ | 136.4 | | | $ | 79.3 | | | | |
| | | | | | |
| Other accrued liabilities | $ | 33.5 | | | $ | 25.3 | | | | |
| Other long-term liabilities | 112.5 | | | 64.5 | | | | |
| Total lease liabilities | $ | 146.0 | | | $ | 89.8 | | | | |
| | | | | | |
| Weighted-average remaining lease term | 5.2 years | | 3.7 years | | | |
| Weighted-average discount rate | 4.4% | | 3.4% | | | |
As of December 31, 2024, the future payments related to the Company’s operating lease liabilities are scheduled as follows (in millions):
| | | | | | | | |
| Fiscal Year | Amount | | | |
| 2025 | $ | 37.5 | | | | |
| 2026 | 35.2 | | | | |
| 2027 | 26.0 | | | | |
| 2028 | 25.3 | | | | |
| 2029 | 18.6 | | | | |
| 2030 and thereafter | 23.3 | | | | |
| Total lease payments | 165.9 | | | | |
| Less: imputed interest | (19.9) | | | | |
| Total operating lease liabilities | $ | 146.0 | | | | |
NOTE 7. GOODWILL AND INTANGIBLE ASSETS
Acquisitions
There were no material acquisitions in 2024, 2023, or 2022.
Goodwill
The following table summarizes the changes in the carrying amount of goodwill (in millions):
| | | | | | | | |
| | Amount |
| Balance as of December 31, 2022 | | $ | 348.5 | |
| Acquisition activity | | — | |
| Translation and other | | 0.2 | |
| Balance as of December 31, 2023 | | 348.7 | |
| Acquisition activity | | — | |
| Translation and other | | (1.2) | |
| Balance as of December 31, 2024 | | $ | 347.5 | |
The Company completed its annual goodwill impairment test and determined that no impairment existed. As of December 31, 2024, there has been no impairment of goodwill.
Intangible Assets
The following table summarizes the components of gross intangible asset, accumulated amortization, and net intangible asset balances as of December 31, 2024, and 2023 (in millions):
| | | | | | | | | | | | | | | | | | | | | | | | | | | | | | | | | | | | | | |
| | December 31, 2024 | | December 31, 2023 |
| | Gross Carrying Amount | | Accumulated Amortization | | Net
Carrying
Amount | | Gross Carrying Amount | | Accumulated Amortization | | Net
Carrying
Amount |
| Patents and developed technology | | $ | 203.3 | | | $ | (185.4) | | | $ | 17.9 | | | $ | 206.3 | | | $ | (178.4) | | | $ | 27.9 | |
| Customer relationships | | 27.3 | | | (22.3) | | | 5.0 | | | 32.5 | | | (22.9) | | | 9.6 | |
| Distribution rights and others | | 1.2 | | | (1.1) | | | 0.1 | | | 10.8 | | | (9.2) | | | 1.6 | |
| Total intangible assets | | $ | 231.8 | | | $ | (208.8) | | | $ | 23.0 | | | $ | 249.6 | | | $ | (210.5) | | | $ | 39.1 | |
Amortization expense related to intangible assets was $16.7 million, $20.2 million, and $27.8 million for the years ended December 31, 2024, 2023, and 2022, respectively.
The estimated future amortization expense related to intangible assets as of December 31, 2024, is as follows (in millions):
| | | | | |
| Fiscal Year | Amount |
| 2025 | $ | 12.2 | |
| 2026 | 5.4 | |
| 2027 | 3.0 | |
| 2028 | 1.4 | |
| 2029 | 0.6 | |
| 2030 and thereafter | 0.4 | |
| Total | $ | 23.0 | |
The preceding expected amortization expense is an estimate. Actual amounts of amortization expense may differ from estimated amounts due to additional intangible asset acquisitions, measurement period adjustments to intangible assets, changes in foreign currency exchange rates, impairments of intangible assets, accelerated amortization of intangible assets, and other events.
NOTE 8. COMMITMENTS AND CONTINGENCIES
Commitments
As of December 31, 2024, the Company’s commitments include an estimated amount of approximately $2.12 billion relating to the Company’s open purchase orders and contractual obligations that occur in the ordinary course of business, including commitments with contract manufacturers and suppliers for which the Company has not received the goods or services, commitments for capital expenditures and construction-related activities for which the Company has not received the services, and acquisition and licensing of intellectual property. Although open purchase orders are considered enforceable and legally binding, the terms generally allow the Company the option to cancel, reschedule, and adjust its requirements based on its business needs prior to the delivery of goods or performance of services. Additionally, the Company has committed to making certain future milestone payments to third parties as part of licensing, collaboration, and development arrangements. Payments under these arrangements generally become due and payable only upon the achievement of certain specified developmental, regulatory, and/or commercial milestones. For instances in which the achievement of these milestones is neither probable nor reasonably estimable, such contingencies are not included in the estimated amount.
Contingencies
From time to time, the Company is involved in a variety of claims, lawsuits, investigations, and proceedings relating to securities laws, product liability, intellectual property, commercial, insurance, contract disputes, employment, and other matters. Certain of these lawsuits and claims are described in further detail below. It is not possible to predict what the outcome of these matters will be, and the Company cannot guarantee that any resolution will be reached on commercially reasonable terms, if at all.
A liability and related charge to earnings are recorded in the Consolidated Financial Statements for legal contingencies when the loss is considered probable and the amount can be reasonably estimated. The assessment is re-evaluated each accounting period and is based on all available information, including the impact of negotiations, settlements, rulings, advice of legal counsel, and other information and events pertaining to each case. Nevertheless, it is possible that additional future legal costs (including settlements, judgments, legal fees, and other related defense costs) could have a material adverse effect on the Company’s business, financial condition, or future results of operations.
The Company incurred $21.2 million and $28.1 million of pre-tax litigation charges in 2024 and 2022, respectively. During the year ended 2023, pre-tax litigation charges were insignificant.
Product Liability Litigation
The Company is currently named as a defendant in a number of individual product liability lawsuits filed in various state and federal courts. The plaintiffs generally allege that they or a family member underwent surgical procedures that utilized the da Vinci surgical system and sustained a variety of personal injuries and, in some cases, death as a result of such surgery. Several of the filed cases have trial dates in the next 12 months.
The cases raise a variety of allegations including, to varying degrees, that plaintiffs’ injuries resulted from purported defects in the da Vinci surgical system and/or failure on the Company’s part to provide adequate training resources to the healthcare professionals who performed plaintiffs’ surgeries. The cases further allege that the Company failed to adequately disclose and/or misrepresented the potential risks and/or benefits of the da Vinci surgical system. Plaintiffs also assert a variety of causes of action, including, for example, strict liability based on purported design defects, negligence, fraud, breach of
express and implied warranties, unjust enrichment, and loss of consortium. Plaintiffs seek recovery for alleged personal injuries and, in many cases, punitive damages. The Company disputes these allegations and is defending against these claims.
The Company’s estimate of the anticipated cost of resolving the pending cases is based on negotiations with attorneys for the claimants. The final outcome of the pending lawsuits and claims, and others that might arise, is dependent on many variables that are difficult to predict, and the ultimate cost associated with these product liability lawsuits and claims may be materially different than the amount of the current estimate and accruals and could have a material adverse effect on the Company’s business, financial condition, or future results of operations. Although there is a reasonable possibility that a loss in excess of the amount recognized exists, the Company is unable to estimate the possible loss or range of loss in excess of the amount recognized at this time.
Patent Litigation
On October 19, 2022, a jury rendered a verdict against the Company awarding $10 million in damages to Rex Medical, L.P. in a patent infringement lawsuit. On September 20, 2023, the court granted the Company’s post-trial motion and reduced the damages to Rex Medical L.P. to nominal damages of $1. On October 18, 2023, Rex Medical filed a notice of appeal to the United States Court of Appeals for the Federal Circuit and, on October 31, 2023, Intuitive filed its notice of cross appeal. The parties have completed briefing before the Court of Appeals for the Federal Circuit. Based on currently available information, the Company does not believe that any losses arising from this matter would be material.
Commercial Litigation
On May 10, 2021, Surgical Instrument Service Company, Inc. (“SIS”) filed a complaint in the Northern District of California Court alleging antitrust claims against the Company relating to EndoWrist service, maintenance, and repair processes. The Court granted in part and denied in part the Company’s Motion to Dismiss, and discovery has commenced. The Company filed an answer denying the antitrust allegations and filed counterclaims against SIS. The counterclaims allege that SIS violated the Federal Lanham Act, California’s Unfair Competition Law, and California’s False Advertising Law and that SIS is also liable to the Company for Unfair Competition and Tortious Interference with Contract. The parties filed summary judgment and Daubert motions, and the Court held a hearing on these motions on September 7, 2023.
On March 31, 2024, the Court granted-in-part and denied-in-part both Intuitive’s and plaintiff’s motions for summary judgment, and issued additional rulings related to expert witnesses. Trial in this matter commenced on January 6, 2025. On January 28, 2025, after the close of both plaintiff’s and Intuitive’s cases in chief, the Court found in Intuitive’s favor on all of SIS’s antitrust claims and stayed Intuitive’s counterclaims. Based on currently available information, the Company is unable to make a reasonable estimate of loss or range of losses, if any, arising from this matter.
Three class action complaints were filed against the Company in the Northern District of California Court alleging antitrust allegations relating to the service and repair of certain instruments manufactured by the Company. A complaint by Larkin Community Hospital was filed on May 20, 2021, a complaint by Franciscan Alliance, Inc. and King County Public Hospital District No. 1 was filed on July 6, 2021, and a complaint by Kaleida Health was filed on July 8, 2021. The Court has consolidated the Franciscan Alliance, Inc. and King County Public Hospital District No. 1 and Kaleida Health cases with the Larkin Community Hospital case, which is now captioned on the Larkin docket as “In Re: da Vinci Surgical Robot Antitrust Litigation.” A Consolidated Amended Class Action Complaint has been filed on behalf of each plaintiff named in the earlier-filed cases. On January 14, 2022, Kaleida Health voluntarily dismissed itself as a party to this case. On January 18, 2022, the Company filed an answer against the plaintiffs in this matter, and discovery has commenced.
With regard to this class action case, on September 7, 2023, the Court heard argument on the parties’ respective motions for summary judgment and motions related to expert testimony. On March 31, 2024, the Court granted-in-part and denied-in-part plaintiffs’ motion for summary judgment on certain market definition issues, and denied Intuitive’s motion on the antitrust claims. In denying Intuitive’s motion, the Court declined to decide whether third-party companies were required to obtain 510(k) clearance for their services with respect to EndoWrist instruments, and in the absence of a formal ruling from the FDA on that question denied Intuitive’s motion for summary judgment challenging plaintiffs’ standing on that ground. There were additional rulings on the expert witness issues as well. In the summary judgment order, the Court ruled with plaintiffs that the da Vinci robot and EndoWrist instruments occupy separate product markets for antitrust purposes. The Court also ruled that there is an antitrust aftermarket for the repair and replacement of EndoWrist instruments, and that Intuitive holds monopoly power in that aftermarket. The Court denied summary judgment for plaintiffs on the issue of whether soft-tissue surgical robots constitute a relevant antitrust market or are part of a larger market that includes laparoscopic and open surgery for antitrust purposes. On July 30, 2024, the Court granted Intuitive’s motion for reconsideration, vacating those portions of the Court’s March 31, 2024 Order granting summary judgment as to the definition of a U.S. market for EndoWrist instrument repair and replacement and Intuitive’s market power in such a market. On January 23, 2025, the Court held a hearing on plaintiff’s motion for class certification, on which the Court has not yet issued a ruling. Based on currently available information, the Company is unable to make a reasonable estimate of loss or range of losses, if any, arising from this matter, and no trial date has been set for this matter at this time.
On September 18, 2024, Restore Robotics Repairs (“Restore”) filed a complaint in the United States District Court for the Northern District of Florida alleging antitrust claims against the Company relating to the service and replacement of X/Xi EndoWrist instruments for use with the da Vinci X and Xi surgical systems. On December 9, 2024, Intuitive filed a motion to dismiss to which plaintiff responded by amending its complaint. Intuitive’s response to plaintiff’s first amended complaint is due to be filed on or before January 31, 2025. Based on currently available information, the Company is unable to make a reasonable estimate of loss or range of losses, if any, arising from this matter.
NOTE 9. STOCKHOLDERS’ EQUITY
Stock Repurchase Program
Through December 31, 2024, the Board has authorized an aggregate of $10.0 billion of funding for the Company’s common stock Repurchase Program since its establishment in March 2009. The most recent authorization occurred in July 2022 when the Board increased the authorized amount available under the Repurchase Program to $3.5 billion, including amounts remaining under previous authorization. As of December 31, 2024, the remaining amount of share repurchases authorized by the Board under the Repurchase Program was approximately $1.1 billion.
The following table summarizes stock repurchase activities (in millions, except per share amounts): | | | | | | | | | | | | | | | | | |
| | Years Ended December 31, |
| | 2024 | | 2023 | | 2022 |
| Shares repurchased | — | | | 1.7 | | | 11.2 | |
| Average price per share | $ | — | | | $ | 241.38 | | | $ | 233.70 | |
| Value of shares repurchased | $ | — | | | $ | 416.3 | | | $ | 2,607.4 | |
In August 2022, the Company entered into an accelerated share repurchase program (the “August ASR Program”) with Goldman, Sachs & Co. (“Goldman”) to repurchase $1.0 billion of the Company’s common stock. In September 2022, the August ASR Program was completed, and, in total, 4.6 million shares of common stock were received and retired. In total, 4.6 million shares were repurchased at an average price per share of $217.52. The total cost of the August ASR Program was reflected as a reduction to equity in the Consolidated Balance Sheets.
In October 2022, the Company entered into an accelerated share repurchase program (the “October ASR Program”) with Citibank, N.A. (“Citibank”) to repurchase $1.0 billion of the Company’s common stock. In December 2022, the October ASR Program was completed, and, in total, 3.9 million shares were repurchased at an average price per share of $254.48. The total cost of the October ASR Program was reflected as a reduction to equity in the Consolidated Balance Sheets.
The Company uses the par value method of accounting for its stock repurchases. As a result of share repurchase activities during the years ended December 31, 2024, 2023, and 2022, the Company reduced common stock and additional paid-in capital by an aggregate of zero, $19 million, and $211 million, respectively, and charged zero, $0.4 billion, and $2.4 billion, respectively, to retained earnings.
The Company is subject to an excise tax on corporate stock repurchases, which is assessed as one percent of the fair market value of net stock repurchases after December 31, 2022. As of December 31, 2024, no excise tax was accrued, as there were no stock repurchases during 2024.
Accumulated Other Comprehensive Income (Loss), Net of Tax, Attributable to Intuitive Surgical, Inc.
The components of accumulated other comprehensive income (loss), net of tax, attributable to Intuitive Surgical, Inc. are as follows (in millions):
| | | | | | | | | | | | | | | | | | | | | | | | | | | | | |
| | Year Ended December 31, 2024 |
| | Gains (Losses)
on Hedge
Instruments | | Unrealized Losses on Available-for-Sale Securities | | Foreign
Currency
Translation
Gains
(Losses) | | Employee Benefit Plans | | Total |
| Beginning balance | $ | (2.5) | | | $ | (29.7) | | | $ | 19.4 | | | $ | 0.6 | | | $ | (12.2) | |
| Other comprehensive income (loss) before reclassifications | 5.7 | | | 15.0 | | | (52.5) | | | (14.9) | | | (46.7) | |
| Amounts reclassified from accumulated other comprehensive income (loss) | 7.8 | | | 0.1 | | | — | | | (0.3) | | | 7.6 | |
| Net current-period other comprehensive income (loss) | 13.5 | | | 15.1 | | | (52.5) | | | (15.2) | | | (39.1) | |
| Ending balance | $ | 11.0 | | | $ | (14.6) | | | $ | (33.1) | | | $ | (14.6) | | | $ | (51.3) | |
| | | | | | | | | |
| | Year Ended December 31, 2023 |
| Losses on Hedge Instruments | | Unrealized Losses on Available-for-Sale Securities | | Foreign
Currency
Translation
Gains
(Losses) | | Employee Benefit Plans | | Total |
| Beginning balance | $ | (2.9) | | | $ | (154.2) | | | $ | (6.6) | | | $ | 1.2 | | | $ | (162.5) | |
| Other comprehensive income (loss) before reclassifications | (6.6) | | | 124.6 | | | 26.0 | | | (0.6) | | | 143.4 | |
| Amounts reclassified from accumulated other comprehensive income (loss) | 7.0 | | | (0.1) | | | — | | | — | | | 6.9 | |
| Net current-period other comprehensive income (loss) | 0.4 | | | 124.5 | | | 26.0 | | | (0.6) | | | 150.3 | |
| Ending balance | $ | (2.5) | | | $ | (29.7) | | | $ | 19.4 | | | $ | 0.6 | | | $ | (12.2) | |
The tax impacts for amounts recognized in other comprehensive income (loss) before reclassifications were as follows (in millions):
| | | | | | | | | | | | | |
| | Years Ended December 31, | | |
| Available-for-sale securities | 2024 | | 2023 | | |
| Income tax expense for net gains recorded in other comprehensive income (loss) | $ | (4.3) | | | $ | (35.7) | | | |
The tax impacts for amounts recognized in other comprehensive income (loss) before reclassifications for hedge instruments, foreign currency translation gains (losses), and employee benefit plans in 2024 and 2023 were not material to the Company’s Consolidated Financial Statements. The tax impacts for amounts reclassified from accumulated other comprehensive loss relating to hedge instruments, available-for-sale securities, foreign currency translation gains (losses), and employee benefit plans in 2024 and 2023 were not material to the Company’s Consolidated Financial Statements.
NOTE 10. SHARE-BASED COMPENSATION
Stock Plans
2010 Incentive Award Plan. In April 2010, the Company’s stockholders approved the 2010 Incentive Award Plan (“2010 Plan”). Under this plan, the Company can issue RSUs, nonqualified stock options (“NSOs”), and PSUs to employees, non-employee directors, and consultants. Equity awards granted to employees and non-employee directors include a mix of RSUs, stock options, and, as applicable, PSUs. The 2010 Plan generally permits NSOs to be granted at no less than the fair market value of the common stock on the date of grant. Prior to 2022, NSOs were granted with terms of 10 years from the date of the grant. In January 2022, the Company changed the term of its new NSO grants to 7 years from the date of the grant. The 2010 Plan expires in 2034. In April 2024, the Company’s shareholders approved an amended and restated 2010 Incentive Award Plan to provide for an increase in the number of shares of common stock reserved for issuance thereunder from 110,350,000 to 115,350,000.
As of December 31, 2024, approximately 20.6 million shares were reserved for future issuance under the 2010 Plan. A maximum of approximately 8.9 million of these shares can be awarded as RSUs.
2009 Employment Commencement Incentive Plan. In October 2009, the Board adopted the 2009 Employment Commencement Incentive Plan (“New Hire Plan”). In April 2015, the Board of Directors amended and restated the New Hire Plan to provide for an increase in the number of shares of common stock authorized for issuance pursuant to awards granted under the New Hire Plan from 10,395,000 to 13,095,000. The New Hire Plan expired in October 2019 and, therefore, there are no shares reserved for future grants under the New Hire Plan. However, awards granted prior to the plan’s expiration continue to remain outstanding until their original expiration date.
The New Hire Plan provides for the shares to be used exclusively for the grant of RSUs and NSOs to new employees (“New Hire Options”), who were not previously employees or non-employee directors of the Company. Prior to expiration of the plan, options were granted at an exercise price not less than the fair market value of the stock on the date of grant with a term not to exceed 10 years.
Restricted Stock Units. The RSUs granted to employees vest in one-fourth increments annually over a four-year period. The RSUs granted to existing non-employee directors vest one year from the date of grant or at the next Annual Shareholders Meeting, whichever comes first. New non-employee directors receive pro-rated RSU grants that vest on the same term as the annual RSU grants. The number of shares issued on the date the RSUs vest is net of the minimum statutory tax withholdings, which are paid in cash to the appropriate taxing authorities on behalf of the Company’s employees.
Nonqualified Stock Options. Prior to 2020, annual NSO grants were made to employees on February 15 (or the next business day if the date is not a business day) and on August 15 (or the next business day if the date is not a business day). From 2020 to 2022, annual NSO grants were made to employees on the last business day of February and on the same date in August or, if that date is not a business day, the next business day. In 2023, the Company changed the timing of its bi-annual NSO grants to the last trading day of February and August 10 or, if that date is not a trading day, the next trading day.
The February NSO grants vest 1/8 upon completion of 6 months of service and 1/48 per month thereafter for all grants prior to 2023 and vest 1/8 on August 10 and 1/48 per month thereafter for grants in 2023. All August NSO grants vest 7/48 at the end of one month and 1/48 per month thereafter through a 3.5-year vesting period. NSOs granted to new hires generally vest 1/4 upon completion of one year of service and 1/48 per month thereafter. NSOs granted to existing non-employee directors vest one year from the date of grant or at the next Annual Shareholders Meeting, whichever comes first. New non-employee directors receive pro-rated NSO grants that vest on the same term as the annual NSO grants. Option vesting terms are determined by the Board and, in the future, may vary from past practices.
Performance Stock Units. In 2022, the Company began granting PSUs to officers and other key employees, subject to three-year cliff vesting and pre-established, quantitative goals. Whether any PSUs vest, and the amount that do vest, is tied to completion of service over three years and the achievement of three equally-weighted, quantitative goals that directly align with or help drive the Company’s strategy and long-term total shareholder return.
2000 Non-Employee Directors’ Stock Option Plan. In March 2000, the Board adopted the 2000 Non-Employee Directors’ Stock Option Plan (the “Directors’ Plan”). In October 2009, the automatic evergreen increase provisions were eliminated so that no further automatic increases would be made to the number of shares reserved for issuance under the Directors’ Plan. In addition, the common stock authorized for issuance under the Directors’ Plan was reduced to 1,350,000. The Directors’ Plan was terminated in November 2020 and, therefore, there are no shares reserved for future grants under the Directors’ Plan. However, options granted prior to the plan’s termination continue to remain outstanding until their original expiration date. Prior to termination, options were granted at an exercise price not less than the fair market value of the stock on the date of grant with a term not to exceed 10 years. Prior to 2016, initial stock option grants to new non-employee directors vested over a three-year period with 1/3 of the shares vesting after one year from the date of grant and 1/36 of the shares vesting monthly thereafter. Annual stock option grants vested one year from the date of the grant. From 2016 until termination of the Directors’ Plan, new non-employee directors received pro-rated stock option grants that vested on the same term as the annual stock option grants.
2000 Employee Stock Purchase Plan. In March 2000, the Board adopted the ESPP. Employees are generally eligible to participate in the ESPP if they are customarily employed by the Company for more than 20 hours per week and more than 5 months in a calendar year and are not 5% stockholders of the Company. Under the ESPP, eligible employees may select a rate of payroll deduction up to 15% of their eligible compensation subject to certain maximum purchase limitations. The duration for each offering period is 24 months and is divided into four purchase periods of approximately six months in length. Offerings are concurrent. The purchase price of the shares under the offering is the lesser of 85% of the fair market value of the shares on the offering date or 85% of the fair market value of the shares on the purchase date. A two-year look-back feature in the ESPP causes the offering period to reset if the fair value of the Company’s common stock on the first or last day of the purchase period is less than that on the original offering date. ESPP purchases by employees are settled with newly-issued common stock from the ESPP’s previously authorized and available pool of shares. In April 2024, the Company’s stockholders approved an
amended and restated ESPP to provide for an increase in the number of shares of common stock reserved for issuance from 22,770,945 to 26,770,945. As of December 31, 2024, there were approximately 5.2 million shares reserved for future issuance under the ESPP.
Restricted Stock Units
RSU activity for the year ended December 31, 2024, was as follows (in millions, except per share amounts):
| | | | | | | | | | | |
| |
Shares | | Weighted-Average
Grant Date Fair Value Per Share |
| Unvested balance as of December 31, 2023 | 5.0 | | | $ | 245.75 | |
| Granted | 2.4 | | | $ | 392.89 | |
| Vested | (1.9) | | | $ | 237.99 | |
| Forfeited | (0.3) | | | $ | 287.47 | |
| Unvested balance as of December 31, 2024 | 5.2 | | | $ | 314.39 | |
As of December 31, 2024, 4.7 million shares underlying RSUs were expected to vest with an aggregate intrinsic value of $2.48 billion. The aggregate vesting date fair value of RSUs vested, excluding PSUs vested, was $735 million, $454 million, and $536 million during the years ended December 31, 2024, 2023, and 2022, respectively.
Stock Options
NSO activity for the year ended December 31, 2024, was as follows (in millions, except per share amounts):
| | | | | | | | | | | |
| | Stock Options Outstanding |
| | Number
Outstanding | | Weighted-Average Exercise Price Per Share |
| Balance as of December 31, 2023 | 9.8 | | | $ | 174.90 | |
| Options granted | — | | | $ | — | |
| Options exercised | (2.6) | | | $ | 122.01 | |
| Options forfeited/expired | (0.1) | | | $ | 256.60 | |
| Balance as of December 31, 2024 | 7.1 | | | $ | 192.90 | |
The aggregate intrinsic value of stock options exercised under the Company’s stock plans determined as of the date of option exercise was $789 million, $476 million, and $315 million during the years ended December 31, 2024, 2023, and 2022, respectively. Cash received from stock option exercises for the years ended December 31, 2024, 2023, and 2022, was $315 million, $192 million, and $146 million, respectively. The income tax benefit from stock options exercised was $171 million for the year ended December 31, 2024.
The following table summarizes significant ranges of outstanding and exercisable options as of December 31, 2024 (number of shares and aggregate intrinsic value in millions):
| | | | | | | | | | | | | | | | | | | | | | | | | | | | | | | | | | | | | | | | | | | | | | | | | | |
| | | Options Outstanding | | Options Exercisable |
Range of
Exercise Prices | | Number
of Shares | | Weighted-Average
Remaining
Contractual Life | | Weighted-Average
Exercise Price
Per Share | | Aggregate
Intrinsic
Value (1) | | Number
of Shares | | Weighted-Average
Remaining
Contractual Life | | Weighted-Average
Exercise Price
Per Share | | Aggregate
Intrinsic
Value (1) |
| $51.86-$77.00 | | 1.0 | | | 1.1 | | $ | 65.25 | | | | | 1.0 | | | | | $ | 65.25 | | | |
| $77.04-$139.52 | | 1.0 | | | 2.6 | | $ | 109.40 | | | | | 1.0 | | | | | $ | 109.40 | | | |
| $143.49-$174.26 | | 0.9 | | | 4.2 | | $ | 169.07 | | | | | 0.9 | | | | | $ | 169.07 | | | |
| $175.53-$182.83 | | 0.8 | | | 4.6 | | $ | 179.98 | | | | | 0.8 | | | | | $ | 179.98 | | | |
| $182.90-$229.39 | | 1.1 | | | 4.9 | | $ | 217.17 | | | | | 0.7 | | | | | $ | 213.20 | | | |
| $235.20-$245.60 | | 0.8 | | | 5.8 | | $ | 243.86 | | | | | 0.7 | | | | | $ | 243.81 | | | |
| $249.83-$304.67 | | 1.1 | | | 5.0 | | $ | 296.46 | | | | | 0.6 | | | | | $ | 293.94 | | | |
| $313.64-$340.27 | | — | | | 5.4 | | $ | 318.18 | | | | | — | | | | | $ | 317.68 | | | |
| $341.16-$341.16 | | — | | | 6.7 | | $ | 341.16 | | | | | — | | | | | $ | 341.16 | | | |
| $347.42-$347.42 | | 0.4 | | | 6.6 | | $ | 347.42 | | | | | 0.4 | | | | | $ | 347.42 | | | |
| | | | | | | | | | | | | | | | |
| | | | | | | | | | | | | | | | |
| | | | | | | | | | | | | | | | |
| | | | | | | | | | | | | | | | |
| | | | | | | | | | | | | | | | |
| Total | | 7.1 | | | 4.1 | | $ | 192.90 | | | $ | 2,324 | | | 6.1 | | | 4.0 | | $ | 181.18 | | | $ | 2,063 | |
(1)The aggregate intrinsic value represents the total pre-tax intrinsic value, based on the Company’s closing stock price of $521.96 as of December 31, 2024, which would have been received by the option holders had all in-the-money option holders exercised their options as of that date.
As of December 31, 2024, a total of 7.0 million shares underlying stock options vested and expected to vest had a weighted-average remaining contractual life of 4.1 years, an aggregate intrinsic value of $2.31 billion, and a weighted-average exercise price of $192.22.
Performance Stock Units
As of December 31, 2024, the Company has three types of active PSU awards: the 2024 PSU awards, the 2023 PSU awards, and the 2022 PSU awards. The 2024 PSU award metrics are focused on relative total shareholder return (“TSR”), da Vinci and Ion procedure growth in 2025 compared to 2023, and da Vinci and Ion procedure growth in 2026 compared to 2023. The 2023 PSU award metrics are focused on relative TSR, da Vinci and Ion procedure growth in 2024 compared to 2022, and da Vinci and Ion procedure growth in 2025 compared to 2022. The 2022 PSU award metrics are focused on relative TSR, year-over-year da Vinci procedure growth for 2023, and two-year compound annual da Vinci procedure growth for 2024.
The TSR metric is considered a market condition, and the expense is determined at the grant date. The procedure growth metrics are considered performance conditions, and the expense is recorded based on the forecasted performance, which is reassessed each reporting period based on the probability of achieving the performance conditions. The number of shares earned at the end of the three-year period will vary, based on actual performance, from 0% to 125% of the target number of PSUs granted. PSUs are subject to forfeiture if employment terminates prior to the vesting date. PSUs are not considered issued or outstanding shares of the Company.
The Company calculates the fair value for each component of the PSUs individually. The fair value for the component with the TSR metric was determined using Monte Carlo simulation. The fair value per share for the components with the procedure growth metrics is equal to the closing stock price on the grant date.
PSU activity for the year ended December 31, 2024, was as follows (in millions, except per share amounts):
| | | | | | | | | | | |
| |
Shares | | Weighted-Average
Grant Date Fair Value Per Share |
| Unvested balance as of December 31, 2023 | 0.2 | | | $ | 259.60 | |
| Granted | 0.1 | | | $ | 395.92 | |
| Vested | — | | | $ | 276.20 | |
| Performance change | — | | | $ | 290.33 | |
| Forfeited | — | | | $ | 294.75 | |
| Unvested balance as of December 31, 2024 | 0.3 | | | $ | 306.94 | |
As of December 31, 2024, 0.3 million shares underlying PSUs were expected to vest with an aggregate intrinsic value of $155 million. The aggregate vesting date fair value of PSUs vested was $4 million during the year ended December 31, 2024. No PSUs vested in 2023 or 2022.
Employee Stock Purchase Plan
Under the ESPP, employees purchased approximately 0.6 million, 0.5 million, and 0.4 million shares, representing approximately $114.9 million, $104.5 million, and $87.9 million in employee contributions for the years ended December 31, 2024, 2023, and 2022, respectively.
Share-Based Compensation Expense
The following table summarizes share-based compensation expense (in millions):
| | | | | | | | | | | | | | | | | |
| | Years Ended December 31, |
| | 2024 | | 2023 | | 2022 |
| Cost of sales – products (before capitalization) | $ | 105.5 | | | $ | 92.7 | | | $ | 79.0 | |
Amounts capitalized into inventory (1) | (98.9) | | | (84.3) | | | (17.2) | |
| Amounts recognized in income for amounts previously capitalized in inventory | 91.9 | | | 75.0 | | | 5.8 | |
| Cost of revenue—product | 98.5 | | | 83.4 | | | 67.6 | |
| Cost of revenue—service | 30.5 | | | 28.2 | | | 23.6 | |
| Total cost of revenue | 129.0 | | | 111.6 | | | 91.2 | |
| Selling, general and administrative | 304.5 | | | 274.8 | | | 261.1 | |
| Research and development | 254.6 | | | 211.8 | | | 164.2 | |
| Share-based compensation expense before income taxes | 688.1 | | | 598.2 | | | 516.5 | |
| Income tax benefit | 138.3 | | | 117.4 | | | 101.7 | |
| Share-based compensation expense after income taxes | $ | 549.8 | | | $ | 480.8 | | | $ | 414.8 | |
|
(1)Share-based compensation expense subject to capitalization into inventory was not material during the first three quarters of 2022, and, therefore, not recorded. The Company commenced capitalization of share-based compensation expense into inventory during the quarter ended December 31, 2022, on a prospective basis.
The Black-Scholes-Merton option-pricing model is used to estimate the fair value of stock options granted under the Company’s share-based compensation plans and the rights to acquire stock granted under the ESPP. The weighted-average estimated fair values of stock options and the rights to acquire stock under the ESPP, as well as the weighted-average assumptions used in calculating the fair values of stock options and the rights to acquire stock under the ESPP that were granted during the years ended December 31, 2024, 2023, and 2022, were as follows:
| | | | | | | | | | | | | | | | | |
| | Years Ended December 31, |
| 2024 | | 2023 | | 2022 |
| RSUs | | | | | |
| Fair value at grant date | $392.89 | | $237.37 | | $272.97 |
| STOCK OPTIONS | | | | | |
| Risk-free interest rate | — | | 4.6% | | 2.6% |
| Expected term (in years) | — | | 3.2 | | 3.2 |
| Expected volatility | — | | 33% | | 38% |
| Fair value at grant date | — | | $77.45 | | $73.65 |
| PSUs | | | | | |
| Fair value at grant date | $395.92 | | $240.45 | | $299.32 |
| ESPP | | | | | |
| Risk-free interest rate | 4.6% | | 5.0% | | 2.1% |
| Expected term (in years) | 1.2 | | 1.2 | | 1.2 |
| Expected volatility | 29% | | 33% | | 39% |
| Fair value at grant date | $130.00 | | $89.42 | | $80.61 |
As share-based compensation expense recognized in the Consolidated Statements of Income during the years ended December 31, 2024, 2023, and 2022, is based on awards ultimately expected to vest, it has been reduced for estimated forfeitures.
As of December 31, 2024, there was $1.04 billion, $70 million, $47 million, and $59 million of total unrecognized compensation expense related to unvested RSUs, unvested stock options, unvested PSUs, and rights granted to acquire common stock under the ESPP, respectively. The unrecognized compensation expense is expected to be recognized over a weighted-average period of 2.3 years for unvested RSUs, 1.8 years for unvested stock options, 1.3 years for unvested PSUs, and 1.3 years for rights granted to acquire common stock under the ESPP.
NOTE 11. INCOME TAXES
Income before provision for income taxes for the years ended December 31, 2024, 2023, and 2022, consisted of the following (in millions):
| | | | | | | | | | | | | | | | | |
| Years Ended December 31, |
| 2024 | | 2023 | | 2022 |
| U.S. | $ | 1,754.8 | | | $ | 1,251.1 | | | $ | 956.7 | |
| Foreign | 919.0 | | | 707.8 | | | 650.1 | |
| Total income before provision for income taxes | $ | 2,673.8 | | | $ | 1,958.9 | | | $ | 1,606.8 | |
The provision for income taxes for the years ended December 31, 2024, 2023, and 2022, consisted of the following (in millions):
| | | | | | | | | | | | | | | | | |
| Years Ended December 31, |
| 2024 | | 2023 | | 2022 |
| Current | | | | | |
| Federal | $ | 321.9 | | | $ | 315.2 | | | $ | 350.4 | |
| State | 47.9 | | | 32.8 | | | 49.2 | |
| Foreign | 101.8 | | | 74.4 | | | 48.1 | |
| Total current income tax expense | 471.6 | | | 422.4 | | | 447.7 | |
| Deferred | | | | | |
| Federal | (157.7) | | | (122.4) | | | (188.8) | |
| State | (23.9) | | | (25.1) | | | (16.4) | |
| Foreign | 46.3 | | | (133.3) | | | 19.9 | |
| Total deferred income tax expense (benefit) | (135.3) | | | (280.8) | | | (185.3) | |
| Total income tax expense | $ | 336.3 | | | $ | 141.6 | | | $ | 262.4 | |
The Company’s provision for income taxes for 2023 reflected Swiss tax benefits of $92.3 million, net of a $67.3 million valuation allowance, related to certain tax assets recorded by our Swiss entity. In addition, a one-time net benefit of $67.1 million was recorded from the re-measurement of the Company’s Swiss deferred tax assets resulting from the Swiss cantonal tax rate increase enacted in December 2023 for years after 2024 as well as a Swiss cantonal tax rate increase from the discontinuation of the Company’s 2017 Swiss tax ruling, which was deemed effective as of January 1, 2023.
In August 2022, the Inflation Reduction Act of 2022 (the “IRA”) was enacted in the United States. The IRA introduced a 15% alternative minimum tax based on the financial statement income of certain large corporations, effective for tax years beginning after December 31, 2022. The Company considered the applicable tax law changes, and there is no impact to the Company’s tax provision for the twelve months ended December 31, 2024, and December 31, 2023.
Income tax expense differs from amounts computed by applying the statutory federal income rate of 21% for the years ended December 31, 2024, 2023, and 2022, as a result of the following (in millions):
| | | | | | | | | | | | | | | | | |
| Years Ended December 31, |
| 2024 | | 2023 | | 2022 |
| Federal tax at statutory rate | $ | 561.5 | | | $ | 411.4 | | | $ | 337.4 | |
| Increase (reduction) in tax resulting from: | | | | | |
| State taxes, net of federal benefits | 41.7 | | | 35.0 | | | 34.9 | |
| Foreign rate differential | (59.3) | | | (64.4) | | | (64.2) | |
| U.S. tax on foreign earnings | 73.1 | | | 70.9 | | | 75.4 | |
| Research and development credit | (75.1) | | | (48.6) | | | (41.7) | |
| Excess tax benefits related to share-based compensation | (223.3) | | | (107.9) | | | (98.7) | |
| Share-based compensation not benefited | 32.4 | | | 29.5 | | | 24.1 | |
| Unrecognized tax benefits related to share-based compensation | 5.3 | | | 4.4 | | | 3.3 | |
| Reversal of unrecognized tax benefits | (29.5) | | | (20.9) | | | (11.1) | |
| Swiss tax benefits, net of valuation allowance | — | | | (92.3) | | | — | |
| Deferred tax re-measurement | — | | | (67.1) | | | — | |
| Other | 9.5 | | | (8.4) | | | 3.0 | |
| Total income tax expense | $ | 336.3 | | | $ | 141.6 | | | $ | 262.4 | |
Deferred income taxes reflect tax carryforwards and the net tax effects of temporary differences between the carrying amounts of assets and liabilities for financial reporting and the amounts used for income tax purposes. Significant components of the Company’s deferred tax assets and liabilities are as follows (in millions):
| | | | | | | | | | | |
| December 31, |
| 2024 | | 2023 |
| Deferred tax assets: | | | |
| Intangible assets | $ | 377.5 | | | $ | 420.9 | |
| Capitalized research and development expenditures | 468.6 | | | 306.4 | |
| Research and development credits | 240.3 | | | 193.2 | |
| Share-based compensation expense | 155.3 | | | 135.1 | |
| Swiss tax credits | 107.4 | | | 122.4 | |
| Expenses deducted in later years for tax purposes | 67.4 | | | 55.9 | |
| Lease liabilities | 23.0 | | | 16.5 | |
| Net operating losses | 4.5 | | | 2.8 | |
| Net unrealized losses on available-for-sale securities and other | 11.3 | | | 9.2 | |
| Gross deferred tax assets | 1,455.3 | | | 1,262.4 | |
| Valuation allowance | (314.8) | | | (269.8) | |
| Deferred tax assets | 1,140.5 | | | 992.6 | |
| Deferred tax liabilities: | | | |
| Property, plant, and equipment | (65.7) | | | (60.3) | |
| Right-of-use assets | (18.9) | | | (11.8) | |
| Intangible assets | (8.5) | | | (9.8) | |
| Other | (2.3) | | | (0.2) | |
| Deferred tax liabilities | (95.4) | | | (82.1) | |
| Net deferred tax assets | $ | 1,045.1 | | | $ | 910.5 | |
As of December 31, 2024, the Company had $103.1 million of federal, state, and foreign net operating loss carryforwards, certain of which will expire starting in 2026 if not utilized. Utilization of these net operating loss carryforwards may be subject to certain limitations. The Company does not expect the limitations to result in any permanent loss of these tax benefits. As of
December 31, 2024, the Company had $107.4 million of Swiss tax credit carryforwards, which will expire in 2028. As of December 31, 2024, the Company had $329.2 million of California research and development credit carryforwards, which do not expire, and $3.7 million of other state research and development credit carryforwards, which begin to expire in 2030.
As of December 31, 2024, the Company had a valuation allowance of $314.8 million, primarily related to California deferred tax assets and certain Swiss deferred tax assets, for which the Company does not believe a tax benefit is more likely than not to be realized. As of December 31, 2023, the Company had a valuation allowance of $269.8 million, primarily related to California deferred tax assets and Swiss deferred tax assets, for which the Company does not believe a tax benefit is more likely than not to be realized. The increase in the valuation allowance during 2024 is primarily related to California research and development credits. These valuation allowances would result in a reduction to the income tax provision in the consolidated statements of income if they are ultimately not necessary.
The Company intends to repatriate earnings from its Swiss and Dutch subsidiaries and joint venture in Hong Kong, as needed, and the U.S. and foreign tax implications of such repatriations are not expected to be significant. The Company will continue to indefinitely reinvest earnings from the rest of its foreign subsidiaries and does not expect the tax implications of repatriating these earnings to be significant.
A reconciliation of the beginning and ending amounts of gross unrecognized income tax benefits for the years ended December 31, 2024, 2023, and 2022, are as follows (in millions):
| | | | | | | | | | | | | | | | | |
| Years Ended December 31, |
| 2024 | | 2023 | | 2022 |
| Beginning balance | $ | 260.4 | | | $ | 252.6 | | | $ | 222.5 | |
| Increases related to tax positions taken during the current year | 67.8 | | | 48.5 | | | 49.5 | |
| Increases related to tax positions taken during a prior year | 13.9 | | | — | | | 4.9 | |
| Decreases related to tax positions taken during a prior year | — | | | (18.9) | | | (16.5) | |
| Decreases related to settlements with tax authorities | (3.7) | | | (1.0) | | | (1.2) | |
| Decreases related to expiration of statute of limitations | (28.4) | | | (20.8) | | | (6.6) | |
| Ending balance | $ | 310.0 | | | $ | 260.4 | | | $ | 252.6 | |
As of December 31, 2024, 2023, and 2022, gross interest related to unrecognized tax benefits accrued was $37.0 million, $31.2 million, and $21.0 million, respectively. Total gross unrecognized tax benefits as of December 31, 2024, were $310.0 million, of which $217.4 million, if recognized, would have an impact on the Company’s effective tax rate.
The Company files federal, state, and foreign income tax returns in many jurisdictions in the U.S. and OUS. Years before 2017 are considered closed for significant jurisdictions. Certain of the Company’s unrecognized tax benefits could change due to activities of various tax authorities, including evolving interpretations of existing tax laws in the jurisdictions in which the Company operates, potential assessment of additional tax, possible settlement of audits, or through normal expiration of various statutes of limitations, which could affect the Company’s effective tax rate in the period in which they change. It is reasonably possible that our existing unrecognized tax benefits may decrease by up to $65 million as a result of expirations of the statute of limitations and audit conclusions in various jurisdictions within the next 12 months.
The Company is subject to the examination of its income tax returns by the Internal Revenue Service and other tax authorities. The outcome of these audits cannot be predicted with certainty. The Company’s management regularly assesses the likelihood of adverse outcomes resulting from these examinations to determine the adequacy of the Company’s provision for income taxes. If any issues addressed in the Company’s tax audits are resolved in a manner not consistent with management’s expectations, the Company could be required to adjust its provision for income taxes in the period such resolution occurs.
NOTE 12. NET INCOME PER SHARE
The following table presents the computation of basic and diluted net income per share attributable to Intuitive Surgical, Inc. (in millions, except per share amounts):
| | | | | | | | | | | | | | | | | |
| | Years Ended December 31, |
| | 2024 | | 2023 | | 2022 |
| Numerator: | | | | | |
| Net income attributable to Intuitive Surgical, Inc. | $ | 2,322.6 | | | $ | 1,798.0 | | | $ | 1,322.3 | |
| Denominator: | | | | | |
| Weighted-average shares outstanding used in basic calculation | 355.2 | | | 351.2 | | | 355.7 | |
| Add: dilutive effect of potential common shares | 6.8 | | | 6.2 | | | 6.3 | |
| Weighted-average shares outstanding used in diluted calculation | 362.0 | | | 357.4 | | | 362.0 | |
| Net income per share attributable to Intuitive Surgical, Inc.: | | | | | |
| Basic | $ | 6.54 | | | $ | 5.12 | | | $ | 3.72 | |
| Diluted | $ | 6.42 | | | $ | 5.03 | | | $ | 3.65 | |
Share-based compensation awards of approximately 0.2 million, 1.9 million, and 3.4 million shares for the years ended December 31, 2024, 2023, and 2022, respectively, were outstanding but were not included in the computation of diluted net income per share attributable to Intuitive Surgical, Inc. common stockholders, because the effect of including such shares would have been anti-dilutive in the periods presented.
NOTE 13. SEGMENT INFORMATION
Intuitive is committed to advancing minimally invasive care through a comprehensive ecosystem of products and services. This connected ecosystem includes systems, instruments and accessories, learning, and services connected by a digital portfolio that enables actionable digital insights across the care continuum. The systems, as well as the instruments and accessories, are primarily developed and manufactured by Intuitive. During the years ended December 31, 2024, 2023, and 2022, domestic revenue accounted for 67%, 66% and 67%, respectively, of total revenue, while revenue from the Company’s OUS markets accounted for 33%, 34% and 33%, respectively, of total revenue. The Company manages the business activities on a consolidated basis and operates in one reportable segment.
Intuitive’s Chief Executive Officer is the Chief Operating Decision Maker (“CODM”). The CODM utilizes the Company’s long-range plan, which includes product development roadmaps and long-range financial models, as a key input to resource allocation. The CODM makes decisions on resource allocation, assesses performance of the business, and monitors budget versus actual results using income from operations. Net income is also a measure that is considered in monitoring budget versus actual results.
Significant expenses within income from operations, as well as within net income, include cost of revenue, research and development, and selling, general and administrative expenses, which are each separately presented on the Company’s Consolidated Statements of Income. Other segment items within net income include interest and other income, net, and income tax expense.
The Company’s long-lived assets consist primarily of property, plant and equipment, net. As of December 31, 2024 and 2023, 83% and 84%, respectively, of long-lived assets were in the U.S. As of December 31, 2024 and 2023, no individual country other than the U.S. accounted for 10% or more of these assets.
NOTE 14. EMPLOYEE BENEFIT PLANS
The Company sponsors various retirement plans for its eligible U.S. and non-U.S. employees. For employees in the U.S., the Company maintains the Intuitive Surgical, Inc. 401(k) Plan (the “Plan”). As allowed under Section 401(k) of the Internal Revenue Code, the Plan provides tax-deferred salary contributions for eligible U.S. employees. The Plan allows employees to contribute up to 100% of their annual compensation to the Plan on a pre-tax and/or after-tax basis. Employee contributions are limited to a maximum annual amount as set periodically by the Internal Revenue Code. The Company matches 200% of employee contributions up to $2,000 per calendar year per person. All matching employer contributions vest immediately.
NOTE 15. SUBSEQUENT EVENTS
On January 21, 2025, Intuitive announced that it has entered into a definitive agreement with the current Intuitive technology distributors ab medica, Abex, Excelencia Robotica, and their affiliates to acquire the da Vinci and Ion distribution businesses in Italy, Spain, Portugal, Malta, and San Marino, and associated territories. The transaction consists of an upfront cash payment of approximately €290 million and up to an additional €31 million in commercial milestone cash payments, subject to certain closing adjustments. The Company expects to complete the transaction in the first half of 2026, subject to customary closing conditions.
SCHEDULE II
VALUATION AND QUALIFYING ACCOUNTS
(IN MILLIONS)
| | | | | | | | | | | | | | | | | | | | | | | |
| Balance at
Beginning of
Year | | Additions | | Deductions (1) | | Balance at
End of Year |
| Sales returns and allowances | | | | | | | |
| Year ended December 31, 2024 | $ | 17.0 | | | $ | 64.3 | | | $ | (50.8) | | | $ | 30.5 | |
| Year ended December 31, 2023 | $ | 14.5 | | | $ | 58.8 | | | $ | (56.3) | | | $ | 17.0 | |
| Year ended December 31, 2022 | $ | 13.1 | | | $ | 44.4 | | | $ | (43.0) | | | $ | 14.5 | |
(1)Primarily represents products returned.
ITEM 9. CHANGES IN AND DISAGREEMENTS WITH ACCOUNTANTS ON ACCOUNTING AND FINANCIAL DISCLOSURES
None.
ITEM 9A. CONTROLS AND PROCEDURES
Conclusion Regarding the Effectiveness of Disclosure Controls and Procedures
We maintain disclosure controls and procedures that are designed to ensure that information required to be disclosed in our Exchange Act reports is recorded, processed, summarized, and reported within the time periods specified in the SEC’s rules and forms and that such information is accumulated and communicated to our management, including our principal executive officer and principal financial officer, as appropriate, to allow for timely decisions regarding required disclosure.
As required by SEC Rule 13a-15(b), we carried out an evaluation, under the supervision and with the participation of our management, including our principal executive officer and principal financial officer, of the effectiveness of the design and operation of our disclosure controls and procedures as of the end of the period covered by this Annual Report on Form 10-K. Based on the foregoing, our principal executive officer and principal financial officer concluded that our disclosure controls and procedures were effective at the reasonable assurance level.
Inherent Limitations Over Internal Controls
Our internal control over financial reporting is designed to provide reasonable assurance regarding the reliability of financial reporting and the preparation of the Consolidated Financial Statements for external purposes in accordance with GAAP. Our internal control over financial reporting includes those policies and procedures that:
(i)pertain to the maintenance of records that, in reasonable detail, accurately and fairly reflect the transactions and dispositions of our assets;
(ii)provide reasonable assurance that transactions are recorded as necessary to permit preparation of the Consolidated Financial Statements in accordance with GAAP and that our receipts and expenditures are being made only in accordance with authorizations of our management and directors; and
(iii)provide reasonable assurance regarding prevention or timely detection of unauthorized acquisition, use, or disposition of our assets that could have a material effect on the Consolidated Financial Statements.
Management, including our principal executive officer and principal financial officer, does not expect that our internal controls will prevent or detect all errors and all fraud. A control system, no matter how well designed and operated, can provide only reasonable, not absolute, assurance that the objectives of the control system are met. Further, the design of a control system must reflect the fact that there are resource constraints, and the benefits of controls must be considered relative to their costs. Because of the inherent limitations in all control systems, no evaluation of internal controls can provide absolute assurance that all control issues and instances of fraud, if any, have been detected. Also, any evaluation of the effectiveness of controls in future periods are subject to the risk that those internal controls may become inadequate because of changes in business conditions or that the degree of compliance with the policies or procedures may deteriorate.
Management’s Report on Internal Control Over Financial Reporting
Our management is responsible for establishing and maintaining adequate internal control over financial reporting, as such term is defined in the Exchange Act Rules 13a-15(f). Under the supervision and with the participation of our management, including our principal executive officer and principal financial officer, we conducted an assessment of the effectiveness of our internal control over financial reporting based on the framework in Internal Control—Integrated Framework (2013) issued by the Committee of Sponsoring Organizations of the Treadway Commission. Based on the results of our assessment under the framework in the Internal Control—Integrated Framework (2013), our management concluded that our internal control over financial reporting was effective as of December 31, 2024.
The effectiveness of our internal control over financial reporting as of December 31, 2024, has been audited by PricewaterhouseCoopers LLP, an independent registered public accounting firm, as stated in their report, which is included under “Item 8. Financial Statements and Supplementary Data” of this Annual Report.
Changes in Internal Control Over Financial Reporting
There were no changes in our internal control over financial reporting that occurred during the quarter ended December 31, 2024, that have materially affected, or are reasonably likely to materially affect, our internal control over financial reporting.
ITEM 9B. OTHER INFORMATION
Rule 10b5-1 Plans
On November 13, 2024, Gary H. Loeb, the Company’s Executive Vice President and Chief Legal and Compliance Officer, adopted a Rule 10b5-1 trading plan. Mr. Loeb’s trading plan provides for the potential sale of up to 4,300 shares of the Company’s common stock, including the potential exercise and sale of up to 2,600 shares of the Company’s common stock subject to stock options, until November 13, 2025. This trading plan was entered into during an open insider trading window and is intended to satisfy the affirmative defense of Rule 10b5-1(c) under the Securities Exchange Act of 1934, as amended, and the Company’s policies regarding transactions in the Company’s securities.
On December 4, 2024, David J. Rosa, the Company’s President and a member of the Company’s Board of Directors, adopted a Rule 10b5-1 trading plan. Mr. Rosa’s trading plan provides for the potential exercise and sale of up to 29,250 shares of the Company’s common stock subject to stock options, until December 4, 2025. This trading plan was entered into during an open insider trading window and is intended to satisfy the affirmative defense of Rule 10b5-1(c) under the Securities Exchange Act of 1934, as amended, and the Company’s policies regarding transactions in the Company’s securities.
On December 10, 2024, Brian E. Miller, Ph.D., the Company’s Executive Vice President and Chief Digital Officer, adopted a Rule 10b5-1 trading plan. Dr. Miller’s trading plan provides for the potential sale of up to 16,400 shares of the Company’s common stock, including the potential exercise and sale of up to 9,334 shares of the Company’s common stock subject to stock options, until December 10, 2025. This trading plan was entered into during an open insider trading window and is intended to satisfy the affirmative defense of Rule 10b5-1(c) under the Securities Exchange Act of 1934, as amended, and the Company’s policies regarding transactions in the Company’s securities.
On December 10, 2024, Jami Dover Nachtsheim, a member of the Company’s Board of Directors, adopted a Rule 10b5-1 trading plan. Ms. Nachtsheim’s trading plan provides for the potential exercise and sale of up to 2,400 shares of the Company’s common stock subject to stock options, until December 10, 2025. This trading plan was entered into during an open insider trading window and is intended to satisfy the affirmative defense of Rule 10b5-1(c) under the Securities Exchange Act of 1934, as amended, and the Company’s policies regarding transactions in the Company’s securities.
On December 12, 2024, Bob DeSantis, the Company’s Executive Vice President and Chief Strategy and Corporate Operations Officer, adopted a Rule 10b5-1 trading plan. Mr. DeSantis’s trading plan provides for the potential sale of up to 16,545 shares of the Company’s common stock, including the potential exercise and sale of up to 5,127 shares of the Company’s common stock subject to stock options, until December 12, 2025. This trading plan was entered into during an open insider trading window and is intended to satisfy the affirmative defense of Rule 10b5-1(c) under the Securities Exchange Act of 1934, as amended, and the Company’s policies regarding transactions in the Company’s securities.
ITEM 9C. DISCLOSURE REGARDING FOREIGN JURISDICTIONS THAT PREVENT INSPECTIONS
Not applicable.
PART III
Certain information required by Part III is omitted from this report on Form 10-K and is incorporated herein by reference to our definitive Proxy Statement for our next Annual Meeting of Stockholders (the “Proxy Statement”), which we intend to file pursuant to Regulation 14A of the Securities Exchange Act of 1934, as amended, within 120 days after December 31, 2024.
ITEM 10. DIRECTORS, EXECUTIVE OFFICERS, AND CORPORATE GOVERNANCE
The information required by this item concerning our directors and corporate governance is incorporated by reference to the information set forth in the section titled “Directors and Corporate Governance” in our Proxy Statement. Information required by this item concerning our executive officers is incorporated by reference to the information set forth in the section entitled “Executive Officers of the Company” in our Proxy Statement. Information regarding our Section 16 reporting compliance and code of business conduct and ethics is incorporated by reference to the information set forth in the section entitled “Security Ownership of Certain Beneficial Owners and Management and Related Stockholder Matters” in our Proxy Statement.
We have adopted an insider trading policy governing the purchase, sale and other dispositions of our securities by our directors, officers and employees that we believe is reasonably designed to promote compliance with insider trading laws, rules and regulations, and any applicable listing standards. A copy of our insider trading policy is filed as Exhibit 19 to this Annual Report.
ITEM 11. EXECUTIVE COMPENSATION
The information required by this item regarding executive compensation is incorporated by reference to the information set forth in the sections titled “Executive Compensation” and “Compensation for Directors” in our Proxy Statement.
ITEM 12. SECURITY OWNERSHIP OF CERTAIN BENEFICIAL OWNERS AND MANAGEMENT AND RELATED STOCKHOLDER MATTERS
The information required by this item regarding security ownership of certain beneficial owners and management is incorporated by reference to the information set forth in the section titled “Security Ownership of Certain Beneficial Owners and Management and Related Stockholder Matters” in our Proxy Statement for the 2025 Annual Meeting of Stockholders to be filed with the SEC within 120 days of December 31, 2024.
ITEM 13. CERTAIN RELATIONSHIPS AND RELATED TRANSACTIONS AND DIRECTOR INDEPENDENCE
The information required by this item regarding certain relationships and related transactions and director independence is incorporated by reference to the information set forth in the sections titled “Certain Relationships and Related Transactions” and “Directors and Corporate Governance” in our Proxy Statement.
ITEM 14. PRINCIPAL ACCOUNTANT FEES AND SERVICES
The information required by this item regarding principal accountant fees and services is incorporated by reference to the information set forth in the section titled “Principal Accountant Fees and Services” in our Proxy Statement.
PART IV
ITEM 15. EXHIBITS AND FINANCIAL STATEMENT SCHEDULE
(a)The following documents are filed as part of this Annual Report on Form 10-K.
1)Financial Statements—See Index to Consolidated Financial Statements at Item 8 of this report on Form 10-K.
2)The following financial statement schedule of Intuitive Surgical, Inc. for 2024, 2023, and 2022 is filed as part of this report and should be read in conjunction with the Consolidated Financial Statements of Intuitive Surgical, Inc.: All other schedules have been omitted, because they are not applicable, not required under the instructions, or the information requested is set forth in the Consolidated Financial Statements or related notes thereto.
3)Exhibits
The exhibits filed as part of this report are listed under “Exhibits” at subsection (b) of this Item 15.
(b)Exhibits
EXHIBIT INDEX | | | | | | | | |
| 3.1(1) | | |
| | |
| 3.2(2) | | |
| |
| 3.3(3) | | |
| |
| 4.1(4) | | |
| |
| 4.2(5) | | |
| | |
| 10.1(6) | | |
| |
| 10.2(7) | | |
| |
| 10.3(8) | | |
| |
| 10.4(9) | | |
| | |
| 10.5(10) | | |
| |
| 10.6(11) | | |
| |
| 10.7(12) | | |
| |
| | |
| |
| 10.9(13) | | |
| |
| 10.10(14) | | |
| | |
| 10.11(15) | | |
| | |
| 19 | | |
| | |
| 21.1 | | |
| |
| 23.1 | | |
| | |
| | |
| | |
| 31.1 | | |
| |
| 31.2 | | |
| |
| 32.1 | | |
| | |
| 32.2 |
| |
| | |
| 97.1(16) | | |
| | |
| 101 | | The following materials from Intuitive Surgical, Inc.’s Annual Report on Form 10-K for the year ended December 31, 2024, formatted in Inline XBRL (Inline Extensible Business Reporting Language): (i) Consolidated Balance Sheets, (ii) Consolidated Statements of Income, (iii) Consolidated Statements of Comprehensive Income, (iv) Consolidated Statements of Stockholders’ Equity, (v) Consolidated Statements of Cash Flows, and (vi) Notes to Consolidated Financial Statements, tagged at Level I through IV. |
| | |
| 104 | | The cover page from Intuitive Surgical, Inc.’s Annual Report on Form 10-K for the year ended December 31, 2024, formatted in Inline XBRL and contained in Exhibit 101. |
1.Incorporated by reference to Exhibit 3.1 filed with the Company’s Quarterly Report on Form 10-Q filed on July 23, 2020 (File No. 000-30713).
2.Incorporated by reference to Exhibit 3.1 filed with the Company’s Quarterly Report on Form 10-Q filed on October 20, 2021 (File No. 000-30713).
3.Incorporated by reference to Exhibit 3.1 filed with the Company’s Current Report on Form 8-K filed on February 1, 2021 (File No. 000-30713).
4.Incorporated by reference to Exhibit 4.2 filed with the Company’s Registration Statement Amendment on Form S-1/A filed on May 2, 2000 (File No. 333-33016).
5.Incorporated by reference to Exhibit 4.2 filed with the Company’s Annual Report on Form 10-K filed on February 3, 2022 (File No. 333-33016).
6.Incorporated by reference to exhibits filed with the Company’s Registration Statement on Form S-1 filed on March 22, 2000 (File No. 333-33016).
7.Incorporated by reference to Exhibit 10.1 filed with the Company’s Current Report on Form 8-K filed on August 3, 2015 (File No. 000-30713).
8.Incorporated by reference to Exhibit 4.2 filed with the Company’s Registration Statement on Form S-8 filed on May 1, 2015 (File No. 333-203793).
9.Incorporated by reference to Exhibit 10.2 filed with the Company’s Current Report on Form 8-K filed on April 30, 2024 (File No. 000-30713).
10.Incorporated by reference to Exhibit 10.1 filed with the Company’s Current Report on Form 8-K filed on April 30, 2024 (File No. 000-30713).
11.Incorporated by reference to Exhibit 10.1 filed with the Company’s Current Report on Form 8-K filed on December 2, 2008 (File No. 000-30713).
12.Incorporated by reference to Exhibit 10.9 filed with the Company’s 2015 Annual Report on Form 10-K filed on February 2, 2016 (File No. 000-30713).
13.Incorporated by reference to Exhibit 10.9 filed with the Company’s 2022 Annual Report on Form 10-K filed on February 10, 2023 (File No. 000-30713).
14.Incorporated by reference to Exhibit 10.10 filed with the Company’s 2022 Annual Report on Form 10-K filed on February 10, 2023 (File No. 000-30713).
15.Incorporated by reference to Exhibit 10.11 filed with the Company’s 2022 Annual Report on Form 10-K filed on February 10, 2023 (File No. 000-30713).
16.Incorporated by reference to Exhibit 97.1 filed with the Company’s 2023 Annual Report on Form 10-K filed on January 31, 2024 (File No. 000-30713).
* Management contract or compensatory plan or arrangement.
ITEM 16. FORM 10-K SUMMARY
None.
SIGNATURES
Pursuant to the requirements of Section 13 or 15(d) of the Securities Exchange Act of 1934, the registrant has duly caused this report to be signed on its behalf by the undersigned thereunto duly authorized.
| | | | | | | | | | | | | | | | | |
| | | INTUITIVE SURGICAL, INC. |
| | | | |
| Date: | January 31, 2025 | | By: | | /S/ GARY S. GUTHART |
| | | | | Gary S. Guthart, Ph.D. Chief Executive Officer |
Power of Attorney
Each person whose individual signature appears below hereby authorizes and appoints Gary Guthart, Ph.D., and Jamie Samath, and each of them, with full power of substitution and re-substitution and full power to act without the other, as his or her true and lawful attorney-in-fact and agent to act in his or her name, place, and stead and to execute in the name and on behalf of each person, individually and in each capacity stated below, and to file any and all amendments to this annual report on Form 10‑K and to file the same, with all exhibits thereto, and other documents in connection therewith, with the Securities and Exchange Commission, granting unto said attorneys-in-fact and agents, and each of them, full power and authority to do and perform each and every act and thing, ratifying and confirming all that said attorneys-in-fact and agents or any of them or their or his substitute or substitutes may lawfully do or cause to be done by virtue thereof.
Pursuant to the requirements of the Securities Exchange Act of 1934, this report has been signed below by the following persons on behalf of the Registrant and in the capacities and on the dates indicated.
| | | | | | | | | | | | | | |
| Signature | | Title | | Date |
| | |
| /S/ GARY S. GUTHART | | Chief Executive Officer and Director (Principal Executive Officer) | | January 31, 2025 |
| Gary S. Guthart, Ph.D. | | |
| /S/ DAVID J. ROSA | | President and Director | | January 31, 2025 |
| David J. Rosa | | |
| /S/ JAMIE E. SAMATH | | Executive Vice President, Chief Financial Officer (Principal Financial Officer) | | January 31, 2025 |
| Jamie E. Samath | | |
| /S/ FREDRIK C. WIDMAN | | Vice President, Corporate Controller
(Principal Accounting Officer) | | January 31, 2025 |
| Fredrik C. Widman | | |
| /S/ CRAIG H. BARRATT | | Chairman of the Board of Directors | | January 31, 2025 |
| Craig H. Barratt, Ph.D. | | |
| /S/ JOSEPH C. BEERY | | Director | | January 31, 2025 |
| Joseph C. Beery | | |
| /S/ LEWIS CHEW | | Director | | January 31, 2025 |
| Lewis Chew | | |
| /S/ AMAL M. JOHNSON | | Director | | January 31, 2025 |
| Amal M. Johnson | | |
/S/ SREELAKSHMI KOLLI | | Director | | January 31, 2025 |
| Sreelakshmi Kolli | | | | |
| /S/ AMY L. LADD | | Director | | January 31, 2025 |
| Amy L. Ladd, M.D. | | |
| /S/ KEITH R. LEONARD JR. | | Director | | January 31, 2025 |
| Keith R. Leonard Jr. | | | | |
| /S/ JAMI DOVER NACHTSHEIM | | Director | | January 31, 2025 |
| Jami Dover Nachtsheim | | |
| /S/ MONICA P. REED | | Director | | January 31, 2025 |
| Monica P. Reed, M.D. | | | | |
| /S/ MARK J. RUBASH | | Director | | January 31, 2025 |
| Mark J. Rubash | | | | |