ALEXANDRIA REAL ESTATE EQUITIES, INC.
March 31, 2014
Table of Contents
|
| |
| | Page |
| EARNINGS PRESS RELEASE | |
| First Quarter Ended March 31, 2014, Financial and Operating Results | |
| Guidance | |
| Earnings Call Information and About the Company | |
| Consolidated Statements of Income | |
| Consolidated Balance Sheets | |
| Funds From Operations and Adjusted Funds From Operations | |
| SUPPLEMENTAL INFORMATION | |
| Company Profile | |
| Investor Information | |
| Financial and Asset Base Highlights | |
| Operating Information | |
| Operating Metrics | |
| Same Property Performance | |
| Leasing Activity | |
| Lease Expirations | |
| Top 20 Client Tenants | |
| Client Tenant Mix | |
|
| |
| | Page |
| SUPPLEMENTAL INFORMATION (continued) | |
| Operating Information (continued) | |
| Summary of Properties and Occupancy | |
| Property Listing | |
| External Growth: Value-Creation Projects and Acquisitions | |
| Investments in Real Estate | |
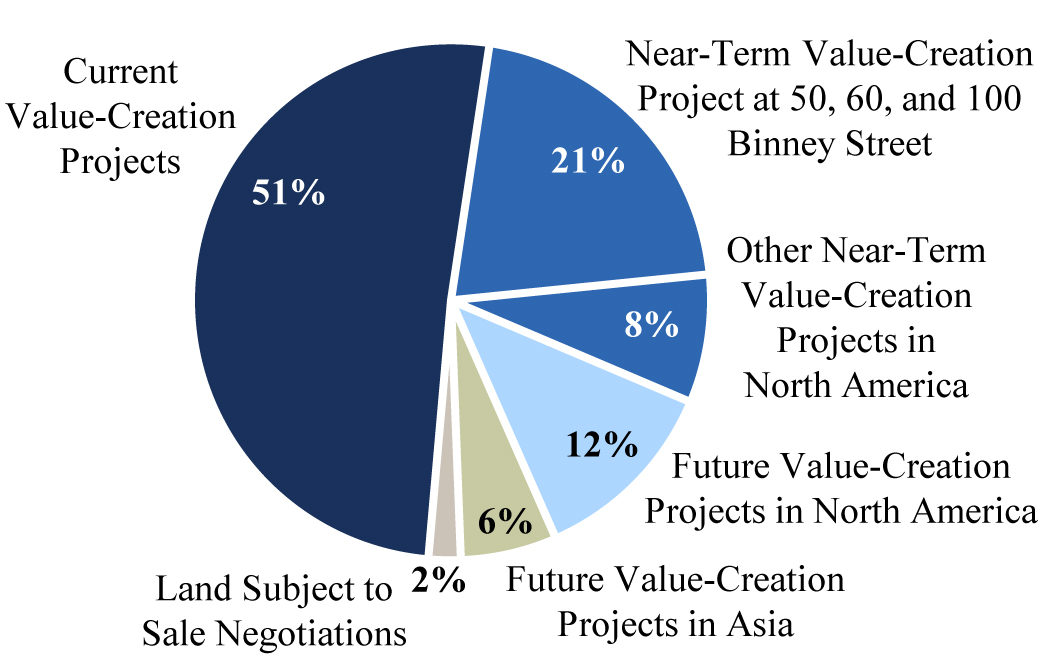
| All Current Value-Creation Projects in North America | |
| Near-Term Value-Creation Development Projects and Future Value-Creation Development Projects in North America | |
| Actual and Projected Construction Spending | |
| Real Estate Acquisitions | |
| Asset Sales and Other Sources of Capital | |
| Real Estate Investments in Asia | |
| Balance Sheet | |
| Key Credit Metrics | |
| Summary of Debt | |
| Definitions and Other Information | |
|
|
This document includes “forward-looking statements” within the meaning of Section 27A of the Securities Act of 1933, as amended, and Section 21E of the Securities Exchange Act of 1934, as amended. Please see page 4 of the earnings press release for further information. |
| This document is not an offer to sell or solicitation to buy securities of Alexandria Real Estate Equities, Inc. Any offers to sell or solicitations to buy our securities shall be made only by means of a prospectus approved for that purpose. Unless otherwise indicated, the “Company,” “Alexandria,” “we,” “us,” and “our” refer to Alexandria Real Estate Equities, Inc. and its consolidated subsidiaries. |
|
| | |
| ALEXANDRIA REAL ESTATE EQUITIES, INC ALL RIGHTS RESERVED © 2013 | i |
Alexandria Real Estate Equities, Inc.
Reports
First Quarter Ended March 31, 2014
Financial and Operating Results
Core Operations Continue to Deliver Solid Results
FFO Per Share – Diluted for 1Q14 up 5.4% over 1Q13
EPS – Diluted of $0.46 for 1Q14
FFO Per Share – Diluted of $1.17 for 1Q14
Total Revenues of $176.2 Million for 1Q14
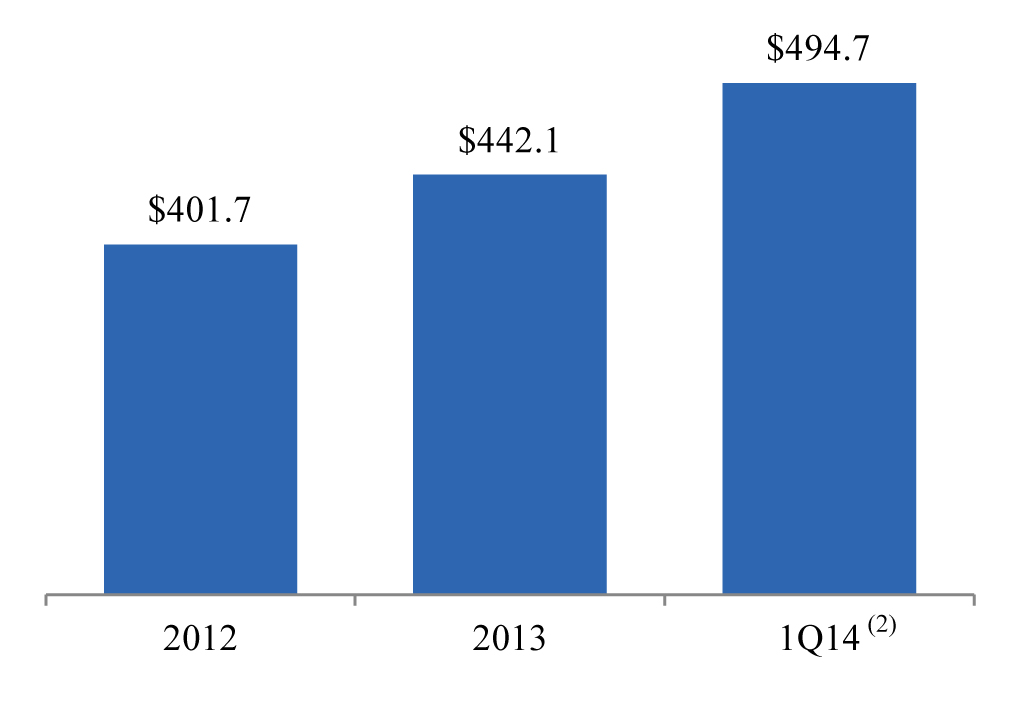
NOI of $123.7 Million for 1Q14
PASADENA, CA. – May 5, 2014 – Alexandria Real Estate Equities, Inc. (NYSE:ARE) today announced financial and operating results for the first quarter ended March 31, 2014.
“Our first quarter results in 2014 continued to highlight the momentum of our improving fundamentals, which is driving stable and solid growth. The sustained migration into Class A collaborative science and technology campuses in urban innovation clusters continues to drive demand for our properties. The solid operating performance we achieved in 2013 continued into the first quarter of 2014 and included (i) solid same property NOI increase of 4.3% on a cash basis, (ii) strong rental rate growth of 10.4% on a cash basis related to lease renewals and re-leasing of space, and (iii) continued significant growth in NOI from our recently delivered value-creation developments.
“Our leasing volume was considerable, particularly in light of the extremely low level of contractual lease expirations in 2014. Occupancy in 2014 continued to increase to record levels and we completed $142.7 million of acquisitions thus far in 2014. We repaid $210.8 million of secured notes payable in the first quarter of 2014. We also expect to opportunistically issue unsecured bonds in 2014. Our Class A developments maintained their path towards stabilization with our 499 Illinois Street project in Mission Bay now 98% leased and our 430 East 29th Street project at our flagship Alexandria CenterTM for Life Science in Manhattan up to 69% leased or under negotiation. Our confidence in our ability to continue per-share earnings growth and increase shareholder net asset value in 2014 and beyond remains on track,” said Joel S. Marcus, Chairman, Chief Executive Officer, and Founder of Alexandria Real Estate Equities, Inc.
20th anniversary
Celebration of important milestone in Company’s history
| |
| • | Alexandria was founded in 1994 by Joel S. Marcus and Jerry Sudarsky, who envisioned a unique class of real estate and related services focused on the broad, diverse and rapidly expanding life science industry. |
| |
| • | With a business plan and $19 million of seed capital, the Company acquired its first assets in 1994 and soon thereafter expanded into multiple cluster markets. |
| |
| • | In 1997, the Company filed for an initial public offering (“IPO”) as the first Real Estate Investment Trust (“REIT”) uniquely focused on the life science industry. |
| |
| • | Since that time, Mr. Marcus facilitated the Company’s growth into the largest and leading brand in every major urban collaborative science and technology cluster in the United States, including Greater Boston, the San Francisco Bay Area, Greater New York City, Seattle, San Diego, Maryland and Research Triangle Park. |
| |
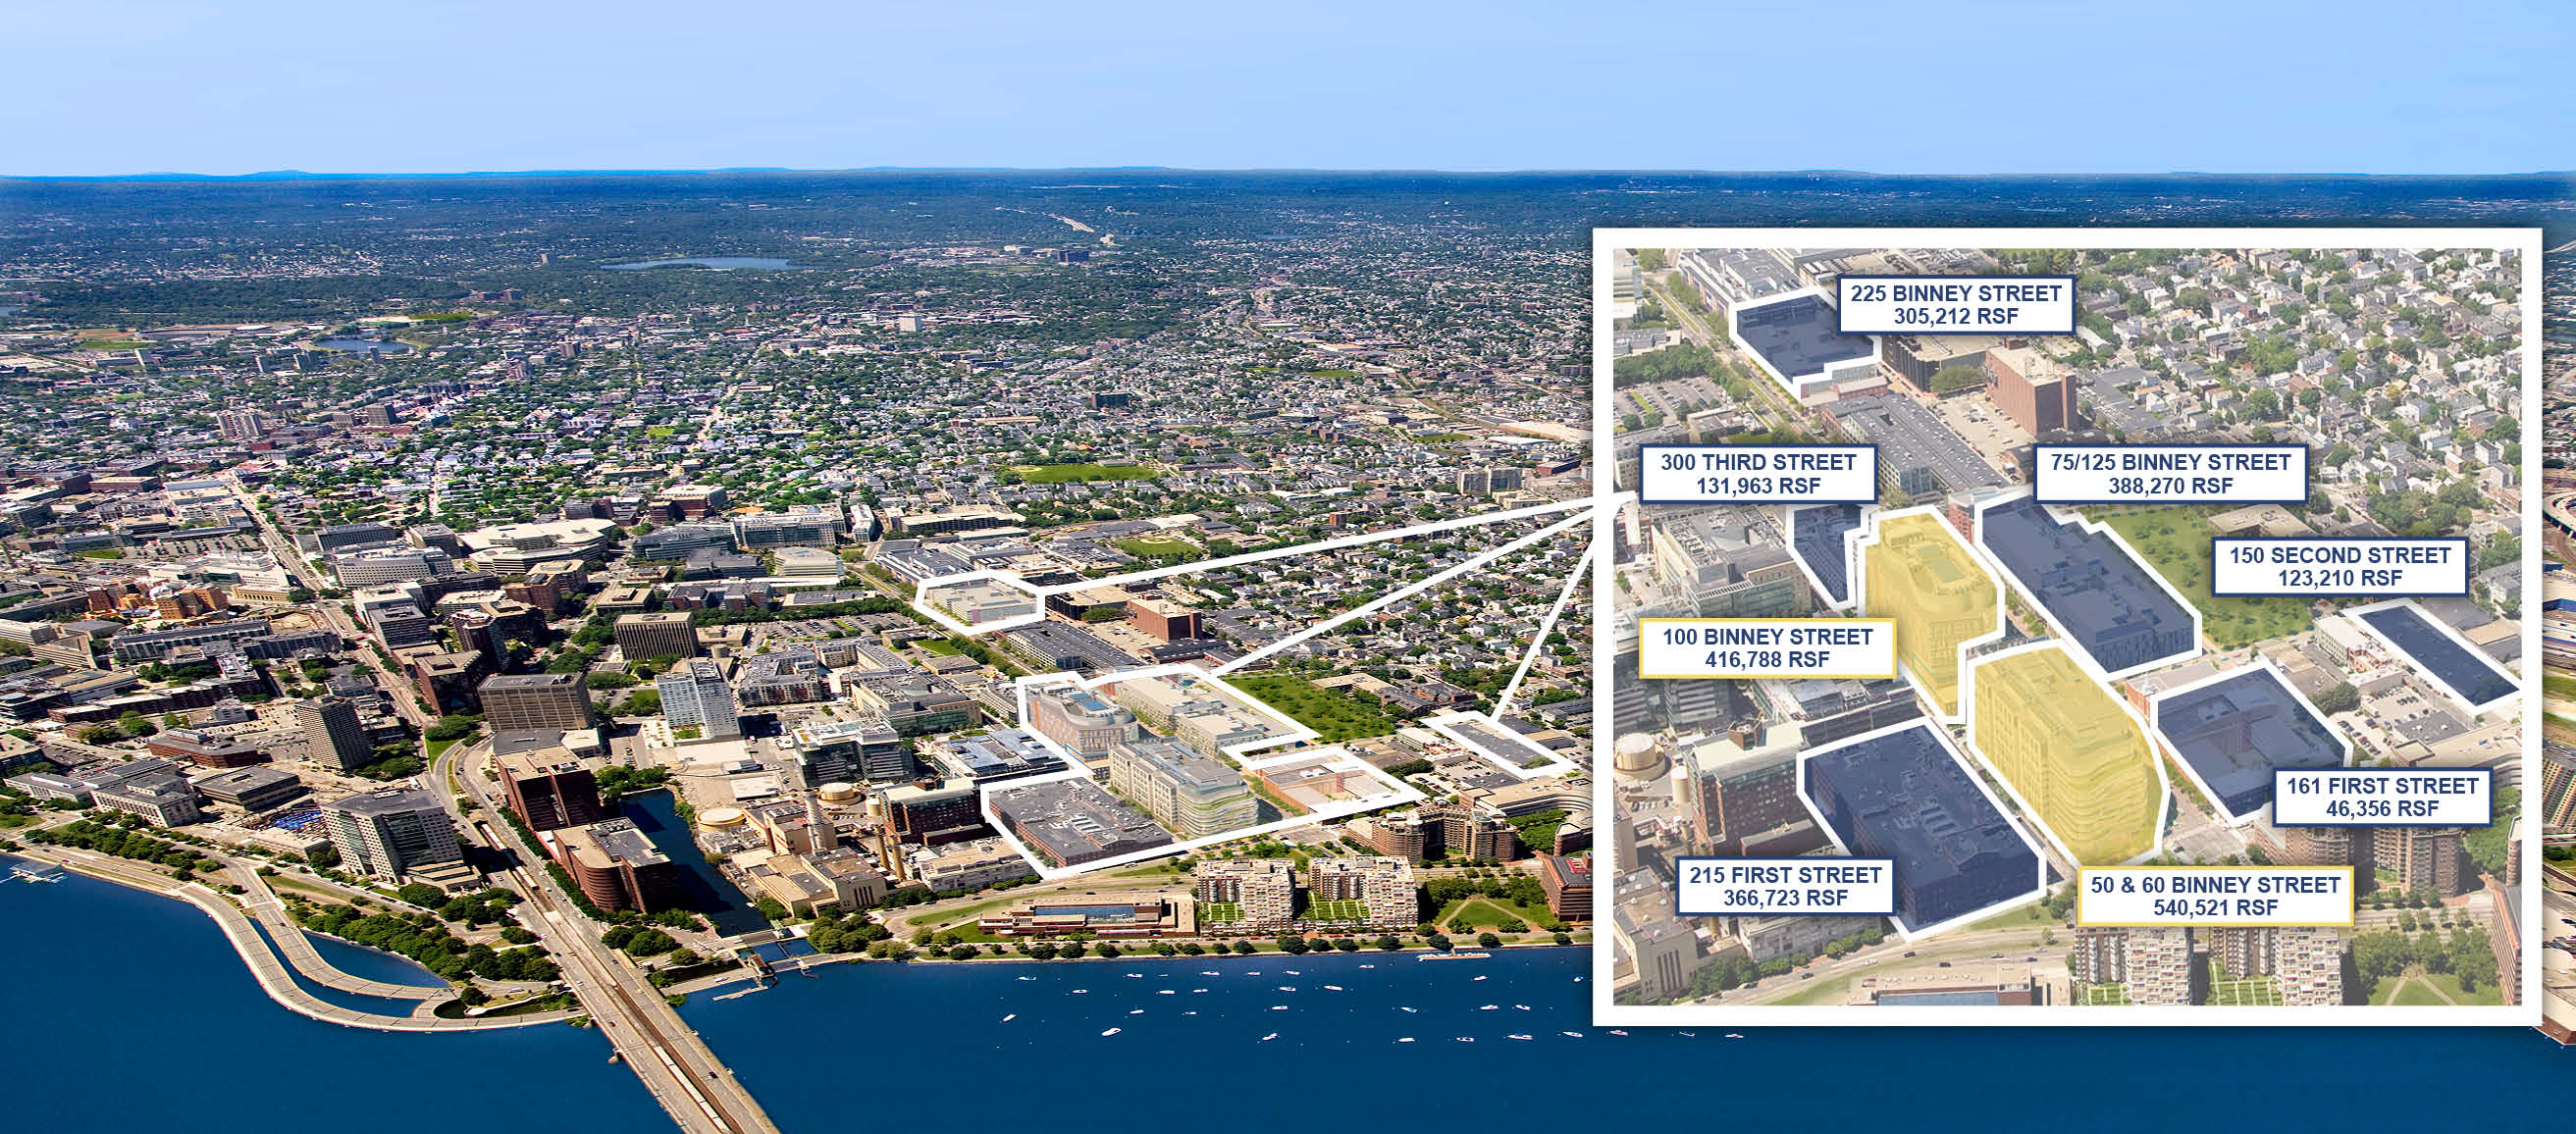
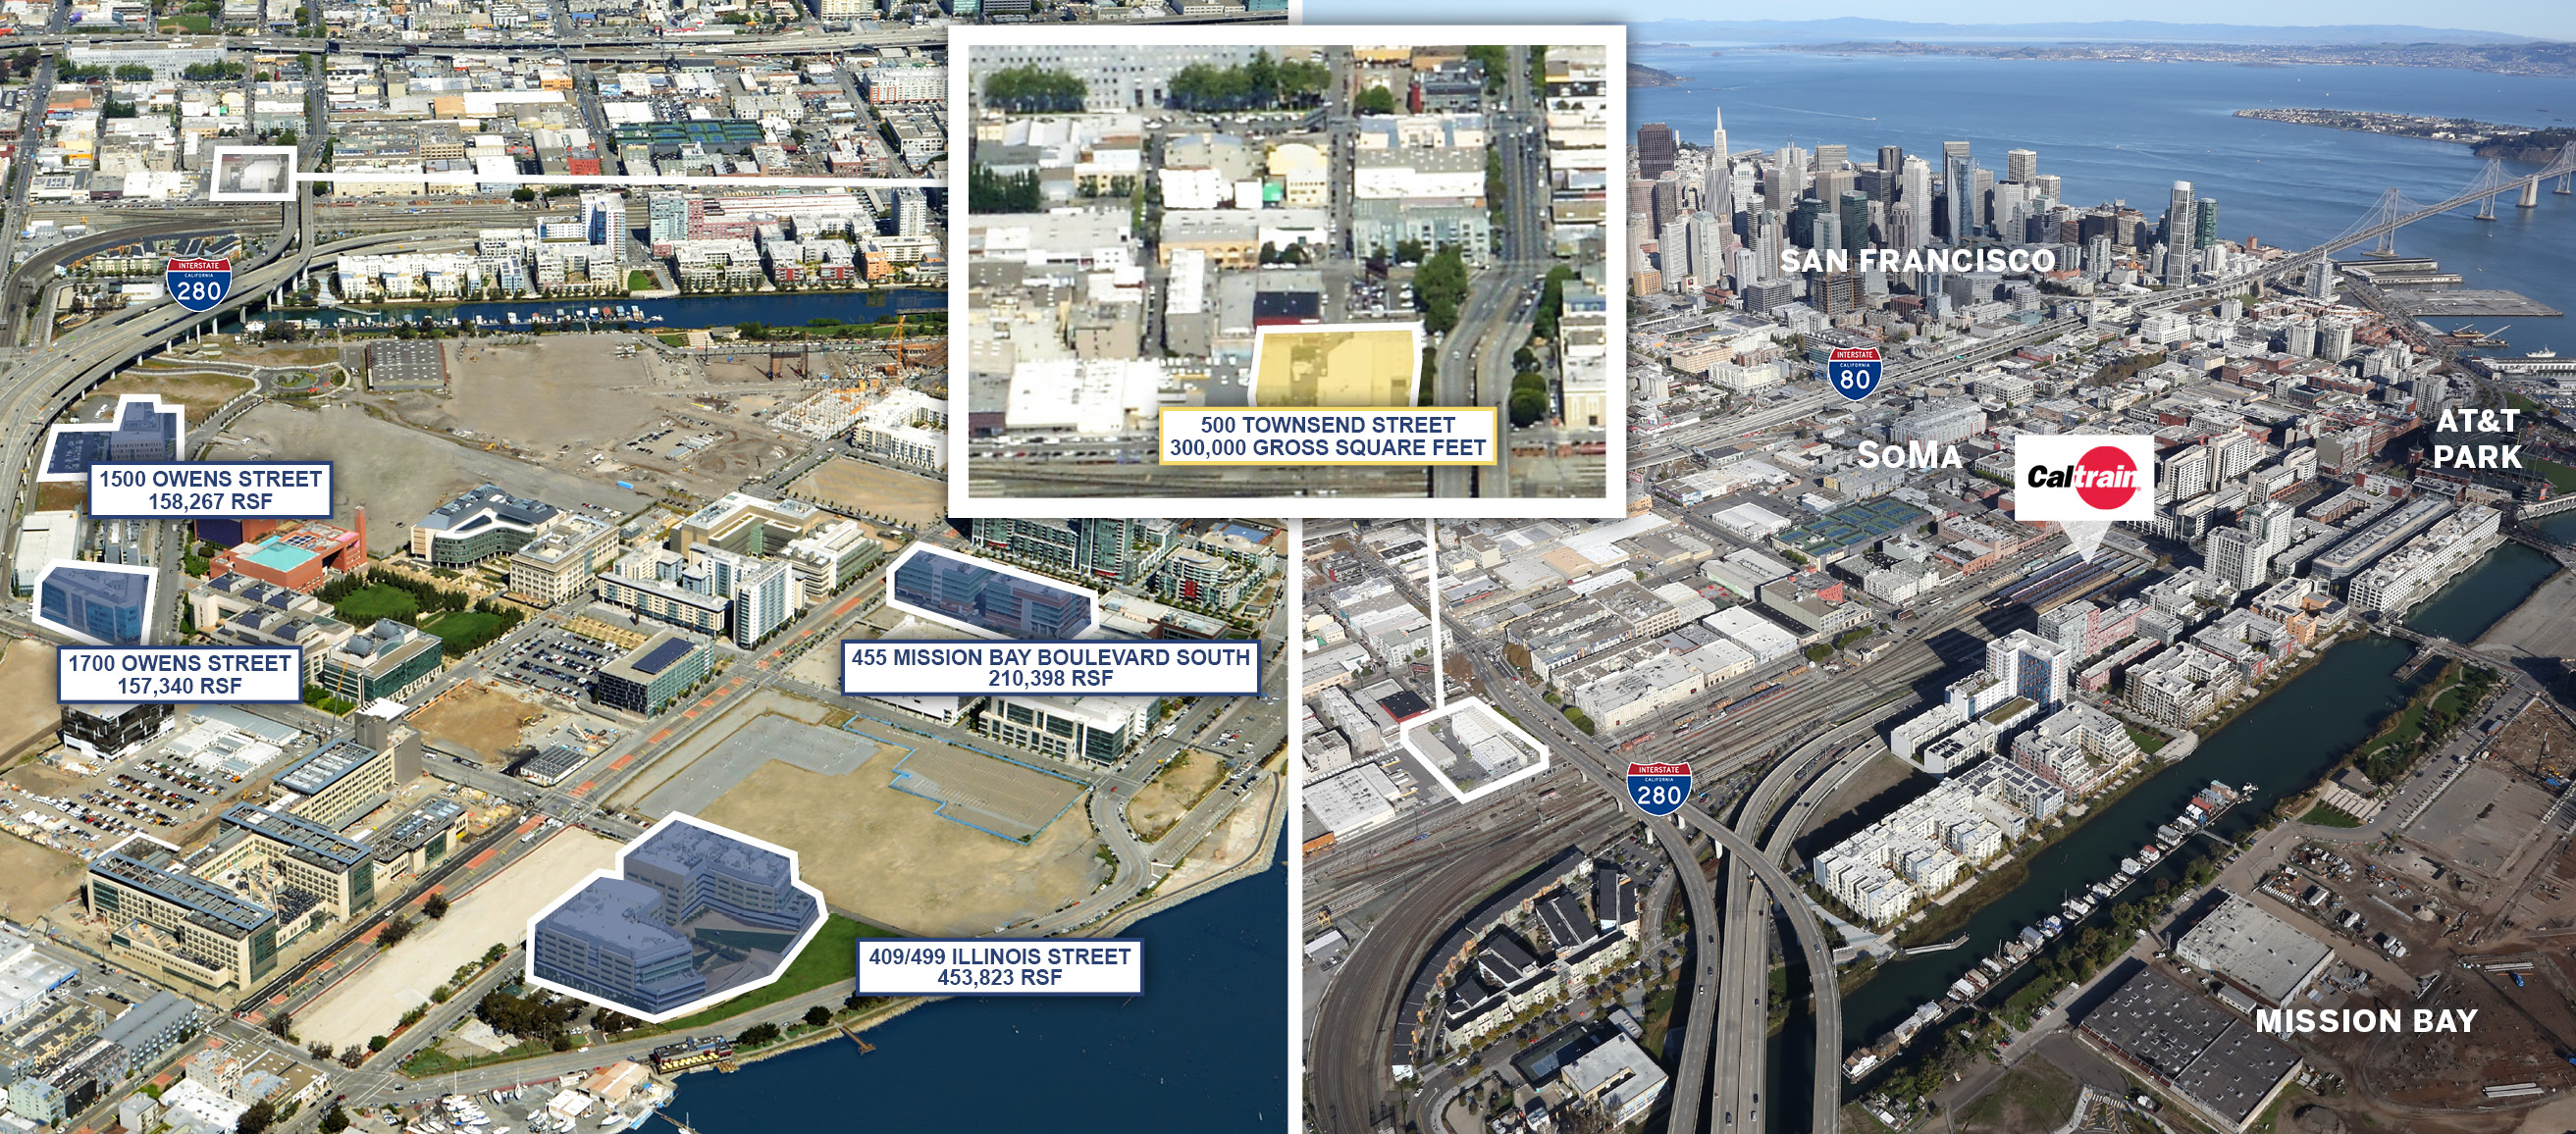
| • | Alexandria also initiated and led the development of the world’s newest science and technology clusters in Mission Bay, San Francisco, where Alexandria has developed over one million square feet of Class A space, and in New York City, where Alexandria has developed Manhattan’s first and only commercial Class A collaborative science and technology campus, the Alexandria CenterTM for Life Science. |
| |
| • | Alexandria also founded the Alexandria SummitTM, an annual, invitation-only gathering of the world's foremost visionaries to advance critical issues in science and technology. |
| |
| • | Since its founding, Alexandria has grown its total market capitalization to approximately $9 billion and generated a total return of 579% from its IPO through March 31, 2014. |
Results
| |
| • | Net income attributable to Alexandria Real Estate Equities, Inc.’s (“Alexandria’s”) common stockholders – diluted of $32.7 million, or $0.46 per share, for 1Q14 compared to $22.4 million, or $0.36 per share, for 1Q13 |
| |
| • | Funds from operations (“FFO”) attributable to Alexandria’s common stockholders – diluted, of $83.1 million for 1Q14 compared to $70.0 million for 1Q13 |
| |
| • | Up 5.4% to $1.17 per share for 1Q14 compared to $1.11 per share for 1Q13 |
|
| | |
| ALEXANDRIA REAL ESTATE EQUITIES, INC
ALL RIGHTS RESERVED © 2014 | 1 |
ALEXANDRIA REAL ESTATE EQUITIES, INC.
March 31, 2014
Core operating metrics
| |
| • | Total revenues of $176.2 million for 1Q14, up $26.1 million, or 17.4%, compared to $150.1 million for 1Q13 |
| |
| • | Net operating income (“NOI”) of $123.7 million for 1Q14, up $18.8 million, or 17.9%, compared to $104.9 million for 1Q13 |
| |
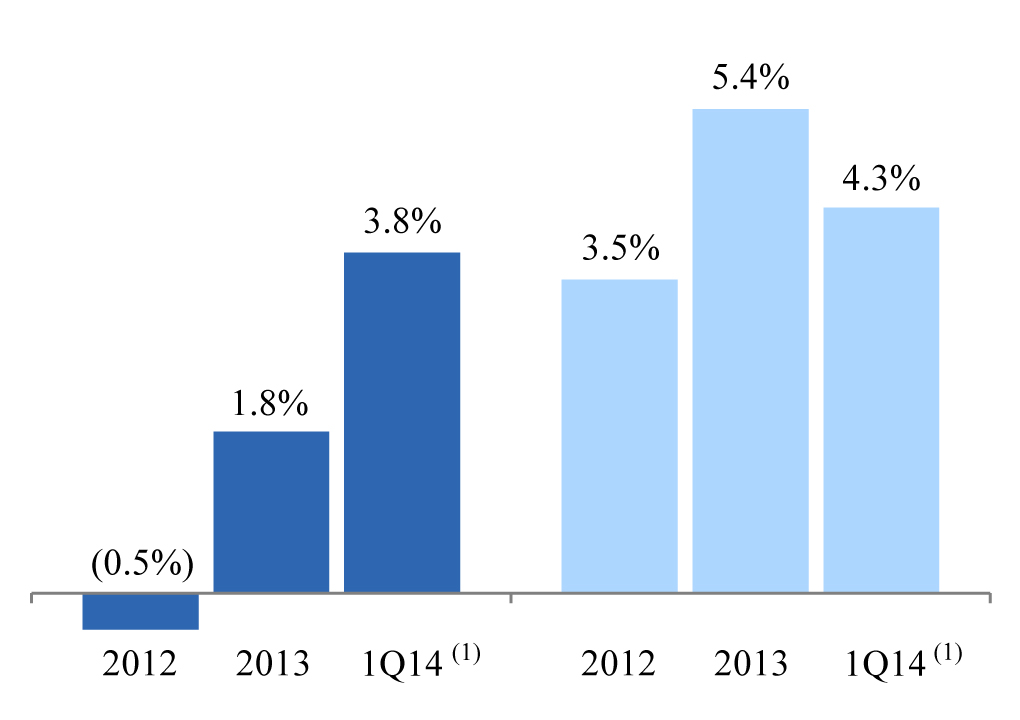
| • | Same property NOI growth for 1Q14 compared to 1Q13: |
| |
| • | Leasing activity during 1Q14: |
| |
| • | Executed 49 leases for 563,394 rentable square feet (“RSF”) |
| |
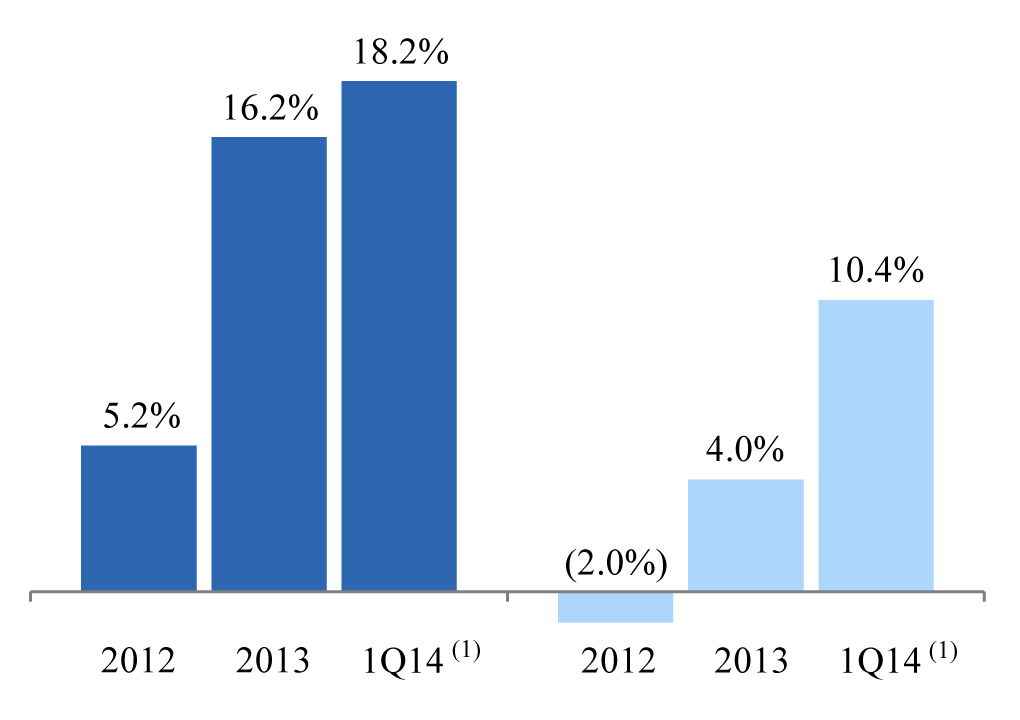
| • | Rental rate increases on 1Q14 lease renewals and re-leasing of space: |
| |
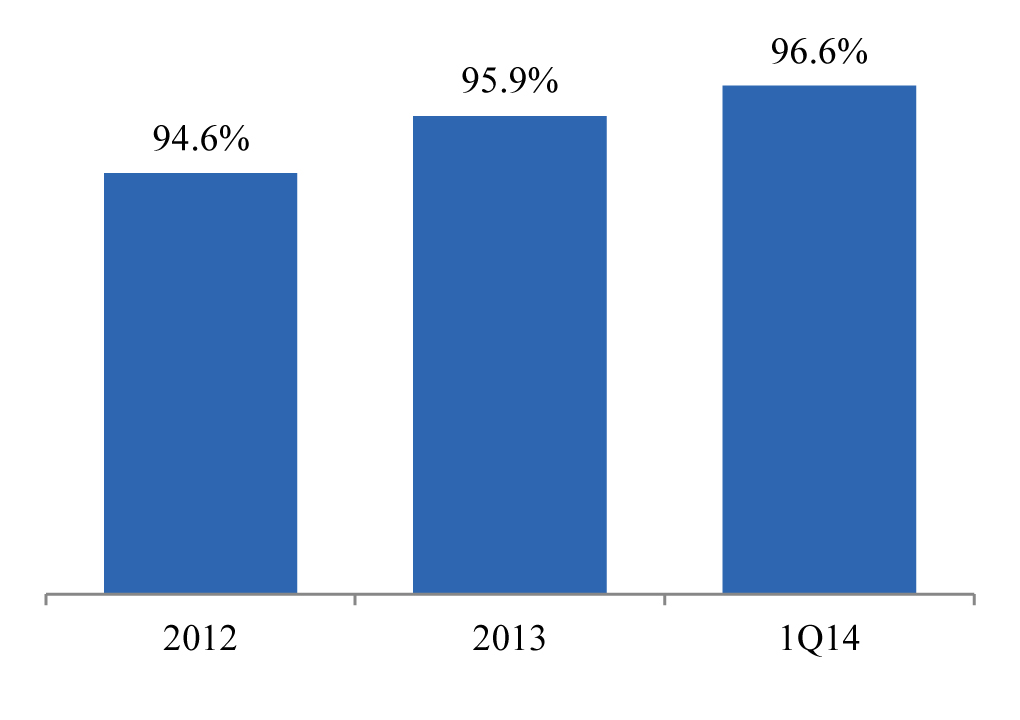
| • | Occupancy for properties in North America, as of 1Q14: |
| |
| • | 96.6% occupancy for operating properties, up 240 basis points (“bps”) from 1Q13 |
| |
| • | 95.1% occupancy for operating and redevelopment properties, up 330 bps from 1Q13 |
| |
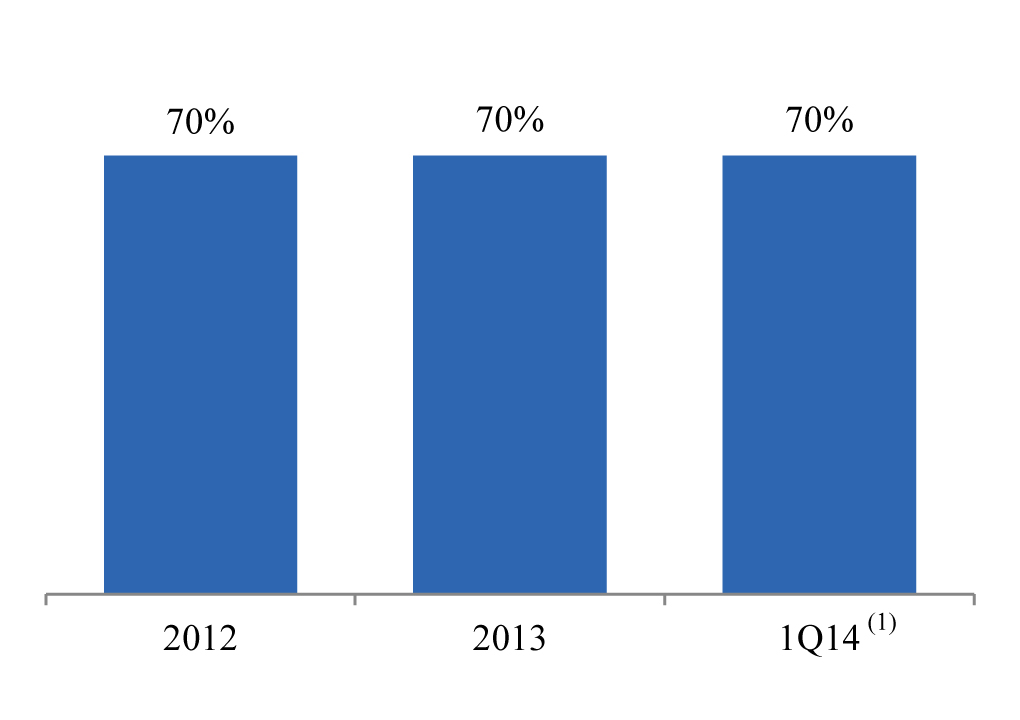
| • | Operating margins steady at 70% for 1Q14 |
| |
| • | 52% of total annualized base rent (“ABR”) from investment-grade client tenants |
External growth: value-creation projects and acquisitions
Value-creation projects
| |
| • | 79% of our development and redevelopment projects aggregating 1,768,493 RSF in North America are leased or under lease negotiations |
| |
| • | Commenced redevelopment of the following projects in 1Q14: |
| |
| • | 225 Second Avenue, a 112,500 RSF project in the Route 128 submarket of Greater Boston (acquired in 1Q14) |
| |
| • | 10121 Barnes Canyon Road, a 53,512 RSF project in the Sorrento Mesa submarket of San Diego (acquired in 3Q13) |
Acquisitions
| |
| • | Completed three acquisitions in 1Q14: |
| |
| • | Two acquisitions aggregating 159,122 RSF with occupancy of 100% in the San Diego market for $76.4 million, and |
| |
| • | A redevelopment property aggregating 112,500 RSF (under lease negotiation for 100% of the space) in the Greater Boston market for $16.3 million |
Balance sheet
| |
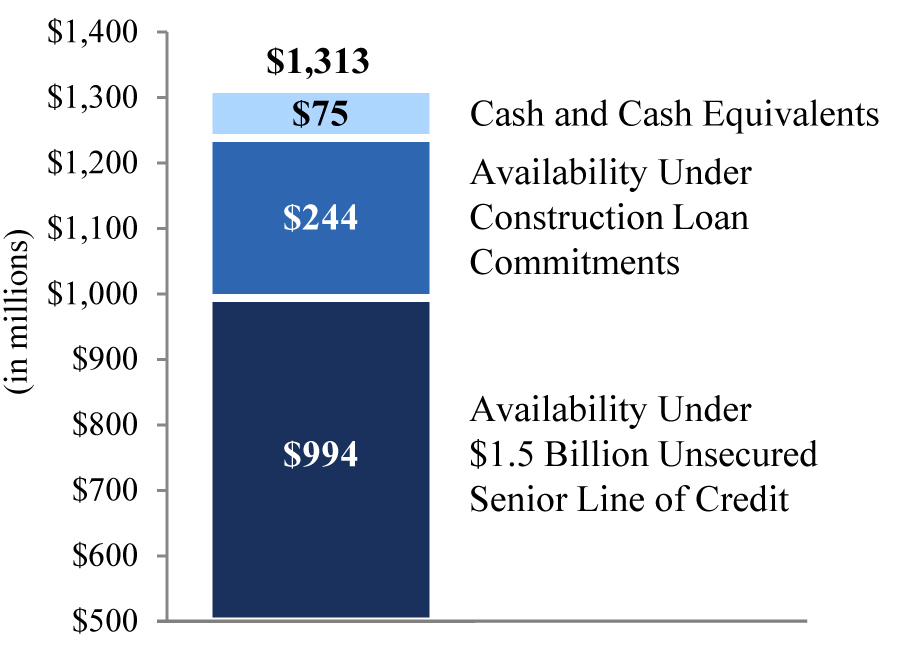
| • | Liquidity of $1.3 billion as of 1Q14, consisting of $994.0 million available under our unsecured senior line of credit, $244.4 million available under our construction loan commitments, and $75.0 million in cash and cash equivalents |
| |
| • | Repaid a $208.7 million secured note payable related to Alexandria Technology Square®, with an effective interest rate of 5.59%. |
| |
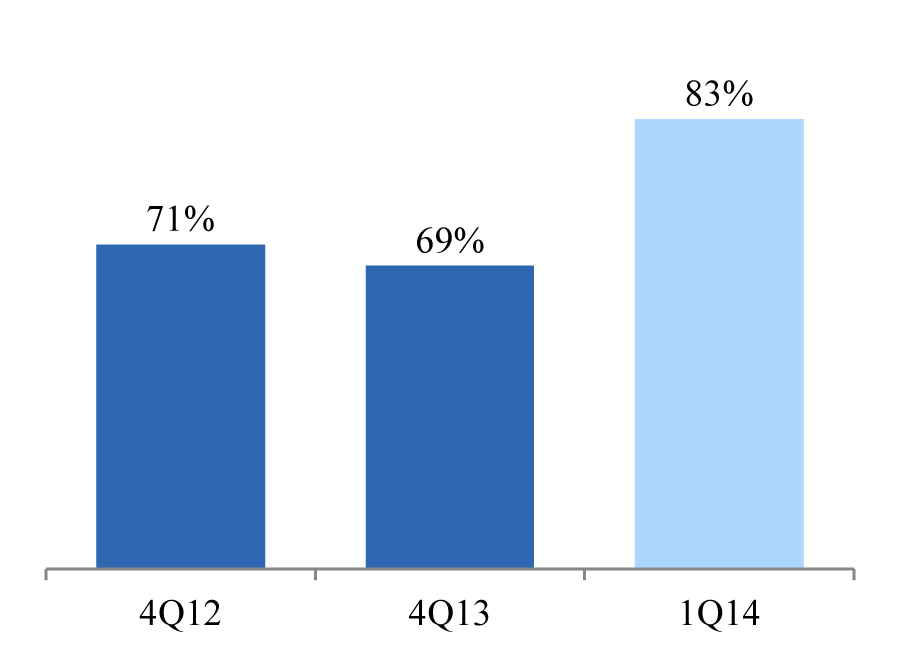
| • | Unencumbered NOI as a percentage of total NOI increased to 83% for 1Q14 from 69% for 4Q13 |
| |
| • | Entered into interest rate swap agreements with an aggregate notional amount of $200.0 million to provide a minimum notional balance of hedged variable-rate debt of $950.0 million in 2014 |
LEED certifications
| |
| • | As of 1Q14, our asset base had 25 LEED Certified projects, including two LEED Platinum projects, 16 LEED Gold projects, and seven LEED Silver projects. Upon completion of an additional 21 in-process certifications, 50% of the total RSF of our continuing operations asset base will be LEED Certified. |
Subsequent events
Amended and extended employment agreement with Mr. Marcus
| |
| • | In April 2014, the Board of Directors amended and extended the term of the employment agreement with Joel S. Marcus through December 31, 2016, subject to an extension to December 31, 2018, in the form of an option, exercisable by either the Company or Mr. Marcus, for Mr. Marcus to serve as full-time Executive Chairman. |
| |
| • | We believe changes in compensation arrangements appropriately address expressed concerns on the 2013 say-on-pay vote, and better align pay-for-performance, while at the same time continuing to retain Mr. Marcus’s highly valuable services. |
Acquisition of 500 Townsend Street
| |
| • | In April 2014, we acquired a land parcel, supporting approximately 300,000 gross square feet, in the SoMa submarket of San Francisco for a purchase price of $50.0 million. |
| |
| • | We are in the process of perfecting entitlements, marketing for lease, and plan to commence construction as soon as possible in 2015. |
|
| | |
| ALEXANDRIA REAL ESTATE EQUITIES, INC
ALL RIGHTS RESERVED © 2014 | 2 |
ALEXANDRIA REAL ESTATE EQUITIES, INC.
March 31, 2014
Guidance
Based on our current view of existing market conditions and other assumptions, we have updated guidance for earnings per share – diluted and FFO per share – diluted, both amounts attributable to Alexandria’s common stockholders, and updated the sources and uses of capital for the year ended December 31, 2014. The table below provides a reconciliation of FFO per share – diluted, a non-GAAP measure, from earnings per share – diluted, the most directly comparable GAAP measure, as well as other key assumptions included in our guidance for the year ended December 31, 2014. We expect that our principal liquidity needs for the year ended December 31, 2014, will be satisfied by multiple sources of capital as shown in the table below. There can be no assurance that our sources and uses of capital will not be materially higher or lower than these expectations. The key assumptions behind the sources and uses of capital are a favorable capital market environment and performance of our core operations in areas such as delivery of current and future development and redevelopment projects, leasing activity, and lease renewals. Our expected sources and uses of capital are subject to a number of variables and uncertainties, including those discussed under the “Forward-looking statements” section under Part I and the “Risk Factors” section under Item 1A of our annual report on Form 10-K for the year ended December 31, 2013. We expect to update our forecast of sources and uses of capital on a quarterly basis.
|
| | | | | | |
| | | | 2014 Guidance | |
| | EPS and FFO Per Share | | Low – High | |
| | Earnings per share attributable to Alexandria’s common stockholders – diluted | | | $1.75 – $1.85 | | |
| | Add back: depreciation and amortization | | | 2.97 | | |
| | Other | | | (0.02) | | |
| | FFO per share attributable to Alexandria’s common stockholders – diluted | | | $4.70 – $4.80 | | |
|
| | | | | | | | |
2014 Sources and Uses of Capital (Dollars in thousands) | | Low | | High |
| Sources of capital: | | | | |
| Unsecured senior notes payable | | $ | 500,000 |
| | $ | 600,000 |
|
Secured loan additions (construction loans and assumed debt) (1) | | 100,000 |
| | 223,000 |
|
Secured notes payable repayments (2) | | (210,000 | ) | | (210,000 | ) |
| Activity on our unsecured senior line of credit and senior unsecured term loan | | 50,000 |
| | (133,000 | ) |
| Net sources of debt capital | | 440,000 |
| | 480,000 |
|
| Net cash provided by operating activities after dividends | | 100,000 |
| | 120,000 |
|
| Land sales/strategic joint venture capital | | 145,000 |
| | 245,000 |
|
| Total sources of capital | | $ | 685,000 |
| | $ | 845,000 |
|
| | | | | |
| Uses of capital: | | | | |
| Construction | | $ | 585,000 |
| | $ | 645,000 |
|
| Acquisitions | | 100,000 |
| | 200,000 |
|
| Total uses of capital | | $ | 685,000 |
| | $ | 845,000 |
|
|
| | | | | | | | |
2014 Key Assumptions (Dollars in thousands) | | Low | | High |
| Occupancy percentage for operating properties at December 31, 2014: | | | | |
| North America | | 96.5% |
| | 97.0% |
|
| | | | | |
| Lease renewals and re-leasing of space: | | | | |
| Rental rate increases | | 10% |
| | 13% |
|
| Rental rate increases (cash basis) | | 3% |
| | 5% |
|
| | | | | |
| Same property performance: | | | | |
| NOI increase | | 2% |
| | 4% |
|
| NOI increase (cash basis) | | 4% |
| | 6% |
|
| | | | | |
| Straight-line rents | | $ | 42,000 |
| | $ | 47,000 |
|
| General and administrative expenses | | $ | 48,000 |
| | $ | 52,000 |
|
| Capitalization of interest | | $ | 37,000 |
| | $ | 47,000 |
|
| Interest expense | | $ | 76,000 |
| | $ | 92,000 |
|
| |
| (1) | Includes two non-recourse secured notes payable aggregating $48.3 million assumed in connection with the acquisition of two operating assets in 1Q14. |
| |
| (2) | Represents the principal amortization payments and balloon payments at maturity on all of our secured notes payable, including one secured note payable related to Alexandria Technology Square®, which was repaid on January 31, 2014. This amount is net of the $20.9 million that was funded by our 10% joint venture partner. |
|
| | |
| ALEXANDRIA REAL ESTATE EQUITIES, INC
ALL RIGHTS RESERVED © 2014 | 3 |
ALEXANDRIA REAL ESTATE EQUITIES, INC.
March 31, 2014
Earnings Call Information
We will host a conference call on Tuesday, May 6, 2014, at 3:00 p.m. Eastern Time (“ET”)/12:00 p.m. noon Pacific Time (“PT”) that is open to the general public to discuss our financial and operating results for the first quarter ended March 31, 2014. To participate in this conference call, dial (877) 857-6150 or (719) 325-4837 and confirmation code 1577029 shortly before 3:00 p.m. ET/12:00 p.m. noon PT. The audio webcast can be accessed at: www.are.com, in the “For Investors” section. A replay of the call will be available for a limited time from 6:00 p.m. ET/3:00 p.m. PT on Tuesday, May 6, 2014. The replay number is (888) 203-1112 or (719) 457-0820 and the confirmation code is 1577029.
Additionally, a copy of this Earnings Press Release and Supplemental Information for the first quarter ended March 31, 2014, is available in the “For Investors” section of our website at www.are.com or by following this link: http://www.are.com/fs/2014q1.pdf.
For any questions, please contact Joel S. Marcus, Chairman, Chief Executive Officer & Founder, at (626) 578-9693.
About the Company
Alexandria Real Estate Equities, Inc. (NYSE:ARE) is a fully integrated, self-administered and self-managed REIT uniquely focused on Class A collaborative science and technology campuses in urban innovation clusters including Greater Boston, the San Francisco Bay Area, New York City, Seattle, San Diego, Maryland, and Research Triangle Park. Alexandria is the largest and leading owner, operator and developer in its niche with a total market capitalization of approximately $9 billion as of March 31, 2014, and an asset base of 31.2 million RSF, including 17.7 million RSF of operating and current value-creation projects, as well as an additional 13.5 million RSF in future ground-up development projects.
***********
This document includes “forward-looking statements” within the meaning of Section 27A of the Securities Act of 1933, as amended, and Section 21E of the Securities Exchange Act of 1934, as amended. Such forward-looking statements include, without limitation, statements regarding our 2014 earnings per share attributable to Alexandria’s common stockholders – diluted, 2014 FFO per share attributable to Alexandria’s common stockholders – diluted, NOI, and our projected sources and uses of capital for the year ended December 31, 2014. You can identify the forward-looking statements by their use of forward-looking words, such as “believes,” “expects,” “may,” “will,” “should,” “seeks,” “intends,” “plans,” “estimates,” “anticipates,” or “projects,” or the negative of those words or similar words. These forward-looking statements are based on our current expectations, beliefs, projections, future plans and strategies, anticipated events or trends and similar expressions concerning matters that are not historical facts, as well as a number of assumptions concerning future events. These statements are subject to risks, uncertainties, assumptions, and other important factors that could cause actual results to differ materially from the results discussed in the forward-looking statements. Factors that might cause such a difference include, without limitation, our failure to obtain capital (debt, construction financing, and/or equity) or refinance debt maturities, increased interest rates and operating costs, adverse economic or real estate developments in our markets, our failure to successfully complete and lease our existing space held for redevelopment and new properties acquired for that purpose and any properties undergoing development, our failure to successfully operate or lease acquired properties, decreased rental rates, increased vacancy rates or failure to renew or replace expiring leases, defaults on, or non-renewal of, leases by client tenants, general and local economic conditions, and other risks and uncertainties detailed in our filings with the Securities and Exchange Commission (“SEC”). Accordingly, you are cautioned not to place undue reliance on such forward-looking statements. All forward-looking statements are made as of May 5, 2014, the date this document was first made available on our website, and unless otherwise stated, we assume no obligation to update this information and expressly disclaim any obligation to update or revise any forward-looking statements, whether as a result of new information, future events, or otherwise. For more discussion relating to risks and uncertainties that could cause actual results to differ materially from those anticipated in our forward-looking statements, and risks to our business in general, please refer to our SEC filings, including our most recent annual report on Form 10-K and any subsequent quarterly reports on Form 10-Q.
|
| | |
| ALEXANDRIA REAL ESTATE EQUITIES, INC
ALL RIGHTS RESERVED © 2014 | 4 |
ALEXANDRIA REAL ESTATE EQUITIES, INC.
March 31, 2014
Consolidated Statements of Income
(In thousands, except per share amounts)
(Unaudited)
|
| | | | | | | | | | | | | | | | | | | | |
| | | Three Months Ended |
| | | 3/31/14 | | 12/31/13 | | 9/30/13 | | 6/30/13 | | 3/31/13 |
| Revenues: | | |
| | |
| | |
| | |
| | |
|
| Rental | | $ | 130,570 |
| | $ | 125,693 |
| | $ | 116,052 |
| | $ | 114,493 |
| | $ | 111,526 |
|
| Tenant recoveries | | 41,682 |
| | 39,970 |
| | 38,691 |
| | 35,869 |
| | 35,565 |
|
| Other income | | 3,934 |
| | 3,160 |
| | 3,572 |
| | 3,568 |
| | 2,992 |
|
| Total revenues | | 176,186 |
| | 168,823 |
| | 158,315 |
| | 153,930 |
| | 150,083 |
|
| | | | | | | | | | | |
| Expenses: | | | | | | | | | | |
| Rental operations | | 52,507 |
| | 49,892 |
| | 47,684 |
| | 46,277 |
| | 45,186 |
|
| General and administrative | | 13,224 |
| | 12,751 |
| | 11,666 |
| | 12,455 |
| | 11,648 |
|
| Interest | | 19,123 |
| | 17,783 |
| | 16,171 |
| | 15,978 |
| | 18,020 |
|
| Depreciation and amortization | | 50,421 |
| | 48,084 |
| | 48,866 |
| | 46,344 |
| | 45,829 |
|
| Loss on early extinguishment of debt | | — |
| | — |
| | 1,432 |
| | 560 |
| | — |
|
| Total expenses | | 135,275 |
| | 128,510 |
| | 125,819 |
| | 121,614 |
| | 120,683 |
|
| | | | | | | | | | | |
| Income from continuing operations | | 40,911 |
| | 40,313 |
| | 32,496 |
| | 32,316 |
| | 29,400 |
|
| | | | | | | | | | | |
| (Loss) income from discontinued operations | | (162 | ) | | (143 | ) | | (43 | ) | | 249 |
| | 837 |
|
| | | | | | | | | | | |
| Gain on sale of land parcel | | — |
| | 4,052 |
| | — |
| | 772 |
| | — |
|
| Net income | | 40,749 |
| | 44,222 |
| | 32,453 |
| | 33,337 |
| | 30,237 |
|
| Net income attributable to noncontrolling interests | | 1,195 |
| | 1,110 |
| | 960 |
| | 980 |
| | 982 |
|
| Dividends on preferred stock | | 6,471 |
| | 6,471 |
| | 6,472 |
| | 6,471 |
| | 6,471 |
|
| Net income attributable to unvested restricted stock awards | | 374 |
| | 394 |
| | 442 |
| | 403 |
| | 342 |
|
| Net income attributable to Alexandria Real Estate Equities, Inc.’s common stockholders | | $ | 32,709 |
| | $ | 36,247 |
| | $ | 24,579 |
| | $ | 25,483 |
| | $ | 22,442 |
|
| | | | | | | | | | | |
| Earnings per share attributable to Alexandria’s common stockholders – basic and diluted: | | | | | | | | | | |
| Continuing operations | | $ | 0.46 |
| | $ | 0.51 |
| | $ | 0.35 |
| | $ | 0.38 |
| | $ | 0.35 |
|
| Discontinued operations | | — |
| | — |
| | — |
| | — |
| | 0.01 |
|
| Earnings per share – basic and diluted | | $ | 0.46 |
| | $ | 0.51 |
| | $ | 0.35 |
| | $ | 0.38 |
| | $ | 0.36 |
|
| | | | | | | | | | | |
| Weighted average shares of common stock outstanding for calculating earnings per share attributable to Alexandria’s common stockholders: | | | | | | | | | | |
| – Basic | | 71,073 |
| | 71,000 |
| | 70,900 |
| | 66,973 |
| | 63,161 |
|
| – Diluted | | 71,073 |
| | 71,000 |
| | 70,900 |
| | 66,973 |
| | 63,161 |
|
|
| | |
| ALEXANDRIA REAL ESTATE EQUITIES, INC
ALL RIGHTS RESERVED © 2014 | 5 |
ALEXANDRIA REAL ESTATE EQUITIES, INC.
March 31, 2014
Consolidated Balance Sheets
(In thousands)
(Unaudited)
|
| | | | | | | | | | | | | | | | | | | | |
| | | 3/31/14 | | 12/31/13 | | 9/30/13 | | 6/30/13 | | 3/31/13 |
| Assets | | | | |
| | |
| | |
| | |
|
| Investments in real estate, net | | $ | 6,930,262 |
| | $ | 6,776,914 |
| | $ | 6,613,761 |
| | $ | 6,453,379 |
| | $ | 6,375,182 |
|
| Cash and cash equivalents | | 74,970 |
| | 57,696 |
| | 53,839 |
| | 302,205 |
| | 87,001 |
|
| Restricted cash | | 30,454 |
| | 27,709 |
| | 30,654 |
| | 30,914 |
| | 30,008 |
|
| Tenant receivables | | 10,619 |
| | 9,918 |
| | 8,671 |
| | 7,577 |
| | 9,261 |
|
| Deferred rent | | 202,087 |
| | 190,425 |
| | 182,909 |
| | 177,507 |
| | 170,100 |
|
| Deferred leasing and financing costs, net | | 192,618 |
| | 192,658 |
| | 179,805 |
| | 164,362 |
| | 159,872 |
|
| Investments | | 169,322 |
| (1) | 140,288 |
| | 129,163 |
| | 122,605 |
| | 123,543 |
|
| Other assets | | 145,707 |
| | 134,156 |
| | 159,567 |
| | 120,740 |
| | 135,952 |
|
| Total assets | | $ | 7,756,039 |
| | $ | 7,529,764 |
| | $ | 7,358,369 |
| | $ | 7,379,289 |
| | $ | 7,090,919 |
|
| | | | | | | | | | | |
| Liabilities, Noncontrolling Interests, and Equity | | | | | | | | | | |
| Secured notes payable | | $ | 597,511 |
| | $ | 708,831 |
| | $ | 708,653 |
| | $ | 711,029 |
| | $ | 730,714 |
|
| Unsecured senior notes payable | | 1,048,270 |
| | 1,048,230 |
| | 1,048,190 |
| | 1,048,395 |
| | 549,816 |
|
| Unsecured senior line of credit | | 506,000 |
| | 204,000 |
| | 14,000 |
| | — |
| | 554,000 |
|
| Unsecured senior bank term loans | | 1,100,000 |
| | 1,100,000 |
| | 1,100,000 |
| | 1,200,000 |
| | 1,350,000 |
|
| Accounts payable, accrued expenses, and tenant security deposits | | 443,893 |
| | 435,342 |
| | 452,139 |
| | 368,249 |
| | 367,153 |
|
| Dividends payable | | 55,860 |
| | 54,420 |
| | 54,413 |
| | 52,141 |
| | 43,955 |
|
| Total liabilities | | 3,751,534 |
| | 3,550,823 |
| | 3,377,395 |
| | 3,379,814 |
| | 3,595,638 |
|
| | | | | | | | | | | |
| Commitments and contingencies | | | | | | | | | | |
| | | | | | | | | | | |
| Redeemable noncontrolling interests | | 14,413 |
| | 14,444 |
| | 14,475 |
| | 14,505 |
| | 14,534 |
|
| | | | | | | | | | | |
| Alexandria Real Estate Equities, Inc.’s stockholders’ equity: | | | | | | | | | | |
| Series D cumulative convertible preferred stock | | 250,000 |
| | 250,000 |
| | 250,000 |
| | 250,000 |
| | 250,000 |
|
| Series E cumulative redeemable preferred stock | | 130,000 |
| | 130,000 |
| | 130,000 |
| | 130,000 |
| | 130,000 |
|
| Common stock | | 712 |
| | 712 |
| | 711 |
| | 710 |
| | 633 |
|
| Additional paid-in capital | | 3,560,453 |
| | 3,572,281 |
| | 3,578,343 |
| | 3,596,477 |
| | 3,075,860 |
|
| Accumulated other comprehensive loss | | (18,429 | ) | | (36,204 | ) | | (40,026 | ) | | (39,565 | ) | | (22,890 | ) |
| Alexandria’s stockholders’ equity | | 3,922,736 |
| | 3,916,789 |
| | 3,919,028 |
| | 3,937,622 |
| | 3,433,603 |
|
| Noncontrolling interests | | 67,356 |
| (2) | 47,708 |
| | 47,471 |
| | 47,348 |
| | 47,144 |
|
| Total equity | | 3,990,092 |
| | 3,964,497 |
| | 3,966,499 |
| | 3,984,970 |
| | 3,480,747 |
|
| Total liabilities, noncontrolling interests, and equity | | $ | 7,756,039 |
| | $ | 7,529,764 |
| | $ | 7,358,369 |
| | $ | 7,379,289 |
| | $ | 7,090,919 |
|
| |
| (1) | Increase in our investments in 1Q14 was primarily related to an increase in unrealized gains of approximately $18.8 million related to our investments in publicly traded life science companies. These unrealized gains are a component of our comprehensive income, within our stockholders’ equity, and have not been recognized in the income statement for 1Q14. |
| |
| (2) | Increase in our noncontrolling interests in 1Q14 due to a contribution from our 10% joint venture partner at Alexandria Technology Square® received in connection with the repayment of a $208.7 million secured note during the period. |
|
| | |
| ALEXANDRIA REAL ESTATE EQUITIES, INC
ALL RIGHTS RESERVED © 2014 | 6 |
ALEXANDRIA REAL ESTATE EQUITIES, INC.
March 31, 2014
Funds From Operations and Adjusted Funds From Operations
(In thousands)
(Unaudited)
The following table presents a reconciliation of net income attributable to Alexandria’s common stockholders – basic, the most directly comparable financial measure presented in accordance with GAAP, to FFO attributable to Alexandria’s common stockholders – basic and diluted, FFO attributable to Alexandria’s common stockholders – diluted, as adjusted, and AFFO attributable to Alexandria’s common stockholders – diluted.
|
| | | | | | | | | | | | | | | | | | | | |
| | | Three Months Ended |
| | | 3/31/14 | | 12/31/13 | | 9/30/13 | | 6/30/13 | | 3/31/13 |
| Net income attributable to Alexandria’s common stockholders | | $ | 32,709 |
| | $ | 36,247 |
| | $ | 24,579 |
| | $ | 25,483 |
| | $ | 22,442 |
|
| Depreciation and amortization | | 50,421 |
| | 48,101 |
| | 49,102 |
| | 46,580 |
| | 46,995 |
|
| (Gain) loss on sale of real estate | | — |
| | — |
| | — |
| | (219 | ) | | 340 |
|
| Gain on sale of land parcel | | — |
| | (4,052 | ) | | — |
| | (772 | ) | | — |
|
| Amount attributable to noncontrolling interests/unvested restricted stock awards: | | | | |
| | |
| | |
| | |
|
| Net income | | 1,569 |
| | 1,504 |
| | 1,402 |
| | 1,383 |
| | 1,324 |
|
| FFO | | (1,629 | ) | | (1,582 | ) | | (1,494 | ) | | (1,437 | ) | | (1,064 | ) |
| FFO attributable to Alexandria’s common stockholders – basic | | 83,070 |
| | 80,218 |
| | 73,589 |
| | 71,018 |
| | 70,037 |
|
| Assumed conversion of unsecured senior convertible notes | | — |
| | — |
| | 5 |
| | 5 |
| | 5 |
|
| FFO attributable to Alexandria’s common stockholders – diluted | | 83,070 |
| | 80,218 |
| | 73,594 |
| | 71,023 |
| | 70,042 |
|
| Impairment of investments | | — |
| | 853 |
| | — |
| | — |
| | — |
|
| Acquisition-related expenses | | — |
| | 1,446 |
| | — |
| | — |
| | — |
|
| Loss on early extinguishment of debt | | — |
| | — |
| | 1,432 |
| | 560 |
| | — |
|
| Allocation to unvested restricted stock awards | | — |
| | (12 | ) | | (11 | ) | | (12 | ) | | — |
|
| FFO attributable to Alexandria’s common stockholders – diluted, as adjusted | | 83,070 |
| | 82,505 |
| | 75,015 |
| | 71,571 |
| | 70,042 |
|
| Non-revenue-enhancing capital expenditures: | | |
| | |
| | |
| | |
| | |
|
| Building improvements | | (1,780 | ) | | (1,047 | ) | | (1,481 | ) | | (337 | ) | | (596 | ) |
| Tenant improvements and leasing commissions | | (4,053 | ) | | (8,291 | ) | | (3,739 | ) | | (2,990 | ) | | (882 | ) |
| Straight-line rent revenue | | (11,882 | ) | | (7,928 | ) | | (5,570 | ) | | (8,239 | ) | | (6,198 | ) |
| Straight-line rent expense on ground leases | | 711 |
| | 445 |
| | 374 |
| | 539 |
| | 538 |
|
| Capitalized income from development projects | | — |
| | 72 |
| | 40 |
| | 9 |
| | 22 |
|
| Amortization of acquired above and below market leases | | (816 | ) | | (826 | ) | | (830 | ) | | (830 | ) | | (830 | ) |
| Amortization of loan fees | | 2,561 |
| | 2,636 |
| | 2,487 |
| | 2,427 |
| | 2,386 |
|
| Amortization of debt premiums/discounts | | 205 |
| | 146 |
| | 153 |
| | 115 |
| | 115 |
|
| Stock compensation | | 3,228 |
| | 4,011 |
| | 3,729 |
| | 4,463 |
| | 3,349 |
|
| Allocation to unvested restricted stock awards | | 94 |
| | 94 |
| | 28 |
| | 50 |
| | 19 |
|
| AFFO attributable to Alexandria’s common stockholders – diluted | | $ | 71,338 |
| | $ | 71,817 |
| | $ | 70,206 |
| | $ | 66,778 |
| | $ | 67,965 |
|
|
| | |
| ALEXANDRIA REAL ESTATE EQUITIES, INC
ALL RIGHTS RESERVED © 2014 | 7 |
ALEXANDRIA REAL ESTATE EQUITIES, INC.
March 31, 2014
Funds From Operations Per Share and Adjusted Funds From Operations Per Share
(Unaudited)
The following table presents a reconciliation of net income per share attributable to Alexandria’s common stockholders – basic, the most directly comparable financial measure presented in accordance with GAAP, to FFO per share attributable to Alexandria’s common stockholders – diluted, FFO per share attributable to Alexandria’s common stockholders – diluted, as adjusted, and AFFO per share attributable to Alexandria’s common stockholders – diluted. For the computation of the weighted average shares used to compute the per share information, refer to the “Definitions and Other Information” section in our supplemental information.
|
| | | | | | | | | | | | | | | | | | | | |
| | | Three Months Ended |
| | | 3/31/14 | | 12/31/13 | | 9/30/13 | | 6/30/13 | | 3/31/13 |
| Net income per share attributable to Alexandria’s common stockholders – basic and diluted | | $ | 0.46 |
| | $ | 0.51 |
| | $ | 0.35 |
| | $ | 0.38 |
| | $ | 0.36 |
|
| Depreciation and amortization | | 0.71 |
| | 0.68 |
| | 0.69 |
| | 0.69 |
| | 0.74 |
|
| Loss on sale of real estate | | — |
| | — |
| | — |
| | — |
| | 0.01 |
|
| Gain on sale of land parcel | | — |
| | (0.06 | ) | | — |
| | (0.01 | ) | | — |
|
| FFO per share attributable to Alexandria’s common stockholders – basic and diluted | | 1.17 |
| | 1.13 |
| | 1.04 |
| | 1.06 |
| | 1.11 |
|
| Impairment of investments | | — |
| | 0.01 |
| | — |
| | — |
| | — |
|
| Acquisition-related expenses | | — |
| | 0.02 |
| | — |
| | — |
| | — |
|
| Loss on early extinguishment of debt | | — |
| | — |
| | 0.02 |
| | 0.01 |
| | — |
|
| FFO per share attributable to Alexandria’s common stockholders – diluted, as adjusted | | 1.17 |
| | 1.16 |
| | 1.06 |
| | 1.07 |
| | 1.11 |
|
| Non-revenue-enhancing capital expenditures: | | | | | | | | | | |
| Building improvements | | (0.03 | ) | | (0.01 | ) | | (0.02 | ) | | (0.01 | ) | | (0.01 | ) |
| Tenant improvements and leasing commissions | | (0.06 | ) | | (0.12 | ) | | (0.05 | ) | | (0.04 | ) | | (0.01 | ) |
| Straight-line rent revenue | | (0.17 | ) | | (0.11 | ) | | (0.08 | ) | | (0.12 | ) | | (0.10 | ) |
| Straight-line rent expense on ground leases | | 0.01 |
| | 0.01 |
| | 0.01 |
| | 0.01 |
| | 0.01 |
|
| Amortization of acquired above and below market leases | | (0.01 | ) | | (0.01 | ) | | (0.01 | ) | | (0.01 | ) | | (0.01 | ) |
| Amortization of loan fees | | 0.04 |
| | 0.03 |
| | 0.03 |
| | 0.03 |
| | 0.04 |
|
| Stock compensation | | 0.05 |
| | 0.06 |
| | 0.05 |
| | 0.07 |
| | 0.05 |
|
| AFFO per share attributable to Alexandria’s common stockholders – diluted | | $ | 1.00 |
| | $ | 1.01 |
| | $ | 0.99 |
| | $ | 1.00 |
| | $ | 1.08 |
|
|
| | |
| ALEXANDRIA REAL ESTATE EQUITIES, INC
ALL RIGHTS RESERVED © 2014 | 8 |
SUPPLEMENTAL
INFORMATION
ALEXANDRIA REAL ESTATE EQUITIES, INC.
March 31, 2014
Company Profile
Alexandria Real Estate Equities, Inc. (NYSE:ARE), with a total market capitalization of approximately $9 billion as of March 31, 2014, and an asset base of 31.2 million RSF, including 17.7 million RSF of operating and current value-creation projects, as well as an additional 13.5 million RSF in future ground-up development projects, is the largest and leading REIT uniquely focused on Class A collaborative science and technology campuses in urban innovation clusters. Alexandria pioneered this niche in 1994 and has since established a dominant market presence in AAA locations including Greater Boston, the San Francisco Bay Area, New York City, Seattle, San Diego, Maryland, and Research Triangle Park. Alexandria is known for its high-quality and diverse client tenant base. As the Landlord of Choice to the Life Science Industry®, approximately 52% of Alexandria’s total ABR results from investment-grade client tenants (an industry-leading percentage). Alexandria has a longstanding and proven track record of developing Class A assets clustered in urban collaborative science and technology campuses that provide its client tenants with a highly collaborative, 24/7, live/work/play environment, as well as the critical ability to successfully recruit and retain best-in-class talent. We believe these advantages result in higher occupancy levels, longer lease terms, higher rental income, higher returns, and greater long-term asset value. For additional information on Alexandria, please visit www.are.com.
Unique niche strategy
Alexandria’s primary business objective is to maximize stockholder value by providing its stockholders with the greatest possible total return and long-term asset value
based on a multifaceted platform of internal and external growth. The key elements of our strategy include:
| |
| • | A consistent focus on Class A collaborative science and technology campuses in urban innovation clusters adjacent to or in close proximity to leading science and technology institutions that drive innovation and growth within each cluster; |
| |
| • | Utilizing our deep real estate relationships and world-class platform and network in order to develop, acquire, and lease real estate focused on science and technology tenants; |
| |
| • | Drawing upon our broad and meaningful science relationships to attract new and leading client tenants; and |
| |
| • | Solid and flexible capital structure to enable stable growth. |
Client tenant base
The impressive quality, diversity, breadth, and depth of our significant relationships with our client tenants provide Alexandria with solid and stable cash flows. Alexandria’s strong underwriting skills and long-term industry relationships positively distinguish Alexandria from all other publicly traded REITs and real estate companies. As of March 31, 2014, our client tenant base included the following:
| |
| • | Investment-grade client tenants represent 52% of total ABR |
| |
| • | Investment-grade client tenants represent 81% of our top 20 client tenants by ABR |
| |
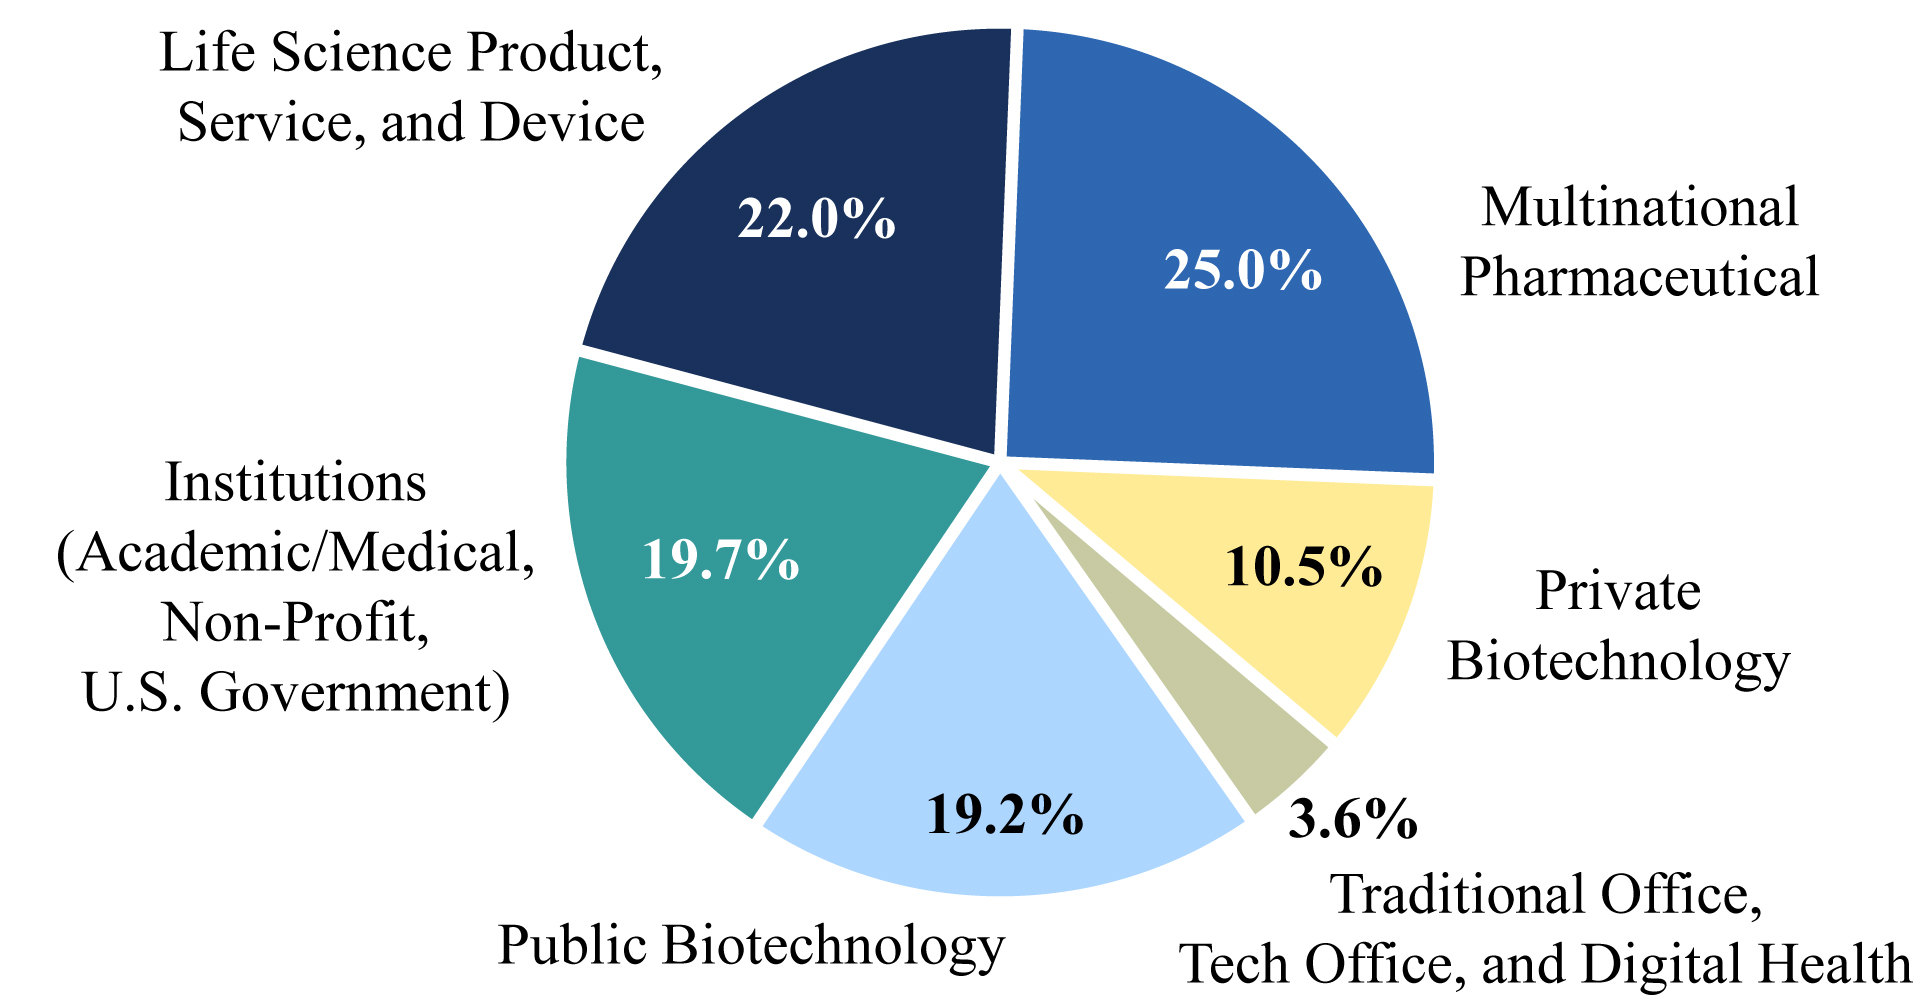
| • | Our ABR consisted of the following client tenant mix: |
| |
| • | 25.0% from multinational pharmaceutical companies |
| |
| • | 22.0% from life science product, service, and device companies |
| |
| • | 19.7% from institutions (academic/medical, non-profit, U.S. government) |
| |
| • | 19.2% from public biotechnology companies |
| |
| • | 10.5% from private biotechnology companies |
| |
| • | 3.6% from traditional office, tech office, and digital health companies |
Executive/senior management
In the REIT industry, Alexandria’s executive and senior management team has unique experience and expertise in creating urban collaborative science and technology campuses in urban innovation clusters. From the development of high-quality, sustainable real estate; to the ongoing cultivation of collaborative ecosystems with unique amenities and events, the Alexandria team has a first-in-class reputation of excellence in its niche. Alexandria’s senior management team averages over 23 years of experience, including over 11 years with Alexandria. Our sophisticated management team also includes regional market directors with leading reputations and longstanding relationships within the science and technology communities in their respective urban clusters of innovation. We believe that our unparalleled expertise, experience, reputation, and key relationships with the science and technology industries provide Alexandria significant competitive advantages in attracting new business opportunities.
|
| | |
| Joel S. Marcus | | Chairman, Chief Executive Officer & Founder |
| Dean A. Shigenaga | | Chief Financial Officer, EVP & Treasurer |
| Peter M. Moglia | | Chief Investment Officer |
| Stephen A. Richardson | | Chief Operating Officer & Regional Market Director – San Francisco Bay Area |
| Jennifer J. Banks | | General Counsel, EVP & Corporate Secretary |
| Thomas J. Andrews | | EVP – Regional Market Director – Greater Boston |
| Daniel J. Ryan | | EVP – Regional Market Director – San Diego & Strategic Operations |
| Marc E. Binda | | SVP – Finance |
| Andres R. Gavinet | | Chief Accounting Officer |
| John J. Cox | | SVP – Regional Market Director – Seattle |
| John H. Cunningham | | SVP – Regional Market Director – New York City & Strategic Operations |
| Larry J. Diamond | | SVP – Regional Market Director – Maryland |
| Vincent R. Ciruzzi | | SVP – Construction & Development |
| Amanda L. Cashin, PhD | | SVP – Life Science |
| Timothy M. White | | SVP – Asset Services |
|
| | |
| ALEXANDRIA REAL ESTATE EQUITIES, INC
ALL RIGHTS RESERVED © 2014 | 10 |
ALEXANDRIA REAL ESTATE EQUITIES, INC.
March 31, 2014
Investor Information
|
| | | | | |
| Corporate Headquarters | | Trading Symbols | | Information Requests |
| 385 East Colorado Boulevard, Suite 299 | | New York Stock Exchange | | Phone: | (626) 396-4828 |
| Pasadena, California 91101 | | Common stock: ARE | | E-mail: | corporateinformation@are.com |
| | | Series E preferred stock: ARE–E | | Web: | www.are.com |
|
| | | | | | | | | | | | | | | | | | | |
| Common stock data (at the end of the quarter unless otherwise noted) | 1Q14 | | 4Q13 | | 3Q13 | | 2Q13 | | 1Q13 |
| Closing stock price | $ | 72.56 |
| | $ | 63.62 |
| | $ | 63.85 |
| | $ | 65.72 |
| | $ | 70.98 |
|
| Dividend per share – quarter/annualized | $ | 0.70/2.80 |
| | $ | 0.68/2.72 |
| | $ | 0.68/2.72 |
| | $ | 0.65/2.60 |
| | $ | 0.60/2.40 |
|
| Dividend payout ratio for the quarter | | 60% |
| | | 59% |
| | | 65% |
| | | 65% |
| | | 55% |
|
| Dividend yield – annualized | | 3.9% |
| | | 4.3% |
| | | 4.3% |
| | | 4.0% |
| | | 3.4% |
|
| Common shares outstanding (in thousands) | | 71,246 |
| | | 71,172 |
| | | 71,081 |
| | | 70,997 |
| | | 63,317 |
|
| Market value of outstanding common shares (in thousands) | $ | 5,169,623 |
| | $ | 4,527,975 |
| | $ | 4,538,517 |
| | $ | 4,665,948 |
| | $ | 4,494,262 |
|
| Total market capitalization (in thousands) | $ | 8,799,376 |
| | $ | 7,949,276 |
| | $ | 7,780,208 |
| | $ | 8,005,581 |
| | $ | 8,066,072 |
|
|
|
| Alexandria is currently covered by the following research analysts. This list may not be complete and is subject to change as firms initiate or discontinue coverage of our company. Please note that any opinions, estimates, or forecasts regarding our historical or predicted performance made by these analysts are theirs alone and do not represent opinions, estimates, or forecasts of Alexandria or its management. Alexandria does not by its reference or distribution of the information below imply its endorsement of or concurrence with any opinions, estimates, or forecasts of these analysts. Interested persons may obtain copies of analysts’ reports on their own as we do not distribute these reports. Several of these firms may from time-to-time own our stock and/or hold other long or short positions in our stock, and may provide compensated services to us. |
|
| | | | | | | | | | |
| Bank of America Merrill Lynch | | Evercore Partners | | | | RBC Capital Markets | | |
| Jamie Feldman | | (646) 855-5808 | | Sheila McGrath | | (212) 497-0882 | | Michael Carroll | | (440) 715-2649 |
| Jeffrey Spector | | (646) 855-1363 | | Nathan Crossett | | (212) 497-0870 | | Rich Moore | | (440) 715-2646 |
| Stephen Sihelnik | | (646) 855-1829 | | | | | | | | |
| | | | | | | | | |
| Barclays Capital Inc. | | Green Street Advisors, Inc. | | Robert W. Baird & Company |
| Ross Smotrich | | (212) 526-2306 | | Jeff Theiler | | (949) 640-8780 | | David Rodgers | | (216) 737-7341 |
| Michael Lewis | | (212) 526-3098 | | Kevin Tyler | | (949) 640-8780 | | Mathew Spencer | | (414) 298-5053 |
| | | | | | | | | | | |
| Citigroup Global Markets Inc. | | International Strategy & Investment Group Inc. | | Standard & Poor’s | | |
| Michael Bilerman | | (212) 816-1383 | | George Auerbach | | (212) 446-9459 | | Roy Shepard | | (212) 438-1947 |
| Emmanuel Korchman | | (212) 816-1382 | | Steve Sakwa | | (212) 446-9462 | | | | |
| Archena Alagappan | | (212) 816-6872 | | Gwen Clark | | (212) 446-5611 | | | | |
| | | | | | | | | | | |
| Cowen and Company, LLC | | JMP Securities – JMP Group, Inc. | | UBS Financial Services Inc. |
| James Sullivan | | (646) 562-1380 | | Peter Martin | | (415) 835-8904 | | Ross Nussbaum | | (212) 713-2484 |
| Tom Catherwood | | (646) 562-1382 | | Aaron Hecht | | (415) 835-3963 | | Gabriel Hilmoe | | (212) 713-3876 |
| | | | | Arthur Kwok | | (415) 835-8908 | | Frank Lee | | (212) 713-2384 |
| | | | | | | | | |
| | | | | J.P. Morgan Securities LLC | | | | |
| | | | | Anthony Paolone | | (212) 622-6682 | | | | |
|
| | | | | | | | | | | |
| Moody’s Investors Service | | Rating | | Standard & Poor’s | | Rating | |
| Philip Kibel | | (212) 553-4569 | | Baa2 | | George Skoufis | | (212) 438-2608 | | BBB- | |
| Merrie Frankel | | (212) 553-3652 | | Stable Outlook | | Jaime Gitler | | (212) 438-5049 | | Stable Outlook | |
|
| | |
| ALEXANDRIA REAL ESTATE EQUITIES, INC
ALL RIGHTS RESERVED © 2014 | 11 |
ALEXANDRIA REAL ESTATE EQUITIES, INC.
March 31, 2014
Financial and Asset Base Highlights
(Dollars in thousands, except per share amounts)
(Unaudited)
|
| | | | | | | | | | | | | | | | | | | | |
| | | Three Months Ended (unless stated otherwise) |
| | | 3/31/14 | | 12/31/13 | | 9/30/13 | | 6/30/13 | | 3/31/13 |
| Operating data | | | | | | | | | | |
| Total revenues | | $ | 176,186 |
| | $ | 168,823 |
| | $ | 158,315 |
| | $ | 153,930 |
| | $ | 150,083 |
|
| Operating margins | | 70% |
| | 70% |
| | 70% |
| | 70% |
| | 70% |
|
| Adjusted EBITDA – quarter annualized | | $ | 454,084 |
| | $ | 449,456 |
| | $ | 411,548 |
| | $ | 399,708 |
| | $ | 395,764 |
|
| Adjusted EBITDA – trailing 12 months | | $ | 428,699 |
| | $ | 414,119 |
| | $ | 403,974 |
| | $ | 396,739 |
| | $ | 397,606 |
|
| Adjusted EBITDA margins – quarter annualized | | 65% |
| | 67% |
| | 65% |
| | 65% |
| | 64% |
|
| General and administrative expense as a percentage of total assets – quarter annualized | | 0.7% |
| | 0.7% |
| | 0.6% |
| | 0.7% |
| | 0.7% |
|
| General and administrative expense as a percentage of total revenues – quarter annualized | | 7.5% |
| | 7.6% |
| | 7.4% |
| | 8.1% |
| | 7.8% |
|
| Capitalized interest | | $ | 12,013 |
| | $ | 14,116 |
| | $ | 16,788 |
| | $ | 15,690 |
| | $ | 14,021 |
|
| Weighted average interest rate used for capitalization during period | | 3.88% |
| | 4.09% |
| | 4.33% |
| | 4.13% |
| | 3.97% |
|
| | | | | | | | | | | |
| Net income, FFO, and AFFO | | | | | | | | | | |
| Net income attributable to Alexandria’s common stockholders | | $ | 32,709 |
| | $ | 36,247 |
| | $ | 24,579 |
| | $ | 25,483 |
| | $ | 22,442 |
|
| FFO attributable to Alexandria’s common stockholders – diluted | | $ | 83,070 |
| | $ | 80,218 |
| | $ | 73,594 |
| | $ | 71,023 |
| | $ | 70,042 |
|
| FFO attributable to Alexandria’s common stockholders – diluted, as adjusted | | $ | 83,070 |
| | $ | 82,505 |
| | $ | 75,015 |
| | $ | 71,571 |
| | $ | 70,042 |
|
| AFFO attributable to Alexandria’s common stockholders – diluted | | $ | 71,338 |
| | $ | 71,817 |
| | $ | 70,206 |
| | $ | 66,778 |
| | $ | 67,965 |
|
| | | | | | | | | | | |
| Per share data | | | | | | | | | | |
| Earnings per share attributable to Alexandria’s common stockholders – basic and diluted | | $ | 0.46 |
| | $ | 0.51 |
| | $ | 0.35 |
| | $ | 0.38 |
| | $ | 0.36 |
|
| FFO per share attributable to Alexandria’s common stockholders – diluted | | $ | 1.17 |
| | $ | 1.13 |
| | $ | 1.04 |
| | $ | 1.06 |
| | $ | 1.11 |
|
| FFO per share attributable to Alexandria’s common stockholders – diluted, as adjusted | | $ | 1.17 |
| | $ | 1.16 |
| | $ | 1.06 |
| | $ | 1.07 |
| | $ | 1.11 |
|
| AFFO per share attributable to Alexandria’s common stockholders – diluted | | $ | 1.00 |
| | $ | 1.01 |
| | $ | 0.99 |
| | $ | 1.00 |
| | $ | 1.08 |
|
| | | | | | | | | | | |
| Leasing activity and same property performance | | | | | | | | | | |
| Leasing activity – rentable square feet | | 563,394 |
| | 1,344,687 |
| | 829,533 |
| | 767,935 |
| | 702,901 |
|
| Leasing activity – change in average new rental rates over expiring rates: | | | | | | | | | | |
| – Rental rate increases | | 18.2% |
| | 18.2% |
| | 16.5% |
| | 12.7% |
| | 12.7% |
|
| – Rental rate increases (cash) | | 10.4% |
| | 2.6% |
| | 4.1% |
| | 6.7% |
| | 5.9% |
|
| Same property – performance over comparable quarter from prior year: | | | | | | | | | | |
| – Same property NOI | | 3.8% |
| | 1.4% |
| | 1.9% |
| | 3.2% |
| | 0.4% |
|
| – Same property NOI (cash basis) | | 4.3% |
| | 4.6% |
| | 4.7% |
| | 7.2% |
| | 8.8% |
|
| | | | | | | | | | | |
|
| | |
| ALEXANDRIA REAL ESTATE EQUITIES, INC
ALL RIGHTS RESERVED © 2014 | 12 |
ALEXANDRIA REAL ESTATE EQUITIES, INC.
March 31, 2014
Financial and Asset Base Highlights (continued)
(Dollars in thousands)
(Unaudited)
|
| | | | | | | | | | | | | | | | | | | | |
| | | Three Months Ended (unless stated otherwise) |
| | | 3/31/14 | | 12/31/13 | | 9/30/13 | | 6/30/13 | | 3/31/13 |
| Asset base statistics – at end of period | | | | | | | | | | |
| Number of properties | | 185 |
| | 180 |
| | 176 |
| | 173 |
| | 174 |
|
| Rentable square feet (operating and current value-creation projects) | | 17,715,931 |
| | 17,461,030 |
| | 17,260,189 |
| | 17,062,338 |
| | 17,102,509 |
|
| Total square footage (including near-term and future developable square feet) | | 31,239,652 |
| | 30,934,751 |
| | 30,883,069 |
| | 30,906,798 |
| | 31,075,964 |
|
| ABR per leased RSF | | 36.18 |
| | 35.90 |
| | 35.20 |
| | 34.98 |
| | 34.92 |
|
| Occupancy of operating properties – North America | | 96.6% |
| | 95.9% |
| | 95.0% |
| | 94.6% |
| | 94.2% |
|
| Occupancy of operating and redevelopment properties – North America | | 95.1% |
| | 95.5% |
| | 94.5% |
| | 92.9% |
| | 91.8% |
|
| Occupancy of operating properties | | 94.9% |
| | 94.4% |
| | 93.5% |
| | 93.3% |
| | 93.0% |
|
| Occupancy of operating and redevelopment properties | | 93.5% |
| | 93.8% |
| | 92.8% |
| | 91.2% |
| | 90.1% |
|
| | | | | | | | | | | |
Selected balance sheet information – at end of period | | | | | | | | | | |
| Gross investments in real estate | | $ | 7,923,080 |
| | $ | 7,729,020 |
| | $ | 7,529,255 |
| | $ | 7,331,578 |
| | $ | 7,225,073 |
|
| Total assets | | $ | 7,756,039 |
| | $ | 7,529,764 |
| | $ | 7,358,369 |
| | $ | 7,379,289 |
| | $ | 7,090,919 |
|
| Gross assets | | $ | 8,643,433 |
| | $ | 8,396,465 |
| | $ | 8,189,370 |
| | $ | 7,924,369 |
| | $ | 7,823,801 |
|
| Total unsecured debt | | $ | 2,654,270 |
| | $ | 2,352,230 |
| | $ | 2,162,190 |
| | $ | 2,248,395 |
| | $ | 2,453,816 |
|
| Total debt | | $ | 3,251,781 |
| | $ | 3,061,061 |
| | $ | 2,870,843 |
| | $ | 2,959,424 |
| | $ | 3,184,530 |
|
| Net debt | | $ | 3,146,357 |
| | $ | 2,975,656 |
| | $ | 2,786,350 |
| | $ | 2,626,305 |
| | $ | 3,067,521 |
|
| Total liabilities | | $ | 3,751,534 |
| | $ | 3,550,823 |
| | $ | 3,377,395 |
| | $ | 3,379,814 |
| | $ | 3,595,638 |
|
| Common shares outstanding (in thousands) | | 71,246 |
| | 71,172 |
| | 71,081 |
| | 70,997 |
| | 63,317 |
|
| Total market capitalization | | $ | 8,799,376 |
| | $ | 7,949,276 |
| | $ | 7,780,208 |
| | $ | 8,005,581 |
| | $ | 8,066,072 |
|
| | | | | | | | | | | |
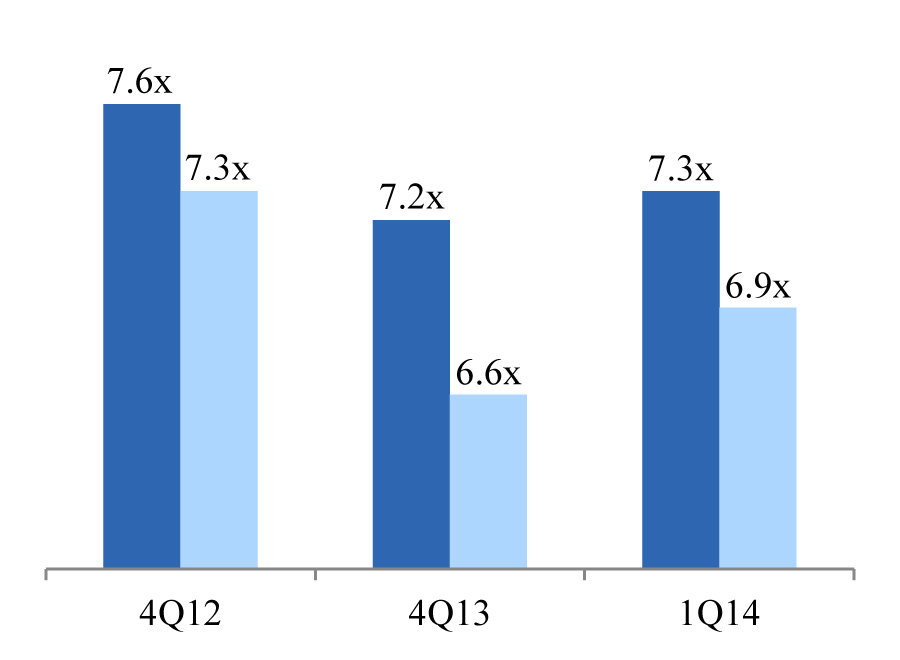
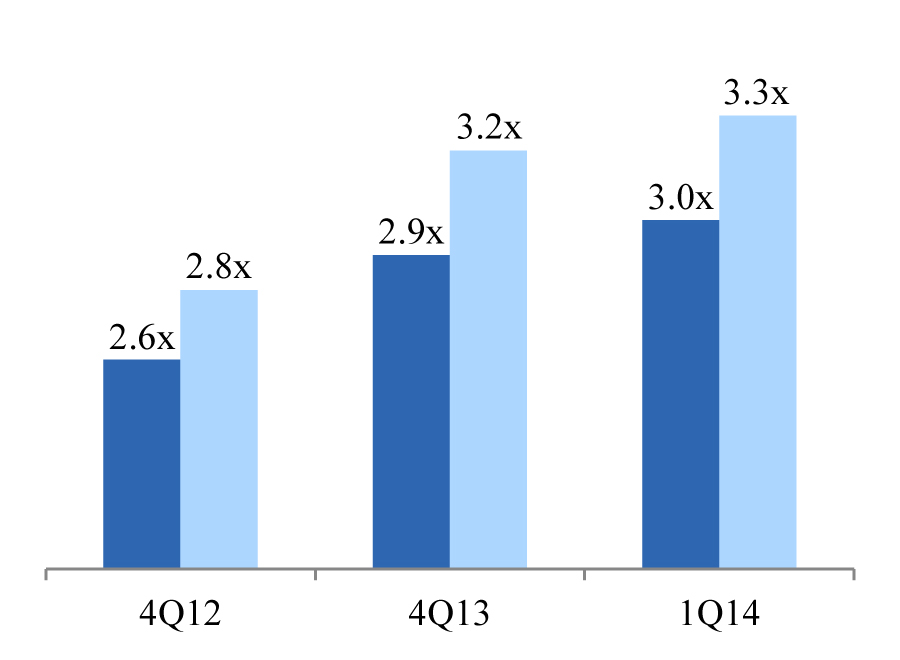
| Key credit metrics | | | | | | | | | | |
| Unencumbered NOI as a percentage of total NOI | | 83% |
| (1) | 69% |
| | 69% |
| | 70% |
| | 68% |
|
| Net debt to Adjusted EBITDA – quarter annualized | | 6.9x |
| | 6.6x |
| | 6.8x |
| | 6.6x |
| | 7.8x |
|
| Net debt to Adjusted EBITDA – trailing 12 months | | 7.3x |
| | 7.2x |
| | 6.9x |
| | 6.6x |
| | 7.7x |
|
| Fixed charge coverage ratio – quarter annualized | | 3.3x |
| | 3.2x |
| | 2.8x |
| | 2.8x |
| | 2.7x |
|
| Fixed charge coverage ratio – trailing 12 months | | 3.0x |
| | 2.9x |
| | 2.8x |
| | 2.7x |
| | 2.7x |
|
| Dividend payout ratio (common stock) | | 60% |
| | 59% |
| | 65% |
| | 65% |
| | 55% |
|
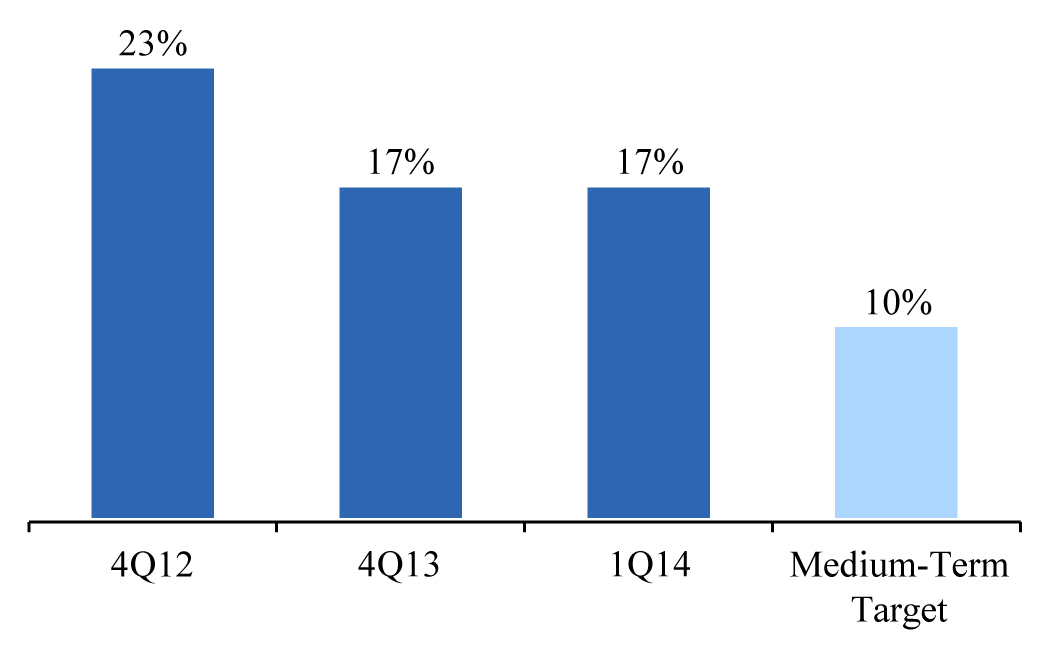
| Non-income-producing assets as a percentage of gross assets | | 17% |
| | 17% |
| | 20% |
| | 22% |
| | 22% |
|
|
|
(1) Increase in unencumbered NOI as a percentage of total NOI in 1Q14 due to repayment of $208.7 million secured note payable related to Alexandria Technology Square® with an effective interest rate of 5.59%. |
|
| | |
| ALEXANDRIA REAL ESTATE EQUITIES, INC
ALL RIGHTS RESERVED © 2014 | 13 |
ALEXANDRIA REAL ESTATE EQUITIES, INC.
March 31, 2014
Operating Metrics
(Unaudited)
|
| | | | | |
Occupancy of Operating Properties North America | | Same Property NOI Growth | | NOI (In millions) |
| | | | |
| | | | | | |
Drivers of Cash NOI Growth (3) | | Rental Rate Growth: Renewed/Re-leased Space | | Operating Margin |
| | | | | | |
Percentage of leases containing annual rent escalations | 95% | | |
Percentage of triple net leases | 94% | | |
Percentage of leases providing for the recapture of capital expenditures | 92% | | |
| | | | |
| | | | | | |
| |
| (1) | Represents the three months ended March 31, 2014. |
| |
| (2) | Represents the three months ended March 31, 2014, annualized. |
|
| | |
| ALEXANDRIA REAL ESTATE EQUITIES, INC
ALL RIGHTS RESERVED © 2014 | 14 |
ALEXANDRIA REAL ESTATE EQUITIES, INC.
March 31, 2014
Same Property Performance
(Dollars in thousands)
(Unaudited)
|
| | | | | | |
| Same Property Financial Data | | Three Months Ended March 31, 2014 | | Same Property Statistical Data | | Three Months Ended
March 31, 2014 |
| Percentage change over comparable period from prior year: | | | | Number of same properties | | 149 |
| NOI | | 3.8% | | Rentable square feet | | 13,442,861 |
| NOI (cash basis) | | 4.3% | | Occupancy – current period | | 96.5% |
| Operating margin | | 69% | | Occupancy – same period prior year | | 92.7% |
|
| | | | | | | | | | | | | | | |
| | | Three Months Ended March 31, |
| | | 2014 | | 2013 | | $ Change | | % Change |
| Revenues: | | | | | | | | |
| Rental – same properties | | $ | 109,034 |
| | $ | 105,667 |
| | $ | 3,367 |
| | 3.2 | % |
| Rental – non-same properties | | 21,536 |
| | 5,859 |
| | 15,677 |
| | 267.6 |
|
| Total rental | | 130,570 |
| | 111,526 |
| | 19,044 |
| | 17.1 |
|
| | | | | | | | | |
| Tenant recoveries – same properties | | 36,944 |
| | 34,013 |
| | 2,931 |
| | 8.6 |
|
| Tenant recoveries – non-same properties | | 4,738 |
| | 1,552 |
| | 3,186 |
| | 205.3 |
|
| Total tenant recoveries | | 41,682 |
| | 35,565 |
| | 6,117 |
| | 17.2 |
|
| | | | | | | | | |
| Other income – same properties | | 34 |
| | 26 |
| | 8 |
| | 30.8 |
|
| Other income – non-same properties | | 3,900 |
| | 2,966 |
| | 934 |
| | 31.5 |
|
| Total other income | | 3,934 |
| | 2,992 |
| | 942 |
| | 31.5 |
|
| | | | | | | | | |
| Total revenues – same properties | | 146,012 |
| | 139,706 |
| | 6,306 |
| | 4.5 |
|
| Total revenues – non-same properties | | 30,174 |
| | 10,377 |
| | 19,797 |
| | 190.8 |
|
| Total revenues | | 176,186 |
| | 150,083 |
| | 26,103 |
| | 17.4 |
|
| | | | | | | | | |
| Expenses: | | | | | | | | |
| Rental operations – same properties | | 45,673 |
| | 43,054 |
| | 2,619 |
| | 6.1 |
|
| Rental operations – non-same properties | | 6,834 |
| | 2,132 |
| | 4,702 |
| | 220.5 |
|
| Total rental operations | | 52,507 |
| | 45,186 |
| | 7,321 |
| | 16.2 |
|
| | | | | | | | | |
| Net operating income: | | | | | | | | |
| NOI – same properties | | 100,339 |
| | 96,652 |
| | 3,687 |
| | 3.8 |
|
| NOI – non-same properties | | 23,340 |
| | 8,245 |
| | 15,095 |
| | 183.1 |
|
Total NOI (1) | | $ | 123,679 |
| | $ | 104,897 |
| | $ | 18,782 |
| | 17.9 | % |
| | | | | | | | | |
| NOI – same properties | | $ | 100,339 |
| | $ | 96,652 |
| | $ | 3,687 |
| | 3.8 | % |
| Less: straight-line rent adjustments | | (4,951 | ) | | (5,237 | ) | | 286 |
| | (5.5 | ) |
| NOI (cash basis) – same properties | | $ | 95,388 |
| | $ | 91,415 |
| | $ | 3,973 |
| | 4.3 | % |
| |
| (1) | For a reconciliation of total NOI to the most directly comparable GAAP financial measure, see NOI in the Definitions and Other Information section on page 50. |
|
| | |
| ALEXANDRIA REAL ESTATE EQUITIES, INC
ALL RIGHTS RESERVED © 2014 | 15 |
ALEXANDRIA REAL ESTATE EQUITIES, INC.
March 31, 2014
Leasing Activity
(Unaudited)
|
| | | | | | | | | | | | | | | | |
| | | Three Months Ended 3/31/14 | | Year Ended 12/31/13 |
| | | Including Straight-line Rent | | Cash Basis | | Including Straight-line Rent | | Cash Basis |
| Leasing activity: | | | | | | | | |
Renewed/re-leased space (1) | | |
| | |
| | |
| | |
|
| Rental rate changes | | 18.2% |
| | 10.4% |
| | 16.2% |
| | 4.0% |
|
| New rates | | $ | 41.25 |
| | $ | 40.78 |
| | $ | 32.00 |
| | $ | 31.04 |
|
| Expiring rates | | $ | 34.91 |
| | $ | 36.93 |
| | $ | 27.53 |
| | $ | 29.84 |
|
| Rentable square footage | | 448,301 |
| | | | 1,838,397 |
| | |
|
| Number of leases | | 35 |
| | | | 120 |
| | |
|
| TIs/lease commissions per square foot | | $ | 9.04 |
| | | | $ | 8.65 |
| | |
|
| Average lease terms | | 3.7 years |
| | | | 5.2 years |
| | |
|
| | | | | | | | | |
| Developed/redeveloped/previously vacant space leased | | | | | | |
| | |
|
| New rates | | $ | 32.35 |
|
| $ | 31.52 |
| | $ | 44.63 |
| | $ | 41.86 |
|
| Rentable square footage | | 115,093 |
| | | | 1,806,659 |
| | |
|
| Number of leases | | 14 |
| | | | 92 |
| | |
|
| TIs/lease commissions per square foot | | $ | 8.92 |
| | | | $ | 19.16 |
| | |
|
| Average lease terms | | 5.5 years |
| | | | 10.0 years |
| | |
| | | | | | | | | |
| Leasing activity summary (totals): | | | | | | |
| | |
|
| New rates | | $ | 39.43 |
|
| $ | 38.89 |
| | $ | 38.26 |
| | $ | 36.40 |
|
| Rentable square footage | | 563,394 |
| (2) | | | 3,645,056 |
| | |
|
| Number of leases | | 49 |
| | | | 212 |
| | |
|
| TIs/lease commissions per square foot | | $ | 9.02 |
| | | | $ | 13.86 |
| | |
|
| Average lease terms | | 4.0 years |
| | | | 7.6 years |
| | |
|
| | | | | | | | | |
| Lease expirations | | | | | | |
| | |
|
| Expiring rates | | $ | 32.69 |
| | $ | 34.32 |
| | $ | 27.74 |
| | $ | 30.15 |
|
| Rentable square footage | | 560,399 |
| | | | 2,144,447 |
| | |
|
| Number of leases | | 54 |
| | | | 160 |
| | |
|
| |
| (1) | Excludes 11 month-to-month leases for 18,038 RSF at March 31, 2014, and December 31, 2013. |
| |
| (2) | During the three months ended March 31, 2014, we granted tenant concessions/free rent averaging approximately 2.6 months with respect to the 563,394 RSF leased. |
|
| | |
| ALEXANDRIA REAL ESTATE EQUITIES, INC
ALL RIGHTS RESERVED © 2014 | 16 |
ALEXANDRIA REAL ESTATE EQUITIES, INC.
March 31, 2014
Lease Expirations
(Unaudited)
|
| | | | | | | | | | | | | | | | | | | | | |
| Year of Lease Expiration | | Number of Leases Expiring | | RSF of Expiring Leases | | Percentage of Aggregate Total RSF | | ABR of Expiring Leases (per RSF) |
| 2014 | | | 68 |
| (1) | | | 533,586 |
| (1) | | | 3.6 | % | | | | $ | 29.02 |
| |
| 2015 | | | 84 |
| | | | 1,358,913 |
| | | | 9.0 | % | | | | $ | 29.82 |
| |
| 2016 | | | 79 |
| | | | 1,299,289 |
| | | | 8.6 | % | | | | $ | 33.56 |
| |
| 2017 | | | 81 |
| | | | 1,669,290 |
| | | | 11.1 | % | | | | $ | 28.84 |
| |
| 2018 | | | 51 |
| | | | 1,501,871 |
| | | | 10.0 | % | | | | $ | 40.14 |
| |
| 2019 | | | 42 |
| | | | 1,161,558 |
| | | | 7.7 | % | | | | $ | 34.11 |
| |
| 2020 | | | 25 |
| | | | 988,837 |
| | | | 6.6 | % | | | | $ | 37.40 |
| |
| 2021 | | | 29 |
| | | | 1,081,038 |
| | | | 7.2 | % | | | | $ | 39.14 |
| |
| 2022 | | | 17 |
| | | | 633,004 |
| | | | 4.2 | % | | | | $ | 29.38 |
| |
| 2023 | | | 19 |
| | | | 1,031,167 |
| | | | 6.9 | % | | | | $ | 34.94 |
| |
| Thereafter | | | 29 |
| | | | 2,774,603 |
| | | | 18.5 | % | | | | $ | 42.30 |
| |
|
| | | | | | | | | | | | | | | | | | | | | | | | | | | | | | | | | | | | | | | | |
| | | 2014 RSF of Expiring Leases | | ABR of Expiring Leases (per RSF) | | | 2015 RSF of Expiring Leases |
| ABR of
Expiring Leases
(per RSF) |
|
| | | Leased | | Negotiating/ Anticipating | | Targeted for Redevelopment | | Remaining Expiring Leases | | Total (1) | | | | Leased |
| Negotiating/
Anticipating |
| Targeted for
Redevelopment |
| Remaining
Expiring Leases |
| Total |
|
|
| Market | | | | | | | | |
|
|
|
|
|
|
| Greater Boston | | 22,052 |
| | 50,626 |
| | — |
| | 34,462 |
| | 107,140 |
| | $ | 38.18 |
| | | — |
|
| 23,599 |
|
| — |
|
| 418,237 |
|
| 441,836 |
|
| $ | 38.58 |
|
|
| San Francisco Bay Area | | 20,697 |
| | 28,802 |
| | — |
| | 83,659 |
| | 133,158 |
| | 29.02 |
| | | 71,746 |
|
| — |
|
| — |
|
| 171,368 |
|
| 243,114 |
|
| 32.69 |
|
|
| San Diego | | 11,657 |
| | — |
| | — |
| | 48,098 |
| | 59,755 |
| | 10.50 |
| | | 2,898 |
|
| 7,876 |
|
| 48,880 |
| (2) | 138,329 |
|
| 197,983 |
|
| 21.75 |
|
|
| Greater New York City | | — |
| | 63,785 |
| | — |
| | 21,712 |
| | 85,497 |
| | 36.60 |
| | | — |
|
| — |
|
| — |
|
| 9,131 |
|
| 9,131 |
|
| N/A |
|
|
| Maryland | | — |
| | 2,543 |
| | — |
| | 65,062 |
| (3) | 67,605 |
| | 25.79 |
| | | — |
|
| 46,136 |
|
| — |
|
| 162,818 |
|
| 208,954 |
|
| 20.94 |
|
|
| Seattle | | 12,543 |
| | 2,468 |
| | — |
| | 5,070 |
| | 20,081 |
| | 46.37 |
| | | — |
|
| — |
|
| — |
|
| 41,407 |
|
| 41,407 |
|
| 27.91 |
|
|
| Research Triangle Park | | — |
| | 8,230 |
| | — |
| | 14,805 |
| | 23,035 |
| | 23.34 |
| | | — |
|
| 31,776 |
|
| — |
|
| 180,629 |
|
| 212,405 |
|
| 19.97 |
|
|
| Non-cluster markets | | — |
| | 3,213 |
| | — |
| | 12,604 |
| | 15,817 |
| | 19.99 |
| | | — |
|
| — |
|
| — |
|
| 3,508 |
|
| 3,508 |
|
| 18.27 |
|
|
| Asia | | — |
| | 14,445 |
| | — |
| | 7,053 |
| | 21,498 |
| | 11.38 |
|
| | — |
|
| — |
|
| — |
|
| 575 |
|
| 575 |
|
| 16.46 |
|
|
| Total | | 66,949 |
| | 174,112 |
| | — |
| | 292,525 |
| | 533,586 |
| | $ | 29.02 |
| | | 74,644 |
|
| 109,387 |
|
| 48,880 |
|
| 1,126,002 |
|
| 1,358,913 |
|
| $ | 29.82 |
|
|
| Percentage of expiring leases | | 12 | % | | 33 | % | | — | % | | 55 | % | | 100 | % | | | | | 5 | % |
| 8 | % |
| 4 | % |
| 83 | % |
| 100 | % |
|
|
|
| |
| (1) | Excludes 11 month-to-month leases for 18,038 RSF. |
| |
| (2) | Represents the square footage at 10151 Barnes Canyon Road, which was acquired in 3Q13. This property will undergo conversion into laboratory/office space through redevelopment in 4Q15 upon expiration of the lease that was in-place since the acquisition of the property. |
| |
| (3) | Includes a 54,906 RSF lease expiration in 4Q14 at our 5 Research Court project in Rockville. Subject to local market conditions, this property may undergo conversion from non-laboratory into laboratory/office through redevelopment upon rollover. |
|
| | |
| ALEXANDRIA REAL ESTATE EQUITIES, INC
ALL RIGHTS RESERVED © 2014 | 17 |
ALEXANDRIA REAL ESTATE EQUITIES, INC.
March 31, 2014
Top 20 Client Tenants
(Dollars in thousands)
(Unaudited)
|
| | | | | | | | | | | | | | | | | | | | | | | | | | |
| | | | | Remaining Lease Term in Years (1) | | Aggregate RSF | | Percentage of Aggregate Total RSF | | ABR | | Percentage of Aggregate ABR | | |
| | | | | | | | | | Investment-Grade Ratings |
| | | Client Tenant | | | | | | | Fitch | | Moody’s | | S&P |
| 1 | | Novartis AG | | | 3.3 |
| | | 696,678 |
| | 3.9 | % | | $ | 33,646 |
| | 6.6 | % | | AA | | Aa3 | | AA- |
| 2 | | New York University | | | 16.6 |
| | | 205,609 |
| | 1.2 |
| | 19,593 |
| | 3.9 |
| | — | | Aa3 | | AA- |
| 3 | | Illumina, Inc. | | | 17.6 |
| | | 497,078 |
| | 2.8 |
| | 19,531 |
| | 3.8 |
| | — | | — | | — |
| 4 | | Roche | | | 5.8 |
| | | 409,734 |
| | 2.3 |
| | 18,671 |
| | 3.7 |
| | AA | | A1 | | AA |
| 5 | | United States Government | | | 9.3 |
| | | 399,633 |
| | 2.3 |
| | 17,887 |
| | 3.5 |
| | AAA | | Aaa | | AA+ |
| 6 | | Eli Lilly and Company | | | 9.6 |
| | | 257,119 |
| | 1.5 |
| | 14,563 |
| | 2.9 |
| | A | | A2 | | AA- |
| 7 | | FibroGen, Inc. | | | 9.6 |
| | | 234,249 |
| | 1.3 |
| | 14,197 |
| | 2.8 |
| | — | | — | | — |
| 8 | | Biogen Idec Inc. | | | 14.2 |
| | | 313,872 |
| | 1.8 |
| | 13,707 |
| | 2.7 |
| | — | | Baa1 | | A- |
| 9 | | Bristol-Myers Squibb Company | | | 4.8 |
| | | 251,316 |
| | 1.4 |
| | 10,087 |
| | 2.0 |
| | A- | | A2 | | A+ |
| 10 | | The Scripps Research Institute | | | 2.5 |
| | | 218,031 |
| | 1.2 |
| | 9,965 |
| | 2.0 |
| | AA- | | Aa3 | | — |
| 11 | | GlaxoSmithKline plc | | | 5.3 |
| | | 208,394 |
| | 1.2 |
| | 9,899 |
| | 1.9 |
| | A+ | | A1 | | A+ |
| 12 | | Amgen Inc. | | | 9.0 |
| | | 294,373 |
| | 1.7 |
| | 9,597 |
| | 1.9 |
| | BBB | | Baa1 | | A |
| 13 | | Celgene Corporation | | | 7.3 |
| | | 250,586 |
| | 1.4 |
| | 9,361 |
| | 1.8 |
| | — | | Baa2 | | BBB+ |
| 14 | | Massachusetts Institute of Technology | | | 3.6 |
| | | 196,304 |
| | 1.1 |
| | 9,152 |
| | 1.8 |
| | — | | Aaa | | AAA |
| 15 | | The Regents of the University of California | | | 7.4 |
| | | 188,654 |
| | 1.1 |
| | 7,787 |
| | 1.5 |
| | AA | | Aa2 | | AA |
| 16 | | Alnylam Pharmaceuticals, Inc. | | | 7.5 |
| | | 129,424 |
| | 0.7 |
| | 7,036 |
| | 1.4 |
| | — | | — | | — |
| 17 | | AstraZeneca PLC | | | 2.8 |
| | | 218,308 |
| | 1.2 |
| | 6,835 |
| | 1.3 |
| | AA- | | A2 | | AA- |
| 18 | | Pfizer Inc. | | | 4.8 |
| | | 128,348 |
| | 0.7 |
| | 6,126 |
| | 1.2 |
| | A+ | | A1 | | AA |
| 19 | | Gilead Sciences, Inc. | | | 6.3 |
| | | 109,969 |
| | 0.6 |
| | 5,824 |
| | 1.1 |
| | — | | Baa1 | | A- |
| 20 | | Theravance, Inc. (2) | | | 6.2 |
| | | 150,256 |
| | 0.8 |
| | 5,494 |
| | 1.1 |
| | — | | — | | — |
| | | Total/weighted average | | | 8.3 |
| | | 5,357,935 |
| | 30.2 | % | | $ | 248,958 |
| | 48.9 | % | | | | | | |
| |
| (1) | Represents remaining lease term in years based on percentage of aggregate ABR in effect as of March 31, 2014. |
| |
| (2) | As of February 14, 2014, GlaxoSmithKline plc owned approximately 27% of the outstanding stock of Theravance, Inc. |
|
| | |
| ALEXANDRIA REAL ESTATE EQUITIES, INC
ALL RIGHTS RESERVED © 2014 | 18 |
ALEXANDRIA REAL ESTATE EQUITIES, INC.
March 31, 2014
Client Tenant Mix
(Unaudited)
|
| | | |
| | | | |
Percentage of Investment-Grade Client Tenants as of 1Q14 | |
| |
| ALEXANDRIA’S TOTAL ABR: | 52% | |
| TOP 20 CLIENT TENANTS: | 81% | |
| | | |
| | | | (By ABR) |
|
| | | | | | |
| Multinational Pharmaceutical | | Institutions (Academic/Medical, Non-Profit, U.S. Government) | | Life Science Product, Service, and Device | | Biotechnology: Public & Private |
• Astellas Pharma Inc. • AstraZeneca PLC • Bayer AG • Bristol-Myers Squibb Company • Eisai Co., Ltd. • Eli Lilly and Company • GlaxoSmithKline plc • Merck & Co., Inc. • Novartis AG • Pfizer Inc. • Roche • Sanofi • Shire plc • UCB S.A. | | • Duke University • Environmental Protection Agency • Fred Hutchinson Cancer Research Center • Massachusetts Institute of Technology • National Institutes of Health • New York University • Sanford-Burnham Medical Research Institute • Stanford University • The Regents of the University of California • The Scripps Research Institute • UMass Memorial Health Care, Inc. • University of North Carolina Health Care System • United States Government • University of Washington | | • Aramco Services Company • Canon U.S. Life Sciences, Inc. • Covance Inc. • DSM N.V. • Fluidigm Corporation • Google Inc. • Illumina, Inc. • Laboratory Corporation of America Holdings • Monsanto Company • Quest Diagnostics Incorporated • Thermo Fisher Scientific Inc.
| | • Alnylam Pharmaceuticals, Inc. • Amgen Inc. • Biogen Idec Inc. • Celgene Corporation • Constellation Pharmaceuticals, Inc. • Epizyme, Inc. • Fate Therapeutics, Inc. • FibroGen, Inc. • FORMA Therapeutics, Inc. • Gilead Sciences, Inc. • Infinity Pharmaceuticals, Inc. • Kadmon Corporation, LLC • Medivation, Inc. • Nektar Therapeutics • Proteostasis Therapeutics, Inc. • Quanticel Pharmaceuticals, Inc. • Theravance, Inc. • Warp Drive Bio, LLC |
|
| | |
| ALEXANDRIA REAL ESTATE EQUITIES, INC
ALL RIGHTS RESERVED © 2014 | 19 |
ALEXANDRIA REAL ESTATE EQUITIES, INC.
March 31, 2014
Summary of Properties and Occupancy
(Unaudited)
Summary of properties
|
| | | | | | | | | | | | | | | | | | | | | | | | | |
| | | RSF | | Number of Properties | | ABR (Dollars in thousands) |
| Market | | Operating | | Development | | Redevelopment | | Total | | % Total | | |
| Greater Boston | | 3,547,714 |
| | 801,806 |
| | 112,500 |
| | 4,462,020 |
| | 25 | % | | 39 |
| | $ | 148,402 |
| | 29 | % |
| San Francisco Bay Area | | 2,540,975 |
| | 326,824 |
| | — |
| | 2,867,799 |
| | 16 |
| | 26 |
| | 102,682 |
| | 20 |
|
| San Diego | | 2,820,044 |
| | — |
| | 108,725 |
| | 2,928,769 |
| | 17 |
| | 40 |
| | 93,700 |
| | 19 |
|
| Greater New York City | | 683,667 |
| | 229,627 |
| | — |
| | 913,294 |
| | 5 |
| | 6 |
| | 47,733 |
| | 9 |
|
| Maryland | | 2,155,346 |
| | — |
| | — |
| | 2,155,346 |
| | 12 |
| | 29 |
| | 48,964 |
| | 10 |
|
| Seattle | | 746,260 |
| | — |
| | — |
| | 746,260 |
| | 5 |
| | 10 |
| | 30,002 |
| | 6 |
|
| Research Triangle Park | | 1,025,786 |
| | — |
| | — |
| | 1,025,786 |
| | 6 |
| | 15 |
| | 21,581 |
| | 4 |
|
| Canada | | 1,103,507 |
| | — |
| | — |
| | 1,103,507 |
| | 6 |
| | 5 |
| | 8,904 |
| | 2 |
|
| Non-cluster markets | | 60,178 |
| | — |
| | — |
| | 60,178 |
| | — |
| | 2 |
| | 874 |
| | — |
|
| North America | | 14,683,477 |
| | 1,358,257 |
| | 221,225 |
| | 16,262,959 |
| | 92 |
| | 172 |
| | 502,842 |
| | 99 |
|
| Asia | | 903,230 |
| | 465,456 |
| | — |
| | 1,368,686 |
| | 8 |
| | 9 |
| | 5,508 |
| | 1 |
|
| Continuing operations | | 15,586,707 |
| | 1,823,713 |
| | 221,225 |
| | 17,631,645 |
| | 100 |
| | 181 |
| | $ | 508,350 |
| | 100 | % |
| Properties “held for sale” | | 84,286 |
| | — |
| | — |
| | 84,286 |
| | — |
| | 4 |
| | | | |
| Total | | 15,670,993 |
| | 1,823,713 |
| | 221,225 |
| | 17,715,931 |
| | 100 | % | | 185 |
| |
|
| | |
Summary of occupancy percentages
|
| | | | | | | | | | | | | | | | | | |
| | | Operating Properties | | Operating and Redevelopment Properties |
| Market | | 3/31/14 | | 12/31/13 | | 3/31/13 | | 3/31/14 | | 12/31/13 | | 3/31/13 |
| Greater Boston | | 97.5 | % | | 96.8 | % | | 95.8 | % | | 94.5 | % | (1) | 96.8 | % | | 93.5 | % |
| San Francisco Bay Area | | 99.9 |
| | 97.7 |
| | 95.8 |
| | 99.9 |
| | 97.7 |
| | 93.8 |
|
| San Diego | | 96.6 |
| | 96.5 |
| | 93.4 |
| | 93.0 |
| | 94.5 |
| | 91.0 |
|
| Greater New York City | | 98.3 |
| | 98.3 |
| | 98.4 |
| | 98.3 |
| | 98.3 |
| | 98.4 |
|
| Maryland | | 92.2 |
| | 92.0 |
| | 90.8 |
| | 92.2 |
| | 92.0 |
| | 88.0 |
|
| Seattle | | 92.9 |
| | 90.7 |
| | 96.7 |
| | 92.9 |
| | 90.7 |
| | 88.2 |
|
| Research Triangle Park | | 97.1 |
| | 96.6 |
| | 93.6 |
| | 97.1 |
| | 96.6 |
| | 93.6 |
|
| Canada | | 96.8 |
| | 96.8 |
| | 94.7 |
| | 96.8 |
| | 96.8 |
| | 94.7 |
|
| Non-cluster markets | | 91.7 |
| | 91.7 |
| | 54.0 |
| | 91.7 |
| | 91.7 |
| | 54.0 |
|
| North America | | 96.6 |
| | 95.9 |
| | 94.2 |
| | 95.1 |
| | 95.5 |
| | 91.8 |
|
| Asia | | 68.0 |
| | 71.2 |
| | 67.1 |
| | 68.0 |
| | 67.7 |
| | 57.7 |
|
| Continuing operations | | 94.9 | % | | 94.4 | % | | 93.0 | % | | 93.5 | % | | 93.8 | % | | 90.1 | % |
| |
| (1) | Decrease due to the acquisition of 225 Second Avenue, a vacant 112,500 RSF redevelopment project in March 2014. Excluding this acquisition our occupancy at March 31, 2014, was 97.5%. |
|
| | |
| ALEXANDRIA REAL ESTATE EQUITIES, INC
ALL RIGHTS RESERVED © 2014 | 20 |
ALEXANDRIA REAL ESTATE EQUITIES, INC.
March 31, 2014
Property Listing
(Dollars in thousands)
(Unaudited)
|
| | | | | | | | | | | | | | | | | | | | | | | | | | |
| | | | | | | Number of Properties | | | | Occupancy Percentage |
| | | | | RSF | | | ABR | | Operating | | Operating and Redevelopment |
Market / Submarket / Address | | Operating | | Development | | Redevelopment | | Total | | | | |
| Greater Boston | | | | | | | | | | | | | | | | |
| | Cambridge/Inner Suburbs | | | | | | | | | | | | | | | | |
| | | Alexandria Center™ at Kendall Square | | 973,464 |
| | 388,270 |
| | — |
| | 1,361,734 |
| | 6 | | $ | 42,450 |
| | 96.0 | % | | 96.0 | % |
| | | 75/125 and 225 Binney Street, 161 and 215 First Street, 150 Second Street, and 300 Third Street | | | | | | | | | | | | | | | | |
| | | Alexandria Technology Square® | | 1,181,635 |
| | — |
| | — |
| | 1,181,635 |
| | 7 | | 67,135 |
| | 100.0 |
| | 100.0 |
|
| | | 100, 200, 300, 400, 500, 600, and 700 Technology Square | | | | | | | | | | | | | | | | |
| | | 480/500 Arsenal Street | | 234,260 |
| | — |
| | — |
| | 234,260 |
| | 2 | | 8,115 |
| | 100.0 |
| | 100.0 |
|
| | | 780/790 Memorial Drive | | 99,350 |
| | — |
| | — |
| | 99,350 |
| | 2 | | 6,824 |
| | 100.0 |
| | 100.0 |
|
| | | 167 Sidney Street/99 Erie Street | | 54,549 |
| | — |
| | — |
| | 54,549 |
| | 2 | | 2,700 |
| | 100.0 |
| | 100.0 |
|
| | | 79/96 Thirteenth Street Charlestown Navy Yard | | 25,309 |
| | — |
| | — |
| | 25,309 |
| | 1 | | 620 |
| | 100.0 |
| | 100.0 |
|
| | Longwood Medical Area | | | | | | | | | | | | | | | | |
| | | 360 Longwood Avenue (Unconsolidated JV) | | — |
| | 413,536 |
| | — |
| | 413,536 |
| | 1 | | — |
| | N/A |
| | N/A |
|
| | Route 128 | | | | | | | | | | | | | | | | |
| | | Alexandria Park at 128 | | 343,882 |
| | — |
| | — |
| | 343,882 |
| | 8 | | 7,985 |
| | 87.3 |
| | 87.3 |
|
| | | 3, 6, and 8 Preston Court; 29, 35, and 44 Hartwell Avenue; 35, 45, and 47 Wiggins Avenue; and 60 Westview Street | | | | | | | | | | | | | | | | |
| | | 19 Presidential Way | | 128,325 |
| | — |
| | — |
| | 128,325 |
| | 1 | | 3,398 |
| | 100.0 |
| | 100.0 |
|
| | | 100 Beaver Street | | 82,330 |
| | — |
| | — |
| | 82,330 |
| | 1 | | 2,303 |
| | 100.0 |
| | 100.0 |
|
| | | 285 Bear Hill Road | | 26,270 |
| | — |
| | — |
| | 26,270 |
| | 1 | | 801 |
| | 100.0 |
| | 100.0 |
|
| | | 225 Second Avenue (1) | | — |
| | — |
| | 112,500 |
| | 112,500 |
| | 1 | | — |
| | N/A |
| | — |
|
| | Rte 495/Worcester | | | | | | | | | | | | | | | | |
| | | 111/130 Forbes Boulevard | | 155,846 |
| | — |
| | — |
| | 155,846 |
| | 2 | | 1,415 |
| | 100.0 |
| | 100.0 |
|
| | | 20 Walkup Drive | | 91,045 |
| | — |
| | — |
| | 91,045 |
| | 1 | | 670 |
| | 100.0 |
| | 100.0 |
|
| | | 306 Belmont Street & 350 Plantation Street | | 90,690 |
| | — |
| | — |
| | 90,690 |
| | 2 | | 1,221 |
| | 92.5 |
| | 92.5 |
|
| | | 30 Bearfoot Road | | 60,759 |
| | — |
| | — |
| | 60,759 |
| | 1 | | 2,765 |
| | 100.0 |
| | 100.0 |
|
| | | Greater Boston | | 3,547,714 |
| | 801,806 |
| | 112,500 |
| | 4,462,020 |
| | 39 | | $ | 148,402 |
| | 97.5 | % | | 94.5 | % |
| | | | | | | | | | | | | | | | | | | |
| | | (1) Redevelopment property acquired in March 2014. |
|
| | |
| ALEXANDRIA REAL ESTATE EQUITIES, INC
ALL RIGHTS RESERVED © 2014 | 21 |
ALEXANDRIA REAL ESTATE EQUITIES, INC.
March 31, 2014
Property Listing
(Dollars in thousands)
(Unaudited)
|
| | | | | | | | | | | | | | | | | | | | | | | | | | |
| | | | | | | Number of Properties | | | | Occupancy Percentage |
| | | | | RSF | | | ABR | | Operating | | Operating and Redevelopment |
Market / Submarket / Address | | Operating | | Development | | Redevelopment | | Total | | | | |
| San Francisco Bay Area | | | | | | | | | | | | | | | | |
| | Mission Bay | | | | | | | | | | | | | | | | |
| | | 409/499 Illinois Street | | 234,249 |
| | 219,574 |
| | — |
| | 453,823 |
| | 2 | | $ | 14,197 |
| | 100.0 | % | | 100.0 | % |
| | | 455 Mission Bay Boulevard South | | 210,398 |
| | — |
| | — |
| | 210,398 |
| | 1 | | 9,598 |
| | 100.0 |
| | 100.0 |
|
| | | 1500 Owens Street | | 158,267 |
| | — |
| | — |
| | 158,267 |
| | 1 | | 7,106 |
| | 100.0 |
| | 100.0 |
|
| | | 1700 Owens Street | | 157,340 |
| | — |
| | — |
| | 157,340 |
| | 1 | | 9,477 |
| | 100.0 |
| | 100.0 |
|
| | South San Francisco | | | | | | | | | | | | | | | | |
| | | Alexandria Technology Center – Gateway | | 448,175 |
| | — |
| | — |
| | 448,175 |
| | 6 | | 16,672 |
| | 100.0 |
| | 100.0 |
|
| | | 600, 630, 650, 681, 901, and 951 Gateway Boulevard | | | | | | | | | | | | | | | | |
| | | 249/259/269 East Grand Avenue | | 300,119 |
| | 107,250 |
| | — |
| | 407,369 |
| | 3 | | 11,482 |
| | 100.0 |
| | 100.0 |
|
| | | 400/450 East Jamie Court | | 163,035 |
| | — |
| | — |
| | 163,035 |
| | 2 | | 5,538 |
| | 100.0 |
| | 100.0 |
|
| | | 500 Forbes Boulevard | | 155,685 |
| | — |
| | — |
| | 155,685 |
| | 1 | | 5,540 |
| | 100.0 |
| | 100.0 |
|
| | | 7000 Shoreline Court | | 136,395 |
| | — |
| | — |
| | 136,395 |
| | 1 | | 4,235 |
| | 100.0 |
| | 100.0 |
|
| | | 341/343 Oyster Point Boulevard | | 107,960 |
| | — |
| | — |
| | 107,960 |
| | 2 | | 3,255 |
| | 100.0 |
| | 100.0 |
|
| | Peninsula | | | | | | | | | | | | | | | | |
| | | 849/863 Mitten Road & 866 Malcolm Road | | 103,611 |
| | — |
| | — |
| | 103,611 |
| | 1 | | 2,313 |
| | 97.9 |
| | 97.9 |
|
| | | 2425 Garcia Avenue & 2400/2450 Bayshore Parkway | | 99,208 |
| | — |
| | — |
| | 99,208 |
| | 1 | | 3,877 |
| | 100.0 |
| | 100.0 |
|
| | | 3165 Porter Drive | | 91,644 |
| | — |
| | — |
| | 91,644 |
| | 1 | | 3,885 |
| | 100.0 |
| | 100.0 |
|
| | | 75/125 Shoreway Road | | 82,815 |
| | — |
| | — |
| | 82,815 |
| | 1 | | 2,068 |
| | 100.0 |
| | 100.0 |
|
| | | 3350 West Bayshore Road | | 60,000 |
| | — |
| | — |
| | 60,000 |
| | 1 | | 1,919 |
| | 100.0 |
| | 100.0 |
|
| | | 2625/2627/2631 Hanover Street | | 32,074 |
| | — |
| | — |
| | 32,074 |
| | 1 | | 1,520 |
| | 100.0 |
| | 100.0 |
|
| | | San Francisco Bay Area | | 2,540,975 |
| | 326,824 |
| | — |
| | 2,867,799 |
| | 26 | | $ | 102,682 |
| | 99.9 | % | | 99.9 | % |
| | | | | | | | | | | | | | | | | | | |
|
| | |
| ALEXANDRIA REAL ESTATE EQUITIES, INC
ALL RIGHTS RESERVED © 2014 | 22 |
ALEXANDRIA REAL ESTATE EQUITIES, INC.
March 31, 2014
Property Listing
(Dollars in thousands)
(Unaudited)
|
| | | | | | | | | | | | | | | | | | | | | | | | | | |
| | | | | | | Number of Properties | | | | Occupancy Percentage |
| | | | | RSF | | | ABR | | Operating | | Operating and Redevelopment |
Market / Submarket / Address | | Operating | | Development | | Redevelopment | | Total | | | | |
| San Diego | | | | | | | | | | | | | | | | |
| | Torrey Pines | | | | | | | | | | | | | | | | |
| | | ARE Nautilus | | 241,191 |
| | — |
| | — |
| | 241,191 |
| | 4 | | $ | 7,989 |
| | 96.2 | % | | 96.2 | % |
| | | 3530/3550 John Hopkins Court and 3535/3565 General Atomics Court | | | | | | | | | | | | | | | | |
| | | ARE Sunrise | | 215,931 |
| | — |
| | — |
| | 215,931 |
| | 3 | | 7,928 |
| | 98.1 |
| | 98.1 |
|
| | | 10931, 10933, and 10975 North Torrey Pines Road and 3010 Science Park Road | | | | | | | | | | | | | | | | |
| | | ARE Spectrum | | 158,645 |
| | — |
| | — |
| | 158,645 |
| | 2 | | 7,132 |
| | 100.0 |
| | 100.0 |
|
| | | 3115 and 3215 Merryfield Row | | | | | | | | | | | | | | | | |
| | | 11119 North Torrey Pines Road | | 72,506 |
| | — |
| | — |
| | 72,506 |
| | 1 | | 2,570 |
| | 100.0 |
| | 100.0 |
|
| | | 3545 Cray Court | | 116,556 |
| | — |
| | — |
| | 116,556 |
| | 1 | | 4,765 |
| | 100.0 |
| | 100.0 |
|
| | University Town Center | | | | | | | | | | | | | | | | |
| | | 5200 Illumina Way | | 497,078 |
| | — |
| | — |
| | 497,078 |
| | 1 | | 19,531 |
| | 100.0 |
| | 100.0 |
|
| | | 10300 Campus Point Drive | | 449,759 |
| | — |
| | — |
| | 449,759 |
| | 1 | | 15,783 |
| | 96.1 |
| | 96.1 |
|
| | | ARE Esplanade | | 180,208 |
| | — |
| | — |
| | 180,208 |
| | 3 | | 6,737 |
| | 93.1 |
| | 93.1 |
|
| | | 4755, 4757, and 4767 Nexus Center Drive | | | | | | | | | | | | | | | | |
| | | ARE Towne Centre | | 138,578 |
| | — |
| | — |
| | 138,578 |
| | 3 | | 3,628 |
| | 95.3 |
| | 95.3 |
|
| | | 9363, 9373, and 9393 Towne Centre Drive | | | | | | | | | | | | | | | | |
| | | 9880 Campus Point Drive | | 71,510 |
| | — |
| | — |
| | 71,510 |
| | 1 | | 2,774 |
| | 100.0 |
| | 100.0 |
|
| | Sorrento Mesa | | | | | | | | | | | | | | | | |
| | | 5810/5820/6138/6150 Nancy Ridge Drive | | 143,996 |
| | — |
| | — |
| | 143,996 |
| | 2 | | 2,818 |
| | 73.6 |
| | 73.6 |
|
| | | ARE Portola | | 105,812 |
| | — |
| | — |
| | 105,812 |
| | 3 | | 1,497 |
| | 92.8 |
| | 92.8 |
|
| | | 6175, 6255, and 6275 Nancy Ridge Drive | | | | | | | | | | | | | | | | |
| | | 10121/10151 Barnes Canyon Road (1) | | 48,880 |
| | — |
| | 53,512 |
| | 102,392 |
| | 2 | | 476 |
| | 100.0 |
| | 47.7 |
|
| | | 7330 Carroll Road | | 66,244 |
| | — |
| | — |
| | 66,244 |
| | 1 | | 2,440 |
| | 100.0 |
| | 100.0 |
|
| | | 5871 Oberlin Drive | | 33,817 |
| | — |
| | — |
| | 33,817 |
| | 1 | | 973 |
| | 100.0 |
| | 100.0 |
|
| | Sorrento Valley | | | | | | | | | | | | | | | | |
| | | 11025/11035/11045/11055/11065/11075 Roselle Street | | 66,442 |
| | — |
| | 55,213 |
| | 121,655 |
| | 6 | | 1,622 |
| | 100.0 |
| | 54.6 |
|
| | | 3985/4025/4031/4045 Sorrento Valley Boulevard | | 103,111 |
| | — |
| | — |
| | 103,111 |
| | 4 | | 2,542 |
| | 100.0 |
| | 100.0 |
|
| | I-15 Corridor | | | | | | | | | | | | | | | | |
| | | 13112 Evening Creek Drive | | 109,780 |
| | — |
| | — |
| | 109,780 |
| | 1 | | 2,495 |
| | 100.0 |
| | 100.0 |
|
| | | San Diego | | 2,820,044 |
| | — |
| | 108,725 |
| | 2,928,769 |
| | 40 | | $ | 93,700 |
| | 96.6 | % | | 93.0 | % |
| | | | | | | | | | | | | | | | | | | |
| | | (1) We recently acquired these properties and are actively redeveloping 53,512 RSF at 10121 Barnes Canyon Road. We expect to redevelop 48,880 RSF at 10151 Barnes Canyon Road once the existing lease expires in 2015. |
| | | | | | | | | | | | | | | | | | | |
|
| | |
| ALEXANDRIA REAL ESTATE EQUITIES, INC
ALL RIGHTS RESERVED © 2014 | 23 |
ALEXANDRIA REAL ESTATE EQUITIES, INC.
March 31, 2014
Property Listing
(Dollars in thousands)
(Unaudited)
|
| | | | | | | | | | | | | | | | | | | | | | | | | | |
| | | | | | | Number of Properties | | | | Occupancy Percentage |
| | | | | RSF | | | ABR | | Operating | | Operating and Redevelopment |
Market / Submarket / Address | | Operating | | Development | | Redevelopment | | Total | | | | |
| Greater New York City | | | | | | | | | | | | | | | | |
| | Manhattan | | | | | | | | | | | | | | | | |
| | | Alexandria Center™ for Life Science | | 498,152 |
| | 229,627 |
| | — |
| | 727,779 |
| | 2 | | $ | 41,166 |
| | 99.1 | % | | 99.1 | % |
| | | 430 and 450 East 29th Street | | | | | | | | | | | | | | | | |
| | Bergen County | | | | | | | | | | | | | | | | |
| | | 100 Phillips Parkway | | 78,501 |
| | — |
| | — |
| | 78,501 |
| | 1 | | 2,213 |
| | 90.8 |
| | 90.8 |
|
| | Pennsylvania | | | | | | | | | | | | | | | | |
| | | 102 Witmer Road | | 50,000 |
| | — |
| | — |
| | 50,000 |
| | 1 | | 3,345 |
| | 100.0 |
| | 100.0 |
|
| | | 701 Veterans Circle | | 35,155 |
| | — |
| | — |
| | 35,155 |
| | 1 | | 735 |
| | 100.0 |
| | 100.0 |
|
| | | 5100 Campus Drive | | 21,859 |
| | — |
| | — |
| | 21,859 |
| | 1 | | 274 |
| | 100.0 |
| | 100.0 |
|
| | | Greater New York City | | 683,667 |
| | 229,627 |
| | — |
| | 913,294 |
| | 6 | | $ | 47,733 |
| | 98.3 | % | | 98.3 | % |
| | | | | | | | | | | | | | | | | | | |
| Maryland | | | | | | | | | | | | | | | | |
| | Rockville | | | | | | | | | | | | | | | | |
| | | 9800 Medical Center Drive | | 281,586 |
| | — |
| | — |
| | 281,586 |
| | 4 | | $ | 12,422 |
| | 100.0 | % | | 100.0 | % |
| | | 1330 Piccard Drive | | 131,511 |
| | — |
| | — |
| | 131,511 |
| | 1 | | 3,125 |
| | 100.0 |
| | 100.0 |
|
| | | 1500/1550 East Gude Drive | | 90,489 |
| | — |
| | — |
| | 90,489 |
| | 2 | | 1,524 |
| | 90.5 |
| | 90.5 |
|
| | | 14920/15010 Broschart Road | | 86,703 |
| | — |
| | — |
| | 86,703 |
| | 2 | | 1,944 |
| | 100.0 |
| | 100.0 |
|
| | | 1405 Research Boulevard | | 71,669 |
| | — |
| | — |
| | 71,669 |
| | 1 | | 2,102 |
| | 100.0 |
| | 100.0 |
|
| | | 5 Research Place | | 63,852 |
| | — |
| | — |
| | 63,852 |
| | 1 | | 2,373 |
| | 100.0 |
| | 100.0 |
|
| | | 9920 Medical Center Drive | | 58,733 |
| | — |
| | — |
| | 58,733 |
| | 1 | | 455 |
| | 100.0 |
| | 100.0 |
|
| | | 5 Research Court | | 54,906 |
| | — |
| | — |
| | 54,906 |
| | 1 | | 1,598 |
| | 100.0 |
| | 100.0 |
|
| | | 12301 Parklawn Drive | | 49,185 |
| | — |
| | — |
| | 49,185 |
| | 1 | | 1,169 |
| | 100.0 |
| | 100.0 |
|
| | Gaithersburg | | | | | | | | | | | | | | | | |
| | | Alexandria Technology Center – Gaithersburg I | | 377,401 |
| | — |
| | — |
| | 377,401 |
| | 4 | | 6,689 |
| | 82.3 |
| | 82.3 |
|
| | | 9 West Watkins Mill Road and 910, 930, and 940 Clopper Road | | | | | | | | | | | | | | | | |
| | | Alexandria Technology Center – Gaithersburg II | | 237,137 |
| | — |
| | — |
| | 237,137 |
| | 5 | | 5,103 |
| | 93.0 |
| | 93.0 |
|
| | | 708 Quince Orchard Road, 1300 Quince Orchard Boulevard, and 19, 20, and 22 Firstfield Road | | | | | | | | | | | | | | | | |
| | | 16020 Industrial Drive | | 71,000 |
| | — |
| | — |
| | 71,000 |
| | 1 | | 1,048 |
| | 100.0 |
| | 100.0 |
|
| | | 401 Professional Drive | | 63,154 |
| | — |
| | — |
| | 63,154 |
| | 1 | | 1,104 |
| | 92.1 |
| | 92.1 |
|
| | | 950 Wind River Lane | | 50,000 |
| | — |
| | — |
| | 50,000 |
| | 1 | | 1,082 |
| | 100.0 |
| | 100.0 |
|
| | | 620 Professional Drive | | 27,950 |
| | — |
| | — |
| | 27,950 |
| | 1 | | 496 |
| | 100.0 |
| | 100.0 |
|
| | Beltsville | | | | | | | | | | | | | | | | |
| | | 8000/9000/10000 Virginia Manor Road | | 191,884 |
| | — |
| | — |
| | 191,884 |
| | 1 | | 1,592 |
| | 62.9 |
| | 62.9 |
|
| | Northern Virginia | | | | | | | | | | | | | | | | |
| | | 14225 Newbrook Drive | | 248,186 |
| | — |
| | — |
| | 248,186 |
| | 1 | | 5,138 |
| | 100.0 |
| | 100.0 |
|
| | | Maryland | | 2,155,346 |
| | — |
| | — |
| | 2,155,346 |
| | 29 | | $ | 48,964 |
| | 92.2 | % | | 92.2 | % |
| | | | | | | | | | | | | | | | | | | |
| | | | | | | | | | | | | | | | | | | |
|
| | |
| ALEXANDRIA REAL ESTATE EQUITIES, INC
ALL RIGHTS RESERVED © 2014 | 24 |
ALEXANDRIA REAL ESTATE EQUITIES, INC.
March 31, 2014
Property Listing
(Dollars in thousands)
(Unaudited)
|
| | | | | | | | | | | | | | | | | | | | | | | | | | |
| | | | | | | Number of Properties | | | | Occupancy Percentage |
| | | | | RSF | | | ABR | | Operating | | Operating and Redevelopment |
Market / Submarket / Address | | Operating | | Development | | Redevelopment | | Total | | | | |
| Seattle | | | | | | | | | | | | | | | | |
| | Lake Union | | | | | | | | | | | | | | | | |
| | | 1201/1208 Eastlake Avenue | | 203,369 |
| | — |
| | — |
| | 203,369 |
| | 2 | | $ | 8,748 |
| | 100.0 | % | | 100.0 | % |
| | | 1616 Eastlake Avenue | | 168,708 |
| | — |
| | — |
| | 168,708 |
| | 1 | | 6,277 |
| | 81.8 |
| | 81.8 |
|
| | | 1551 Eastlake Avenue | | 117,482 |
| | — |
| | — |
| | 117,482 |
| | 1 | | 2,917 |
| | 80.7 |
| | 80.7 |
|
| | | 199 East Blaine Street | | 115,084 |
| | — |
| | — |
| | 115,084 |
| | 1 | | 6,163 |
| | 100.0 |
| | 100.0 |
|
| | | 219 Terry Avenue North | | 30,705 |
| | — |
| | — |
| | 30,705 |
| | 1 | | 1,490 |
| | 100.0 |
| | 100.0 |
|
| | | 1600 Fairview Avenue | | 27,991 |
| | — |
| | — |
| | 27,991 |
| | 1 | | 1,523 |
| | 100.0 |
| | 100.0 |
|
| | Elliott Bay | | | | | | | | | | | | | | | | |
| | | 3000/3018 Western Avenue | | 47,746 |
| | — |
| | — |
| | 47,746 |
| | 1 | | 1,839 |
| | 100.0 |
| | 100.0 |
|
| | | 410 West Harrison/410 Elliott Avenue West | | 35,175 |
| | — |
| | — |
| | 35,175 |
| | 2 | | 1,045 |
| | 100.0 |
| | 100.0 |
|
| | | Seattle | | 746,260 |
| | — |
| | — |
| | 746,260 |
| | 10 | | $ | 30,002 |
| | 92.9 | % | | 92.9 | % |
| | | | | | | | | | | | | | | | | | | |
| Research Triangle Park | | | | | | | | | | | | | | | | |
| | Research Triangle Park | | | | | | | | | | | | | | | | |
| | | Alexandria Technology Center – Alston | | 186,870 |
| | — |
| | — |
| | 186,870 |
| | 3 | | $ | 2,918 |
| | 94.6 | % | | 94.6 | % |
| | | 100, 800, and 801 Capitola Drive | | | | | | | | | | | | | | | | |
| | | 108/110/112/114 TW Alexander Drive | | 158,417 |
| | — |
| | — |
| | 158,417 |
| | 1 | | 4,955 |
| | 100.0 |
| | 100.0 |
|
| | | Alexandria Innovation Center – Research Triangle Park | | 135,677 |
| | — |
| | — |
| | 135,677 |
| | 3 | | 2,830 |
| | 100.0 |
| | 100.0 |
|
| | | 7010, 7020, and 7030 Kit Creek Road | | | | | | | | | | | | | | | | |
| | | 6 Davis Drive | | 100,000 |
| | — |
| | — |
| | 100,000 |
| | 1 | | 1,062 |
| | 100.0 |
| | 100.0 |
|
| | | 7 Triangle Drive | | 96,626 |
| | — |
| | — |
| | 96,626 |
| | 1 | | 3,157 |
| | 100.0 |
| | 100.0 |
|
| | | 407 Davis Drive | | 81,956 |
| | — |
| | — |
| | 81,956 |
| | 1 | | 1,644 |
| | 100.0 |
| | 100.0 |
|
| | | 2525 East NC Highway 54 | | 81,580 |
| | — |
| | — |
| | 81,580 |
| | 1 | | 1,686 |
| | 100.0 |
| | 100.0 |
|
| | | 601 Keystone Park Drive | | 77,395 |
| | — |
| | — |
| | 77,395 |
| | 1 | | 1,308 |
| | 100.0 |
| | 100.0 |
|
| | | 5 Triangle Drive | | 32,120 |
| | — |
| | — |
| | 32,120 |
| | 1 | | 824 |
| | 100.0 |
| | 100.0 |
|
| | | 6101 Quadrangle Drive | | 30,122 |
| | — |
| | — |
| | 30,122 |
| | 1 | | 530 |
| | 100.0 |
| | 100.0 |
|
| | Palm Beach | | | | | | | | | | | | | | | | |
| | | 555 Heritage Drive | | 45,023 |
| | — |
| | — |
| | 45,023 |
| | 1 | | 667 |
| | 55.5 |
| | 55.5 |
|
| | | Research Triangle Park | | 1,025,786 |
| | — |
| | — |
| | 1,025,786 |
| | 15 | | $ | 21,581 |
| | 97.1 | % | | 97.1 | % |
| | | | | | | | | | | | | | | | | | | |
| | | Canada (1) | | 1,103,507 |
| | — |
| | — |
| | 1,103,507 |
| | 5 | | $ | 8,904 |
| | 96.8 | % | | 96.8 | % |
| | | | | | | | | | | | | | | | | | | |
| | | Non-Cluster Markets | | 60,178 |
| | — |
| | — |
| | 60,178 |
| | 2 | | $ | 874 |
| | 91.7 | % | | 91.7 | % |
| | | | | | | | | | | | | | | | | | | |
| | | North America | | 14,683,477 |
| | 1,358,257 |
| | 221,225 |
| | 16,262,959 |
| | 172 | | $ | 502,842 |
| | 96.6 | % | | 95.1 | % |
| | | | | | | | | | | | | | | | | | | |
| | | Asia | | 903,230 |
| | 465,456 |
| | — |
| | 1,368,686 |
| | 9 | | $ | 5,508 |
| | 68.0 | % | | 68.0 | % |
| | | | | | | | | | | | | | | | | | | |
| | | Continuing Operations | | 15,586,707 |
| | 1,823,713 |
| | 221,225 |
| | 17,631,645 |
| | 181 | | $ | 508,350 |
| | 94.9 | % | | 93.5 | % |
| | | | | | | | | | | | | | | | | | | |
| | | Properties “held for sale” | | 84,286 |
| | — |
| | — |
| | 84,286 |
| | 4 | | | | | | |
| | | | | | | | | | | | | | | | | | | |
| | | Total | | 15,670,993 |
| | 1,823,713 |
| | 221,225 |
| | 17,715,931 |
| | 185 | | | | | | |
| | | | | | | | | | | | | | | | | | | |
| | | (1) Includes land and improvements subject to a ground lease with a client tenant aggregating 780,540 RSF. This amount has been excluded for occupancy purposes. |
|
| | |
| ALEXANDRIA REAL ESTATE EQUITIES, INC
ALL RIGHTS RESERVED © 2014 | 25 |
ALEXANDRIA REAL ESTATE EQUITIES, INC.
March 31, 2014
Investments in Real Estate
(Dollars in thousands, except per square foot amounts)
(Unaudited)
|
| | | | | | | | | | | | | | | |
| | Page |
| Book Value |
| Square Feet |
| Per Square Foot |
| Non-Income-Producing Real Estate Assets as a
Percentage of Gross Investments in Real Estate |
| Rental properties: | | |
|
|
|
|
|
|
|
|
| |
| Land (related to rental properties) | | |
| $ | 567,232 |
|
|
|
|
|
|
|
|
| Buildings and building improvements | | |
| 5,787,040 |
|
|
|
|
|
|
|
|
| Other improvements | | |
| 191,276 |
|
|
|
|
|
|
|
|
| Rental properties | | |
| 6,545,548 |
|
| 15,670,993 |
|
| $ | 418 |
|
|
| Less: accumulated depreciation | | |
| (992,818 | ) |
|
|
|
|
|
|
|
| Rental properties, net | | |
| 5,552,730 |
|
|
|
|
|
|
|
|
| | |
|
|
|
|
|
|
|
|
|
|
| Construction in progress (“CIP”)/current value-creation projects: | | |
|
|
|
|
|
|
|
|
|
|
| Current development in North America | | |
| 562,873 |
|
| 944,721 |
|
| 596 |
|
|
| Investment in unconsolidated joint venture | | |
| 47,390 |
| (1) | 413,536 |
|
| N/A |
|
|
| Current redevelopment in North America | | |
| 34,434 |
|
| 221,225 |
|
| 156 |
|
| |
| Current development and redevelopment in Asia | | |
| 59,540 |
|
| 465,456 |
|
| 128 |
|
| |
| | | |
| 704,237 |
|
| 2,044,938 |
|
| 344 |
|
| Non-Income-Producing Real Estate at March 31, 2014 |
| Subtotal | | |
| 6,256,967 |
|
| 17,715,931 |
|
| 353 |
|
| |
| | |
|
|
|
|
|
|
|
|
|
|
| Land/value-creation projects: | | |
|
|
|
|
|
|
|
|
|
|
| Land undergoing predevelopment activities (CIP) in North America | | |
| 379,997 |
|
| 2,661,583 |
|
| 143 |
|
|
| Land held for development in North America | | |
| 191,875 |
|
| 3,057,431 |
|
| 63 |
|
|
| Land held for development/undergoing predevelopment activities (CIP) in Asia | | |
| 78,569 |
|
| 6,419,707 |
|
| 12 |
|
|
| Land subject to sale negotiations | | |
| 22,854 |
|
| 200,000 |
|
| 114 |
|
|
| | |
| 673,295 |
|
| 12,338,721 |
|
| 55 |
|
|
| Investments in real estate, net | | |
| 6,930,262 |
|
| 30,054,652 |
| (2) | $ | 231 |
|
|
| Add: accumulated depreciation | | |
| 992,818 |
|
|
|
|
|
|
|
| Gross investments in real estate | | |
| $ | 7,923,080 |
|
|
|
|
|
|
|
| |
| (1) | Represents our investment under the equity method of accounting in the unconsolidated joint venture development project located at 360 Longwood Avenue. |
| |
| (2) | Excludes approximately 1.2 million RSF attributable to embedded land parcels that were acquired in connection with the acquisition of operating properties. Including this RSF, our total asset base is 31.2 million RSF. See page 31 for additional information on our embedded land. |
|
| | |
| ALEXANDRIA REAL ESTATE EQUITIES, INC
ALL RIGHTS RESERVED © 2014 | 26 |
ALEXANDRIA REAL ESTATE EQUITIES, INC.
March 31, 2014
All Current Value-Creation Development Projects in North America
(Dollars in thousands)
(Unaudited)
|
| | | | | | | | | | | | | | | | | | | | | | | | | | | | | | | | | |
| | | | | | | | | Leased Status | | Project Start Date | | Initial Occupancy Date | | Stabilized Occupancy Date |
| | | Project RSF | | Leased | | Negotiating | | Total Leased/Negotiating | | | |
| Property/Market – Submarket | | In Service | | CIP | | Total | | RSF | | % | | RSF | | % | | RSF | | % | | | |
| Consolidated development projects in North America | | | | | | | | | | | | | | | | | | | | | | | | |
| 75/125 Binney Street/Greater Boston – Cambridge | | — |
| | 388,270 |
| | 388,270 |
| | 386,111 |
| | 99 | % | | — |
| | — | % | | 386,111 |
| | 99 | % | | 1Q13 | | 1Q15 | | 2015 |
| 499 Illinois Street/San Francisco Bay Area – Mission Bay | | — |
| | 219,574 |
| | 219,574 |
| | 216,003 |
| | 98 | % | | 3,571 |
| | 2 | % | | 219,574 |
| | 100 | % | | 2Q11 | | 3Q14 | | 2014 |
| 269 East Grand Avenue/San Francisco Bay Area – So. San Francisco | | — |
| | 107,250 |
| | 107,250 |
| | 107,250 |
| | 100 | % | | — |
| | — | % | | 107,250 |
| | 100 | % | | 1Q13 | | 4Q14 | | 2014 |
| 430 East 29th Street/Greater NYC – Manhattan | | 189,011 |
| | 229,627 |
| | 418,638 |
| | 254,466 |
| | 61 | % | | 33,897 |
| | 8 | % | | 288,363 |
| | 69 | % | | 4Q12 | | 4Q13 | | 2015 |
| Consolidated development projects in North America | | 189,011 |
| | 944,721 |
| | 1,133,732 |
| | 963,830 |
| | 85 | % | | 37,468 |
| | 3 | % | | 1,001,298 |
| | 88 | % | | | | | | |
| | | | | | | | | | | | | | | | | | | | | | | | | |
| Unconsolidated joint venture development project | | | | | | | | | | | | | | | | | | | | | | | | |
360 Longwood Avenue/Greater Boston – Longwood Medical Area (1) | | — |
| | 413,536 |
| | 413,536 |
| | 154,100 |
| | 37 | % | | 41,400 |
| | 10 | % | | 195,500 |
| | 47 | % | | 2Q12 | | 4Q14 | | 2016 |
|
| | | | | | | | | | | | | | | | | | | | | | | | | | | | | | | | | | |
| | | Investment | | | | | | |
| | | | | Cost to Complete | | | | Unlevered |
| | | March 31, 2014 | | 2014 | | 2015 and Thereafter | | | | Initial Stabilized Yield | | Initial Stabilized Yield (Cash) | | Average Cash Yield |
| Property/Market – Submarket | | | Construction
Financing | | Internal Funding | | Construction
Financing | | Internal Funding | | Total at Completion | | | |
| | In Service | | CIP | | | | | | | | |
| Consolidated development projects in North America | | | | | | | | | | | | | | | | | | | | |
| 75/125 Binney Street/Greater Boston – Cambridge | | $ | — |
| | $ | 199,692 |
| | $ | 103,946 |
| | $ | — |
| | $ | 47,801 |
| | $ | — |
| | $ | 351,439 |
| (2) | 8.2% | | 8.0% | | 9.1% |
| 499 Illinois Street/San Francisco Bay Area – Mission Bay | | $ | — |
| | $ | 125,227 |
| | $ | — |
| | $ | 77,694 |
| | $ | — |
| | $ | — |
| | $ | 202,921 |
| | 7.2% | | 6.4% | | 7.3% |
| 269 East Grand Avenue/San Francisco Bay Area – So. San Francisco | | $ | — |
| | $ | 27,681 |
| | $ | 23,619 |
| | $ | — |
| | $ | — |
| | $ | — |
| | $ | 51,300 |
| | 9.3% | | 8.1% | | 9.3% |
| 430 East 29th Street/Greater NYC – Manhattan | | $ | 167,346 |
| | $ | 210,273 |
| | $ | — |
| | $ | 52,154 |
| | $ | — |
| | $ | 33,472 |
| | $ | 463,245 |
| | 6.5% | | 6.6% | | 7.1% |
| Consolidated development projects in North America | | $ | 167,346 |
| | $ | 562,873 |
| | $ | 127,565 |
| | $ | 129,848 |
| | $ | 47,801 |
| | $ | 33,472 |
| | $ | 1,068,905 |
| | | | | | |
| Unconsolidated joint venture development project | | | | | | | | | | | | | | | | | | | | |
100% of JV: 360 Longwood Avenue/Greater Boston – Longwood Medical Area (1) | | $ | — |
| | $ | 243,916 |
| | $ | 61,350 |
| | $ | 1,587 |
| | $ | 41,531 |
| | $ | 1,616 |
| | $ | 350,000 |
| | 8.9% | | 8.3% | | 9.3% |
| Less: Funding from secured construction loans and JV partner capital | | $ | — |
| | $ | (196,526 | ) | | $ | (61,350 | ) | | $ | — |
| | $ | (41,531 | ) | | $ | — |
| | $ | (299,407 | ) | | | | | | |
| ARE equity method accounting investment in 360 Longwood Avenue | | $ | — |
| | $ | 47,390 |
| | $ | — |
| | $ | 1,587 |
| | $ | — |
| | $ | 1,616 |
| | $ | 50,593 |
| | | | | | |
| Total ARE investment | | $ | 167,346 |
| | $ | 610,263 |
| | $ | 127,565 |
| | $ | 131,435 |
| | $ | 47,801 |
| | $ | 35,088 |
| | $ | 1,119,498 |
| | | | | | |
| Total 2014, 2015 and thereafter | | | | | | | | $ | 259,000 |
| | | | $ | 82,889 |
| | | | | | | | |
| |
| (1) | We have a 27.5% equity interest in this unconsolidated joint venture. The joint venture expects the total development costs of the building to aggregate to approximately $350.0 million. As of March 31, 2014, the remaining costs to complete the development are approximately $106.1 million. The joint venture expects to fund these cost primarily from its existing $213.2 million construction loan of which $107.0 million has been drawn and is outstanding as of March 31, 2014. See further discussion of this construction loan on page 46. |
We account for this investment under the equity method of accounting. Our total equity investment was $47.4 million as of March 31, 2014, and we expect to contribute an additional $3.2 million through the completion of the project. The initial stabilized yields related to this project in the above table represent our unlevered yields on our share of the gross real estate in the joint venture, including any outside real estate basis reflected in our equity investment and exclude the impact of any development and management fees. The levered returns on our equity investment are expected to be greater but will be dependent on the terms of any future permanent financing at the joint venture level.
| |
| (2) | In 3Q13, we completed the preliminary design and budget for interior improvements for use by Ariad Pharmaceuticals, Inc. (“Ariad”). Based upon our lease with Ariad, we expected an increase in both estimated NOI and estimated cost at completion, with no significant change in our estimated yields. We expect Ariad to finalize the design and budget for the interior improvements in the future and will provide an update on our estimated cost at completion and targeted yields. |
|
| | |
| ALEXANDRIA REAL ESTATE EQUITIES, INC
ALL RIGHTS RESERVED © 2014 | 27 |
ALEXANDRIA REAL ESTATE EQUITIES, INC.
March 31, 2014
All Current Value-Creation Development Projects in North America
|
| | | | | | |
| Property | 75/125 Binney Street | 499 Illinois Street | 269 East Grand Avenue |
| Submarket/Market | Cambridge/Greater Boston | Mission Bay/San Francisco Bay Area | South San Francisco/San Francisco Bay Area |
| RSF (in progress) | 388,270 | 219,574 | 107,250 |
| Project Type | Development | Development | Development |
| Client Tenants | ARIAD Pharmaceuticals, Inc. | Illumina, Inc./The Regents of the University of California/Medivation, Inc. | Amgen Inc. |
Photograph/
Rendering | | | |
| Property | 430 East 29th Street | 360 Longwood Avenue |
| Submarket/Market | Manhattan/Greater New York City | Longwood Medical Area/Greater Boston |
| RSF (in progress) | 229,627 | 413,536 |
| Project Type | Development | Unconsolidated JV Development |
| Client Tenants | Roche/New York University/Others | Dana-Farber Cancer Institute, Inc. |
Photograph/
Rendering | | |
|
| | |
| ALEXANDRIA REAL ESTATE EQUITIES, INC
ALL RIGHTS RESERVED © 2014 | 28 |
ALEXANDRIA REAL ESTATE EQUITIES, INC.
March 31, 2014
All Current Value-Creation Redevelopment Projects in North America
(Dollars in thousands)
(Unaudited)
|
| | | | | | | | | | | | | | | | | | | | | | | | | | | | | | | | | | |
| | | | | | | | | Leased Status | | Project Start Date | | Initial Occupancy Date | | Stabilized Occupancy Date | |
| | | Project RSF | | Leased | | Negotiating | | Total Leased/Negotiating | | | | |
| Property/Market – Submarket | | In Service | | CIP | | Total | | RSF | | % | | RSF | | % | | RSF | | % | | | | |
| Consolidated redevelopment projects in North America | | | | | | | | | | | | | | | | | | | | | | | | | |
225 Second Avenue/Greater Boston – Route 128 (1) | | — |
| | 112,500 |
| | 112,500 |
| | — |
| | — | % | | 112,500 |
| | 100 | % | | 112,500 |
| | 100 | % | | 1Q14 | | 2Q15 | | 2015 | |
10121 Barnes Canyon Road/San Diego – Sorrento Mesa (2) | | — |
| | 53,512 |
| | 53,512 |
| | 53,512 |
| | 100 | % | | — |
| | — | % | | 53,512 |
| | 100 | % | | 1Q14 | | 3Q14 | | 2014 | |
11055/11065/11075 Roselle Street/San Diego – Sorrento Valley (3) | | — |
| | 55,213 |
| | 55,213 |
| | 41,163 |
| | 75 | % | | — |
| | — | % | | 41,163 |
| | 75 | % | | 4Q13 | | 2Q14 | | 2015 | |
| Consolidated redevelopment projects in North America | | — |
| | 221,225 |
| | 221,225 |
| | 94,675 |
| | 43 | % | | 112,500 |
| | 51 | % | | 207,175 |
| | 94 | % | | | | | | | |
|
| | | | | | | | | | | | | | | | | | | | | | | | | | | |
| | | Investment | | Unlevered | |
| | | | | | | Cost to Complete | | | | | | Initial Stabilized Yield (Cash) | | | |
| Property/Market – Submarket | | March 31, 2014 | | 2014 Funding | | 2015 and Thereafter Funding | | Total at Completion | | Initial Stabilized Yield | | | Average Cash Yield | |
| | In Service | | CIP | | | | | | | |
| Consolidated redevelopment projects in North America | | | | | | | | | | | | | | | | | |
| 225 Second Avenue/Greater Boston – Route 128 | | $ | — |
| | $ | 18,348 |
| | $ | 13,535 |
| | $ | 14,788 |
| | $ | 46,671 |
| | TBD | (4) | TBD | (4) | TBD | (4) |
| 10121 Barnes Canyon Road/San Diego – Sorrento Mesa | | $ | — |
| | $ | 4,258 |
| | $ | 14,015 |
| (5) | $ | — |
| | $ | 18,273 |
| | 7.7% | | 7.7% | | 8.8% | |
| 11055/11065/11075 Roselle Street/San Diego – Sorrento Valley | | $ | — |
| | $ | 11,828 |
| | $ | 4,450 |
| | $ | 2,072 |
| | $ | 18,350 |
| | 7.9% | | 7.8% | | 8.0% | |
| Consolidated redevelopment projects in North America | | $ | — |
| | $ | 34,434 |
| | $ | 32,000 |
| | $ | 16,860 |
| | $ | 83,294 |
| | | | | | | |
| |
| (1) | Acquired in March 2014. |
| |
| (2) | Acquired in July 2013 with an in place lease. This property became vacant in 1Q14, as anticipated, allowing us the opportunity to commence the redevelopment. |
| |
| (3) | Acquired in November 2013. |
| |
| (4) | We expect to provide yield disclosures in the next one to two quarters. |
| |
| (5) | This property is subject to a ground lease. Included in the cost to complete is an estimate of $4.4 million to complete the purchase of the fee interest in the land and improvements. We expect to complete the purchase of the land in 3Q14. |
|
| | |
| ALEXANDRIA REAL ESTATE EQUITIES, INC
ALL RIGHTS RESERVED © 2014 | 29 |
ALEXANDRIA REAL ESTATE EQUITIES, INC.
March 31, 2014
All Current Value-Creation Redevelopment Projects in North America
|
| | | | | | |
| Property | 225 Second Avenue |
| Submarket/Market | Route 128/Greater Boston |
| RSF (in progress) | 112,500 |
| Project Type | Redevelopment |
| Client Tenants | TBD |
Photograph/
Rendering | |
| Property | 10121 Barnes Canyon Road | 11055/11065/11075 Roselle Street |
| Submarket/Market | Sorrento Mesa/San Diego | Sorrento Valley/San Diego |
| RSF (in progress) | 53,512 | 55,213 |
| Project Type | Redevelopment | Redevelopment |
| Client Tenants | ecoATM Inc. | Tandem Diabetes Care, Inc. |
Photograph/
Rendering | | |
|
| | |
| ALEXANDRIA REAL ESTATE EQUITIES, INC
ALL RIGHTS RESERVED © 2014 | 30 |
ALEXANDRIA REAL ESTATE EQUITIES, INC.
March 31, 2014
Near-Term Value-Creation Development Projects and
Future Value-Creation Development Projects in North America
(Dollars in thousands, except per square foot amounts)
(Unaudited)
|
| | | | | | | | | | | | | | | | | | | | | | | | | | | | | | | | | | | | | | |
| | | Land Undergoing Predevelopment Activities (CIP) | | Land Held for Development | | Embedded Land (1) | | Total |
| Property – Market | | Book Value | | Square Feet | | Cost Per Square Foot | | Book Value | | Square Feet | | Cost Per Square Foot | | | Square Feet | | | Book Value | | Square Feet | | Cost Per Square Foot |
| Near-term value-creation development projects | | | | | | | | | | | | | | | | | | | | | | |
| Alexandria Center™ at Kendall Square – Greater Boston: | | | | | | | | | | | | | | | | | | | | | | |
| 50, 60, and 100 Binney Street | | $ | 286,015 |
| | 1,062,180 |
| | $ | 269 |
| | $ | 3,998 |
| | 150,000 |
| | $ | 27 |
| | — | | | $ | 290,013 |
| | 1,212,180 |
| | $ | 239 |
|
3013/3033 Science Park Road – San Diego (2) | | 25,936 |
| | 176,500 |
| (2) | 147 |
| | — |
| | — |
| | — |
| | — | | | 25,936 |
| | 176,500 |
| | 147 |
|
5200 Illumina Way – San Diego (2) | | 15,565 |
| | 392,983 |
| (2) | 40 |
| | — |
| | — |
| | — |
| | — | | | 15,565 |
| | 392,983 |
| | 40 |
|
10300 Campus Point Drive – San Diego (2) | | 4,703 |
| | 140,000 |
| (2) | 34 |
| | — |
| | — |
| | — |
| | — | | | 4,703 |
| | 140,000 |
| | 34 |
|
| 9950 Medical Center Drive – Maryland | | 3,251 |
| | 61,000 |
| | 53 |
| | — |
| | — |
| | — |
| | — | | | 3,251 |
| | 61,000 |
| | 53 |
|
| 124 Terry Avenue North – Seattle | | 6,636 |
| | 200,000 |
| | 33 |
| | — |
| | — |
| | — |
| | — | | | 6,636 |
| | 200,000 |
| | 33 |
|
| 400/416/430 Dexter Avenue North – Seattle | | 12,729 |
| | 253,000 |
| | 50 |
| | — |
| | — |
| | — |
| | — | | | 12,729 |
| | 253,000 |
| | 50 |
|
| 1150/1165/1166 Eastlake Avenue – Seattle | | 16,151 |
| | 106,000 |
| | 152 |
| | 15,248 |
| | 160,266 |
| | 95 |
| | — | | | 31,399 |
| | 266,266 |
| | 118 |
|
| 6 Davis Drive – Research Triangle Park | | 4,804 |
| | 220,000 |
| | 22 |
| | — |
| | — |
| | — |
| | — | | | 4,804 |
| | 220,000 |
| | 22 |
|
| Near-term value-creation development projects | | 375,790 |
| | 2,611,663 |
| | 144 |
| | 19,246 |
| | 310,266 |
| | 62 |
| | — | | | 395,036 |
| | 2,921,929 |
| | 135 |
|
| | | | | | | | | | | | | | | | | | | | | | | |
| Future value-creation development projects | | | | | | | | | | | | | | | | | | | | | | |
Alexandria Technology Square® – Greater Boston | | — |
| | — |
| | — |
| | 7,721 |
| | 100,000 |
| | 77 |
| | — | | | 7,721 |
| | 100,000 |
| | 77 |
|
| Grand Avenue – San Francisco Bay Area | | — |
| | — |
| | — |
| | 43,934 |
| | 397,132 |
| | 111 |
| | — | | | 43,934 |
| | 397,132 |
| | 111 |
|
| Rozzi/Eccles – San Francisco Bay Area | | — |
| | — |
| | — |
| | 73,004 |
| | 514,307 |
| | 142 |
| | — | | | 73,004 |
| | 514,307 |
| | 142 |
|
| Executive Drive/Other – San Diego | | 4,207 |
| | 49,920 |
| | 84 |
| | — |
| | — |
| | — |
| | 279,000 | | | 4,207 |
| | 328,920 |
| | 13 |
|
| East 29th Street – Greater New York City | | — |
| | — |
| | — |
| | — |
| | — |
| | — |
| | 420,000 | | (3) | — |
| | 420,000 |
| | N/A |
|
| Medical Center Drive – Maryland | | — |
| | — |
| | — |
| | 4,572 |
| | 260,721 |
| | 18 |
| | — | | | 4,572 |
| | 260,721 |
| | 18 |
|
| Research Boulevard – Maryland | | — |
| | — |
| | — |
| | 7,076 |
| | 347,000 |
| | 20 |
| | — | | | 7,076 |
| | 347,000 |
| | 20 |
|
| Firstfield Road – Maryland | | — |
| | — |
| | — |
| | 4,056 |
| | 95,000 |
| | 43 |
| | — | | | 4,056 |
| | 95,000 |
| | 43 |
|
| Other | | — |
| | — |
| | — |
| | 32,266 |
| | 1,033,005 |
| | 31 |
| | 486,000 | | | 32,266 |
| | 1,519,005 |
| | 21 |
|
| Future value-creation development projects | | 4,207 |
| | 49,920 |
| | 84 |
| | 172,629 |
| | 2,747,165 |
| | 63 |
| | 1,185,000 | | | 176,836 |
| | 3,982,085 |
| | 44 |
|
| Total value-creation development projects | | $ | 379,997 |
| | 2,661,583 |
| | $ | 143 |
| | $ | 191,875 |
| | 3,057,431 |
| | $ | 63 |
| | 1,185,000 | | | $ | 571,872 |
| | 6,904,014 |
| | $ | 83 |
|
| |
| (1) | Embedded land generally represents adjacent land acquired in connection with the acquisition of operating properties. As a result, the real estate basis attributable to these land parcels is classified in rental properties, net. |
| |
| (2) | See information on pre-leasing and letter of intent negotiations on page 34, 35, and 36. |
| |
| (3) | We hold a right to ground lease a parcel supporting the future ground-up development of approximately 420,000 RSF at the Alexandria Center™ for Life Science pursuant to an option under our ground lease. |
|
| | |
| ALEXANDRIA REAL ESTATE EQUITIES, INC
ALL RIGHTS RESERVED © 2014 | 31 |
ALEXANDRIA REAL ESTATE EQUITIES, INC.
March 31, 2014
Near-Term Value-Creation Development Projects
Greater Boston
|
| | | | | | |
| | | Operating/Development Project | | Near-Term Value-Creation Project | | |
|
| |
| Property | Alexandria Center™ at Kendall Square |
| Submarket/Market | Cambridge/Greater Boston |
| Aerial | |
| Background | Alexandria received final approval from the City of Cambridge to develop the Alexandria Center™ at Kendall Square, a fully integrated campus featuring four world-class laboratory/office and tech office buildings, high-quality amenities, and green space. Alexandria’s entitlement efforts resulted in an increase of 1.1 million developable square feet over the original entitlements in place at acquisition. |
| Near-Term Opportunity | Ground-up development of laboratory/office and tech office buildings at 50, 60, and 100 Binney Street aggregating approximately 1.0 million RSF plus residential projects aggregating 238,000 RSF. Subject to market conditions, we expect to commence development of these projects over the next one to three years as we have demand from existing tenants and demand from tenants in the market. Additionally, we anticipate financing these projects with joint venture capital. We expect to disclose the estimated investment and yields upon commencement of ground-up development. |
|
| | |
| ALEXANDRIA REAL ESTATE EQUITIES, INC
ALL RIGHTS RESERVED © 2014 | 32 |
ALEXANDRIA REAL ESTATE EQUITIES, INC.
March 31, 2014
Near-Term Value-Creation Development Projects
San Francisco Bay Area
|
| | | | | | |
| | | Operating/Development Project | | Near-Term Value-Creation Project | | |
|
| |
| Property | 500 Townsend Street |
| Submarket/Market | SoMa/San Francisco Bay Area |
| Aerial | |
| Background | Alexandria’s 500 Townsend Street project was acquired in April 2014 and represents an expansion of our successful Mission Bay science and technology campus into the SoMa market. The site is ideally located at the corner of Townsend and Sixth Streets, placing it within close proximity to public transportation. The site is also adjacent to one of Interstate 280’s key arrival points into San Francisco and is only blocks from Interstate 80 and the US 101 Freeway. Furthermore, with its highly strategic location at the intersection of Alexandria’s Mission Bay science and technology campus and the SoMa technology district, the 500 Townsend site, and this key cluster expansion, mirrors the convergence of life science, technology, and healthcare occurring with the digital health revolution. |
| Near-Term Opportunity | Ground-up development of a laboratory/office or tech office building aggregating approximately 300,000 gross square feet for either single or multi-tenancy to strategically capture strong demand from high-quality science and digital health companies in our world-class urban campus in the heart of San Francisco. We are in the process of perfecting entitlements, marketing for lease, and subject to market conditions, plan to commence construction as soon as possible in 2015. We expect to disclose the estimated investment and yields upon commencement of ground-up development. |
|
| | |
| ALEXANDRIA REAL ESTATE EQUITIES, INC
ALL RIGHTS RESERVED © 2014 | 33 |
ALEXANDRIA REAL ESTATE EQUITIES, INC.
March 31, 2014
Near-Term Value-Creation Development Projects
San Diego
|
| | | | | | |
| | | Operating | | Near-Term Value-Creation Project | | |
|
| |
| Property | ARE Spectrum |
| Submarket/Market | Torrey Pines/San Diego |
| Aerial | |
| Background | ARE Spectrum is Alexandria’s 335,145 RSF, multi-tenant laboratory/office campus located in Torrey Pines. The existing laboratory/office properties at 3115/3215 Merryfield Road are fully leased to The Scripps Research Institute and a high-quality industrial biotech company. |
| Near-Term Opportunity | At acquisition in April 2012, this site supported the ground-up development of two laboratory/office buildings 3013/3033 Science Park Road aggregating 176,500 RSF for either single or multi-tenancy with the potential that one building be retained for conversion to laboratory/office through redevelopment. In April 2014, we leased 42,047 RSF, or 43%, of 3033 Science Park Road and expect to commence redevelopment in 2Q14. Subject to market conditions, we also expect to commence ground-up construction of 3013 Science Park Road over the next one to three years as we have demand from perspective tenants. We expect to disclose the estimated investment and yields upon commencement of ground-up development and redevelopment. |
|
| | |
| ALEXANDRIA REAL ESTATE EQUITIES, INC
ALL RIGHTS RESERVED © 2014 | 34 |
ALEXANDRIA REAL ESTATE EQUITIES, INC.
March 31, 2014
Near-Term Value-Creation Development Projects
San Diego
|
| | | | | | |
| | | Operating | | Near-Term Value-Creation Project | | |
|
| |
| Property | 5200 Illumina Way |
| Submarket/Market | University Town Center/San Diego |
| Aerial | |
| Background | Alexandria owns and operates the headquarters laboratory/office campus of Illumina, Inc., the leading developer, manufacturer, and marketer of life science tools and integrated systems for large-scale analysis of genetic variation and function with a market capitalization of $19.1 billion as of March 31, 2014. |
| Near-Term Opportunity | Ground-up development of two laboratory/office buildings aggregating 392,983 RSF. We are negotiating a letter of intent with Illumina, Inc. for a new expansion building aggregating 150,000 RSF. We expect to commence construction of this building in 2014. Subject to market conditions, we also expect to commence development of additional buildings over the next one to three years as we expect expansion requirements from Illumina, Inc. We expect to disclose the estimated investment and yields upon commencement of ground-up development. |
|
| | |
| ALEXANDRIA REAL ESTATE EQUITIES, INC
ALL RIGHTS RESERVED © 2014 | 35 |
ALEXANDRIA REAL ESTATE EQUITIES, INC.
March 31, 2014
Near-Term Value-Creation Development Projects
San Diego
|
| | | | | | |
| | | Operating | | Near-Term Value-Creation Project | | |
|
| |
| Property | 10300 Campus Point Drive |
| Submarket/Market | University Town Center/San Diego |
| Aerial | |
| Background | 10300 Campus Point Drive is Alexandria’s flagship 449,759 RSF, multi-tenant laboratory/office campus in University Town Center with additional developable square footage. |
| Near-Term Opportunity | Ground-up development of one or two laboratory/office buildings aggregating approximately 140,000 RSF. We are currently negotiating a letter of intent with an existing tenant for an expansion into the majority of a new building aggregating approximately 140,000 RSF. We expect to commence construction of this building in 2015. We also expect to disclose the estimated investment and yields upon commencement of ground-up development. |
|
| | |
| ALEXANDRIA REAL ESTATE EQUITIES, INC
ALL RIGHTS RESERVED © 2014 | 36 |
ALEXANDRIA REAL ESTATE EQUITIES, INC.
March 31, 2014
Near-Term Value-Creation Development Projects
Maryland
|
| | | | | | |
| | | Operating | | Near-Term Value-Creation Project | | |
|
| |
| Property | 9950 Medical Center Drive |
| Submarket/Market | Rockville/Maryland |
| Aerial | |
| Background | Alexandria’s 9950 Medical Center Drive laboratory/office development is located adjacent to The Shady Grove Life Sciences Center in Rockville, Maryland, home to the U.S. government, numerous life science companies, and universities including the National Institutes of Health, Federal Drug Administration, Medimmune, and Johns Hopkins University. |
| Near-Term Opportunity |
Ground-up development of a laboratory/office building of approximately 61,000 RSF. We have ongoing entitlement efforts for this project to potentially increase the developable square footage by 62,000 RSF for a future additional laboratory/office building. We expect to disclose the estimated investment and yields upon commencement of ground-up development.
|
|
| | |
| ALEXANDRIA REAL ESTATE EQUITIES, INC
ALL RIGHTS RESERVED © 2014 | 37 |
ALEXANDRIA REAL ESTATE EQUITIES, INC.
March 31, 2014
Near-Term Value-Creation Development Projects
Seattle
|
| | | | | | |
| | | Operating | | Near-Term Value-Creation Project | | |
|
| | | |
| Property | 124 Terry Avenue North | Eastlake Avenue | 400/416/430 Dexter Avenue North |
| Submarket/Market | Lake Union/Seattle | Lake Union/Seattle | Lake Union/Seattle |
| Aerial | |
| Background | Alexandria’s Terry Avenue, Eastlake Avenue, and Dexter Avenue assets are located in Lake Union, home to numerous highly renowned medical research institutions, including the Fred Hutchinson Cancer Research Center and the University of Washington, as well as the corporate headquarters for Amazon.com, Inc. |
| Near-Term Opportunity | 124 Terry Avenue North | Eastlake Avenue | 400/416/430 Dexter Avenue North |
| Ground-up mixed-use development of a laboratory/office or tech office building aggregating approximately 200,000 RSF for either single or multi-tenancy, as well as residential space. Subject to market conditions and pre-leasing of the project, we expect to commence construction of this project in 2015. We expect to disclose the estimated investment and yields upon commencement of ground-up development. | Ground-up development of two laboratory/office or tech office buildings aggregating 266,266 RSF for single or multi-tenancy. Subject to market conditions, we expect to commence construction of the 1165 Eastlake Avenue East parcel over the next one to three years as we have a tenant identified for this project. We expect to disclose the estimated investment and yields upon commencement of ground-up development. | Ground-up development of a laboratory/office or tech office building aggregating approximately 253,000 RSF for either single or multi-tenancy. Subject to market conditions, we expect to commence construction of this project over the next one to three years as we have a tenant identified for this project. We expect to disclose the estimated investment and yields upon commencement of ground-up development. |
|
| | |
| ALEXANDRIA REAL ESTATE EQUITIES, INC
ALL RIGHTS RESERVED © 2014 | 38 |
ALEXANDRIA REAL ESTATE EQUITIES, INC.
March 31, 2014
Near-Term Value-Creation Development Projects
Research Triangle Park
|
| | | | | | |
| | | Operating | | Near-Term Value-Creation Project | | |
|
| |
| Property | 6 Davis Drive |
| Submarket/Market | Research Triangle Park/Research Triangle Park |
| Aerial | |
| Background |
Alexandria’s 6 Davis Drive is centrally located in the Research Triangle Park among three world-class research universities, Duke University, University of North Carolina at Chapel Hill, and North Carolina State University. The Research Triangle Park is home to numerous healthcare, life science, agricultural biotechnology, and biopharmaceutical companies such as BASF Corporation, Bayer CropScience, Biogen Idec, Eisai, Inc., Monsanto Corporation, Novartis Vaccines, and Syngenta Biotechnology, Inc.
|
| Near-Term Opportunity | Ground-up development of laboratory/office buildings at 6 Davis Drive aggregating approximately 220,000 RSF for either single or multi-tenancy. Subject to market conditions, we expect to commence construction of this project over the next one to three years as we have demand from existing tenants and demand from tenants in the market. We expect to disclose the estimated investment and yields upon commencement of ground-up development. |
|
| | |
| ALEXANDRIA REAL ESTATE EQUITIES, INC
ALL RIGHTS RESERVED © 2014 | 39 |
ALEXANDRIA REAL ESTATE EQUITIES, INC.
March 31, 2014
Actual and Projected Construction Spending
(Dollars in thousands, except per square foot amounts)
(Unaudited)
|
| | | | | | | | | | | | | | |
| Projected Construction Spending | | Nine Months Ended December 31, 2014 | | 2014 Guidance Range |
| Current value-creation projects in North America: | | | | | | | | | |
| | Development | | $ | 259,000 |
| | | | | | |
| | Redevelopment | | | 32,000 |
| | | | | | |
| | Developments/redevelopments recently transferred to rental properties | | | 38,000 |
| (1) | | | |
| | Generic laboratory infrastructure/building improvement projects | | | 39,000 |
| (2) | | | |
| | | Current value-creation projects in North America | | | | | | 368,000 |
| | | |
| Near-term value-creation projects: | | | | | | | | | |
| | Development | | | 51,000 |
| (3) | | | |
| | Redevelopment | | | 33,000 |
| (4) | | | |
| | Predevelopment | | | 48,000 |
| (5) | | | |
| | | Near-term value-creation projects | | | | | | 132,000 |
| | | |
| Value-creation projects | | | | | | 500,000 |
| | | |
| | Non-revenue-enhancing capital expenditures | | | | | | 10,000 |
| | | |
| Projected construction spending | | | | | $ | 510,000 |
| (6) | $ | 480,000 – 540,000 |
|
| Actual construction spending for the three months ended March 31, 2014 | | | | | | | | | 104,894 |
|
| Guidance range for the year ended December 31, 2014 | | | | | | | | $ | 585,000 – 645,000 |
|
| |
| (1) | Developments/redevelopments recently transferred to rental properties include certain vacancy, generally less than 10% to 20% of the project, that may require additional construction prior to occupancy. For example, our recently delivered redevelopment projects at 4757 Nexus Center Drive, 1616 Eastlake Avenue, 1551 Eastlake Avenue, and 10300 Campus Point Drive generally have 15,000 to 30,000 RSF of value-creation activities to complete in connection with the lease-up and delivery of the space. |
| |
| (2) | Includes, among others, generic infrastructure building improvement projects in North America, including 300 Technology Square, 5810/5820 Nancy Ridge Drive, 8000 Virginia Manor Road, and 44 Hartwell Avenue. |
| |
| (3) | Near-term value-creation development projects include, among others, 5200 Illumina Way, a residential development at the Alexandria Center™ at Kendall Square, and 6 Davis Drive. |
| |
| (4) | Near-term value-creation redevelopment projects include among others, 3033 Science Park Road which was acquired in 2012. |
| |
| (5) | Includes traditional preconstruction costs plus predevelopment costs related to: (i) approximately $15 million of site and infrastructure costs for the 1.2 million RSF related to 50, 60, and 100 Binney Street at the Alexandria Center™ at Kendall Square, including utility access and roads, installation of storm drain systems, infiltration systems, traffic lighting/signals, streets, and sidewalks, and (ii) approximately $4 million related to the design, permitting, and construction drawings related to the 50 and 60 Binney Street site. The infrastructure costs related to 75/125 Binney Street are included in our estimate of cost at completion and initial stabilized yields for that project. |
| |
| (6) | Projected construction spending increased by $20 million primarily due to the redevelopment of 225 Second Avenue, a 112,500 RSF redevelopment project, recently acquired in March 2014. |
|
| | | | | | |
| Actual Construction Spending | | Three Months Ended March 31, 2014 |
| Development – North America | | $ | 56,960 |
|
| Redevelopment – North America | | 24,150 |
|
| Predevelopment | | 8,114 |
|
Generic laboratory infrastructure/building improvement projects in North America (1) | | 13,002 |
|
| Development and redevelopment – Asia | | 2,668 |
|
| Total construction spending | | $ | 104,894 |
|
| |
| (1) | Includes revenue-enhancing projects and amounts shown in the table to the right related to non-revenue-enhancing capital expenditures. |
|
| | | | | | | | | | | |
Non-revenue-enhancing Capital Expenditures, Tenant Improvements, and Leasing Costs (1) | | Three Months Ended March 31, 2014 |
| | Amount | | RSF | | Per RSF |
| Non-revenue-enhancing capital expenditures | | $ | 1,780 |
| | 14,174,958 |
| | $ | 0.13 |
|
| Tenant improvements and leasing costs: | | | | | | |
| Re-tenanted space | | $ | 1,152 |
| | 75,861 |
| | $ | 15.19 |
|
| Renewal space | | 2,901 |
| | 372,440 |
| | 7.79 |
|
| Total tenant improvements and leasing costs | | $ | 4,053 |
| | 448,301 |
| | $ | 9.04 |
|
| |
| (1) | Excludes amounts that are recoverable from client tenants, revenue-enhancing, or related to properties that have undergone redevelopment. |
|
| | |
| ALEXANDRIA REAL ESTATE EQUITIES, INC
ALL RIGHTS RESERVED © 2014 | 40 |
ALEXANDRIA REAL ESTATE EQUITIES, INC.
March 31, 2014
Real Estate Acquisitions
(Dollars in thousands)
(Unaudited)
|
| | | | | | | | | | | | | | | | | | | | | | | | | | | | | |
| | | | | | | | | | | | | | | | | | | | Unlevered |
| Property/Market – Submarket | | Type | | Date Acquired | | Number of Properties | | Purchase Price | | Loan Assumption | | SF | | Leased % | | Negotiating % | | Initial
Stabilized Yield | | Initial
Stabilized Yield (Cash) | | Average Cash Yield |
| 3545 Cray Court/San Diego – Torrey Pines | | Operating | | 1/30/14 | | 1 | | $ | 64,000 |
| | $ | 40,724 |
| (1) | 116,556 |
| | 100 | % | (2) | — | % | | 7.2% | | 7.0% | | 7.2% |
| 4025/4031/4045 Sorrento Valley Boulevard/ San Diego – Sorrento Valley | | Operating | | 3/17/14 | | 3 | | | 12,400 |
| | 7,605 |
| (3) | 42,566 |
| | 100 | % | (2) | — | % | | 8.2% | | 7.8% | | 8.2% |
| 225 Second Avenue/Greater Boston – Route 128 | | Redevelopment | | 3/27/14 | | 1 | | | 16,330 |
| | — |
| | 112,500 |
| | — | % | | 100 | % | | TBD | | TBD | | TBD |
500 Townsend Street/San Francisco Bay Area – SoMa | | Land | | 4/18/14 | | — | | | 50,000 |
| | — |
| | 300,000 |
| | TBD |
| | TBD |
| | TBD | | TBD | | TBD |
| Total | | | | | | 5 | | $ | 142,730 |
| | $ | 48,329 |
| | | | | | | | | | | | |
| | | | | | | | | | | | | | | | | | | | | | | | |
| | | | | | | Low | | | High | | | | | | | | | | | | | | |
| Acquisitions guidance range for the year ended December 31, 2014 | | $100,000 | – | $200,000 |
| | | | | | | | | | | | | | |
| |
| (1) | Secured note payable with a contractual rate of 4.66% and a maturity date of January 1, 2023. |
| |
| (2) | 100% occupied as of March 31, 2014. |
| |
| (3) | Secured note payable with a contractual rate of 5.74% and a maturity date of April 15, 2016. |
|
| | |
| ALEXANDRIA REAL ESTATE EQUITIES, INC
ALL RIGHTS RESERVED © 2014 | 41 |
ALEXANDRIA REAL ESTATE EQUITIES, INC.
March 31, 2014
Asset Sales and Other Sources of Capital
(In thousands)
(Unaudited)
|
| | | | | |
| Description | | Year Ended December 31, 2014 | |
| Projected | | | | |
| Land subject to purchase and sale agreement (at estimated sales price) | | $ | 19,000 |
| |
| Land sales subject to negotiation (at estimated sales price) | | | 6,000 |
| |
Income-producing assets “held for sale” (at net book value) (1) | | | 7,700 |
| |
Additional non-income-producing asset sales/strategic joint venture capital (2) | | | 112,300 – 212,300 |
| |
| Total projected asset sales/strategic joint venture capital for 2014 | | $ | 145,000 – 245,000 |
| |
(1) See results of discontinued operations for the three months ended March 31, 2014, below.
(2) Projected joint venture of non-income-producing assets.
|
| | | | | |
| Discontinued operations | | Three Months Ended March 31, 2014 | |
| Total revenues | | $ | — |
| |
| Operating expenses | | | 162 |
| |
| NOI from discontinued operations | | | (162 | ) | |
| Depreciation expense | | | — |
| |
| Loss from discontinued operations | | $ | (162 | ) | (1) |
| |
| (1) | Loss from discontinued operations, net, includes the results of operations for four operating properties that were classified as |
“held for sale” as of March 31, 2014.
|
| | |
| ALEXANDRIA REAL ESTATE EQUITIES, INC
ALL RIGHTS RESERVED © 2014 | 42 |
ALEXANDRIA REAL ESTATE EQUITIES, INC.
March 31, 2014
Real Estate Investments in Asia
(Unaudited)
|
| | | | | | | | | | | | | | | | | | | |
| | Number of Properties | | ABR (in thousands) | | Occupancy Percentage | | Book Value (in thousands) | | Square Feet | | Per Square Foot |
| Rental properties, net, in China | 2 | | $ | 948 |
| | 63.7 | % | | $ | 56,242 |
| | 471,384 |
| | $ | 119 |
|
| Rental properties, net, in India | 7 | | 4,560 |
| | 72.8 |
| | 52,161 |
| | 431,846 |
| | 121 |
|
| | 9 | | $ | 5,508 |
| | 68.0 | % | | 108,403 |
| | 903,230 |
| | 120 |
|
| | | | | | | | | | | | |
| Construction in progress: | | |
| | |
| | |
|
| Current development projects in China | | 26,108 |
| | 160,694 |
| | 162 |
|
| Current development projects in India | | 33,432 |
| | 304,762 |
| | 110 |
|
| | | | | | | | 59,540 |
| | 465,456 |
| | 128 |
|
| Land held for future development/undergoing predevelopment activities (CIP) in India | | 78,569 |
| | 6,419,707 |
| | 12 |
|
| Total investments in real estate, net, in Asia | | $ | 246,512 |
| | 7,788,393 |
| | $ | 32 |
|
|
| | |
| ALEXANDRIA REAL ESTATE EQUITIES, INC
ALL RIGHTS RESERVED © 2014 | 43 |
ALEXANDRIA REAL ESTATE EQUITIES, INC.
March 31, 2014
Key Credit Metrics
(Unaudited)
|
| | | | |
| Net Debt to Adjusted EBITDA | | Fixed Charge Coverage Ratio | | Unencumbered NOI as a % of Total NOI |
| | | | |
|
| | | |
| Debt Maturity Chart | | Liquidity |
| | |
|
| | |
| ALEXANDRIA REAL ESTATE EQUITIES, INC
ALL RIGHTS RESERVED © 2014 | 44 |
ALEXANDRIA REAL ESTATE EQUITIES, INC.
March 31, 2014
Summary of Debt
(Dollars in thousands)
(Unaudited)
|
| | | | | | | | | | | | | | | | | | | | | | | | | | | | | | | | | | | | |
| | | Stated Rate | | Weighted Average Interest Rate (1) | | Maturity Date (2) | | Principal Payments Remaining for the Period Ending December 31, | | | | |
| Debt | | | | | 2014 | | 2015 | | 2016 | | 2017 | | 2018 | | Thereafter | | Total |
| Secured notes payable | | | | | | | | | | | | | | | | | | | | | | |
| San Diego | | 6.05 | % | | 4.88 | % | | 7/1/14 | (3) | $ | 6,419 |
| | $ | — |
| | $ | — |
| | $ | — |
| | $ | — |
| | $ | — |
| | $ | 6,419 |
|
| San Diego | | 5.39 | | | 4.00 | | | 11/1/14 | | 7,433 |
| | — |
| | — |
| | — |
| | — |
| | — |
| | 7,433 |
|
| Seattle | | 6.00 | | | 6.00 | | | 11/18/14 | | 180 |
| | — |
| | — |
| | — |
| | — |
| | — |
| | 180 |
|
| Maryland | | 5.64 | | | 4.50 | | | 6/1/15 | | 103 |
| | 5,777 |
| | — |
| | — |
| | — |
| | — |
| | 5,880 |
|
| San Francisco Bay Area | | L+1.50 | | | 1.66 | | | 7/1/15 | (4) | — |
| | 46,203 |
| | — |
| | — |
| | — |
| | — |
| | 46,203 |
|
| Greater Boston, San Francisco Bay Area, and San Diego | | 5.73 | | | 5.73 | | | 1/1/16 | | 1,279 |
| | 1,816 |
| | 75,501 |
| | — |
| | — |
| | — |
| | 78,596 |
|
| Greater Boston, San Diego, and Greater New York City | | 5.82 | | | 5.82 | | | 4/1/16 | | 697 |
| | 988 |
| | 29,389 |
| | — |
| | — |
| | — |
| | 31,074 |
|
| San Diego | | 5.74 | | | 3.00 | | | 4/15/16 | | 125 |
| | 175 |
| | 6,916 |
| | — |
| | — |
| | — |
| | 7,216 |
|
| San Francisco Bay Area | | L+1.40 | | | 1.56 | | | 6/1/16 | (5) | — |
| | — |
| | 6,419 |
| | — |
| | — |
| | — |
| | 6,419 |
|
| San Francisco Bay Area | | 6.35 | | | 6.35 | | | 8/1/16 | | 1,851 |
| | 2,652 |
| | 126,715 |
| | — |
| | — |
| | — |
| | 131,218 |
|
| Maryland | | 2.15 | | | 2.15 | | | 1/20/17 | | — |
| | — |
| | — |
| | 76,000 |
| | — |
| | — |
| | 76,000 |
|
| Greater Boston | | L+1.35 | | | 1.51 | | | 8/23/17 | (6) | — |
| | — |
| | — |
| | 44,422 |
| | — |
| | — |
| | 44,422 |
|
| San Diego, Maryland, and Seattle | | 7.75 | | | 7.75 | | | 4/1/20 | | 1,100 |
| | 1,570 |
| | 1,696 |
| | 1,832 |
| | 1,979 |
| | 106,491 |
| | 114,668 |
|
| San Diego | | 4.66 | | | 4.66 | | | 1/1/23 | | 891 |
| | 1,396 |
| | 1,458 |
| | 1,534 |
| | 1,608 |
| | 33,501 |
| | 40,388 |
|
| San Francisco Bay Area | | 6.50 | | | 6.50 | | | 6/1/37 | | 17 |
| | 18 |
| | 19 |
| | 20 |
| | 22 |
| | 751 |
| | 847 |
|
| Unamortized premiums | | | | | | | | | | 270 |
| | 218 |
| | 60 |
| | — |
| | — |
| | — |
| | 548 |
|
| Secured notes payable average/subtotal | | 5.06 | % | | 4.98 | | | | | 20,365 |
| | 60,813 |
| | 248,173 |
| | 123,808 |
| | 3,609 |
| | 140,743 |
| | 597,511 |
|
| | | | | | | | | | | | | | | | | | | | | | | |
| 2016 Unsecured Senior Bank Term Loan | | L+1.20 | % | | 1.40 | | | 7/31/16 | | — |
| | — |
| | 500,000 |
| | — |
| | — |
| | — |
| | 500,000 |
|
| 2019 Unsecured Senior Bank Term Loan | | L+1.20 | % | | 2.05 | | | 1/3/19 | | — |
| | — |
| | — |
| | — |
| | — |
| | 600,000 |
| | 600,000 |
|
| $1.5 billion unsecured senior line of credit | | L+1.10 | % | (7) | 1.25 | | | 1/3/19 | | — |
| | — |
| | — |
| | — |
| | — |
| | 506,000 |
| | 506,000 |
|
| Unsecured senior notes payable | | 4.60 | % | | 4.61 | | | 4/1/22 | | — |
| | — |
| | — |
| | — |
| | — |
| | 550,000 |
| | 550,000 |
|
| Unsecured senior notes payable | | 3.90 | % | | 3.94 | | | 6/15/23 | | — |
| | — |
| | — |
| | — |
| | — |
| | 500,000 |
| | 500,000 |
|
| Unamortized discounts | | | | | | | | | | (123 | ) | | (170 | ) | | (176 | ) | | (184 | ) | | (192 | ) | | (885 | ) | | (1,730 | ) |
| Unsecured debt average/subtotal | | | | | 2.66 | | | | | (123 | ) | | (170 | ) | | 499,824 |
| | (184 | ) | | (192 | ) | | 2,155,115 |
| | 2,654,270 |
|
| Average/total | | | | | 3.09 | % | | | | $ | 20,242 |
| | $ | 60,643 |
| | $ | 747,997 |
| | $ | 123,624 |
| | $ | 3,417 |
| | $ | 2,295,858 |
| | $ | 3,251,781 |
|
| | | | | | | | | | | | | | | | | | | | | | | |
| Balloon payments | | | | | | | | | | $ | 13,722 |
| | $ | 51,919 |
| | $ | 743,364 |
| | $ | 120,422 |
| | $ | — |
| | $ | 2,286,611 |
| | $ | 3,216,038 |
|
| Principal amortization | | | | | | | | | | 6,520 |
| | 8,724 |
| | 4,633 |
| | 3,202 |
| | 3,417 |
| | 9,247 |
| | 35,743 |
|
| Total consolidated debt | | | | | | | | | | $ | 20,242 |
| | $ | 60,643 |
| | $ | 747,997 |
| | $ | 123,624 |
| | $ | 3,417 |
| | $ | 2,295,858 |
| | $ | 3,251,781 |
|
| | | | | | | | | | | | | | | | | | | | | | | |
| Fixed-rate/hedged variable-rate debt | | | | | | | | | | $ | 20,062 |
| | $ | 14,440 |
| | $ | 591,578 |
| | $ | 3,202 |
| | $ | 3,417 |
| | $ | 1,789,858 |
| | $ | 2,422,557 |
|
| Unhedged variable-rate debt | | | | | | | | | | 180 |
| | 46,203 |
| | 156,419 |
| | 120,422 |
| | — |
| | 506,000 |
| | 829,224 |
|
| Total consolidated debt | | | | | | | | | | $ | 20,242 |
| | $ | 60,643 |
| | $ | 747,997 |
| | $ | 123,624 |
| | $ | 3,417 |
| | $ | 2,295,858 |
| | $ | 3,251,781 |
|
| |
| (1) | Represents the weighted average contractual interest rate as of the end of the period plus the impact of debt premiums/discounts and our interest rate swap agreements. The weighted average interest rate excludes bank fees and amortization of loan fees. |
| |
| (2) | Includes any extension options that we control. |
| |
| (3) | Secured note payable was repaid on April 2, 2014. |
| |
| (4) | Secured construction loan with aggregate commitments of $55.0 million. We have two, one-year options to extend the stated maturity date to July 1, 2017, subject to certain conditions. |
| |
| (5) | Secured construction loan with aggregate commitments of $36.0 million. We have two, one-year options to extend the stated maturity date to June 1, 2018, subject to certain conditions. |
| |
| (6) | Secured construction loan with aggregate commitments of $250.4 million. We have a one-year option to extend the stated maturity date to August 23, 2018, subject to certain conditions. |
| |
| (7) | In addition to the stated rate, the unsecured senior line of credit is subject to an annual facility fee of 0.20%. |
|
| | |
| ALEXANDRIA REAL ESTATE EQUITIES, INC
ALL RIGHTS RESERVED © 2014 | 45 |
ALEXANDRIA REAL ESTATE EQUITIES, INC.
March 31, 2014
Summary of Debt
(Dollars in thousands)
(Unaudited)
|
| | | | | | | | | | | | | | | | | | | |
Fixed rate/hedged and unhedged variable rate debt
|
| | Fixed Rate/Hedged Variable Rate | | Unhedged Variable Rate (1) | | Total Consolidated | | Percentage of Total | | Weighted Average Interest Rate at End of Period (2) | | Weighted Average Remaining Term (in years) |
| Secured notes payable | $ | 424,287 |
| | $ | 173,224 |
| | $ | 597,511 |
| | 18.4 | % | | 4.98 | % | | 3.4 |
| Unsecured senior notes payable | 1,048,270 |
| | — |
| | 1,048,270 |
| | 32.1 |
| | 4.29 |
| | 8.6 |
| $1.5 billion unsecured senior line of credit | — |
| | 506,000 |
| | 506,000 |
| | 15.6 |
| | 1.25 |
| | 4.8 |
| 2016 Unsecured Senior Bank Term Loan | 350,000 |
| | 150,000 |
| | 500,000 |
| | 15.4 |
| | 1.40 |
| | 2.3 |
| 2019 Unsecured Senior Bank Term Loan | 600,000 |
| | — |
| | 600,000 |
| | 18.5 |
| | 2.05 |
| | 4.8 |
| Total/weighted average | $ | 2,422,557 |
| | $ | 829,224 |
| | $ | 3,251,781 |
| | 100.0 | % | | 3.09 | % | | 5.4 |
| Percentage of total debt | 74% |
| | 26% |
| (1) | 100% |
| | | | | | |
| |
| (1) | We anticipate issuing fixed rate unsecured notes in 2014 which will reduce our unhedged variable rate debt as a percentage of total debt. |
| |
| (2) | Represents the weighted average contractual interest rate as of the end of the period plus the impact of debt premiums/discounts and our interest rate swap agreements. The weighted average interest rate excludes bank fees and amortization of loan fees. |
|
|
| Unconsolidated joint venture debt summary |
The following table presents information related to debt held by our unconsolidated joint venture as of March 31, 2014:
|
| | | | | | | | | | | | | | | | | | | | |
| Loan Collateral | | ARE JV Ownership Percentage | | Total Outstanding | | ARE Share | | Third Party Share | | Maturity Date | | Interest Rate |
| 360 Longwood Avenue | | 27.5% | | $ | 107,011 |
| (1) | $ | 29,428 |
| | $ | 77,583 |
| | | 4/1/2017 | (2) | | 5.25% |
| |
| (1) | Secured construction loan with an aggregate commitment of $213.2 million and bears interest at LIBOR +3.75%, with a floor of 5.25%. |
| |
| (2) | We have two, one-year options to extend the stated maturity date to April 1, 2019, subject to certain conditions. |
|
| | | | | | | | |
| Debt covenants | | Unsecured Senior Notes Payable | | Unsecured Senior Line of Credit and Unsecured Senior Bank Term Loans |
| Debt Covenant Ratios | | Requirement | | Actual | | Requirement | | Actual |
| Total Debt to Total Assets | ≤ 60% | | 37% | | ≤ 60.0% | | 33.7% |
| Secured Debt to Total Assets | ≤ 40% | | 7% | | ≤ 45.0% | | 6.2% |
| Consolidated EBITDA to Interest Expense | ≥ 1.5x | | 6.8x | | ≥ 1.50x | | 2.80x |
| Unencumbered Total Asset Value to Unsecured Debt | ≥ 150% | | 268% | | N/A | | N/A |
| Unsecured Leverage Ratio | N/A | | N/A | | ≤ 60.0% | | 36.6% |
| Unsecured Interest Coverage Ratio | N/A | | N/A | | ≥ 1.50x | | 9.03x |
|
| | | | | | | | | | | | | | | | | | | | | | | | | | |
Summary of interest rate swap agreements
| | Number of Contracts | | Weighted Average Interest Pay Rate (1) | | Fair Value as of 3/31/14 | | Notional Amount in Effect as of |
| Effective Date | | Maturity Date | | | | | 3/31/14 | | 12/31/14 | | 12/31/15 | | 12/31/16 |
| December 31, 2013 | | December 31, 2014 | | 2 | | 0.98% | | $ | (3,090 | ) | | $ | 500,000 |
| | $ | — |
| | $ | — |
| | $ | — |
|
| December 31, 2013 | | March 31, 2015 | | 2 | | 0.23% | | (126 | ) | | 250,000 |
| | 250,000 |
| | — |
| | — |
|
| March 31, 2014 | | March 31, 2015 | | 4 | | 0.21% | | (48 | ) | | 200,000 |
| | 200,000 |
| | — |
| | — |
|
| December 31, 2014 | | March 31, 2016 | | 3 | | 0.53% | | 394 |
| | — |
| | 500,000 |
| | 500,000 |
| | — |
|
| March 31, 2016 | | March 31, 2017 | | 3 | | 1.40% | | 1,651 |
| | — |
| | — |
| | — |
| | 500,000 |
|
| Total | | | | | | | | $ | (1,219 | ) | | $ | 950,000 |
| | $ | 950,000 |
| | $ | 500,000 |
| | $ | 500,000 |
|
| |
| (1) | In addition to the interest pay rate, borrowings outstanding as of March 31, 2014, under our unsecured senior bank term loans include an applicable margin of 1.20% and borrowings outstanding under our unsecured senior line of credit include an applicable margin of 1.10%. |
|
| | |
| ALEXANDRIA REAL ESTATE EQUITIES, INC
ALL RIGHTS RESERVED © 2014 | 46 |
ALEXANDRIA REAL ESTATE EQUITIES, INC.
March 31, 2014
Definitions and Other Information
(Unaudited)
This section contains additional information for sections throughout this supplemental information package as well as explanations of certain non-GAAP financial measures and the reasons why we use these supplemental measures of performance. Additional detail can be found in our most recent annual report on Form 10-K and subsequent quarterly reports on Form 10-Q, as well as other documents filed with or furnished to the SEC from time to time.
Adjusted EBITDA
The following table reconciles net income, the most directly comparable financial measure calculated and presented in accordance with GAAP, to EBITDA and Adjusted EBITDA:
|
| | | | | | | | | | | | | | | | | | | |
| | Three Months Ended |
| (In thousands) | 3/31/2014 | | 12/31/2013 | | 9/30/2013 | | 6/30/2013 | | 3/31/2013 |
| Net income | $ | 40,749 |
| | $ | 44,222 |
| | $ | 32,453 |
| | $ | 33,337 |
| | $ | 30,237 |
|
| Interest expense | 19,123 |
| | 17,783 |
| | 16,171 |
| | 15,978 |
| | 18,020 |
|
| Depreciation and amortization – continuing operations | 50,421 |
| | 48,084 |
| | 48,866 |
| | 46,344 |
| | 45,829 |
|
| Depreciation and amortization – discontinued operations | — |
| | 17 |
| | 236 |
| | 236 |
| | 1,166 |
|
| EBITDA | 110,293 |
| | 110,106 |
| | 97,726 |
| | 95,895 |
| | 95,252 |
|
| Stock compensation expense | 3,228 |
| | 4,011 |
| | 3,729 |
| | 4,463 |
| | 3,349 |
|
| Loss on early extinguishment of debt | — |
| | — |
| | 1,432 |
| | 560 |
| | — |
|
| (Gain) loss on sale of real estate | — |
| | — |
| | — |
| | (219 | ) | | 340 |
|
| Gain on sale of land parcel | — |
| | (4,052 | ) | | — |
| | (772 | ) | | — |
|
| Impairment of investments | — |
| | 853 |
| | — |
| | — |
| | — |
|
| Deal costs | — |
| | 1,446 |
| | — |
| | — |
| | — |
|
| Adjusted EBITDA | $ | 113,521 |
| | $ | 112,364 |
| | $ | 102,887 |
| | $ | 99,927 |
| | $ | 98,941 |
|
EBITDA represents earnings before interest, taxes, depreciation, and amortization (“EBITDA”), a non-GAAP financial measure, and is used by us and others as a supplemental measure of performance. We use adjusted EBITDA (“Adjusted EBITDA”) to assess the performance of our core operations, for financial and operational decision making, and as a supplemental or additional means of evaluating period-to-period comparisons on a consistent basis. Adjusted EBITDA is calculated as EBITDA, excluding net stock compensation expense, gains or losses on early extinguishment of debt, gains or losses on sales of real estate and land parcels, deal costs, and impairments. We believe Adjusted EBITDA provides investors relevant and useful information because it permits investors to view income from our operations on an unleveraged basis before the effects of taxes, depreciation and amortization, net stock compensation expense, gains or losses on early extinguishment of debt, gains or losses on sales of real estate and land parcels, deal costs, and impairments. By excluding interest expense and gains or losses on early extinguishment of debt, EBITDA and Adjusted EBITDA allow investors to measure our performance independent of our capital structure and indebtedness and, therefore, allow for a more meaningful comparison of our performance to that of other companies, both in the real estate industry and in other industries. We believe that excluding charges related to share-based compensation facilitates a comparison of our operations across periods and among other equity REITs without the variances caused by different valuation methodologies, the volatility of the expense (which depends on market forces outside our control), and the assumptions and the variety of award types that a company can use. We believe that adjusting for the effects of gains or losses on sales of real estate and land
parcels, deal costs, and impairments provides useful information by excluding certain items that are not representative of our core operating results. These items are dependent upon historical costs, and are subject to judgmental inputs and the timing of our decisions. EBITDA and Adjusted EBITDA have limitations as measures of our performance. EBITDA and Adjusted EBITDA do not reflect our historical cash expenditures or future cash requirements for capital expenditures or contractual commitments. While EBITDA and Adjusted EBITDA are relevant and widely used measures of performance, they do not represent net income or cash flows from operations as defined by GAAP, and they should not be considered as alternatives to those indicators in evaluating performance or liquidity. Further, our computation of EBITDA and Adjusted EBITDA may not be comparable to similar measures reported by other companies.
Adjusted EBITDA margins
We calculate Adjusted EBITDA margins by dividing Adjusted EBITDA by total revenues. Because our total revenues exclude revenues from discontinued operations, for the purposes of calculating the margin ratio, we exclude the Adjusted EBITDA generated by our discontinued operations for each period presented. We believe excluding Adjusted EBITDA for discontinued operations improves the consistency and comparability of the Adjusted EBITDA margins from period to period. The following table reconciles Adjusted EBITDA to Adjusted EBITDA – excluding discontinued operations:
|
| | | | | | | | | | | | | | | | | | | |
| | Three Months Ended |
| (Dollars in thousands) | 3/31/2014 | | 12/31/2013 | | 9/30/2013 | | 6/30/2013 | | 3/31/2013 |
| Adjusted EBITDA | $ | 113,521 |
| | $ | 112,364 |
| | $ | 102,887 |
| | $ | 99,927 |
| | $ | 98,941 |
|
| Add back: operating loss (income) from discontinued operations | 162 |
| | 126 |
| | (193 | ) | | (266 | ) | | (2,343 | ) |
| Adjusted EBITDA – excluding discontinued operations | $ | 113,683 |
| | $ | 112,490 |
| | $ | 102,694 |
| | $ | 99,661 |
| | $ | 96,598 |
|
| Total revenues | $ | 176,186 |
| | $ | 168,823 |
| | $ | 158,315 |
| | $ | 153,930 |
| | $ | 150,083 |
|
| Adjusted EBITDA margins | 65% |
| | 67% |
| | 65% |
| | 65% |
| | 64% |
|
|
| | |
| ALEXANDRIA REAL ESTATE EQUITIES, INC
ALL RIGHTS RESERVED © 2014 | 47 |
ALEXANDRIA REAL ESTATE EQUITIES, INC.
March 31, 2014
Definitions and Other Information (continued)
(Unaudited)
Adjusted funds from operations
Adjusted funds from operations (“AFFO”) is a non-GAAP financial measure that we use as a supplemental measure of our performance. We compute AFFO by adding to or deducting from FFO, as adjusted: (1) maintenance building improvements, and non-revenue-enhancing tenant improvements and leasing commissions (excludes development and redevelopment expenditures); (2) effects of straight-line rent and straight-line rent on ground leases; (3) capitalized income from development projects; (4) amortization of acquired above and below market leases, loan fees, and debt premiums/discounts; (5) stock compensation expense; and (6) allocation of AFFO attributable to unvested restricted stock awards.
We believe that AFFO is a useful supplemental performance measure because it further adjusts to: (1) deduct certain expenditures that, although capitalized and classified in depreciation expense, do not enhance the revenue or cash flows of our properties; (2) eliminate the effect of straight-lining our rental income and capitalizing income from development projects in order to reflect the actual amount of contractual rents due in the period presented; and (3) eliminate the effect of items that are not indicative of our core operations and do not actually reduce the amount of cash generated by our operations. We believe that eliminating the effect of charges related to share-based compensation facilitates a comparison of our operations across periods and among other equity REITs without the variances caused by different valuation methodologies, the volatility of the expense (which depends on market forces outside our control), and the assumptions and the variety of award types that a company can use. We believe that AFFO provides useful information by excluding certain items that are not representative of our core operating results because such items are dependent upon historical costs or subject to judgmental valuation inputs and the timing of our decisions.
AFFO is not intended to represent cash flow for the period, and is intended only to provide an additional measure of performance. We believe that net income attributable to Alexandria’s common stockholders is the most directly comparable GAAP financial measure to AFFO. We believe that AFFO is a widely recognized measure of the operations of equity REITs, and presenting AFFO will enable investors to assess our performance in comparison to other equity REITs. However, other equity REITs may use different methodologies for calculating AFFO and, accordingly, our AFFO may not be comparable to AFFO calculated by other equity REITs. AFFO should not be considered as an alternative to net income (determined in accordance with GAAP) as an indication of financial performance, or to cash flows from operating activities (determined in accordance with GAAP) as a measure of our liquidity, nor is it indicative of funds available to fund our cash needs, including our ability to make distributions.
Annualized base rent
Annualized base rent means the annualized fixed base rental amount in effect as of the end of the period, related to our operating rentable square feet (using rental revenue computed on a straight-line basis in accordance with GAAP).
Average cash yield
See definition of Initial Stabilized Yield (unlevered).
Capitalized interest
See Construction in Progress/Current Value-Creation Projects below for further discussion.
Cash interest
Cash interest is equal to interest expense calculated in accordance with GAAP, plus capitalized interest, less amortization of loan fees and debt premiums/discounts. See page 49 for a reconciliation of interest expense, the most directly comparable GAAP financial measure, to cash interest.
Construction in progress/current value-creation projects
Current value-creation development/current redevelopment projects
A key component of our business model is our value-creation development and redevelopment projects. These programs are focused on providing high-quality, generic, and reusable science and technology space to meet the real estate requirements of and are reusable by a wide range of client tenants. Upon completion, each value-creation project is expected to generate significant revenues and cash flows. Our development and redevelopment projects are generally in locations that are highly desirable to life science entities, which we believe results in higher occupancy levels, longer lease terms, and higher rental income and returns. Development projects consist of the ground-up development of generic and reusable facilities. We generally will not commence new development projects for above-ground construction of Class A science and technology space without first securing pre-leasing for such space except when there is significant market demand for high-quality Class A facilities. Redevelopment projects consist of the permanent change in use of office, warehouse, and shell space into generic science and technology space.
We also have certain significant value-creation projects undergoing important and substantial predevelopment activities to bring these assets to their intended use. These critical activities add significant value and are required for the construction of buildings. The projects will provide high-quality facilities and are expected to generate significant revenue and cash flows for the Company. In accordance with GAAP, we capitalize project costs clearly related to the construction, development, and redevelopment as a cost of the project. Indirect project costs such as construction administration, legal fees, and office costs that clearly relate to projects under construction, development, and redevelopment are also capitalized as a cost of the project. We capitalize project costs only during periods in which activities necessary to prepare an asset for its intended use are in progress. We also capitalize interest cost as a cost of the project only during the period for which activities necessary to prepare an asset for its intended use are ongoing, provided that expenditures for the asset have been made and interest cost is incurred. Additionally, should activities necessary to prepare an asset for its intended use cease, interest, taxes, insurance, and certain other direct project costs related to these assets would be expensed as incurred.
|
| | |
| ALEXANDRIA REAL ESTATE EQUITIES, INC
ALL RIGHTS RESERVED © 2014 | 48 |
ALEXANDRIA REAL ESTATE EQUITIES, INC.
March 31, 2014
Definitions and Other Information (continued)
(Unaudited)
Dividend payout ratio
Dividend payout ratio (common stock) is the ratio of the absolute dollar amount of dividends on our common stock (shares of common stock outstanding on the respective record date multiplied by the related dividend per share) to FFO attributable to Alexandria’s common stockholders on a diluted basis, as adjusted.
Dividend yield
Dividend yield for the quarter represents the annualized quarter dividend divided by the closing common stock price at the end of the quarter.
Fixed charge coverage ratio
The fixed charge coverage ratio is the ratio of Adjusted EBITDA to fixed charges. This ratio is useful to investors as a supplemental measure of our ability to satisfy fixed financing obligations and preferred stock dividends. The following table presents a reconciliation of interest expense, the most directly comparable GAAP financial measure to cash interest and fixed charges:
|
| | | | | | | | | | | | | | | | | | | |
| | Three Months Ended |
| (Dollars in thousands) | 3/31/2014 | | 12/31/2013 | | 9/30/2013 | | 6/30/2013 | | 3/31/2013 |
| Adjusted EBITDA | $ | 113,521 |
| | $ | 112,364 |
| | $ | 102,887 |
| | $ | 99,927 |
| | $ | 98,941 |
|
| | | | | | | | | | |
| Interest expense | $ | 19,123 |
| | $ | 17,783 |
| | $ | 16,171 |
| | $ | 15,978 |
| | $ | 18,020 |
|
| Add: capitalized interest | 12,013 |
| | 14,116 |
| | 16,788 |
| | 15,690 |
| | 14,021 |
|
| Less: amortization of loan fees | (2,561 | ) | | (2,636 | ) | | (2,487 | ) | | (2,427 | ) | | (2,386 | ) |
| Less: amortization of debt premium/discounts | (205 | ) | | (146 | ) | | (153 | ) | | (115 | ) | | (115 | ) |
| Cash interest | 28,370 |
| | 29,117 |
| | 30,319 |
| | 29,126 |
| | 29,540 |
|
| Dividends on preferred stock | 6,471 |
| | 6,471 |
| | 6,472 |
| | 6,471 |
| | 6,471 |
|
| Fixed charges | $ | 34,841 |
| | $ | 35,588 |
| | $ | 36,791 |
| | $ | 35,597 |
| | $ | 36,011 |
|
| Fixed charge coverage ratio – quarter annualized | 3.3x |
| | 3.2x |
| | 2.8x |
| | 2.8x |
| | 2.7x |
|
| Fixed charge coverage ratio – trailing 12 months | 3.0x |
| | 2.9x |
| | 2.8x |
| | 2.7x |
| | 2.7x |
|
Funds from operations and funds from operations, as adjusted
GAAP basis accounting for real estate assets utilizes historical cost accounting and assumes that real estate values diminish over time. In an effort to overcome the difference between real estate values and historical cost accounting for real estate assets, the Board of Governors of the National Association of Real Estate Investment Trusts (“NAREIT”) established the measurement tool of funds from operations (“FFO”). Since its introduction, FFO has become a widely used non-GAAP financial measure among equity REITs. We believe that FFO is helpful to investors as an additional measure of the performance of an equity REIT. Moreover, we believe that FFO, as adjusted, is also helpful because it allows investors to compare our performance to the performance of other real estate companies between periods, and on a consistent basis, without having to account for differences caused by investment and disposition decisions, financing decisions, terms of securities, capital structures, and capital market transactions. We compute FFO in accordance with standards established by the Board of Governors of NAREIT in its April 2002 White Paper and related implementation guidance (“NAREIT White Paper”). The NAREIT White Paper defines FFO as net income (computed in accordance with GAAP), excluding gains (losses) from sales of depreciable real estate and land parcels and impairments of depreciable real estate (excluding land parcels), plus real estate related depreciation and amortization, and after adjustments for unconsolidated partnerships and joint ventures. Impairments of real estate relate to decreases in the estimated fair value of real estate due to changes in general market conditions and do not necessarily reflect the operating performance of the properties during the corresponding period. Impairments of real estate represent the write-down of assets when fair value over the recoverability period is less than the carrying value. We compute FFO, as adjusted, as FFO calculated in accordance with the NAREIT White Paper, plus losses on early extinguishment of debt, preferred stock redemption charges, impairments of land parcels, impairments of investments, and deal costs, less realized gain on equity investment primarily related to one non-tenant life science entity, and the amount of such items that is allocable to our unvested restricted stock awards. Our calculations of both FFO and FFO, as adjusted, may differ from those methodologies utilized by other equity REITs for similar performance measurements, and, accordingly, may not be comparable to those of other equity REITs. Neither FFO nor FFO, as adjusted, should be considered as an alternative to net income (determined in accordance with GAAP) as an indication of financial performance, or to cash flows from operating activities (determined in accordance with GAAP) as a measure of liquidity, nor are they indicative of the availability of funds for our cash needs, including funds available to make distributions.
|
| | |
| ALEXANDRIA REAL ESTATE EQUITIES, INC
ALL RIGHTS RESERVED © 2014 | 49 |
ALEXANDRIA REAL ESTATE EQUITIES, INC.
March 31, 2014
Definitions and Other Information (continued)
(Unaudited)
Future value-creation projects
Land held for future development
All predevelopment efforts have been advanced to appropriate stages and no further predevelopment activities are ongoing and therefore, interest, property taxes, and other costs related to these assets are expensed as incurred. We generally will not commence new development projects for aboveground construction of Class A science and technology space without first securing pre-leasing for such space, except when there is significant market demand for high-quality facilities.
Land undergoing predevelopment activities (CIP)
Land undergoing predevelopment activities is classified as construction in progress and is undergoing activities prior to commencement of construction of aboveground building improvements. We generally will not commence ground-up development of any parcels undergoing predevelopment activities without first securing pre-leasing for such space, except when there is significant market demand for high-quality facilities. If aboveground construction is not initiated at completion predevelopment activities, the land parcel will be classified as land held for future development. Our objective with predevelopment is to reduce the time it takes to deliver projects to prospective client tenants. The largest project included in land undergoing predevelopment consists of our 1.2 million developable square feet at the Alexandria Center™ at Kendall Square in East Cambridge, Massachusetts.
We are required to capitalize project costs, including interest, property taxes, insurance, and other costs directly related and essential to the development or construction of a project during periods when activities necessary to prepare an asset for its intended use are in progress. Predevelopment costs generally include the following activities prior to commencement of vertical construction:
| |
| Ÿ | Traditional preconstruction costs including entitlement, design, construction drawings, Building Information Modeling (3-D virtual modeling), budgeting, sustainability and energy optimization reviews, permitting, and planning for all aspects of the project. |
| |
| Ÿ | Site and infrastructure construction costs including belowground site work, utility connections, land grading, drainage, egress and regress access points, foundation, and other costs to prepare the site for construction of aboveground building improvements. For example, site and infrastructure costs for the 1.2 million RSF primarily related to 50, 60, and 100 Binney Street of the Alexandria Center™ at Kendall Square are classified as predevelopment prior to commencement of vertical construction. |
Gross assets
Gross assets are equal to total assets plus accumulated depreciation, less cash, cash equivalents, and restricted cash.
Initial stabilized yield (unlevered)
Initial stabilized yield is calculated as the quotient of the estimated amounts of NOI and our investment in the property. Our initial stabilized yield excludes the impact of leverage. Our cash rents related to our value-creation projects are expected to increase over time and our average cash yields are expected, in general, to be greater than our initial stabilized yields on a cash basis. Our estimates for initial yields and initial yields on a cash basis, and total costs at completion, represent our initial estimates at the commencement of the project. We expect to update this information upon completion of the project, or sooner if there are significant changes to the expected project yields or costs.
| |
| Ÿ | Initial stabilized yield: reflects cash rents, including contractual rent escalations and any rent concessions over the term(s) of the lease(s), calculated on a straight-line basis. |
| |
| Ÿ | Initial stabilized yield – cash basis: reflects cash rents at the stabilization date after initial rental concessions, if any, have elapsed. |
Average cash yield reflects cash rents, including contractual rent escalations after initial rental concessions have elapsed, calculated on a straight-line basis.
Net debt
Net debt is equal to the sum of total consolidated debt, less cash and cash equivalents, and restricted cash.
NOI
The following table reconciles total NOI to income from continuing operations:
|
| | | | | | | | |
| | | Three Months Ended March 31, |
| | | 2014 | | 2013 |
| Total NOI (see details on page 15) | | $ | 123,679 |
| | $ | 104,897 |
|
| Other expenses: | | | | |
| General and administrative | | 13,224 |
| | 11,648 |
|
| Interest | | 19,123 |
| | 18,020 |
|
| Depreciation and amortization | | 50,421 |
| | 45,829 |
|
| Total other expenses | | 82,768 |
| | 75,497 |
|
| Income from continuing operations | | $ | 40,911 |
| | $ | 29,400 |
|
NOI is a non-GAAP financial measure equal to income from continuing operations, the most directly comparable GAAP financial measure, excluding loss (gain) on early extinguishment of debt, impairment of land parcel, depreciation and amortization, interest expense, and general and administrative expense. We believe NOI provides useful information to investors regarding our financial condition and results of operations because it reflects primarily those income and expense items that are incurred at the property level. Therefore, we believe NOI is a useful measure for evaluating the operating performance of our real estate assets. NOI on a cash basis is NOI, adjusted to exclude the effect of straight-line rent adjustments required by GAAP. We believe that NOI on a cash basis is helpful to investors as an additional measure of operating performance because it eliminates straight-line rent adjustments to rental revenue.
|
| | |
| ALEXANDRIA REAL ESTATE EQUITIES, INC
ALL RIGHTS RESERVED © 2014 | 50 |
ALEXANDRIA REAL ESTATE EQUITIES, INC.
March 31, 2014
Definitions and Other Information (continued)
(Unaudited)
NOI (continued)
Further, we believe NOI is useful to investors as a performance measure, because when compared across periods, NOI reflects the impact on operations from trends in occupancy rates, rental rates, and operating costs, providing perspective not immediately apparent from income from continuing operations. NOI excludes certain components from income from continuing operations in order to provide results that are more closely related to the results of operations of our properties. For example, interest expense is not necessarily linked to the operating performance of a real estate asset and is often incurred at the corporate level rather than at the property level. In addition, depreciation and amortization, because of historical cost accounting and useful life estimates, may distort operating performance at the property level. Real estate impairments have been excluded in deriving NOI because we do not consider impairment losses to be property level operating expenses. Real estate impairment losses relate to changes in the values of our assets and do not reflect the current operating performance with respect to related revenues or expenses. Our real estate impairments represent the write down in the value of the assets to the estimated fair value less cost to sell. These impairments result from investing decisions and the deterioration in market conditions that adversely impact underlying real estate values. Our calculation of NOI also excludes charges incurred from changes in certain financing decisions, such as losses on early extinguishment of debt, as these charges often relate to the timing of corporate strategy. Property operating expenses that are included in determining NOI consist of costs that are related to our operating properties, such as utilities, repairs and maintenance, rental expense related to ground leases, contracted services, such as janitorial, engineering, and landscaping, property taxes and insurance, and property level salaries. General and administrative expenses consist primarily of accounting and corporate compensation, corporate insurance, professional fees, office rent, and office supplies that are incurred as part of corporate office management. NOI presented by us may not be comparable to NOI reported by other equity REITs that define NOI differently. We believe that in order to facilitate a clear understanding of our operating results, NOI should be examined in conjunction with income from continuing operations as presented in our condensed consolidated statements of income. NOI should not be considered as an alternative to income from continuing operations as an indication of our performance, or as an alternative to cash flows as a measure of liquidity, or our ability to make distributions.
Same property comparisons
As a result of changes within our total property portfolio during the comparative periods presented, including assets acquired, properties placed into redevelopment and development, and projects delivered into operations from redevelopment and development, the consolidated total rental revenues, tenant recoveries and rental operating expenses in our operating results can show significant changes from period to period. In order to supplement an evaluation of our results of operations over a given period, we analyze the operating performance for all properties that were fully operating for the entirety of the comparative periods presented separate from properties acquired subsequent to the first day in the earliest comparable period presented, properties that underwent development or redevelopment at any time during the comparative periods, and corporate entities (legal entities performing general and administrative functions), which are excluded from same property results. Additionally, rental revenues from lease termination fees, if any, are excluded from the results of the same properties.
The following table reconciles same properties to total properties for the quarter ended
March 31, 2014:
|
| | | | | | | | |
| Development – current | | Properties | | Summary | | Properties |
| | | |
| 75/125 Binney Street | | 1 |
| | Development – current | | 5 |
|
| | | |
| 499 Illinois Street | | 1 |
| | Development – deliveries | | 1 |
|
| | | |
| 269 East Grand Avenue | | 1 |
| | Redevelopment – current | | 5 |
|
| | | |
| 430 East 29th Street | | 1 |
| | Redevelopment – deliveries | | 9 |
|
| | | |
| 360 Longwood Avenue (unconsolidated JV) | | 1 |
| | | | |
| | | | | |
| | | Development/redevelopment – Asia | | 5 |
|
| | | 5 |
| | |
| | | | | |
| | | | | | | |
| | | | | Acquisitions in North America since January 1, 2013: | | |
| Development – deliveries since January 1, 2013 | | Properties | | |
| | | |
| | | 10151 Barnes Canyon Road | | 1 |
|
| | | |
| 225 Binney Street | | 1 |
| | 407 Davis Drive | | 1 |
|
| | | |
| | | | | 150 Second Street | | 1 |
|
| | | | | |
| Redevelopment – current | | Properties | | 3545 Cray Court | | 1 |
|
| | | |
| 225 Second Avenue | | 1 |
| | 4025/4031/4045 Sorrento Valley Boulevard | | 3 |
|
| | | |
| 10121 Barnes Canyon Road | | 1 |
| | |
| | | |
| 11055/11065/11075 Roselle Street | | 3 |
| | | | |
| | | | | |
| | | 5 |
| | Properties “held for sale” | | 4 |
|
| | | | |
| | | | | Total properties excluded from same properties | | 36 |
|
| | | | | |
| Redevelopment – deliveries since January 1, 2013 | | Properties | | |
| | | | | |
| | | | | |
| | | Same properties | | 149 |
|
| 400 Technology Square | | 1 |
| | |
| | | | | |
| 285 Bear Hill Road | | 1 |
| | | | |
| | | Total properties as of March 31, 2014 | | 185 |
|
| 343 Oyster Point Boulevard | | 1 |
| | |
| | | | | |
| 4757 Nexus Center Drive | | 1 |
| | | | |
| | | | | |
| 1616 Eastlake Avenue | | 1 |
| | | | |
| | | | | |
| 1551 Eastlake Avenue | | 1 |
| | | | |
| | | | | |
| 9800 Medical Center Drive | | 3 |
| | | | |
| | | | | |
| | | 9 |
| | | | |
| | | | | |
Stabilized occupancy date
The stabilized occupancy date represents the estimated date on which the project is expected to reach occupancy of 95% or greater.
Total market capitalization
Total market capitalization is equal to the sum of outstanding shares of series E cumulative convertible preferred stock and common stock multiplied by the related closing price of each class at the end of each period presented, the liquidation value of the series D cumulative convertible preferred stock, and total debt.
|
| | |
| ALEXANDRIA REAL ESTATE EQUITIES, INC
ALL RIGHTS RESERVED © 2014 | 51 |
ALEXANDRIA REAL ESTATE EQUITIES, INC.
March 31, 2014
Definitions and Other Information (continued)
(Unaudited)
Unencumbered NOI as a percentage of total NOI
Unencumbered NOI as a percentage of total NOI is a non-GAAP financial measure that we believe is useful to investors as a performance measure of our results of operations of our unencumbered real estate assets, as it reflects primarily those income and expense items that are incurred at the unencumbered property level. We use unencumbered NOI as a percentage of total NOI in order to assess our compliance with our financial covenants under our debt obligations because the measure serves as a proxy for a financial measure under such debt obligations. Unencumbered NOI is derived from assets classified in continuing operations which are not subject to any mortgage, deed of trust, lien, or other security interest as of the period for which income is presented. Unencumbered NOI for periods prior to the three months ended March 31, 2014, has been reclassified to conform to current period presentation related to discontinued operations. |
| | | | | | | | | | | | | | | | | | | |
| | Three Months Ended |
| (Dollars in thousands) | 3/31/2014 | | 12/31/2013 | | 9/30/2013 | | 6/30/2013 | | 3/31/2013 |
| Unencumbered NOI | $ | 103,096 |
| | $ | 82,267 |
| | $ | 76,607 |
| | $ | 74,966 |
| | $ | 71,143 |
|
| Encumbered NOI | 20,583 |
| | 36,664 |
| | 34,024 |
| | 32,687 |
| | 33,754 |
|
| Total NOI from continuing operations | $ | 123,679 |
| | $ | 118,931 |
| | $ | 110,631 |
| | $ | 107,653 |
| | $ | 104,897 |
|
| Unencumbered NOI as a percentage of total NOI | 83% |
| (1) | 69% |
| | 69% |
| | 70% |
| | 68% |
|
| |
| (1) | Increase in unencumbered NOI as a percentage of total NOI in 1Q14 due to repayment of $208.7 million secured note payable related to Alexandria Technology Square ® with an effective interest rate of 5.59%. |
Weighted average interest rate for capitalization
The weighted average interest rate required for calculating capitalization of interest pursuant to GAAP represents a weighted average rate based on the rates applicable to borrowings outstanding during the period and includes the impact of our interest rate swap agreements, amortization of debt discounts/premiums, amortization of loan fees, and other bank fees. A separate calculation is performed each month to determine our weighted average interest rate for capitalization for the month. The rate will vary each month due to changes in variable interest rates, outstanding debt balances, the proportion of variable rate debt to fixed rate debt, the amount and terms of effective interest rate swap agreements, and the amount of loan fee amortization.
The following table presents the weighted average interest rate for capitalization:
|
| | | | | | | | | |
| | Three Months Ended |
| | 3/31/2014 | | 12/31/2013 | | 9/30/2013 | | 6/30/2013 | | 3/31/2013 |
| Weighted average interest rate for capitalization | 3.88% | | 4.09% | | 4.33% | | 4.13% | | 3.97% |
Weighted average shares for calculating FFO, FFO, as adjusted, and AFFO per share
Weighted average shares of common stock outstanding for calculating FFO, FFO, as adjusted, and AFFO per share attributable to Alexandria’s common stockholders represent the weighted average of common shares outstanding during the period, calculated as follows:
|
| | | | | | | | | | | | | | |
| | Three Months Ended |
| | 3/31/2014 | | 12/31/2013 | | 9/30/2013 | | 6/30/2013 | | 3/31/2013 |
| Weighted average shares – basic | 71,072,953 |
| | 70,999,987 |
| | 70,900,274 |
| | 66,972,892 |
| | 63,161,319 |
|
| Effect of assumed conversion and dilutive securities: | | | |
| | |
| | |
| | |
|
| Assumed conversion of 8.00% unsecured senior convertible notes | — |
| | — |
| | 5,470 |
| | 6,146 |
| | 6,146 |
|
| Weighted average shares – diluted | 71,072,953 |
| | 70,999,987 |
|
| 70,905,744 |
| | 66,979,038 |
| | 63,167,465 |
|
|
| | |
| ALEXANDRIA REAL ESTATE EQUITIES, INC
ALL RIGHTS RESERVED © 2014 | 52 |