
ALEXANDRIA REAL ESTATE EQUITIES, INC.
September 30, 2014
Table of Contents
| Page | |
| EARNINGS PRESS RELEASE | |
| Third Quarter Ended September 30, 2014, Financial and Operating Results | |
| Guidance | |
| Earnings Call Information and About the Company | |
| Consolidated Statements of Income | |
| Consolidated Balance Sheets | |
| Funds From Operations and Adjusted Funds From Operations | |
| SUPPLEMENTAL INFORMATION | |
| Company Profile | |
| Investor Information | |
| Financial and Asset Base Highlights | |
| Operating Information | |
| Operating Metrics | |
| Same Property Performance | |
| Leasing Activity | |
| Lease Expirations | |
| Top 20 Client Tenants | |
| Client Tenant Mix | |
| Summary of Properties and Occupancy | |
| Page | |
| SUPPLEMENTAL INFORMATION (continued) | |
| Operating Information (continued) | |
| Property Listing | |
| Value-Creation Projects, Acquisitions, and Dispositions | |
| Investments in Real Estate | |
| Overview of Value-Creation Pipeline | |
| Deliveries of Value-Creation Projects in North America | |
| Current Value-Creation Projects in North America | |
| Near-Term and Future Value-Creation Projects in North America | |
| Unconsolidated Joint Ventures | |
| Actual and Projected Construction Spending | |
| Acquisitions | |
| Dispositions | |
| Real Estate Investments in Asia | |
| Balance Sheet | |
| Key Credit Metrics | |
| Key Earnings and Capital Planning Considerations | |
| Summary of Debt | |
| Definitions and Reconciliations | |
This document includes “forward-looking statements” within the meaning of Section 27A of the Securities Act of 1933, as amended, and Section 21E of the Securities Exchange Act of 1934, as amended. Please see page 4 of the earnings press release for further information. |
| This document is not an offer to sell or solicitation to buy securities of Alexandria Real Estate Equities, Inc. Any offers to sell or solicitations to buy our securities shall be made only by means of a prospectus approved for that purpose. Unless otherwise indicated, the “Company,” “Alexandria,” “ARE,” “we,” “us,” and “our” refer to Alexandria Real Estate Equities, Inc. and its consolidated subsidiaries. |
 | ALEXANDRIA REAL ESTATE EQUITIES, INC ALL RIGHTS RESERVED © 2014 | i |

Alexandria Real Estate Equities, Inc.
Reports
Third Quarter Ended September 30, 2014
Financial and Operating Results
FFO Per Share – Diluted, as Adjusted, for 3Q14 up 14.2% over 3Q13
Strong Demand Drives Strength in Core Operations
and
Accelerating Growth through Value-Creation Projects
FFO Per Share – Diluted, as Adjusted of $1.21
EPS – Diluted of $0.39
Total Revenues of $185.6 Million
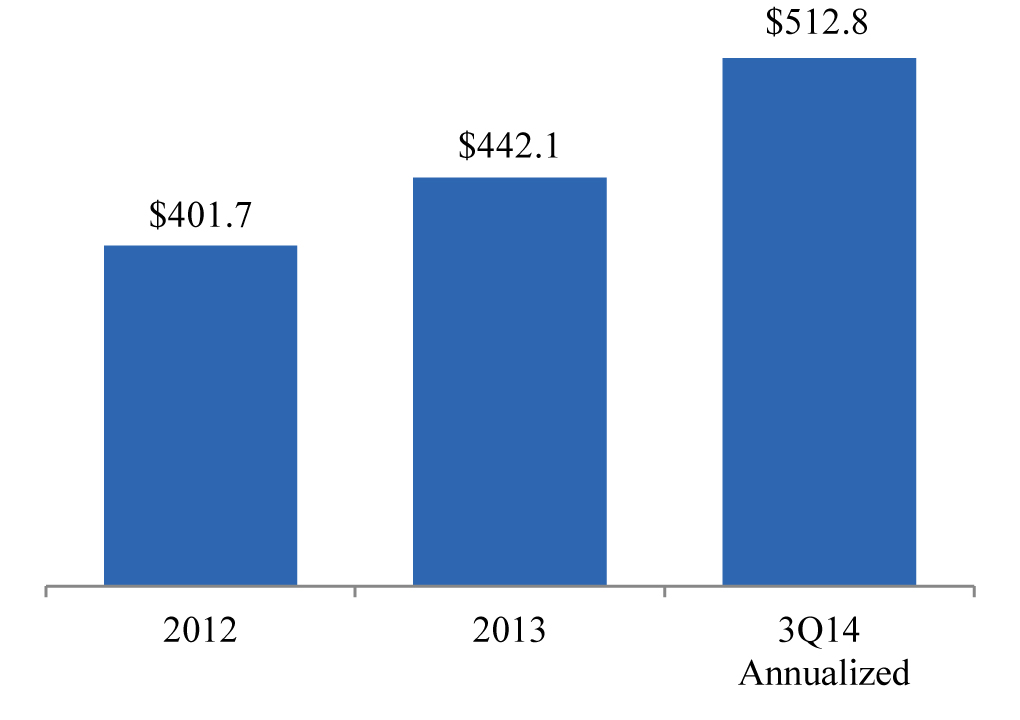
NOI of $128.2 Million
PASADENA, CA. – November 3, 2014 – Alexandria Real Estate Equities, Inc. (NYSE:ARE) today announced financial and operating results for the third quarter ended September 30, 2014.
“Our third quarter results highlight our disciplined approach to balance sheet management and capital allocation into our science and technology campuses in urban innovation clusters, combined with continued solid internal growth. We are pleased with the execution of our very successful $700 million bond offering at a weighted average interest rate of 3.50% and a maturity of 9.6 years. This bond offering strategically focused on laddering and extending debt maturities and provided growth capital for our significantly pre-leased value-creation development pipeline. The announcement of our Mission Bay acquisition of the 1455/1515 Third Street land parcels and our strategic joint venture with Uber Technologies, Inc. in September 2014 reinforces Alexandria’s strong emphasis on capital allocation in the core of one of the most desirable urban cluster submarkets. This iconic campus environment, ideally situated within the cross-section of science and technology in the highly collaborative, innovative, and urban Mission Bay ecosystem and adjacent to the planned Golden State Warriors’ new sports complex, provides our tenants a unique advantage for the recruitment and retention of world-class talent. Our high-quality asset base continued to deliver accelerating growth in rental rates, occupancy, and significant earnings growth through the completion of pre-leased value-creation projects,” said Joel S. Marcus, Chairman, Chief Executive Officer, and Founder of Alexandria Real Estate Equities, Inc.
Results
| • | Funds from operations (“FFO”) attributable to Alexandria Real Estate Equities, Inc.’s (“Alexandria’s”) common stockholders – diluted, as adjusted: |
| • | $1.21 per share for 3Q14, up 14.2%, compared to $1.06 per share for 3Q13 |
| • | $3.57 per share for YTD 3Q14, up 10.5%, compared to $3.23 per share for YTD 3Q13 |
| • | $86.1 million for 3Q14, up $11.1 million, or 14.8%, compared to $75.0 million for 3Q13 |
| • | $253.7 million for YTD 3Q14, up $37.0 million, or 17.1%, compared to |
$216.6 million for YTD 3Q13
| • | Net income attributable to Alexandria’s common stockholders – diluted: |
| • | $27.6 million, or $0.39 per share, for 3Q14 compared to |
$24.6 million, or $0.35 per share, for 3Q13
| • | $88.3 million, or $1.24 per share, for YTD 3Q14 compared to |
$72.5 million, or $1.08 per share, for YTD 3Q13
Core operating metrics
| • | Total revenues: |
| • | $185.6 million for 3Q14, up $27.3 million, or 17.2%, compared to $158.3 million for 3Q13 |
| • | $538.2 million for YTD 3Q14, up $75.9 million, or 16.4%, compared to |
$462.3 million for YTD 3Q13
| • | Net operating income (“NOI”): |
| • | $128.2 million for 3Q14, up $17.6 million, or 15.9%, compared to $110.6 million for 3Q13 |
| • | $375.9 million for YTD 3Q14, up $52.7 million, or 16.3%, compared to |
$323.2 million for YTD 3Q13
| • | Same property NOI growth: |
| • | Up 5.0% and 5.9% (cash basis) for 3Q14, compared to 3Q13 |
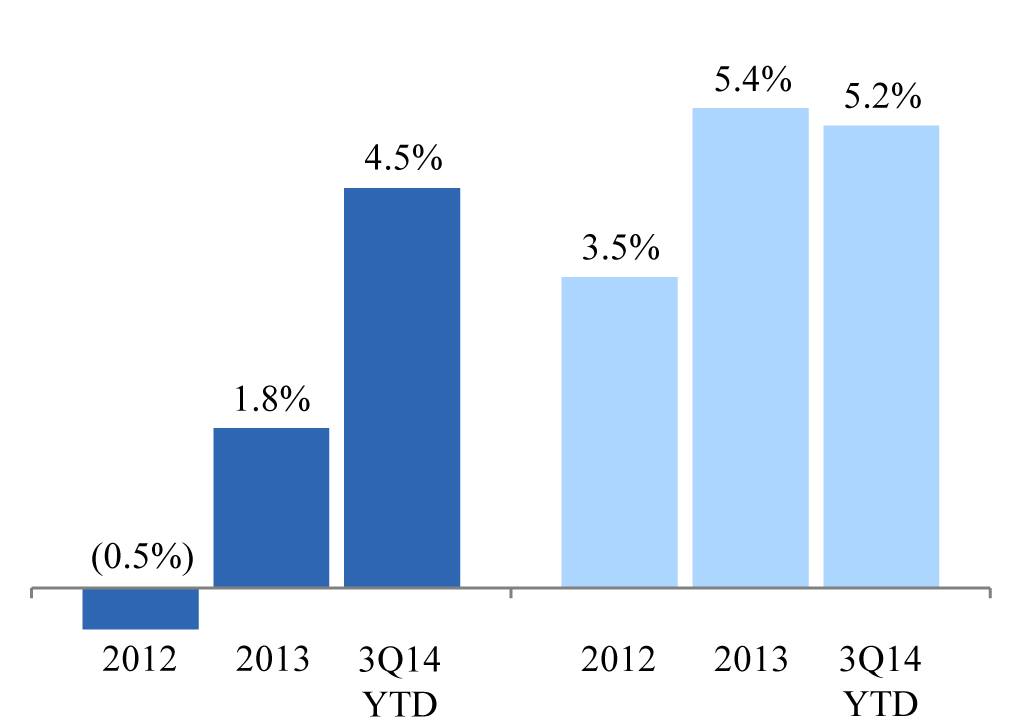
| • | Up 4.5% and 5.2% (cash basis) for YTD 3Q14, compared to YTD 3Q13 |
| • | Leasing activity during 3Q14: |
| • | Executed leases for 871,416 rentable square feet (“RSF”) |
| • | 18.6% and 5.6% (cash basis) rental rate growth on 3Q14 lease renewals and re-leasing |
of space
| • | Leasing activity during YTD 3Q14: |
| • | Executed leases for 2,187,173 RSF |
| • | 14.1% and 6.2% (cash basis) rental rate growth on YTD 3Q14 lease renewals and re-leasing of space |
| • | Occupancy for properties in North America, as of 3Q14: |
| • | 97.3% occupancy for operating properties, up 230 basis points (“bps”) from 3Q13 |
| • | 96.3% occupancy for operating and redevelopment properties, up 180 bps from 3Q13 |
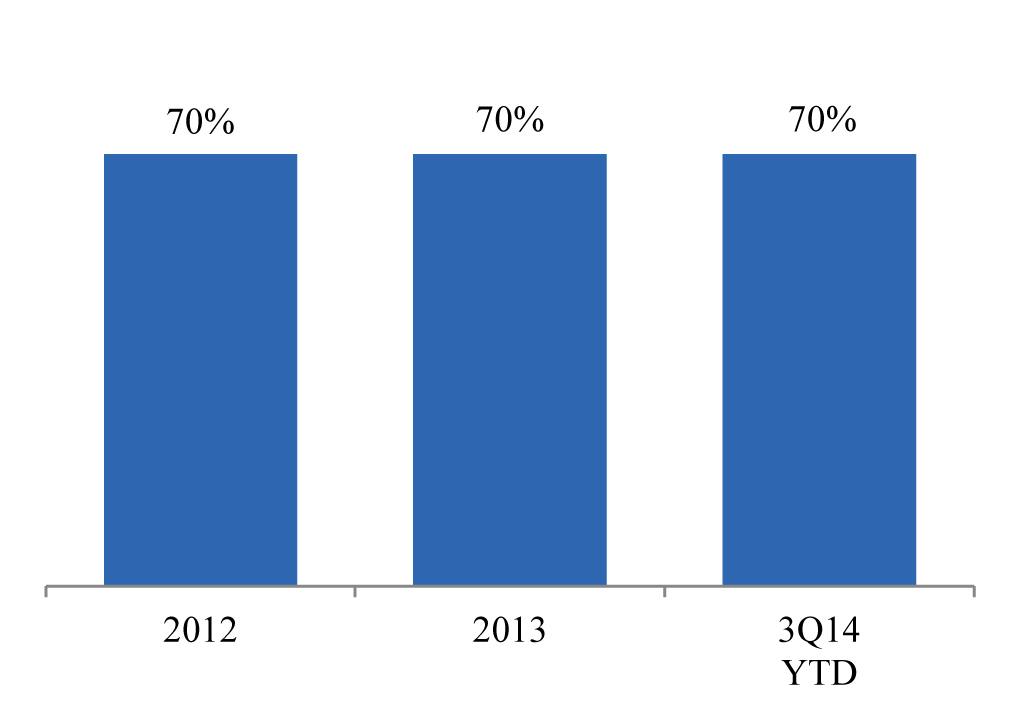
| • | Operating margins solid at 70% for YTD 3Q14 |
| • | 53% of total annualized base rent (“ABR”) from investment-grade client tenants |
| ALEXANDRIA REAL ESTATE EQUITIES, INC ALL RIGHTS RESERVED © 2014 | 1 |
ALEXANDRIA REAL ESTATE EQUITIES, INC.
September 30, 2014
External growth: value-creation projects and acquisitions
Value-creation projects
| • | Development and redevelopment value-creation projects were 85% leased or under lease negotiations |
| • | 3Q14 key deliveries of value-creation projects: |
| • | 154,100 RSF to the Dana-Farber Cancer Institute, Inc., at 360 Longwood Avenue in our Longwood Medical Area submarket |
| • | 107,250 RSF to Amgen Inc. at 269 East Grand Avenue in our South San Francisco submarket |
| • | 85,417 RSF to The Regents of the University of California and Medivation, Inc., at 499 Illinois Street in our Mission Bay submarket |
| • | 3Q14 key commencements of 100% pre-leased value-creation development projects: |
| • | 422,980 RSF at 1455/1515 Third Street, an unconsolidated joint venture (“JV”) project with Uber Technologies, Inc. (“Uber”) in our Mission Bay submarket; 100% pre-leased to Uber under a 15-year lease |
| • | 149,663 RSF at 5200 Illumina Way – Building 6 in our University Town Center submarket; 100% pre-leased to Illumina, Inc. |
| • | Non-income-producing assets (CIP and land) are expected to decrease from 17% as of 3Q14 to 13% of our gross real estate by 1Q15, driven by the completion and delivery of high-value, pre-leased development and redevelopment projects |
Acquisitions
| • | In September 2014, Alexandria and Uber formed a JV and acquired key land parcels at 1455/1515 Third Street in the Mission Bay submarket of San Francisco, for the ground-up development of two Class A buildings aggregating 422,980 RSF. Alexandria holds a 51% interest in the JV. Additionally, Alexandria executed a 15-year lease with Uber for 100% of the project. The purchase price of the land parcels, including 423 parking structure spaces, foundation piles, plans and permits, was $125.0 million, with 49% funded by Uber. The land parcels are fully entitled, including Proposition M office allocation approvals. The timing of revenue recognition for this lease may begin from 3Q16 to 1Q17, subject to completion of the design and budget of the buildings. |
Balance sheet
| • | In August 2014, Standard & Poor’s Rating Services raised its credit outlook for the Company to Positive from Stable, reflecting continued and further expected improvement in key credit metrics and growth in cash flows. The improvement in the outlook is driven primarily by the near-term completion and delivery of significant rentable square feet of pre-leased value-creation development projects, the lengthening of the weighted average remaining maturity of outstanding debt, and the reduction in unhedged variable-rate debt. As of September 30, 2014, the weighted average remaining maturity of outstanding debt was 5.9 years and our unhedged variable-rate debt as a percentage of total debt was 11%. The Company's credit profile has steadily improved since receipt of its initial credit rating in July 2011. |
| • | We expect our earnings before interest, taxes, depreciation, and amortization (“EBITDA”) to grow significantly in 2015. This growth in EBITDA, plus cash flows from operating activities, after dividends, is expected to allow us to borrow additional debt in 2015 on a leverage neutral basis and allocate $500 million to $600 million of capital to fund value-creation development projects. |
| • | In July 2014, we completed an offering of $700 million unsecured senior notes payable, consisting of the following: |
| • | $400 million of 2.75% unsecured senior notes payable due in 2020 |
| • | $300 million of 4.50% unsecured senior notes payable due in 2029 |
| • | Weighted average interest rate of 3.50% |
| • | Average maturity of 9.6 years |
| • | Net proceeds of $694 million were used to reduce variable-rate debt, consisting of: |
| • | $569 million reduction of borrowings outstanding on our unsecured senior line of credit |
| • | $125 million partial repayment of our 2016 unsecured senior bank term loan (“2016 Unsecured Senior Bank Term Loan”); we recognized a loss on the early extinguishment of debt related to the write-off of unamortized loan fees totaling $0.5 million, or $0.01 per share. |
LEED statistics and other awards
| • | As of September 30, 2014, 30 LEED certified projects aggregating 4.6 million RSF were complete and 29 additional LEED projects aggregating 5.0 million square feet were |
in process.
| • | In August 2014, our ground-up development of the West Tower at the Alexandria Center™ for Life Science in New York City, at 430 East 29th Street in our Manhattan submarket, achieved LEED Gold certification. |
| • | In August 2014, our 225 Binney Street property at the Alexandria Center™ at Kendall Square, a recently certified LEED Gold development project, was awarded the 2014 Best Projects Award by the Engineering News-Record New England for the best office/retail/mixed-use development in the region. |
| • | In August 2014, our Alexandria Center™ for Life Science at Campus Pointe in San Diego, a LEED Platinum property, was awarded an Orchid Award for Landscape Architecture by the San Diego Architectural Foundation, for its renovation of a commercial building into a suburban infill project. |
| ALEXANDRIA REAL ESTATE EQUITIES, INC ALL RIGHTS RESERVED © 2014 | 2 |
ALEXANDRIA REAL ESTATE EQUITIES, INC.
September 30, 2014
Guidance
The following updated guidance is based on our current view of existing market conditions and other assumptions for the year ended December 31, 2014. There can be no assurance that actual amounts will be materially higher or lower than these expectations. See our discussion of “forward-looking statements” on the following page.
| EPS and FFO Per Share Attributable to Alexandria’s Common Stockholders – Diluted | 2014 Guidance | |
| Earnings per share | $1.65 – $1.67 | |
| Add back: depreciation and amortization | 3.16 | |
Other (2) | (0.03) | |
| FFO per share | 4.78 – 4.80 | |
| Add back: loss on early extinguishment of debt | 0.01 | |
| FFO per share, as adjusted | $4.79 – $4.81 | |
Key Assumptions (Dollars in thousands) | Low | High | ||||||
| Occupancy percentage for operating properties in North America at December 31, 2014 | 96.9% | 97.3% | ||||||
| Same property performance: | ||||||||
| NOI increase | 3.5% | 5.0% | ||||||
| NOI increase (cash basis) | 4.0% | 6.0% | ||||||
| Lease renewals and re-leasing of space: | ||||||||
| Rental rate increases | 11.0% | 14.0% | ||||||
| Rental rate increases (cash basis) | 4.0% | 6.0% | ||||||
| Three months ended December 31, 2014: | ||||||||
| Straight-line rents | $ | 10,000 | $ | 11,500 | ||||
| General and administrative expenses | $ | 12,500 | $ | 13,500 | ||||
Capitalization of interest (1) | $ | 10,500 | $ | 12,000 | ||||
Interest expense (1) | $ | 22,000 | $ | 23,500 | ||||
| Key Credit Metrics | As of December 31, 2014 | |
Net debt to Adjusted EBITDA – 4Q14 annualized (1) | 7.1x | |
| Fixed charge coverage ratio – 4Q14 annualized | 3.3x | |
Unhedged variable-rate debt as a percentage of total debt (1) | 14% | |
Non-income-producing assets as a percentage of gross real estate (1) | 17% | |
Sources and Uses of Capital (Dollars in thousands) | Completed as of 9/30/14 | Projected for 2014 | ||||||||||
| Low | High | |||||||||||
| Sources of debt capital: | ||||||||||||
| Unsecured senior notes payable | $ | 700,000 | $ | 700,000 | $ | 700,000 | ||||||
Secured notes payable borrowings (3) | 157,000 | 161,000 | 211,000 | |||||||||
| Secured notes payable repayments | (208,000 | ) | (210,000 | ) | (210,000 | ) | ||||||
| Unsecured senior bank term loan repayment | (125,000 | ) | (125,000 | ) | (125,000 | ) | ||||||
| Net activity on unsecured senior line of credit | (53,000 | ) | (47,000 | ) | 18,000 | |||||||
| Net sources of debt capital | 471,000 | 479,000 | 594,000 | |||||||||
| Other sources of capital: | ||||||||||||
Land and other sales – completed/under negotiation (1) | 33,000 | (4) | 110,000 | 130,000 | ||||||||
Other real estate sales – next one to five quarters (5) | — | TBD | TBD | |||||||||
| Cash provided by operating activities after dividends | 85,000 | 105,000 | 120,000 | |||||||||
| Total sources of capital | $ | 589,000 | $ | 694,000 | $ | 844,000 | ||||||
| Uses of capital: | ||||||||||||
| Construction | $ | 382,000 | $ | 530,000 | $ | 580,000 | ||||||
Mission Bay pre-leased development JV (6) | 64,000 | 64,000 | 64,000 | |||||||||
| Acquisitions | 143,000 | 100,000 | 200,000 | |||||||||
| Total uses of capital | $ | 589,000 | $ | 694,000 | $ | 844,000 | ||||||
| (1) | In order to maintain maximum strategic optionality and due to extraordinary strong build to suit leasing demand for the Binney Street land parcels and the likely corresponding reduction in lease-up risk, we have updated our strategy noted in 4Q13 to sell a minority interest in the Binney Street land parcels. Our updated guidance assumes we lease 50, 60, and 100 Binney Street in the near term and retain 100% of each project. |
| (2) | Includes $0.01 per share gain realized on the sales of land parcels in 2Q14 and 3Q14. |
| (3) | Includes two non-recourse secured notes payable aggregating $48.3 million assumed in connection with the acquisition of two operating assets in 1Q14, as well as borrowings under secured construction loans. |
| (4) | The amount completed of $33 million includes one asset sold for $3.4 million in October 2014. As of November 3, 2014, pending sales under negotiation aggregated $83.0 million. These sales are subject to, among other steps, completion of due diligence, environmental review including public commentary, and various board and regulatory approvals. |
| (5) | We expect to identify real estate sales, including land and non-core/“core-like” operating assets, over the next one to five quarters to generate proceeds for reinvestment into high-value Class A pre-leased development projects. Additionally, we will continue to execute our strategy to deliver solid growth in funds from operations per share, as adjusted, and net asset value in 2014 and 2015, including any impact of asset sales. |
| (6) | Represents our 51% unconsolidated JV share of the land parcels and parking spaces acquired at 1455/1515 Third Street in the Mission Bay submarket of the San Francisco Bay Area. |
| ALEXANDRIA REAL ESTATE EQUITIES, INC ALL RIGHTS RESERVED © 2014 | 3 |
ALEXANDRIA REAL ESTATE EQUITIES, INC.
September 30, 2014
Earnings Call Information
We will host a conference call on Monday, November 3, 2014, at 3:00 p.m. Eastern Time (“ET”)/12:00 p.m. noon Pacific Time (“PT”) that is open to the general public to discuss our financial and operating results for the third quarter ended September 30, 2014. To participate in this conference call, dial (877) 874-1563 or (719) 325-4769 and confirmation code 1901197 shortly before 3:00 p.m. ET/12:00 p.m. noon PT. The audio webcast can be accessed at: www.are.com, in the “For Investors” section. A replay of the call will be available for a limited time from 6:00 p.m. ET/3:00 p.m. PT on Monday, November 3, 2014. The replay number is (888) 203-1112 or (719) 457-0820 and the confirmation code is 1901197.
Additionally, a copy of this Earnings Press Release and Supplemental Information for the third quarter ended September 30, 2014, is available in the “For Investors” section of our website at www.are.com or by following this link: http://www.are.com/fs/2014q3.pdf.
For any questions, please contact Joel S. Marcus, Chairman, Chief Executive Officer & Founder, at (626) 578-9693.
About the Company
Alexandria Real Estate Equities, Inc. (NYSE:ARE) is a fully integrated, self-administered, and self-managed REIT uniquely focused on Class A collaborative science and technology campuses in urban innovation clusters including Greater Boston, the San Francisco Bay Area, New York City, San Diego, Seattle, Maryland, and Research Triangle Park. Alexandria is the largest and leading owner, operator, and developer in its niche with a total market capitalization of $9.1 billion as of September 30, 2014, and an asset base of 31.6 million RSF, including 18.5 million RSF of operating and current value-creation projects, as well as an additional 13.1 million RSF in future ground-up development projects.
***********
This document includes “forward-looking statements” within the meaning of Section 27A of the Securities Act of 1933, as amended, and Section 21E of the Securities Exchange Act of 1934, as amended. Such forward-looking statements include, without limitation, statements regarding our 2014 earnings per share attributable to Alexandria’s common stockholders – diluted, 2014 FFO per share attributable to Alexandria’s common stockholders – diluted, NOI, and our projected sources and uses of capital. You can identify the forward-looking statements by their use of forward-looking words, such as “forecast,” “guidance,” “projects,” “estimates,” “anticipates,” “believes,” “expects,” “intends,” “may,” “plans,” “seeks,” “should,” or “will,” or the negative of those words or similar words. These forward-looking statements are based on our current expectations, beliefs, projections, future plans and strategies, anticipated events or trends and similar expressions concerning matters that are not historical facts, as well as a number of assumptions concerning future events. There can be no assurance that actual results will not be materially higher or lower than these expectations. These statements are subject to risks, uncertainties, assumptions, and other important factors that could cause actual results to differ materially from the results discussed in the forward-looking statements. Factors that might cause such a difference include, without limitation, our failure to obtain capital (debt, construction financing, and/or equity) or refinance debt maturities, increased interest rates and operating costs, adverse economic or real estate developments in our markets, our failure to successfully complete and lease our existing space held for redevelopment and new properties acquired for that purpose and any properties undergoing development, our failure to successfully operate or lease acquired properties, decreased rental rates, increased vacancy rates or failure to renew or replace expiring leases, defaults on, or non-renewal of, leases by client tenants, general and local economic conditions, a favorable capital market environment, performance of our core operations in areas such as delivery of current and future development and redevelopment projects, leasing activity, lease renewals, and other risks and uncertainties detailed in our filings with the Securities and Exchange Commission (“SEC”). Accordingly, you are cautioned not to place undue reliance on such forward-looking statements. All forward-looking statements are made as of the date of this earnings press release, and unless otherwise stated, we assume no obligation to update this information and expressly disclaim any obligation to update or revise any forward-looking statements, whether as a result of new information, future events, or otherwise. For more discussion relating to risks and uncertainties that could cause actual results to differ materially from those anticipated in our forward-looking statements, and risks to our business in general, please refer to our SEC filings, including our most recent annual report on Form 10-K and any subsequent quarterly reports on Form 10-Q.
| ALEXANDRIA REAL ESTATE EQUITIES, INC ALL RIGHTS RESERVED © 2014 | 4 |
ALEXANDRIA REAL ESTATE EQUITIES, INC.
September 30, 2014
Consolidated Statements of Income
(In thousands, except per share amounts)
(Unaudited)
| Three Months Ended | Nine Months Ended | |||||||||||||||||||||||||||
| 9/30/14 | 6/30/14 | 3/31/14 | 12/31/13 | 9/30/13 | 9/30/14 | 9/30/13 | ||||||||||||||||||||||
| Revenues: | ||||||||||||||||||||||||||||
| Rental | $ | 137,718 | $ | 134,992 | $ | 130,570 | $ | 125,693 | $ | 116,052 | $ | 403,280 | $ | 342,071 | ||||||||||||||
| Tenant recoveries | 45,572 | 40,944 | 41,682 | 39,970 | 38,691 | 128,198 | 110,125 | |||||||||||||||||||||
| Other income | 2,325 | 466 | 3,934 | 3,160 | 3,572 | 6,725 | 10,132 | |||||||||||||||||||||
| Total revenues | 185,615 | 176,402 | 176,186 | 168,823 | 158,315 | 538,203 | 462,328 | |||||||||||||||||||||
| Expenses: | ||||||||||||||||||||||||||||
| Rental operations | 57,423 | 52,353 | 52,507 | 49,892 | 47,684 | 162,283 | 139,147 | |||||||||||||||||||||
| General and administrative | 12,609 | 13,836 | 13,224 | 12,751 | 11,666 | 39,669 | 35,769 | |||||||||||||||||||||
| Interest | 20,555 | 17,433 | 19,123 | 17,783 | 16,171 | 57,111 | 50,169 | |||||||||||||||||||||
| Depreciation and amortization | 58,388 | 57,314 | 50,421 | 48,084 | 48,866 | 166,123 | 141,039 | |||||||||||||||||||||
| Loss on early extinguishment of debt | 525 | — | — | — | 1,432 | 525 | 1,992 | |||||||||||||||||||||
| Total expenses | 149,500 | 140,936 | 135,275 | 128,510 | 125,819 | 425,711 | 368,116 | |||||||||||||||||||||
| Income from continuing operations | 36,115 | 35,466 | 40,911 | 40,313 | 32,496 | 112,492 | 94,212 | |||||||||||||||||||||
| (Loss) income from discontinued operations | (180 | ) | (147 | ) | (162 | ) | (143 | ) | (43 | ) | (489 | ) | 1,043 | |||||||||||||||
| Gain on sales of land parcels | 8 | 797 | — | 4,052 | — | 805 | 772 | |||||||||||||||||||||
| Net income | 35,943 | 36,116 | 40,749 | 44,222 | 32,453 | 112,808 | 96,027 | |||||||||||||||||||||
| Dividends on preferred stock | (6,471 | ) | (6,472 | ) | (6,471 | ) | (6,471 | ) | (6,472 | ) | (19,414 | ) | (19,414 | ) | ||||||||||||||
| Net income attributable to noncontrolling interests | (1,340 | ) | (1,307 | ) | (1,195 | ) | (1,110 | ) | (960 | ) | (3,842 | ) | (2,922 | ) | ||||||||||||||
| Net income attributable to unvested restricted stock awards | (506 | ) | (405 | ) | (374 | ) | (394 | ) | (442 | ) | (1,285 | ) | (1,187 | ) | ||||||||||||||
| Net income attributable to Alexandria Real Estate Equities, Inc.’s common stockholders | $ | 27,626 | $ | 27,932 | $ | 32,709 | $ | 36,247 | $ | 24,579 | $ | 88,267 | $ | 72,504 | ||||||||||||||
| Earnings per share attributable to Alexandria’s common stockholders – basic and diluted: | ||||||||||||||||||||||||||||
| Continuing operations | $ | 0.39 | $ | 0.39 | $ | 0.46 | $ | 0.51 | $ | 0.35 | $ | 1.25 | $ | 1.06 | ||||||||||||||
| Discontinued operations | — | — | — | — | — | (0.01 | ) | 0.02 | ||||||||||||||||||||
| Earnings per share – basic and diluted | $ | 0.39 | $ | 0.39 | $ | 0.46 | $ | 0.51 | $ | 0.35 | $ | 1.24 | $ | 1.08 | ||||||||||||||
| Weighted average shares of common stock outstanding for calculating earnings per share attributable to Alexandria’s common stockholders – basic and diluted | 71,195 | 71,126 | 71,073 | 71,000 | 70,900 | 71,121 | 67,040 | |||||||||||||||||||||
| Dividends declared per share of common stock | $ | 0.72 | $ | 0.72 | $ | 0.70 | $ | 0.68 | $ | 0.68 | $ | 2.14 | $ | 1.93 | ||||||||||||||
| ALEXANDRIA REAL ESTATE EQUITIES, INC ALL RIGHTS RESERVED © 2014 | 5 |
ALEXANDRIA REAL ESTATE EQUITIES, INC.
September 30, 2014
Consolidated Balance Sheets
(In thousands)
(Unaudited)
| 9/30/14 | 6/30/14 | 3/31/14 | 12/31/13 | 9/30/13 | ||||||||||||||||
| Assets | ||||||||||||||||||||
| Investments in real estate | $ | 7,197,630 | $ | 7,030,117 | $ | 6,930,262 | $ | 6,776,914 | $ | 6,613,761 | ||||||||||
| Cash and cash equivalents | 67,023 | 61,701 | 74,970 | 57,696 | 53,839 | |||||||||||||||
| Restricted cash | 24,245 | 24,519 | 30,454 | 27,709 | 30,654 | |||||||||||||||
| Tenant receivables | 10,830 | 10,654 | 10,619 | 9,918 | 8,671 | |||||||||||||||
| Deferred rent | 225,506 | 214,793 | 202,087 | 190,425 | 182,909 | |||||||||||||||
| Deferred leasing and financing costs | 199,835 | 193,621 | 192,618 | 192,658 | 179,805 | |||||||||||||||
| Investments | 177,577 | 174,802 | 169,322 | 140,288 | 129,163 | |||||||||||||||
| Other assets | 117,668 | 105,442 | 145,707 | 134,156 | 159,567 | |||||||||||||||
| Total assets | $ | 8,020,314 | $ | 7,815,649 | $ | 7,756,039 | $ | 7,529,764 | $ | 7,358,369 | ||||||||||
| Liabilities, Noncontrolling Interests, and Equity | ||||||||||||||||||||
| Secured notes payable | $ | 636,825 | $ | 615,551 | $ | 597,511 | $ | 708,831 | $ | 708,653 | ||||||||||
| Unsecured senior notes payable | 1,747,290 | 1,048,310 | 1,048,270 | 1,048,230 | 1,048,190 | |||||||||||||||
| Unsecured senior line of credit | 142,000 | 571,000 | 506,000 | 204,000 | 14,000 | |||||||||||||||
| Unsecured senior bank term loans | 975,000 | 1,100,000 | 1,100,000 | 1,100,000 | 1,100,000 | |||||||||||||||
| Accounts payable, accrued expenses, and tenant security deposits | 504,535 | 434,528 | 443,893 | 435,342 | 452,139 | |||||||||||||||
| Dividends payable | 57,549 | 57,377 | 55,860 | 54,420 | 54,413 | |||||||||||||||
| Total liabilities | 4,063,199 | 3,826,766 | 3,751,534 | 3,550,823 | 3,377,395 | |||||||||||||||
| Commitments and contingencies | ||||||||||||||||||||
| Redeemable noncontrolling interests | 14,348 | 14,381 | 14,413 | 14,444 | 14,475 | |||||||||||||||
| Alexandria Real Estate Equities, Inc.’s stockholders’ equity: | ||||||||||||||||||||
| Series D cumulative convertible preferred stock | 250,000 | 250,000 | 250,000 | 250,000 | 250,000 | |||||||||||||||
| Series E cumulative redeemable preferred stock | 130,000 | 130,000 | 130,000 | 130,000 | 130,000 | |||||||||||||||
| Common stock | 714 | 713 | 712 | 712 | 711 | |||||||||||||||
| Additional paid-in capital | 3,523,195 | 3,542,334 | 3,560,453 | 3,572,281 | 3,578,343 | |||||||||||||||
| Accumulated other comprehensive loss | (28,711 | ) | (16,245 | ) | (18,429 | ) | (36,204 | ) | (40,026 | ) | ||||||||||
| Alexandria’s stockholders’ equity | 3,875,198 | 3,906,802 | 3,922,736 | 3,916,789 | 3,919,028 | |||||||||||||||
| Noncontrolling interests | 67,569 | 67,700 | 67,356 | 47,708 | 47,471 | |||||||||||||||
| Total equity | 3,942,767 | 3,974,502 | 3,990,092 | 3,964,497 | 3,966,499 | |||||||||||||||
| Total liabilities, noncontrolling interests, and equity | $ | 8,020,314 | $ | 7,815,649 | $ | 7,756,039 | $ | 7,529,764 | $ | 7,358,369 | ||||||||||
| ALEXANDRIA REAL ESTATE EQUITIES, INC ALL RIGHTS RESERVED © 2014 | 6 |
ALEXANDRIA REAL ESTATE EQUITIES, INC.
September 30, 2014
Funds From Operations and Adjusted Funds From Operations
(In thousands)
(Unaudited)
The following table presents a reconciliation of net income attributable to Alexandria’s common stockholders – basic, the most directly comparable financial measure presented in accordance with generally accepted accounting principles (“GAAP”), to FFO attributable to Alexandria’s common stockholders – basic and diluted, FFO attributable to Alexandria’s common stockholders – diluted, as adjusted, and AFFO attributable to Alexandria’s common stockholders – diluted.
| Three Months Ended | Nine Months Ended | |||||||||||||||||||||||||||
| 9/30/14 | 6/30/14 | 3/31/14 | 12/31/13 | 9/30/13 | 9/30/14 | 9/30/13 | ||||||||||||||||||||||
| Net income attributable to Alexandria’s common stockholders | $ | 27,626 | $ | 27,932 | $ | 32,709 | $ | 36,247 | $ | 24,579 | $ | 88,267 | $ | 72,504 | ||||||||||||||
| Depreciation and amortization | 58,388 | 57,314 | 50,421 | 48,101 | 49,102 | 166,123 | 142,677 | |||||||||||||||||||||
| Loss on sale of real estate | — | — | — | — | — | — | 121 | |||||||||||||||||||||
| Gain on sales of land parcels | (8 | ) | (797 | ) | — | (4,052 | ) | — | (805 | ) | (772 | ) | ||||||||||||||||
| Amount attributable to noncontrolling interests/ unvested restricted stock awards: | ||||||||||||||||||||||||||||
| Net income | 1,846 | 1,712 | 1,569 | 1,504 | 1,402 | 5,127 | 4,109 | |||||||||||||||||||||
| FFO | (2,278 | ) | (1,648 | ) | (1,629 | ) | (1,582 | ) | (1,494 | ) | (5,570 | ) | (3,995 | ) | ||||||||||||||
| FFO attributable to Alexandria’s common stockholders – basic | 85,574 | 84,513 | 83,070 | 80,218 | 73,589 | 253,142 | 214,644 | |||||||||||||||||||||
| Assumed conversion of unsecured senior convertible notes | — | — | — | — | 5 | — | 15 | |||||||||||||||||||||
| FFO attributable to Alexandria’s common stockholders – diluted | 85,574 | 84,513 | 83,070 | 80,218 | 73,594 | 253,142 | 214,659 | |||||||||||||||||||||
| Loss on early extinguishment of debt | 525 | — | — | — | 1,432 | 525 | 1,992 | |||||||||||||||||||||
| Acquisition-related expenses | — | — | — | 1,446 | — | — | — | |||||||||||||||||||||
| Impairment of investments | — | — | — | 853 | — | — | — | |||||||||||||||||||||
| Allocation to unvested restricted stock awards | (4 | ) | — | — | (12 | ) | (11 | ) | (4 | ) | (23 | ) | ||||||||||||||||
| FFO attributable to Alexandria’s common stockholders – diluted, as adjusted | 86,095 | 84,513 | 83,070 | 82,505 | 75,015 | 253,663 | 216,628 | |||||||||||||||||||||
| Non-revenue-enhancing capital expenditures: | ||||||||||||||||||||||||||||
| Building improvements | (2,405 | ) | (1,255 | ) | (1,780 | ) | (1,047 | ) | (1,481 | ) | (5,440 | ) | (2,414 | ) | ||||||||||||||
| Tenant improvements and leasing commissions | (1,693 | ) | (3,934 | ) | (4,053 | ) | (8,291 | ) | (3,739 | ) | (9,680 | ) | (7,611 | ) | ||||||||||||||
| Straight-line rent revenue | (10,892 | ) | (12,737 | ) | (11,882 | ) | (7,928 | ) | (5,570 | ) | (35,511 | ) | (20,007 | ) | ||||||||||||||
| Straight-line rent expense on ground leases | 723 | 697 | 711 | 445 | 374 | 2,131 | 1,451 | |||||||||||||||||||||
| Capitalized income from development projects | — | — | — | 72 | 40 | — | 71 | |||||||||||||||||||||
| Amortization of acquired above and below market leases | (757 | ) | (618 | ) | (816 | ) | (826 | ) | (830 | ) | (2,191 | ) | (2,490 | ) | ||||||||||||||
| Amortization of loan fees | 2,786 | 2,743 | 2,561 | 2,636 | 2,487 | 8,090 | 7,300 | |||||||||||||||||||||
| Amortization of debt premiums/discounts | (36 | ) | (69 | ) | 205 | 146 | 153 | 100 | 383 | |||||||||||||||||||
| Stock compensation expense | 3,068 | 3,076 | 3,228 | 4,011 | 3,729 | 9,372 | 11,541 | |||||||||||||||||||||
| Allocation to unvested restricted stock awards | 71 | 90 | 94 | 94 | 28 | 261 | 105 | |||||||||||||||||||||
| AFFO attributable to Alexandria’s common stockholders – diluted | $ | 76,960 | $ | 72,506 | $ | 71,338 | $ | 71,817 | $ | 70,206 | $ | 220,795 | $ | 204,957 | ||||||||||||||
| ALEXANDRIA REAL ESTATE EQUITIES, INC ALL RIGHTS RESERVED © 2014 | 7 |
ALEXANDRIA REAL ESTATE EQUITIES, INC.
September 30, 2014
Funds From Operations Per Share and Adjusted Funds From Operations Per Share
(Unaudited)
The following table presents a reconciliation of net income per share attributable to Alexandria’s common stockholders – basic, the most directly comparable financial measure presented in accordance with GAAP, to FFO per share attributable to Alexandria’s common stockholders – diluted, FFO per share attributable to Alexandria’s common stockholders – diluted, as adjusted, and AFFO per share attributable to Alexandria’s common stockholders – diluted. For the computation of the weighted average shares used to compute the per share information, refer to the “Definitions and Other Information” section in our supplemental information.
| Three Months Ended | Nine Months Ended | |||||||||||||||||||||||||||
| 9/30/14 | 6/30/14 | 3/31/14 | 12/31/13 | 9/30/13 | 9/30/14 | 9/30/13 | ||||||||||||||||||||||
| Net income per share attributable to Alexandria’s common stockholders – basic and diluted | $ | 0.39 | $ | 0.39 | $ | 0.46 | $ | 0.51 | $ | 0.35 | $ | 1.24 | $ | 1.08 | ||||||||||||||
| Depreciation and amortization | 0.81 | 0.81 | 0.71 | 0.68 | 0.69 | 2.34 | 2.13 | |||||||||||||||||||||
| Gain on sale of land parcel | — | (0.01 | ) | — | (0.06 | ) | — | (0.01 | ) | (0.01 | ) | |||||||||||||||||
| Amount attributable to noncontrolling interests/ unvested restricted stock awards | — | — | — | — | — | (0.01 | ) | — | ||||||||||||||||||||
| FFO per share attributable to Alexandria’s common stockholders – basic and diluted | 1.20 | 1.19 | 1.17 | 1.13 | 1.04 | 3.56 | 3.20 | |||||||||||||||||||||
| Loss on early extinguishment of debt | 0.01 | — | — | — | 0.02 | 0.01 | 0.03 | |||||||||||||||||||||
| Acquisition-related expenses | — | — | — | 0.02 | — | — | — | |||||||||||||||||||||
| Impairment of investments | — | — | — | 0.01 | — | — | — | |||||||||||||||||||||
| FFO per share attributable to Alexandria’s common stockholders – diluted, as adjusted | 1.21 | 1.19 | 1.17 | 1.16 | 1.06 | 3.57 | 3.23 | |||||||||||||||||||||
| Non-revenue-enhancing capital expenditures: | ||||||||||||||||||||||||||||
| Building improvements | (0.03 | ) | (0.02 | ) | (0.03 | ) | (0.01 | ) | (0.02 | ) | (0.08 | ) | (0.04 | ) | ||||||||||||||
| Tenant improvements and leasing commissions | (0.02 | ) | (0.06 | ) | (0.06 | ) | (0.12 | ) | (0.05 | ) | (0.14 | ) | (0.11 | ) | ||||||||||||||
| Straight-line rent revenue | (0.15 | ) | (0.18 | ) | (0.17 | ) | (0.11 | ) | (0.08 | ) | (0.50 | ) | (0.30 | ) | ||||||||||||||
| Straight-line rent expense on ground leases | 0.01 | 0.01 | 0.01 | 0.01 | 0.01 | 0.03 | 0.02 | |||||||||||||||||||||
| Amortization of acquired above and below market leases | (0.01 | ) | (0.01 | ) | (0.01 | ) | (0.01 | ) | (0.01 | ) | (0.03 | ) | (0.04 | ) | ||||||||||||||
| Amortization of loan fees | 0.03 | 0.04 | 0.04 | 0.03 | 0.03 | 0.11 | 0.12 | |||||||||||||||||||||
| Stock compensation expense | 0.04 | 0.05 | 0.05 | 0.06 | 0.05 | 0.13 | 0.17 | |||||||||||||||||||||
| Other | — | — | — | — | — | 0.01 | 0.01 | |||||||||||||||||||||
| AFFO per share attributable to Alexandria’s common stockholders – diluted | $ | 1.08 | $ | 1.02 | $ | 1.00 | $ | 1.01 | $ | 0.99 | $ | 3.10 | $ | 3.06 | ||||||||||||||
| ALEXANDRIA REAL ESTATE EQUITIES, INC ALL RIGHTS RESERVED © 2014 | 8 |
SUPPLEMENTAL
INFORMATION
ALEXANDRIA REAL ESTATE EQUITIES, INC.
September 30, 2014
Company Profile
Alexandria Real Estate Equities, Inc. (NYSE:ARE), is the largest and leading REIT uniquely focused on collaborative science and technology campuses in urban innovation clusters, with a total market capitalization of $9.1 billion as of September 30, 2014, and an asset base of 31.6 million RSF, including 18.5 million RSF of operating and current value-creation projects, as well as an additional 13.1 million RSF in future ground-up development projects. Alexandria pioneered this niche in 1994 and has since established a dominant market presence in AAA locations including Greater Boston, the San Francisco Bay Area, New York City, San Diego, Seattle, Maryland, and Research Triangle Park. Alexandria is known for its high-quality and diverse client tenant base, with approximately 53% of total ABR resulting from investment-grade client tenants (a REIT industry-leading percentage). Alexandria has a longstanding and proven track record of developing Class A assets clustered in urban science and technology campuses that provide its client tenants with highly collaborative, 24/7 live/work/play ecosystems, as well as the critical ability to successfully recruit and retain best-in-class talent and enhance productivity. We believe these advantages result in higher occupancy levels, longer lease terms, higher rental income, higher returns, and greater long-term asset value. For additional information on Alexandria, please visit www.are.com.
Unique niche strategy
Alexandria’s primary business objective is to maximize stockholder value by providing its stockholders with the greatest possible total return and long-term asset value
based on a multifaceted platform of internal and external growth. The key elements of our strategy include:
| • | A consistent focus on Class A collaborative science and technology campuses in urban innovation clusters offering highly dynamic 24/7 live/work/play ecosystems with creative amenities that enhance productivity and foster innovation; |
| • | A unique and proven cluster model concentrating on best-in-class locations, Class A assets, high-quality client tenants, highly skilled scientific and entrepreneurial management talent, and significant and strategic investment risk capital; |
| • | First-in-class facilities that complement the cutting-edge scientific and managerial talent, smart capital, and world-renowned academic and medical institutions in our clusters, providing our client tenants with dynamic ecosystems to accelerate discovery and commercialization; |
| • | Utilizing our long-term relationships with real estate professionals, top-tier investors, research institutions, and world-class global network in order to develop, acquire, and lease real estate focused on innovative science and technology companies; |
| • | Drawing upon our broad and meaningful science and technology industry relationships to attract new and leading client tenants; and |
| • | Solid and flexible capital structure to enable stable growth. |
Client tenant base
The impressive quality, diversity, breadth, and depth of our significant relationships with our client tenants provide Alexandria with solid and stable cash flows. Alexandria’s strong underwriting skills and long-term industry relationships positively distinguish Alexandria from all other publicly traded REITs and real estate companies. As of September 30, 2014, our client tenant base included the following:
| • | Investment-grade client tenants represent 53% of total ABR |
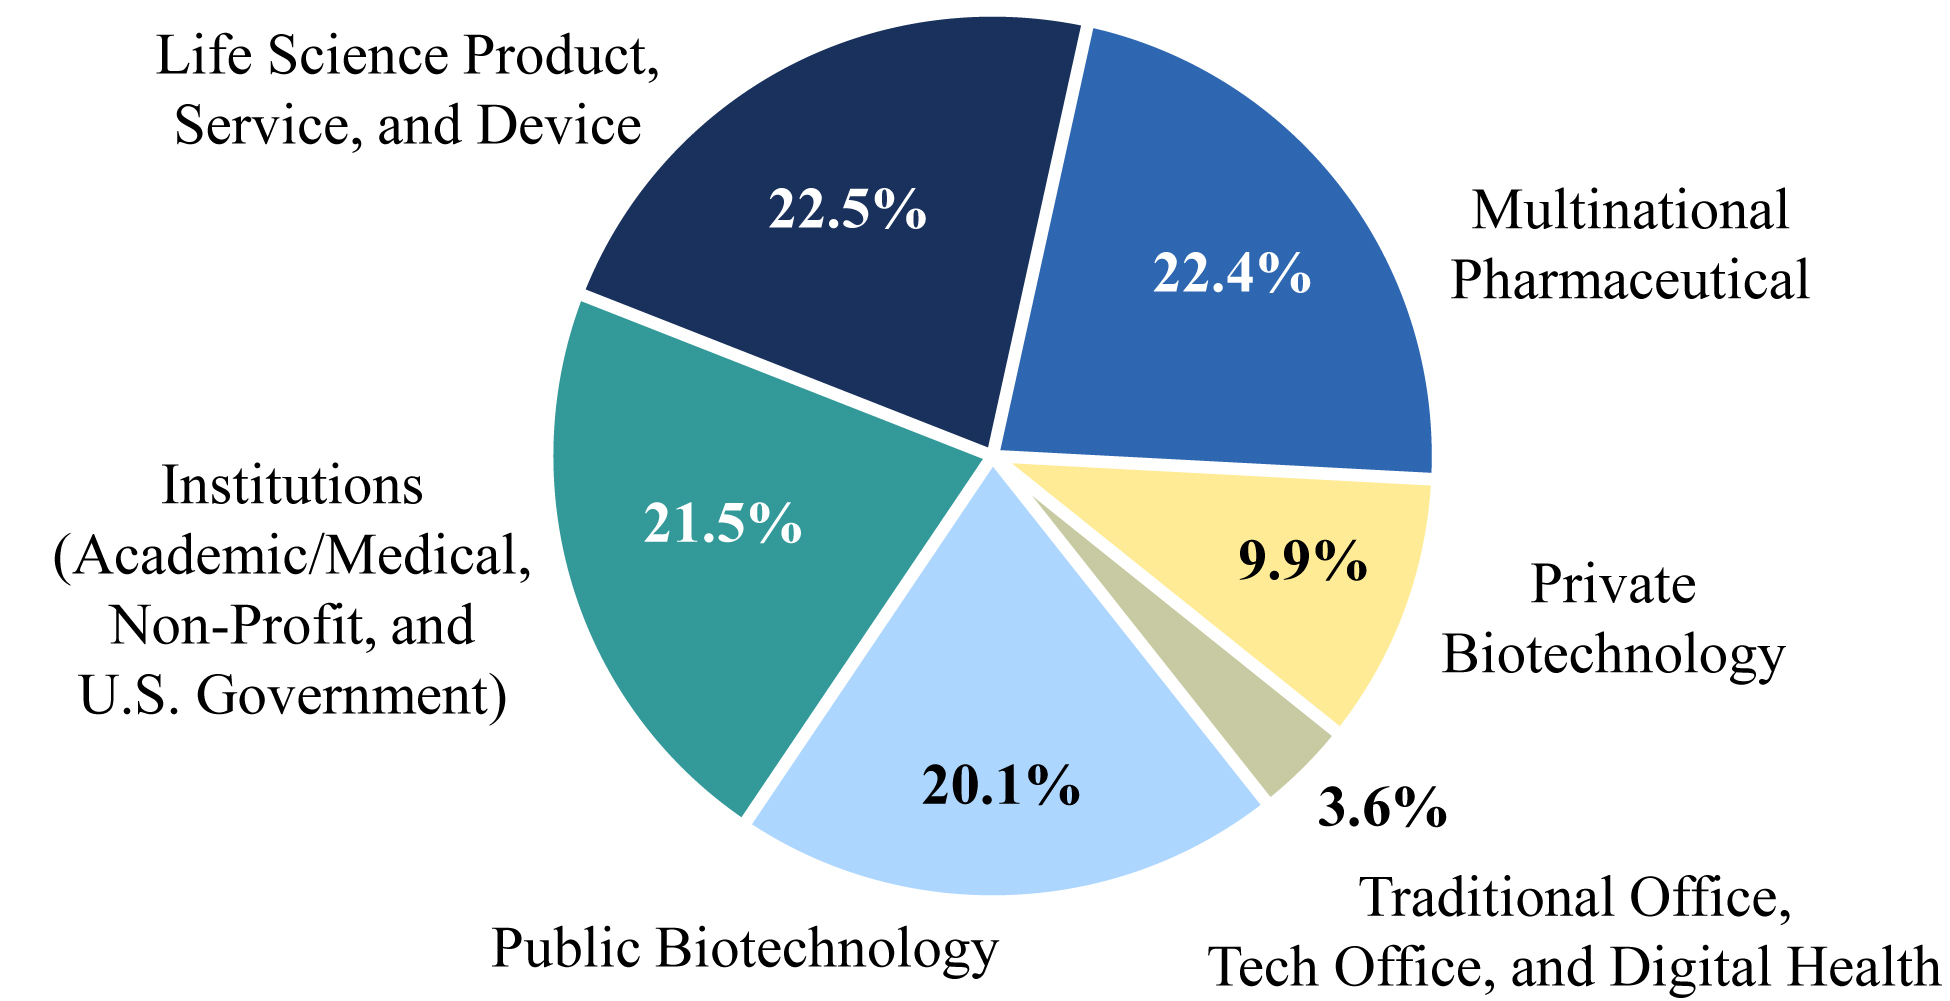
| • | Our ABR consisted of the following client tenant mix: |
| • | 22.5% from life science product, service, and device companies |
| • | 22.4% from multinational pharmaceutical companies |
| • | 21.5% from institutions (academic/medical, non-profit, and U.S. government) |
| • | 20.1% from public biotechnology companies |
| • | 9.9% from private biotechnology companies |
| • | 3.6% from traditional office, tech office, and digital health companies |
Executive/senior management
Alexandria’s executive and senior management team has unique experience and expertise in creating collaborative science and technology campuses in urban innovation clusters. From the development of high-quality, sustainable real estate, to the ongoing cultivation of collaborative ecosystems with unique amenities and events, the Alexandria team has a first-in-class reputation of excellence in its niche. Alexandria’s senior management team averages over 25 years of real estate experience, including over 12 years with Alexandria. Our sophisticated management team also includes regional market directors with leading reputations and longstanding relationships within the science and technology communities in their respective urban innovation clusters. We believe that our unparalleled expertise, experience, reputation, and key relationships with the science and technology industries provide Alexandria significant competitive advantages in attracting new business opportunities.
Executive management
| Joel S. Marcus | Chairman, Chief Executive Officer & Founder | |
| Dean A. Shigenaga | Chief Financial Officer, EVP & Treasurer | |
| Peter M. Moglia | Chief Investment Officer | |
| Stephen A. Richardson | Chief Operating Officer & Regional Market Director – San Francisco Bay Area | |
| Jennifer J. Banks | General Counsel, EVP & Corporate Secretary | |
| Thomas J. Andrews | EVP – Regional Market Director – Greater Boston | |
| Daniel J. Ryan | EVP – Regional Market Director – San Diego & Strategic Operations | |
| ALEXANDRIA REAL ESTATE EQUITIES, INC ALL RIGHTS RESERVED © 2014 | 10 |
ALEXANDRIA REAL ESTATE EQUITIES, INC.
September 30, 2014
Investor Information
| Corporate Headquarters | Trading Symbols | Information Requests | |||
| 385 East Colorado Boulevard, Suite 299 | New York Stock Exchange | Phone: | (626) 396-4828 | ||
| Pasadena, California 91101 | Common stock: ARE | E-mail: | corporateinformation@are.com | ||
| Series E preferred stock: ARE–E | Web: | www.are.com | |||
Common stock data (at the end of the quarter unless otherwise noted) | |||||||||||||||||||
| 3Q14 | 2Q14 | 1Q14 | 4Q13 | 3Q13 | |||||||||||||||
| Closing stock price | $ | 73.75 | $ | 77.64 | $ | 72.56 | $ | 63.62 | $ | 63.85 | |||||||||
| Dividend per share – quarter/annualized | $ | 0.72/2.88 | $ | 0.72/2.88 | $ | 0.70/2.80 | $ | 0.68/2.72 | $ | 0.68/2.72 | |||||||||
| Dividend payout ratio for the quarter | 60% | 61% | 60% | 59% | 65% | ||||||||||||||
| Dividend yield – annualized | 3.9% | 3.7% | 3.9% | 4.3% | 4.3% | ||||||||||||||
| Common shares outstanding (in thousands) | 71,372 | 71,318 | 71,246 | 71,172 | 71,081 | ||||||||||||||
| Market value of outstanding common shares (in thousands) | $ | 5,263,672 | $ | 5,537,136 | $ | 5,169,623 | $ | 4,527,975 | $ | 4,538,517 | |||||||||
| Total market capitalization (in thousands) | $ | 9,147,179 | $ | 9,253,401 | $ | 8,799,376 | $ | 7,949,276 | $ | 7,780,208 | |||||||||
| Equity research coverage |
| Alexandria is currently covered by the following research analysts. This list may not be complete and is subject to change as firms initiate or discontinue coverage of our company. Please note that any opinions, estimates, or forecasts regarding our historical or predicted performance made by these analysts are theirs alone and do not represent opinions, estimates, or forecasts of Alexandria or its management. Alexandria does not by its reference or distribution of the information below imply its endorsement of or concurrence with any opinions, estimates, or forecasts of these analysts. Interested persons may obtain copies of analysts’ reports on their own as we do not distribute these reports. Several of these firms may from time-to-time own our stock and/or hold other long or short positions in our stock, and may provide compensated services to us. |
| Bank of America Merrill Lynch | Cowen and Company, LLC | JMP Securities – JMP Group, Inc. | Robert W. Baird & Company | |||
| Jamie Feldman / Jeffrey Spector | James Sullivan / Tom Catherwood | Peter Martin / Aaron Hecht | David Rodgers / Mathew Spencer | |||
| (646) 855-5808 / (646) 855-1363 | (646) 562-1380 / (646) 562-1382 | (415) 835-8904 / (415) 835-3963 | (216) 737-7341 / (414) 298-5053 | |||
| Barclays Capital Inc. | Evercore Partners | J.P. Morgan Securities LLC | Standard & Poor’s | |||
| Ross Smotrich | Sheila McGrath / Nathan Crossett | Anthony Paolone | Cathy Seifert | |||
| (212) 526-2306 | (212) 497-0882 / (212) 497-0870 | (212) 622-6682 | (212) 438-9545 | |||
| Citigroup Global Markets Inc. | Green Street Advisors, Inc. | RBC Capital Markets | UBS Financial Services Inc. | |||
| Michael Bilerman / Emmanuel Korchman | Michael Knott / Kevin Tyler | Michael Carroll / Rich Moore | Ross Nussbaum / Nick Yulico | |||
| (212) 816-1383 / (212) 816-1382 | (949) 640-8780 / (949) 640-8780 | (440) 715-2649 / (440) 715-2646 | (212) 713-2484 / (212) 713-3402 | |||
| Rating agencies |
| Moody’s Investors Service | Rating | Standard & Poor’s | Rating | ||||
| Philip Kibel / Merrie Frankel | Baa2 | George Skoufis / Jaime Gitler | BBB- | ||||
| (212) 553-4569 / (212) 553-3652 | Stable Outlook | (212) 438-2608 / (212) 438-5049 | Positive Outlook | ||||
| ALEXANDRIA REAL ESTATE EQUITIES, INC ALL RIGHTS RESERVED © 2014 | 11 |
ALEXANDRIA REAL ESTATE EQUITIES, INC.
September 30, 2014
Financial and Asset Base Highlights
(Dollars in thousands, except per share amounts)
(Unaudited)
| Three Months Ended (unless stated otherwise) | ||||||||||||||||||||
| 9/30/14 | 6/30/14 | 3/31/14 | 12/31/13 | 9/30/13 | ||||||||||||||||
| Operating data | ||||||||||||||||||||
| Total revenues | $ | 185,615 | $ | 176,402 | $ | 176,186 | $ | 168,823 | $ | 158,315 | ||||||||||
| Operating margins | 69% | 70% | 70% | 70% | 70% | |||||||||||||||
| Adjusted EBITDA – quarter annualized | $ | 473,884 | $ | 452,568 | $ | 454,084 | $ | 449,456 | $ | 411,548 | ||||||||||
| Adjusted EBITDA – trailing 12 months | $ | 457,498 | $ | 441,914 | $ | 428,699 | $ | 414,119 | $ | 403,974 | ||||||||||
| Adjusted EBITDA margins – quarter annualized | 64% | 64% | 65% | 67% | 65% | |||||||||||||||
| General and administrative expense as a percentage of total assets – trailing 12 months | 0.7% | 0.7% | 0.6% | 0.6% | 0.7% | |||||||||||||||
| General and administrative expense as a percentage of total revenues – trailing 12 months | 7.4% | 7.6% | 7.6% | 7.7% | 7.9% | |||||||||||||||
| Capitalized interest | $ | 12,125 | $ | 11,302 | $ | 12,013 | $ | 14,116 | $ | 16,788 | ||||||||||
| Weighted average interest rate for capitalization of interest during period | 3.73% | 3.41% | 3.88% | 4.09% | 4.33% | |||||||||||||||
| Net income, FFO, and AFFO | ||||||||||||||||||||
| Net income attributable to Alexandria’s common stockholders | $ | 27,626 | $ | 27,932 | $ | 32,709 | $ | 36,247 | $ | 24,579 | ||||||||||
| FFO attributable to Alexandria’s common stockholders – diluted | $ | 85,574 | $ | 84,513 | $ | 83,070 | $ | 80,218 | $ | 73,594 | ||||||||||
| FFO attributable to Alexandria’s common stockholders – diluted, as adjusted | $ | 86,095 | $ | 84,513 | $ | 83,070 | $ | 82,505 | $ | 75,015 | ||||||||||
| AFFO attributable to Alexandria’s common stockholders – diluted | $ | 76,960 | $ | 72,506 | $ | 71,338 | $ | 71,817 | $ | 70,206 | ||||||||||
| Per share data | ||||||||||||||||||||
| Earnings per share attributable to Alexandria’s common stockholders – basic and diluted | $ | 0.39 | $ | 0.39 | $ | 0.46 | $ | 0.51 | $ | 0.35 | ||||||||||
| FFO per share attributable to Alexandria’s common stockholders – diluted | $ | 1.20 | $ | 1.19 | $ | 1.17 | $ | 1.13 | $ | 1.04 | ||||||||||
| FFO per share attributable to Alexandria’s common stockholders – diluted, as adjusted | $ | 1.21 | $ | 1.19 | $ | 1.17 | $ | 1.16 | $ | 1.06 | ||||||||||
| AFFO per share attributable to Alexandria’s common stockholders – diluted | $ | 1.08 | $ | 1.02 | $ | 1.00 | $ | 1.01 | $ | 0.99 | ||||||||||
| Leasing activity and same property performance | ||||||||||||||||||||
| Leasing activity – rentable square feet | 871,416 | 752,364 | 563,394 | 1,344,687 | 829,533 | |||||||||||||||
| Leasing activity – change in average new rental rates over expiring rates: | ||||||||||||||||||||
| – Rental rate increases | 18.6% | 9.9% | 18.2% | 18.2% | 16.5% | |||||||||||||||
| – Rental rate increases (cash basis) | 5.6% | 3.0% | 10.4% | 2.6% | 4.1% | |||||||||||||||
| Same property – performance over comparable quarter from prior year: | ||||||||||||||||||||
| – Same property NOI | 5.0% | 5.3% | 3.8% | 1.4% | 1.9% | |||||||||||||||
| – Same property NOI (cash basis) | 5.9% | 5.7% | 4.3% | 4.6% | 4.7% | |||||||||||||||
| ALEXANDRIA REAL ESTATE EQUITIES, INC ALL RIGHTS RESERVED © 2014 | 12 |
ALEXANDRIA REAL ESTATE EQUITIES, INC.
September 30, 2014
Financial and Asset Base Highlights (continued)
(Dollars in thousands, except per leased RSF amounts)
(Unaudited)
| Three Months Ended (unless stated otherwise) | ||||||||||||||||||||
| 9/30/14 | 6/30/14 | 3/31/14 | 12/31/13 | 9/30/13 | ||||||||||||||||
| Asset base statistics – at end of period | ||||||||||||||||||||
| Number of properties | 194 | 191 | 189 | 184 | 180 | |||||||||||||||
| Rentable square feet (operating and current value-creation projects) | 18,458,379 | 17,881,108 | 17,715,931 | 17,461,030 | 17,260,189 | |||||||||||||||
| Total square footage (including near-term and future developable square feet) | 31,617,818 | 31,378,329 | 31,239,652 | 30,934,751 | 30,883,069 | |||||||||||||||
| ABR per occupied RSF | $ | 37.23 | $ | 36.76 | $ | 36.18 | $ | 35.90 | $ | 35.20 | ||||||||||
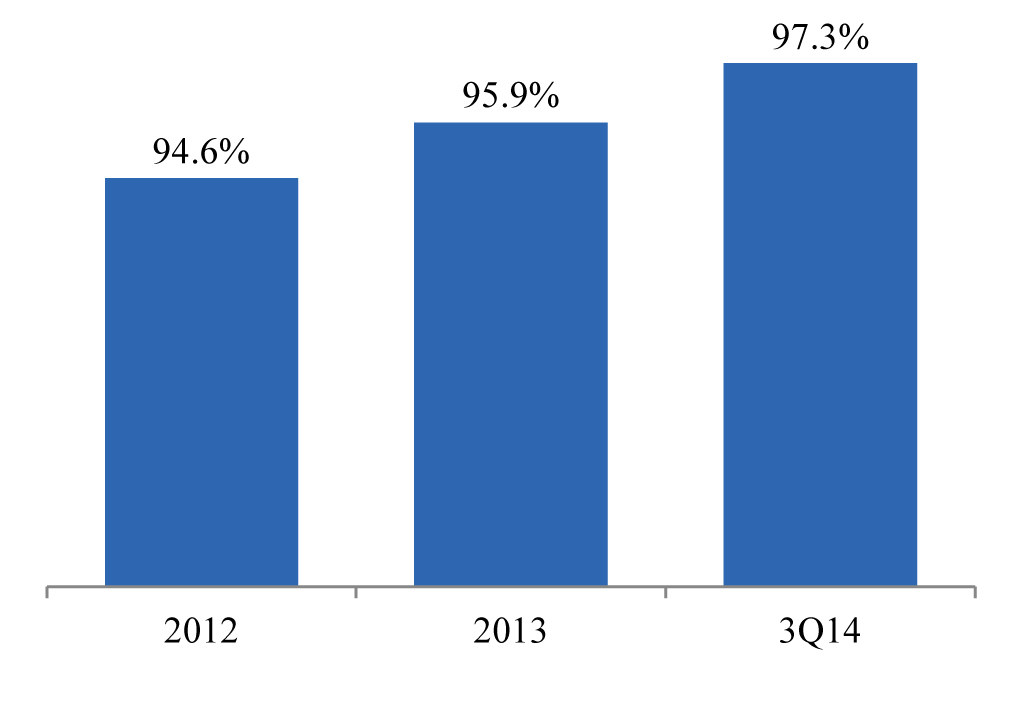
| Occupancy of operating properties – North America | 97.3% | 96.9% | 96.6% | 95.9% | 95.0% | |||||||||||||||
| Occupancy of operating and redevelopment properties – North America | 96.3% | 95.6% | 95.1% | 95.5% | 94.5% | |||||||||||||||
| Occupancy of operating properties | 94.9% | 95.3% | 94.9% | 94.4% | 93.5% | |||||||||||||||
| Occupancy of operating and redevelopment properties | 94.0% | 94.0% | 93.5% | 93.8% | 92.8% | |||||||||||||||
Selected balance sheet information – at end of period | ||||||||||||||||||||
| Gross investments in real estate | $ | 8,280,799 | $ | 8,069,927 | $ | 7,923,080 | $ | 7,729,020 | $ | 7,529,255 | ||||||||||
| Total assets | $ | 8,020,314 | $ | 7,815,649 | $ | 7,756,039 | $ | 7,529,764 | $ | 7,358,369 | ||||||||||
| Gross assets | $ | 9,103,483 | $ | 8,855,459 | $ | 8,748,857 | $ | 8,481,870 | $ | 8,273,863 | ||||||||||
| Total unsecured debt | $ | 2,864,290 | $ | 2,719,310 | $ | 2,654,270 | $ | 2,352,230 | $ | 2,162,190 | ||||||||||
| Total debt | $ | 3,501,115 | $ | 3,334,861 | $ | 3,251,781 | $ | 3,061,061 | $ | 2,870,843 | ||||||||||
| Net debt | $ | 3,409,847 | $ | 3,248,641 | $ | 3,146,357 | $ | 2,975,656 | $ | 2,786,350 | ||||||||||
| Total liabilities | $ | 4,063,199 | $ | 3,826,766 | $ | 3,751,534 | $ | 3,550,823 | $ | 3,377,395 | ||||||||||
| Common shares outstanding (in thousands) | 71,372 | 71,318 | 71,246 | 71,172 | 71,081 | |||||||||||||||
| Total market capitalization | $ | 9,147,179 | $ | 9,253,401 | $ | 8,799,376 | $ | 7,949,276 | $ | 7,780,208 | ||||||||||
| Key credit metrics | ||||||||||||||||||||
| Net debt to Adjusted EBITDA – quarter annualized | 7.2x | 7.2x | 6.9x | 6.6x | 6.8x | |||||||||||||||
| Net debt to Adjusted EBITDA – trailing 12 months | 7.5x | 7.4x | 7.3x | 7.2x | 6.9x | |||||||||||||||
| Fixed charge coverage ratio – quarter annualized | 3.3x | 3.5x | 3.3x | 3.2x | 2.8x | |||||||||||||||
| Fixed charge coverage ratio – trailing 12 months | 3.3x | 3.2x | 3.0x | 2.9x | 2.8x | |||||||||||||||
| Non-income-producing assets as a percentage of gross investments in real estate | 17% | 17% | 17% | 17% | 20% | |||||||||||||||
| Unencumbered NOI as a percentage of total NOI | 84% | 84% | 83% | 69% | 69% | |||||||||||||||
| Dividend payout ratio (common stock) | 60% | 61% | 60% | 59% | 65% | |||||||||||||||
| ALEXANDRIA REAL ESTATE EQUITIES, INC ALL RIGHTS RESERVED © 2014 | 13 |
ALEXANDRIA REAL ESTATE EQUITIES, INC.
September 30, 2014
Operating Metrics
(Unaudited)
Occupancy of Operating Properties North America | Same Property NOI Growth | NOI (In millions) | ||||
 |  |  | ||||
 | ||||||
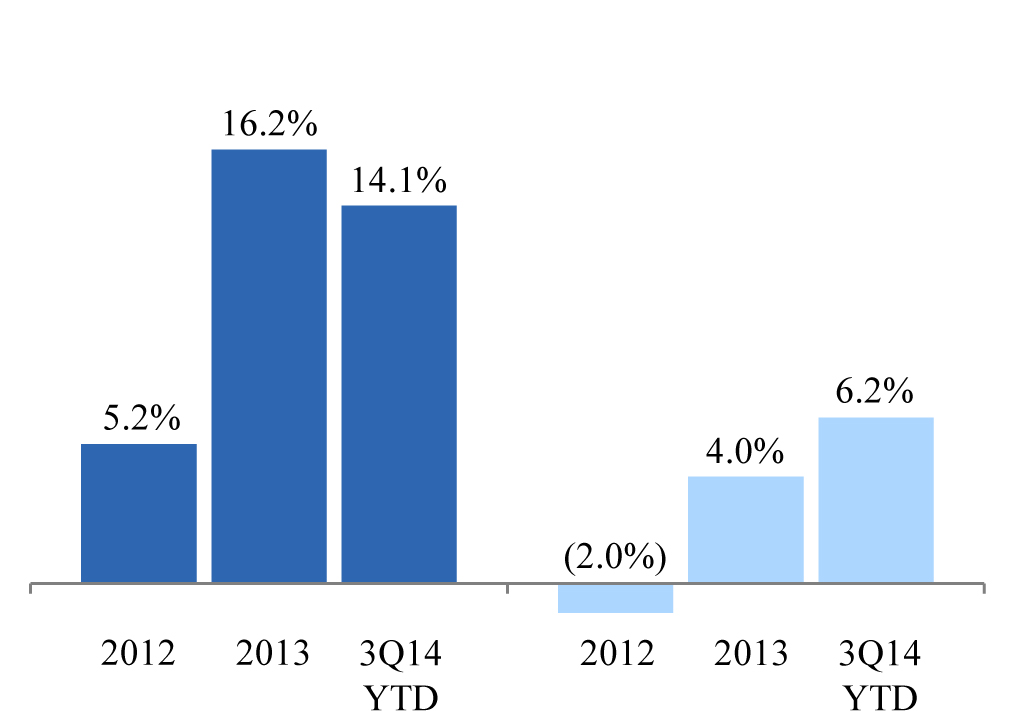
| Drivers of Cash NOI Growth | Rental Rate Growth: Renewed/Re-leased Space | Operating Margin | ||||
 |  | |||||
Percentage of leases containing annual rent escalations | 95% | |||||
Percentage of triple net leases | 95% | |||||
Percentage of leases providing for the recapture of capital expenditures | 93% | |||||
| ||||||
| ALEXANDRIA REAL ESTATE EQUITIES, INC ALL RIGHTS RESERVED © 2014 | 14 |
ALEXANDRIA REAL ESTATE EQUITIES, INC.
September 30, 2014
Same Property Performance
(Dollars in thousands)
(Unaudited)
| Same Property Financial Data | 3Q14 | YTD 3Q14 | Same Property Statistical Data | 3Q14 | YTD 3Q14 | |||||
| Percentage change over comparable period from prior year: | Number of same properties | 154 | 153 | |||||||
| NOI | 5.0% | 4.5% | Rentable square feet | 13,677,346 | 13,442,099 | |||||
| NOI (cash basis) | 5.9% | 5.2% | Occupancy – current period average | 96.9% | 96.6% | |||||
| Operating margin | 68% | 69% | Occupancy – same period prior year average | 93.6% | 93.3% | |||||
| Three Months Ended September 30, | Nine Months Ended September 30, | |||||||||||||||||||||||||||||
| 2014 | 2013 | $ Change | % Change | 2014 | 2013 | $ Change | % Change | |||||||||||||||||||||||
| Revenues: | ||||||||||||||||||||||||||||||
| Rental – same properties | $ | 117,411 | $ | 111,069 | $ | 6,342 | 5.7 | % | $ | 333,706 | $ | 320,053 | $ | 13,653 | 4.3 | % | ||||||||||||||
| Rental – non-same properties | 20,307 | 4,983 | 15,324 | 307.5 | 69,574 | 22,018 | 47,556 | 216.0 | ||||||||||||||||||||||
| Total rental | 137,718 | 116,052 | 21,666 | 18.7 | 403,280 | 342,071 | 61,209 | 17.9 | ||||||||||||||||||||||
| Tenant recoveries – same properties | 40,890 | 37,401 | 3,489 | 9.3 | 112,278 | 103,987 | 8,291 | 8.0 | ||||||||||||||||||||||
| Tenant recoveries – non-same properties | 4,682 | 1,290 | 3,392 | 262.9 | 15,920 | 6,138 | 9,782 | 159.4 | ||||||||||||||||||||||
| Total tenant recoveries | 45,572 | 38,691 | 6,881 | 17.8 | 128,198 | 110,125 | 18,073 | 16.4 | ||||||||||||||||||||||
| Other income – same properties | 22 | 10 | 12 | 120.0 | 321 | 140 | 181 | 129.3 | ||||||||||||||||||||||
| Other income – non-same properties | 2,303 | 3,562 | (1,259 | ) | (35.3 | ) | 6,404 | 9,992 | (3,588 | ) | (35.9 | ) | ||||||||||||||||||
| Total other income | 2,325 | 3,572 | (1,247 | ) | (34.9 | ) | 6,725 | 10,132 | (3,407 | ) | (33.6 | ) | ||||||||||||||||||
| Total revenues – same properties | 158,323 | 148,480 | 9,843 | 6.6 | 446,305 | 424,180 | 22,125 | 5.2 | ||||||||||||||||||||||
| Total revenues – non-same properties | 27,292 | 9,835 | 17,457 | 177.5 | 91,898 | 38,148 | 53,750 | 140.9 | ||||||||||||||||||||||
| Total revenues | 185,615 | 158,315 | 27,300 | 17.2 | 538,203 | 462,328 | 75,875 | 16.4 | ||||||||||||||||||||||
| Expenses: | ||||||||||||||||||||||||||||||
| Rental operations – same properties | 51,229 | 46,465 | 4,764 | 10.3 | 139,759 | 130,937 | 8,822 | 6.7 | ||||||||||||||||||||||
| Rental operations – non-same properties | 6,194 | 1,219 | 4,975 | 408.1 | 22,524 | 8,210 | 14,314 | 174.3 | ||||||||||||||||||||||
| Total rental operations | 57,423 | 47,684 | 9,739 | 20.4 | 162,283 | 139,147 | 23,136 | 16.6 | ||||||||||||||||||||||
| Net operating income: | ||||||||||||||||||||||||||||||
| NOI – same properties | 107,094 | 102,015 | 5,079 | 5.0 | 306,546 | 293,243 | 13,303 | 4.5 | ||||||||||||||||||||||
| NOI – non-same properties | 21,098 | 8,616 | 12,482 | 144.9 | 69,374 | 29,938 | 39,436 | 131.7 | ||||||||||||||||||||||
| Total NOI | $ | 128,192 | $ | 110,631 | $ | 17,561 | 15.9 | % | $ | 375,920 | $ | 323,181 | $ | 52,739 | 16.3 | % | ||||||||||||||
| NOI – same properties | $ | 107,094 | $ | 102,015 | $ | 5,079 | 5.0 | % | $ | 306,546 | $ | 293,243 | $ | 13,303 | 4.5 | % | ||||||||||||||
| Less: straight-line rent adjustments | (4,974 | ) | (5,596 | ) | 622 | (11.1 | ) | (15,467 | ) | (16,575 | ) | 1,108 | (6.7 | ) | ||||||||||||||||
| NOI (cash basis) – same properties | $ | 102,120 | $ | 96,419 | $ | 5,701 | 5.9 | % | $ | 291,079 | $ | 276,668 | $ | 14,411 | 5.2 | % | ||||||||||||||
| ALEXANDRIA REAL ESTATE EQUITIES, INC ALL RIGHTS RESERVED © 2014 | 15 |
ALEXANDRIA REAL ESTATE EQUITIES, INC.
September 30, 2014
Same Property Performance (continued)
(Unaudited)
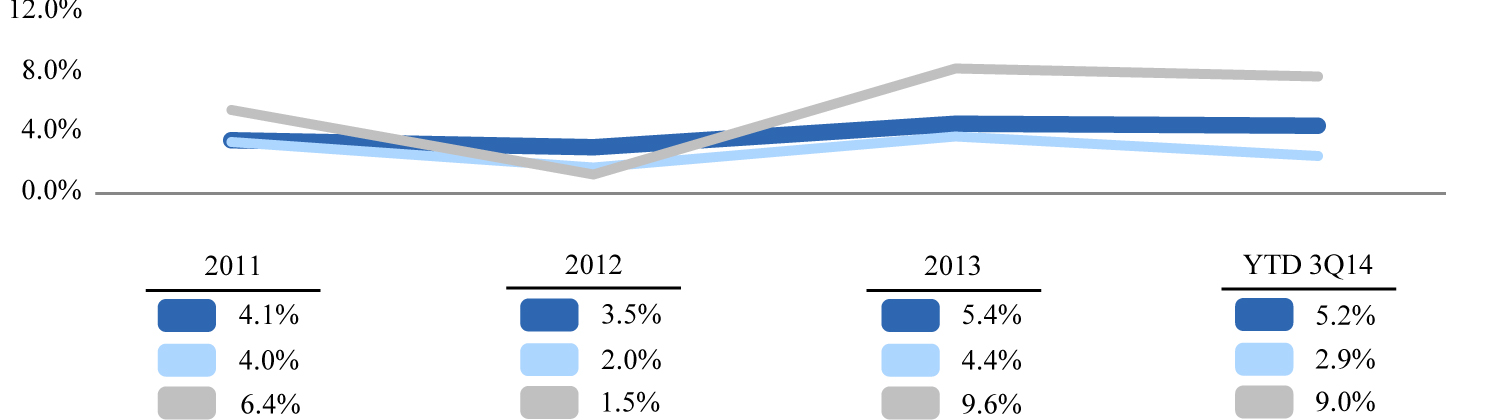
The charts below provide two alternative calculations of same property performance in comparison to our historical same property performance. Our reported same property performance has been based upon a pool of operating assets and completed developed and redeveloped assets to the extent that those assets were operating for the entirety of the comparable same property periods presented. The two alternative calculations presented below consist of (i) same property performance for the operating portfolio excluding assets that were recently developed or redeveloped and (ii) the same property performance for the operating portfolio including those assets that were either under current redevelopment or previously completed redevelopments. From 2011 through 2013, our same property performance was generally consistent in each of the three calculations. For the nine months ended September 30, 2014, and the year ended December 31, 2013, same property performance including redevelopment properties, as shown in the table, would have been meaningfully higher than our traditional method of reporting same property performance. Same property performance including redevelopment properties will, from time to time, have significant growth in NOI as a result of the completion of the conversion of non-laboratory space (with lower NOI) to laboratory/office space (with higher NOI) through redevelopment. We believe our traditional method of reporting same property performance is a more useful presentation since it excludes the potential significant increases in performance as a result of completion of significant redevelopment projects.
| Percentage change in same property NOI over preceding period |
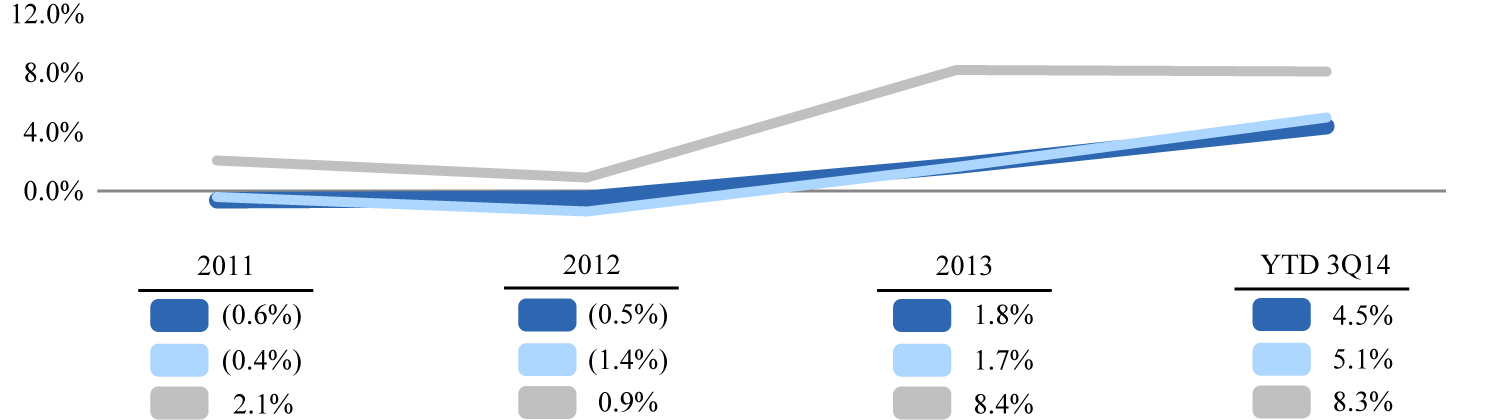 |
| Percentage change in same property NOI over preceding period – cash basis |
 |
| NOI Included in All Comparative Periods | |||||||||||
Operating Properties | Recently Completed | Properties Under Active | |||||||||
| Legend | Developments | Redevelopments | Development | Redevelopment | |||||||
 | Same property data as reported | Yes | Yes (1) | Yes (1) | No | No | |||||
| Same property operating portfolio | Yes | No | No | No | No | ||||||
| Same property data including redevelopments | Yes | No | Yes | No | Yes | ||||||
| (1) | Recently delivered developments and redevelopments are included in the same property data for each of the year-over-year comparison periods only if the property was operating during both entire same property periods. For example, projects completed during 2012 are included in 2014 versus 2013 same property performance (as a percentage change over 2013). |
The following table reconciles same properties to total properties for the nine months ended September 30, 2014:
| Development – current | Properties | |||
| 75/125 Binney Street | 1 | |||
| 499 Illinois Street | 1 | |||
1455/1515 Third Street (unconsolidated JV) | 2 | |||
| 3013/3033 Science Park Road | 2 | |||
| 5200 Illumina Way – Building 6 | 1 | |||
| 430 East 29th Street | 1 | |||
| 360 Longwood Avenue (unconsolidated JV) | 1 | |||
| 9 | ||||
| Development – deliveries since January 1, 2013 | Properties | |||
| 225 Binney Street | 1 | |||
| 269 East Grand Avenue | 1 | |||
| 2 | ||||
| Redevelopment – current | Properties | |||
| 225 Second Avenue | 1 | |||
| 11055/11065 Roselle Street | 2 | |||
| 3 | ||||
| Redevelopment – deliveries since January 1, 2013 | Properties | |||
| 400 Technology Square | 1 | |||
| 1551 Eastlake Avenue East | 1 | |||
| 285 Bear Hill Road | 1 | |||
| 343 Oyster Point Boulevard | 1 | |||
| 1616 Eastlake Avenue East | 1 | |||
| 9800 Medical Center Drive | 3 | |||
| 4757 Nexus Center Drive | 1 | |||
| 11075 Roselle Street | 1 | |||
| 10121 Barnes Canyon Road | 1 | |||
| 11 | ||||
| Summary | Properties | ||
| Development – current | 9 | ||
| Development – deliveries | 2 | ||
| Redevelopment – current | 3 | ||
| Redevelopment – deliveries | 11 | ||
| Development/redevelopment – Asia | 5 | ||
| Acquisitions in North America since January 1, 2013: | |||
| 10151 Barnes Canyon Road | 1 | ||
| 407 Davis Drive | 1 | ||
| 150 Second Street | 1 | ||
| 3545 Cray Court | 1 | ||
| 4025/4031/4045 Sorrento Valley Boulevard | 3 | ||
| Properties “held for sale” | 4 | ||
| Total properties excluded from same properties | 41 | ||
| Same properties | 153 | ||
| Total properties as of September 30, 2014 | 194 | ||
| ALEXANDRIA REAL ESTATE EQUITIES, INC ALL RIGHTS RESERVED © 2014 | 16 |
ALEXANDRIA REAL ESTATE EQUITIES, INC.
September 30, 2014
Leasing Activity
(Unaudited)
Three Months Ended September 30, 2014 | Nine Months Ended September 30, 2014 | Year Ended December 31, 2013 | ||||||||||||||||||||||
Including Straight-line Rent | Cash Basis | Including Straight-line Rent | Cash Basis | Including Straight-line Rent | Cash Basis | |||||||||||||||||||
| Leasing activity: | ||||||||||||||||||||||||
Renewed/re-leased space (1) | ||||||||||||||||||||||||
| Rental rate changes | 18.6% | 5.6% | 14.1% | 6.2% | 16.2% | 4.0% | ||||||||||||||||||
| New rates | $ | 36.42 | $ | 36.40 | $ | 41.05 | $ | 41.51 | $ | 32.00 | $ | 31.04 | ||||||||||||
| Expiring rates | $ | 30.70 | $ | 34.47 | $ | 35.97 | $ | 39.07 | $ | 27.53 | $ | 29.84 | ||||||||||||
| Rentable square footage | 169,248 | 1,129,082 | 1,838,397 | |||||||||||||||||||||
| Number of leases | 25 | 99 | 120 | |||||||||||||||||||||
| TIs/lease commissions per square foot | $ | 6.78 | $ | 8.57 | $ | 8.65 | ||||||||||||||||||
| Average lease terms | 2.3 years | 3.3 years | 5.2 years | |||||||||||||||||||||
| Developed/redeveloped/previously vacant space leased | ||||||||||||||||||||||||
| New rates | $ | 45.19 | $ | 39.15 | $ | 41.84 | $ | 37.18 | $ | 44.63 | $ | 41.86 | ||||||||||||
| Rentable square footage | 702,168 | 1,058,091 | 1,806,659 | |||||||||||||||||||||
| Number of leases | 19 | 47 | 92 | |||||||||||||||||||||
| TIs/lease commissions per square foot | $ | 13.07 | $ | 13.86 | $ | 19.16 | ||||||||||||||||||
| Average lease terms | 13.8 years | 11.8 years | 10.0 years | |||||||||||||||||||||
| Leasing activity summary (totals): | ||||||||||||||||||||||||
| New rates | $ | 43.49 | $ | 38.61 | $ | 41.43 | $ | 39.42 | $ | 38.26 | $ | 36.40 | ||||||||||||
| Rentable square footage | 871,416 | 2,187,173 | (2) | 3,645,056 | ||||||||||||||||||||
| Number of leases | 44 | 146 | 212 | |||||||||||||||||||||
| TIs/lease commissions per square foot | $ | 11.85 | $ | 11.13 | $ | 13.86 | ||||||||||||||||||
| Average lease terms | 11.6 years | 7.4 years | 7.6 years | |||||||||||||||||||||
Lease expirations (1) | ||||||||||||||||||||||||
| Expiring rates | $ | 29.75 | $ | 33.55 | $ | 34.11 | $ | 36.99 | $ | 27.74 | $ | 30.16 | ||||||||||||
| Rentable square footage | 198,961 | 1,279,634 | 2,127,190 | |||||||||||||||||||||
| Number of leases | 34 | 117 | 151 | |||||||||||||||||||||
| (1) | Leasing activity and lease expirations exclude month to month leases. The respective leasing activity was 19 month-to-month leases for 92,087 RSF at September 30, 2014, and 13 month-to-month leases for 22,172 RSF at December 31, 2013. |
| (2) | During the nine months ended September 30, 2014, we granted tenant concessions/free rent averaging approximately 2.9 months with respect to the 2,187,173 RSF leased. |
| ALEXANDRIA REAL ESTATE EQUITIES, INC ALL RIGHTS RESERVED © 2014 | 17 |
ALEXANDRIA REAL ESTATE EQUITIES, INC.
September 30, 2014
Lease Expirations
(Unaudited)
| Year of Lease Expiration | Number of Leases Expiring | RSF of Expiring Leases | Percentage of Aggregate Total RSF | ABR of Expiring Leases (per RSF) | |||||||||||||||||
| 2014 | 16 | (1) | 222,245 | (1) | 1.4 | % | $ | 31.78 | |||||||||||||
| 2015 | 87 | 1,156,406 | 7.4 | % | $ | 28.24 | |||||||||||||||
| 2016 | 88 | 1,386,496 | 8.9 | % | $ | 34.81 | |||||||||||||||
| 2017 | 83 | 1,684,354 | 10.8 | % | $ | 28.39 | |||||||||||||||
| 2018 | 63 | 1,586,679 | 10.1 | % | $ | 40.19 | |||||||||||||||
| 2019 | 54 | 1,306,795 | 8.3 | % | $ | 36.15 | |||||||||||||||
| 2020 | 33 | 1,144,822 | 7.3 | % | $ | 37.21 | |||||||||||||||
| 2021 | 31 | 1,125,173 | 7.2 | % | $ | 38.90 | |||||||||||||||
| 2022 | 17 | 633,004 | 4.0 | % | $ | 29.45 | |||||||||||||||
| 2023 | 21 | 1,076,027 | 6.9 | % | $ | 35.40 | |||||||||||||||
| Thereafter | 41 | 3,302,422 | 21.1 | % | $ | 44.61 | |||||||||||||||
| 2014 RSF of Expiring Leases | ABR of Expiring Leases (per RSF) | 2015 RSF of Expiring Leases | ABR of Expiring Leases (per RSF) | ||||||||||||||||||||||||||||||||||||
| Leased | Negotiating/ Anticipating | Targeted for Redevelopment | Remaining Expiring Leases | Total (1) | Leased | Negotiating/ Anticipating | Targeted for Redevelopment | Remaining Expiring Leases | Total | ||||||||||||||||||||||||||||||
| Market | |||||||||||||||||||||||||||||||||||||||
| Greater Boston | 51,270 | — | — | 13,111 | 64,381 | $ | 36.01 | 13,320 | 32,271 | — | 265,844 | 311,435 | $ | 34.76 | |||||||||||||||||||||||||
| San Francisco Bay Area | — | 2,894 | — | — | 2,894 | 34.23 | 71,746 | 47,610 | — | 76,441 | 195,797 | 34.22 | |||||||||||||||||||||||||||
| New York City | 49,550 | — | — | 21,712 | 71,262 | 31.05 | — | — | — | 9,380 | 9,380 | N/A | |||||||||||||||||||||||||||
| San Diego | — | — | — | — | — | — | 51,768 | — | 48,880 | (2) | 96,083 | 196,731 | 22.25 | ||||||||||||||||||||||||||
| Seattle | 5,991 | — | — | 900 | 6,891 | N/A | — | 21,811 | — | 44,883 | 66,694 | 25.45 | |||||||||||||||||||||||||||
| Maryland | — | — | — | 67,012 | (3) | 67,012 | 28.30 | — | 36,576 | — | 131,158 | 167,734 | 20.04 | ||||||||||||||||||||||||||
| Research Triangle Park | — | — | — | 249 | 249 | N/A | — | 38,274 | — | 158,321 | 196,595 | 20.43 | |||||||||||||||||||||||||||
| Non-cluster markets | — | — | — | 5,487 | 5,487 | 24.86 | — | — | — | 7,117 | 7,117 | 21.48 | |||||||||||||||||||||||||||
| Asia | — | 4,069 | — | — | 4,069 | 11.64 | — | — | — | 4,923 | 4,923 | 17.08 | |||||||||||||||||||||||||||
| Total | 106,811 | 6,963 | — | 108,471 | 222,245 | $ | 31.78 | 136,834 | 176,542 | 48,880 | 794,150 | 1,156,406 | $ | 28.24 | |||||||||||||||||||||||||
| Percentage of expiring leases | 48 | % | 3 | % | — | % | 49 | % | 100 | % | 12 | % | 15 | % | 4 | % | 69 | % | 100 | % | |||||||||||||||||||
| (1) | Excludes 19 month-to-month leases for 92,087 RSF. |
| (2) | Represents the RSF at 10151 Barnes Canyon Road, which was acquired in 3Q13. This property will undergo conversion into tech office space through redevelopment in 4Q15 upon expiration of the lease that has been in place since the acquisition of the property. |
| (3) | Includes a 54,906 RSF lease expiration in 4Q14 at our 5 Research Court project in Rockville. Subject to local market conditions, this property may undergo conversion from non-laboratory into laboratory/office through redevelopment upon rollover. |
| ALEXANDRIA REAL ESTATE EQUITIES, INC ALL RIGHTS RESERVED © 2014 | 18 |
ALEXANDRIA REAL ESTATE EQUITIES, INC.
September 30, 2014
Top 20 Client Tenants
(Dollars in thousands)
(Unaudited)
Remaining Lease Term in Years (1) | Aggregate RSF | ABR | Percentage of Aggregate ABR | Investment-Grade Ratings | |||||||||||||||||||
| Client Tenant | Fitch | Moody’s | S&P | ||||||||||||||||||||
| 1 | Novartis AG | 2.9 | 699,071 | $ | 34,030 | 6.2 | % | AA | Aa3 | AA- | |||||||||||||
| 2 | Illumina, Inc. | 15.9 | 569,294 | 25,649 | 4.7 | — | — | — | |||||||||||||||
| 3 | New York University | 16.0 | 207,777 | 19,778 | 3.6 | — | Aa3 | AA- | |||||||||||||||
| 4 | Roche | 5.3 | 409,734 | 18,656 | 3.4 | AA | A1 | AA | |||||||||||||||
| 5 | United States Government | 8.8 | 399,633 | 17,923 | 3.3 | AAA | Aaa | AA+ | |||||||||||||||
| 6 | Eli Lilly and Company | 9.1 | 257,119 | 15,257 | 2.8 | A | A2 | AA- | |||||||||||||||
| 7 | Amgen Inc. | 9.0 | 401,623 | 14,404 | 2.6 | BBB | Baa1 | A | |||||||||||||||
| 8 | FibroGen, Inc. | 9.1 | 234,249 | 14,197 | 2.6 | — | — | — | |||||||||||||||
| 9 | Biogen Idec Inc. | 13.7 | 313,872 | 13,707 | 2.5 | — | Baa1 | A- | |||||||||||||||
| 10 | Dana-Farber Cancer Institute, Inc. | 15.5 | 154,100 | 11,483 | 2.1 | — | A1 | — | |||||||||||||||
| 11 | Bristol-Myers Squibb Company | 4.3 | 251,316 | 10,087 | 1.8 | A- | A2 | A+ | |||||||||||||||
| 12 | Celgene Corporation | 6.9 | 268,836 | 10,024 | 1.8 | — | Baa2 | BBB+ | |||||||||||||||
| 13 | The Scripps Research Institute | 2.0 | 218,031 | 9,965 | 1.8 | AA- | Aa3 | — | |||||||||||||||
| 14 | The Regents of the University of California | 8.7 | 230,446 | 9,960 | 1.8 | AA | Aa2 | AA | |||||||||||||||
| 15 | GlaxoSmithKline plc | 4.8 | 208,394 | 9,944 | 1.8 | A+ | A2 | A+ | |||||||||||||||
| 16 | Massachusetts Institute of Technology | 3.2 | 202,897 | 9,535 | 1.7 | — | Aaa | AAA | |||||||||||||||
| 17 | Alnylam Pharmaceuticals, Inc. | 7.0 | 129,424 | 6,955 | 1.3 | — | — | — | |||||||||||||||
| 18 | AstraZeneca PLC | 2.3 | 218,308 | 6,835 | 1.2 | AA- | A2 | AA- | |||||||||||||||
| 19 | Pfizer Inc. | 5.1 | 128,348 | 6,396 | 1.2 | A+ | A1 | AA | |||||||||||||||
| 20 | Gilead Sciences, Inc. | 5.8 | 109,969 | 5,824 | 1.1 | — | Baa1 | A- | |||||||||||||||
| Total/weighted average | 8.4 | 5,612,441 | $ | 270,609 | 49.3 | % | |||||||||||||||||
| Investment-Grade Client Tenants: |
| 53% |
of ARE’s Total ABR |
| (1) | Represents remaining lease term in years based on percentage of aggregate ABR in effect as of September 30, 2014. |
| ALEXANDRIA REAL ESTATE EQUITIES, INC ALL RIGHTS RESERVED © 2014 | 19 |
ALEXANDRIA REAL ESTATE EQUITIES, INC.
September 30, 2014
Client Tenant Mix
(Unaudited)
 | |
| (By ABR) | |
| Multinational Pharmaceutical | Institutions (Academic/Medical, Non-Profit, and U.S. Government) | Life Science Product, Service, and Device | Biotechnology: Public & Private | |||
• Astellas Pharma Inc. • AstraZeneca PLC • Bayer AG • Bristol-Myers Squibb Company • Eisai Co., Ltd. • Eli Lilly and Company • GlaxoSmithKline plc • Merck & Co., Inc. • Novartis AG • Pfizer Inc. • Roche • Sanofi • Shire plc • UCB S.A. | • Dana-Farber Cancer Institute, Inc. • Duke University • Environmental Protection Agency • Fred Hutchinson Cancer Research Center • Massachusetts Institute of Technology • National Institutes of Health • New York University • Partners HealthCare System, Inc. • Sanford-Burnham Medical Research Institute • Stanford University • The Regents of the University of California • The Scripps Research Institute • UMass Memorial Health Care, Inc. • University of North Carolina Health Care System • United States Government • University of Washington | • Aramco Services Company • BASF Corporation • Canon U.S. Life Sciences, Inc. • Covance Inc. • DSM N.V. • Fluidigm Corporation • Foundation Medicine, Inc. • Google Inc. • Illumina, Inc. • Laboratory Corporation of America Holdings • Monsanto Company • Myriad Genetics, Inc. • Quest Diagnostics Incorporated • Sigma-Aldrich Corporation • Thermo Fisher Scientific Inc. | • Alnylam Pharmaceuticals, Inc. • Amgen Inc. • Biogen Idec Inc. • bluebird bio, Inc. • Celgene Corporation • Constellation Pharmaceuticals, Inc. • Epizyme, Inc. • FibroGen, Inc. • FORMA Therapeutics, Inc. • Gilead Sciences, Inc. • Medivation, Inc. • Nektar Therapeutics • Principia Biopharma Inc. • Proteostasis Therapeutics, Inc. • Quanticel Pharmaceuticals, Inc. • Theravance Biopharma, Inc. • Warp Drive Bio, LLC | |||
| ALEXANDRIA REAL ESTATE EQUITIES, INC ALL RIGHTS RESERVED © 2014 | 20 |
ALEXANDRIA REAL ESTATE EQUITIES, INC.
September 30, 2014
Summary of Properties and Occupancy
(Unaudited)
Summary of properties
| RSF | Number of Properties | ABR (Dollars in thousands) | |||||||||||||||||||||||
| Market | Operating | Development | Redevelopment | Total | % Total | ||||||||||||||||||||
| Greater Boston | 3,701,814 | 647,706 | 112,500 | 4,462,020 | 24 | % | 39 | $ | 162,524 | 30 | % | ||||||||||||||
| San Francisco Bay Area | 2,805,096 | 484,921 | — | 3,290,017 | 18 | 28 | 116,755 | 21 | |||||||||||||||||
| New York City | 725,099 | 188,196 | — | 913,295 | 5 | 6 | 51,507 | 9 | |||||||||||||||||
| San Diego | 2,897,492 | 315,601 | 31,277 | 3,244,370 | 18 | 47 | 98,747 | 18 | |||||||||||||||||
| Seattle | 746,260 | — | — | 746,260 | 4 | 10 | 29,941 | 6 | |||||||||||||||||
| Maryland | 2,156,196 | — | — | 2,156,196 | 12 | 29 | 50,449 | 9 | |||||||||||||||||
| Research Triangle Park | 1,025,786 | — | — | 1,025,786 | 6 | 15 | 21,631 | 4 | |||||||||||||||||
| Canada | 1,103,507 | — | — | 1,103,507 | 6 | 5 | 9,031 | 2 | |||||||||||||||||
| Non-cluster markets | 60,178 | — | — | 60,178 | — | 2 | 997 | — | |||||||||||||||||
| North America | 15,221,428 | 1,636,424 | 143,777 | 17,001,629 | 93 | 181 | 541,582 | 99 | |||||||||||||||||
| Asia | 1,067,702 | 304,762 | — | 1,372,464 | 7 | 9 | 6,359 | 1 | |||||||||||||||||
| Continuing operations | 16,289,130 | 1,941,186 | 143,777 | 18,374,093 | 100 | 190 | $ | 547,941 | 100 | % | |||||||||||||||
| Properties “held for sale” | 84,286 | — | — | 84,286 | — | 4 | |||||||||||||||||||
| Total | 16,373,416 | 1,941,186 | 143,777 | 18,458,379 | 100 | % | 194 | ||||||||||||||||||
Summary of occupancy percentages
| Operating Properties | Operating and Redevelopment Properties | |||||||||||||||||
| Market | 9/30/14 | 6/30/14 | 9/30/13 | 9/30/14 | 6/30/14 | 9/30/13 | ||||||||||||
| Greater Boston | 98.6 | % | 98.5 | % | 96.3 | % | 95.7 | % | 95.5 | % | 96.3 | % | ||||||
| San Francisco Bay Area | 99.0 | 98.4 | 96.1 | 99.0 | 98.4 | 96.1 | ||||||||||||
| New York City | 98.4 | 98.4 | 98.4 | 98.4 | 98.4 | 98.4 | ||||||||||||
| San Diego | 97.1 | 97.2 | 95.0 | 96.1 | 94.4 | 92.7 | ||||||||||||
| Seattle | 94.7 | 93.3 | 90.1 | 94.7 | 93.3 | 90.1 | ||||||||||||
| Maryland | 93.8 | 92.7 | 93.7 | 93.8 | 92.7 | 93.7 | ||||||||||||
| Research Triangle Park | 96.7 | 97.3 | 92.0 | 96.7 | 97.3 | 92.0 | ||||||||||||
| Canada | 97.6 | 97.6 | 96.8 | 97.6 | 97.6 | 96.8 | ||||||||||||
| Non-cluster markets | 93.9 | 93.9 | 91.7 | 93.9 | 93.9 | 91.7 | ||||||||||||
| North America | 97.3 | 96.9 | 95.0 | 96.3 | 95.6 | 94.5 | ||||||||||||
| Asia | 62.8 | 69.1 | 63.9 | 62.8 | 69.1 | 59.8 | ||||||||||||
| Continuing operations | 94.9 | % | 95.3 | % | 93.5 | % | 94.0 | % | 94.0 | % | 92.8 | % | ||||||
| ALEXANDRIA REAL ESTATE EQUITIES, INC ALL RIGHTS RESERVED © 2014 | 21 |
ALEXANDRIA REAL ESTATE EQUITIES, INC.
September 30, 2014
Property Listing
(Dollars in thousands)
(Unaudited)
| RSF | Number of Properties | Occupancy Percentage | ||||||||||||||||||||||||
| ABR | Operating | Operating and Redevelopment | ||||||||||||||||||||||||
Market / Submarket / Address | Operating | Development | Redevelopment | Total | ||||||||||||||||||||||
| Greater Boston | ||||||||||||||||||||||||||
| Cambridge/Inner Suburbs | ||||||||||||||||||||||||||
| Alexandria Center™ at Kendall Square | 973,464 | 388,270 | — | 1,361,734 | 6 | $ | 44,661 | 99.4 | % | 99.4 | % | |||||||||||||||
75/125 and 225 Binney Street, 161 and 215 First Street, 150 Second Street, and 300 Third Street | ||||||||||||||||||||||||||
Alexandria Technology Square® | 1,181,635 | — | — | 1,181,635 | 7 | 67,252 | 100.0 | 100.0 | ||||||||||||||||||
| 100, 200, 300, 400, 500, 600, and 700 Technology Square | ||||||||||||||||||||||||||
| 480/500 Arsenal Street | 234,260 | — | — | 234,260 | 2 | 8,281 | 100.0 | 100.0 | ||||||||||||||||||
| 780/790 Memorial Drive | 99,350 | — | — | 99,350 | 2 | 6,623 | 96.0 | 96.0 | ||||||||||||||||||
| 167 Sidney Street/99 Erie Street | 54,549 | — | — | 54,549 | 2 | 2,712 | 100.0 | 100.0 | ||||||||||||||||||
| 79/96 Thirteenth Street Charlestown Navy Yard | 25,309 | — | — | 25,309 | 1 | 620 | 100.0 | 100.0 | ||||||||||||||||||
| Longwood Medical Area | ||||||||||||||||||||||||||
| 360 Longwood Avenue (Unconsolidated JV – 27.5% ownership) | 154,100 | 259,436 | — | 413,536 | 1 | 11,483 | 100.0 | 100.0 | ||||||||||||||||||
| Route 128 | ||||||||||||||||||||||||||
| Alexandria Park at 128 | 343,882 | — | — | 343,882 | 8 | 8,225 | 87.3 | 87.3 | ||||||||||||||||||
3, 6, and 8 Preston Court; 29, 35, and 44 Hartwell Avenue; 35, 45, and 47 Wiggins Avenue; and 60 Westview Street | ||||||||||||||||||||||||||
| 19 Presidential Way | 128,325 | — | — | 128,325 | 1 | 3,398 | 100.0 | 100.0 | ||||||||||||||||||
| 100 Beaver Street | 82,330 | — | — | 82,330 | 1 | 2,303 | 100.0 | 100.0 | ||||||||||||||||||
| 285 Bear Hill Road | 26,270 | — | — | 26,270 | 1 | 801 | 100.0 | 100.0 | ||||||||||||||||||
225 Second Avenue (1) | — | — | 112,500 | 112,500 | 1 | — | N/A | — | ||||||||||||||||||
| Rte 495/Worcester | ||||||||||||||||||||||||||
| 111/130 Forbes Boulevard | 155,846 | — | — | 155,846 | 2 | 1,415 | 100.0 | 100.0 | ||||||||||||||||||
| 20 Walkup Drive | 91,045 | — | — | 91,045 | 1 | 670 | 100.0 | 100.0 | ||||||||||||||||||
| 306 Belmont Street and 350 Plantation Street | 90,690 | — | — | 90,690 | 2 | 1,315 | 100.0 | 100.0 | ||||||||||||||||||
| 30 Bearfoot Road | 60,759 | — | — | 60,759 | 1 | 2,765 | 100.0 | 100.0 | ||||||||||||||||||
| Greater Boston | 3,701,814 | 647,706 | 112,500 | 4,462,020 | 39 | $ | 162,524 | 98.6 | % | 95.7 | % | |||||||||||||||
| (1) Redevelopment property acquired in March 2014 to accommodate expansion requirement of existing tenant. | ||||||||||||||||||||||||||
| ALEXANDRIA REAL ESTATE EQUITIES, INC ALL RIGHTS RESERVED © 2014 | 22 |
ALEXANDRIA REAL ESTATE EQUITIES, INC.
September 30, 2014
Property Listing
(Dollars in thousands)
(Unaudited)
| RSF | Number of Properties | Occupancy Percentage | ||||||||||||||||||||||||
| ABR | Operating | Operating and Redevelopment | ||||||||||||||||||||||||
Market / Submarket / Address | Operating | Development | Redevelopment | Total | ||||||||||||||||||||||
| San Francisco Bay Area | ||||||||||||||||||||||||||
| Mission Bay | ||||||||||||||||||||||||||
| 409/499 Illinois Street | 391,882 | 61,941 | — | 453,823 | 2 | $ | 22,954 | 100.0 | % | 100.0 | % | |||||||||||||||
| 455 Mission Bay Boulevard South | 210,398 | — | — | 210,398 | 1 | 9,671 | 100.0 | 100.0 | ||||||||||||||||||
| 1500 Owens Street | 158,267 | — | — | 158,267 | 1 | 7,107 | 100.0 | 100.0 | ||||||||||||||||||
| 1700 Owens Street | 157,340 | — | — | 157,340 | 1 | 9,420 | 100.0 | 100.0 | ||||||||||||||||||
1455/1515 Third Street (Unconsolidated JV – 51.0% ownership) | — | 422,980 | — | 422,980 | 2 | — | N/A | N/A | ||||||||||||||||||
| South San Francisco | ||||||||||||||||||||||||||
| Alexandria Technology Center – Gateway | 448,175 | — | — | 448,175 | 6 | 16,815 | 100.0 | 100.0 | ||||||||||||||||||
| 600, 630, 650, 681, 901, and 951 Gateway Boulevard | ||||||||||||||||||||||||||
| 249/259/269 East Grand Avenue | 407,369 | — | — | 407,369 | 3 | 16,489 | 100.0 | 100.0 | ||||||||||||||||||
| 400/450 East Jamie Court | 163,035 | — | — | 163,035 | 2 | 5,890 | 100.0 | 100.0 | ||||||||||||||||||
| 500 Forbes Boulevard | 155,685 | — | — | 155,685 | 1 | 5,540 | 100.0 | 100.0 | ||||||||||||||||||
| 7000 Shoreline Court | 136,395 | — | — | 136,395 | 1 | 4,391 | 100.0 | 100.0 | ||||||||||||||||||
| 341/343 Oyster Point Boulevard | 107,960 | — | — | 107,960 | 2 | 3,313 | 100.0 | 100.0 | ||||||||||||||||||
| Palo Alto/Stanford Research Park | ||||||||||||||||||||||||||
| 849/863 Mitten Road and 866 Malcolm Road | 103,611 | — | — | 103,611 | 1 | 2,415 | 96.2 | 96.2 | ||||||||||||||||||
| 2425 Garcia Avenue and 2400/2450 Bayshore Parkway | 98,446 | — | — | 98,446 | 1 | 3,869 | 100.0 | 100.0 | ||||||||||||||||||
| 3165 Porter Drive | 91,644 | — | — | 91,644 | 1 | 3,885 | 100.0 | 100.0 | ||||||||||||||||||
| 75/125 Shoreway Road | 82,815 | — | — | 82,815 | 1 | 1,408 | 71.0 | 71.0 | ||||||||||||||||||
| 3350 West Bayshore Road | 60,000 | — | — | 60,000 | 1 | 1,919 | 100.0 | 100.0 | ||||||||||||||||||
| 2625/2627/2631 Hanover Street | 32,074 | — | — | 32,074 | 1 | 1,669 | 100.0 | 100.0 | ||||||||||||||||||
| San Francisco Bay Area | 2,805,096 | 484,921 | — | 3,290,017 | 28 | $ | 116,755 | 99.0 | % | 99.0 | % | |||||||||||||||
| New York City | ||||||||||||||||||||||||||
| Manhattan | ||||||||||||||||||||||||||
| Alexandria Center™ for Life Science | 539,584 | 188,196 | — | 727,780 | 2 | $ | 44,940 | 99.2 | % | 99.2 | % | |||||||||||||||
| 430 and 450 East 29th Street | ||||||||||||||||||||||||||
| Bergen County | ||||||||||||||||||||||||||
| 100 Phillips Parkway | 78,501 | — | — | 78,501 | 1 | 2,213 | 90.8 | 90.8 | ||||||||||||||||||
| Pennsylvania | ||||||||||||||||||||||||||
| 102 Witmer Road | 50,000 | — | — | 50,000 | 1 | 3,345 | 100.0 | 100.0 | ||||||||||||||||||
| 701 Veterans Circle | 35,155 | — | — | 35,155 | 1 | 735 | 100.0 | 100.0 | ||||||||||||||||||
| 5100 Campus Drive | 21,859 | — | — | 21,859 | 1 | 274 | 100.0 | 100.0 | ||||||||||||||||||
| New York City | 725,099 | 188,196 | — | 913,295 | 6 | $ | 51,507 | 98.4 | % | 98.4 | % | |||||||||||||||
| ALEXANDRIA REAL ESTATE EQUITIES, INC ALL RIGHTS RESERVED © 2014 | 23 |
ALEXANDRIA REAL ESTATE EQUITIES, INC.
September 30, 2014
Property Listing
(Dollars in thousands)
(Unaudited)
| RSF | Number of Properties | Occupancy Percentage | ||||||||||||||||||||||||
| ABR | Operating | Operating and Redevelopment | ||||||||||||||||||||||||
Market / Submarket / Address | Operating | Development | Redevelopment | Total | ||||||||||||||||||||||
| San Diego | ||||||||||||||||||||||||||
| Torrey Pines | ||||||||||||||||||||||||||
| ARE Nautilus | 241,191 | — | — | 241,191 | 4 | $ | 7,899 | 90.3 | % | 90.3 | % | |||||||||||||||
3530/3550 John Hopkins Court and 3535/3565 General Atomics Court | ||||||||||||||||||||||||||
| ARE Sunrise | 215,931 | — | — | 215,931 | 3 | 7,999 | 98.1 | 98.1 | ||||||||||||||||||
10931, 10933, and 10975 North Torrey Pines Road and 3010 Science Park Road | ||||||||||||||||||||||||||
| ARE Spectrum | 158,645 | 165,938 | — | 324,583 | 4 | 7,132 | 100.0 | 100.0 | ||||||||||||||||||
| 3115/3215 Merryfield Row and 3013/3033 Science Park Road | ||||||||||||||||||||||||||
| 11119 North Torrey Pines Road | 72,506 | — | — | 72,506 | 1 | 2,570 | 100.0 | 100.0 | ||||||||||||||||||
| 3545 Cray Court | 116,556 | — | — | 116,556 | 1 | 4,765 | 100.0 | 100.0 | ||||||||||||||||||
| University Town Center | ||||||||||||||||||||||||||
| 5200 Illumina Way | 497,078 | 149,663 | — | 646,741 | 6 | 21,431 | 100.0 | 100.0 | ||||||||||||||||||
| 10300 Campus Point Drive | 449,759 | — | — | 449,759 | 1 | 16,446 | 100.0 | 100.0 | ||||||||||||||||||
| ARE Esplanade | 180,208 | — | — | 180,208 | 3 | 6,737 | 93.1 | 93.1 | ||||||||||||||||||
| 4755, 4757, and 4767 Nexus Center Drive | ||||||||||||||||||||||||||
| ARE Towne Centre | 138,578 | — | — | 138,578 | 3 | 3,835 | 95.9 | 95.9 | ||||||||||||||||||
| 9363, 9373, and 9393 Towne Centre Drive | ||||||||||||||||||||||||||
| 9880 Campus Point Drive | 71,510 | — | — | 71,510 | 1 | 2,774 | 100.0 | 100.0 | ||||||||||||||||||
| Sorrento Mesa | ||||||||||||||||||||||||||
| 5810/5820/6138/6150 Nancy Ridge Drive | 143,996 | — | — | 143,996 | 2 | 2,817 | 73.6 | 73.6 | ||||||||||||||||||
| ARE Portola | 105,812 | — | — | 105,812 | 3 | 1,746 | 100.0 | 100.0 | ||||||||||||||||||
| 6175, 6225, and 6275 Nancy Ridge Drive | ||||||||||||||||||||||||||
10121/10151 Barnes Canyon Road (1) | 102,392 | — | — | 102,392 | 2 | 1,881 | 100.0 | 100.0 | ||||||||||||||||||
| 7330 Carroll Road | 66,244 | — | — | 66,244 | 1 | 2,452 | 100.0 | 100.0 | ||||||||||||||||||
| 5871 Oberlin Drive | 33,817 | — | — | 33,817 | 1 | 973 | 100.0 | 100.0 | ||||||||||||||||||
| Sorrento Valley | ||||||||||||||||||||||||||
| 11025/11035/11045/11055/11065/11075 Roselle Street | 90,378 | — | 31,277 | 121,655 | 6 | 2,253 | 100.0 | 74.3 | ||||||||||||||||||
| 3985/4025/4031/4045 Sorrento Valley Boulevard | 103,111 | — | — | 103,111 | 4 | 2,542 | 100.0 | 100.0 | ||||||||||||||||||
| I-15 Corridor | ||||||||||||||||||||||||||
| 13112 Evening Creek Drive | 109,780 | — | — | 109,780 | 1 | 2,495 | 100.0 | 100.0 | ||||||||||||||||||
| San Diego | 2,897,492 | 315,601 | 31,277 | 3,244,370 | 47 | $ | 98,747 | 97.1 | % | 96.1 | % | |||||||||||||||
| (1) We acquired these properties in 3Q13 with in-place leases. We completed the redevelopment of 53,512 RSF at 10121 Barnes Canyon Road in 3Q14. Includes 48,880 RSF at 10151 Barnes Canyon Road. This property will undergo conversion into tech office space through redevelopment in 4Q15 upon expiration of the lease that was in place since the acquisition of the property. | ||||||||||||||||||||||||||
| ALEXANDRIA REAL ESTATE EQUITIES, INC ALL RIGHTS RESERVED © 2014 | 24 |
ALEXANDRIA REAL ESTATE EQUITIES, INC.
September 30, 2014
Property Listing
(Dollars in thousands)
(Unaudited)
| RSF | Number of Properties | Occupancy Percentage | ||||||||||||||||||||||||
| ABR | Operating | Operating and Redevelopment | ||||||||||||||||||||||||
Market / Submarket / Address | Operating | Development | Redevelopment | Total | ||||||||||||||||||||||
| Seattle | ||||||||||||||||||||||||||
| Lake Union | ||||||||||||||||||||||||||
| 1201/1208 Eastlake Avenue East | 203,369 | — | — | 203,369 | 2 | $ | 8,748 | 100.0 | % | 100.0 | % | |||||||||||||||
| 1616 Eastlake Avenue East | 168,708 | — | — | 168,708 | 1 | 6,251 | 83.8 | 83.8 | ||||||||||||||||||
| 1551 Eastlake Avenue East | 117,482 | — | — | 117,482 | 1 | 3,108 | 89.4 | 89.4 | ||||||||||||||||||
| 199 East Blaine Street | 115,084 | — | — | 115,084 | 1 | 6,163 | 100.0 | 100.0 | ||||||||||||||||||
| 219 Terry Avenue North | 30,705 | — | — | 30,705 | 1 | 1,519 | 100.0 | 100.0 | ||||||||||||||||||
| 1600 Fairview Avenue East | 27,991 | — | — | 27,991 | 1 | 1,266 | 100.0 | 100.0 | ||||||||||||||||||
| Elliott Bay | ||||||||||||||||||||||||||
| 3000/3018 Western Avenue | 47,746 | — | — | 47,746 | 1 | 1,839 | 100.0 | 100.0 | ||||||||||||||||||
| 410 West Harrison/410 Elliott Avenue West | 35,175 | — | — | 35,175 | 2 | 1,047 | 100.0 | 100.0 | ||||||||||||||||||
| Seattle | 746,260 | — | — | 746,260 | 10 | $ | 29,941 | 94.7 | % | 94.7 | % | |||||||||||||||
| Maryland | ||||||||||||||||||||||||||
| Rockville | ||||||||||||||||||||||||||
| 9800 Medical Center Drive | 282,436 | — | — | 282,436 | 4 | $ | 12,596 | 100.0 | % | 100.0 | % | |||||||||||||||
| 1330 Piccard Drive | 131,511 | — | — | 131,511 | 1 | 3,125 | 100.0 | 100.0 | ||||||||||||||||||
| 1500/1550 East Gude Drive | 90,489 | — | — | 90,489 | 2 | 1,524 | 90.5 | 90.5 | ||||||||||||||||||
| 14920/15010 Broschart Road | 86,703 | — | — | 86,703 | 2 | 1,944 | 100.0 | 100.0 | ||||||||||||||||||
| 1405 Research Boulevard | 71,669 | — | — | 71,669 | 1 | 2,091 | 100.0 | 100.0 | ||||||||||||||||||
| 5 Research Place | 63,852 | — | — | 63,852 | 1 | 2,373 | 100.0 | 100.0 | ||||||||||||||||||
| 9920 Medical Center Drive | 58,733 | — | — | 58,733 | 1 | 455 | 100.0 | 100.0 | ||||||||||||||||||
| 5 Research Court | 54,906 | — | — | 54,906 | 1 | 1,598 | 100.0 | 100.0 | ||||||||||||||||||
| 12301 Parklawn Drive | 49,185 | — | — | 49,185 | 1 | 1,169 | 100.0 | 100.0 | ||||||||||||||||||
| Gaithersburg | ||||||||||||||||||||||||||
| Alexandria Technology Center – Gaithersburg I | 377,401 | — | — | 377,401 | 4 | 6,784 | 83.9 | 83.9 | ||||||||||||||||||
9 West Watkins Mill Road and 910, 930, and 940 Clopper Road | ||||||||||||||||||||||||||
| Alexandria Technology Center – Gaithersburg II | 237,137 | — | — | 237,137 | 5 | 5,308 | 95.4 | 95.4 | ||||||||||||||||||
| 708 Quince Orchard Road, 1300 Quince Orchard Boulevard, and 19, 20, and 22 Firstfield Road | ||||||||||||||||||||||||||
| 16020 Industrial Drive | 71,000 | — | — | 71,000 | 1 | 1,048 | 100.0 | 100.0 | ||||||||||||||||||
| 401 Professional Drive | 63,154 | — | — | 63,154 | 1 | 1,105 | 86.2 | 86.2 | ||||||||||||||||||
| 950 Wind River Lane | 50,000 | — | — | 50,000 | 1 | 1,082 | 100.0 | 100.0 | ||||||||||||||||||
| 620 Professional Drive | 27,950 | — | — | 27,950 | 1 | 1,190 | 100.0 | 100.0 | ||||||||||||||||||
| Beltsville | ||||||||||||||||||||||||||
| 8000/9000/10000 Virginia Manor Road | 191,884 | — | — | 191,884 | 1 | 1,919 | 77.3 | 77.3 | ||||||||||||||||||
| Northern Virginia | ||||||||||||||||||||||||||
| 14225 Newbrook Drive | 248,186 | — | — | 248,186 | 1 | 5,138 | 100.0 | 100.0 | ||||||||||||||||||
| Maryland | 2,156,196 | — | — | 2,156,196 | 29 | $ | 50,449 | 93.8 | % | 93.8 | % | |||||||||||||||
| ALEXANDRIA REAL ESTATE EQUITIES, INC ALL RIGHTS RESERVED © 2014 | 25 |
ALEXANDRIA REAL ESTATE EQUITIES, INC.
September 30, 2014
Property Listing
(Dollars in thousands)
(Unaudited)
| RSF | Number of Properties | Occupancy Percentage | ||||||||||||||||||||||||
| ABR | Operating | Operating and Redevelopment | ||||||||||||||||||||||||
Market / Submarket / Address | Operating | Development | Redevelopment | Total | ||||||||||||||||||||||
| Research Triangle Park | ||||||||||||||||||||||||||
| Research Triangle Park | ||||||||||||||||||||||||||
| Alexandria Technology Center – Alston | 186,870 | — | — | 186,870 | 3 | $ | 3,040 | 95.3 | % | 95.3 | % | |||||||||||||||
| 100, 800, and 801 Capitola Drive | ||||||||||||||||||||||||||
| 108/110/112/114 TW Alexander Drive | 158,417 | — | — | 158,417 | 1 | 4,955 | 100.0 | 100.0 | ||||||||||||||||||
| Alexandria Innovation Center – Research Triangle Park | 135,677 | — | — | 135,677 | 3 | 2,856 | 99.7 | 99.7 | ||||||||||||||||||
| 7010, 7020, and 7030 Kit Creek Road | ||||||||||||||||||||||||||
| 6 Davis Drive | 100,000 | — | — | 100,000 | 1 | 1,062 | 100.0 | 100.0 | ||||||||||||||||||
| 7 Triangle Drive | 96,626 | — | — | 96,626 | 1 | 3,157 | 100.0 | 100.0 | ||||||||||||||||||
| 407 Davis Drive | 81,956 | — | — | 81,956 | 1 | 1,644 | 100.0 | 100.0 | ||||||||||||||||||
| 2525 East NC Highway 54 | 81,580 | — | — | 81,580 | 1 | 1,686 | 100.0 | 100.0 | ||||||||||||||||||
| 601 Keystone Park Drive | 77,395 | — | — | 77,395 | 1 | 1,308 | 100.0 | 100.0 | ||||||||||||||||||
| 5 Triangle Drive | 32,120 | — | — | 32,120 | 1 | 824 | 100.0 | 100.0 | ||||||||||||||||||
| 6101 Quadrangle Drive | 30,122 | — | — | 30,122 | 1 | 530 | 100.0 | 100.0 | ||||||||||||||||||
| Palm Beach | ||||||||||||||||||||||||||
| 555 Heritage Drive | 45,023 | — | — | 45,023 | 1 | 569 | 44.4 | 44.4 | ||||||||||||||||||
| Research Triangle Park | 1,025,786 | — | — | 1,025,786 | 15 | $ | 21,631 | 96.7 | % | 96.7 | % | |||||||||||||||
Canada (1) | 1,103,507 | — | — | 1,103,507 | 5 | $ | 9,031 | 97.6 | % | 97.6 | % | |||||||||||||||
| Non-Cluster Markets | 60,178 | — | — | 60,178 | 2 | $ | 997 | 93.9 | % | 93.9 | % | |||||||||||||||
| North America | 15,221,428 | 1,636,424 | 143,777 | 17,001,629 | 181 | $ | 541,582 | 97.3 | % | 96.3 | % | |||||||||||||||
| Asia | 1,067,702 | 304,762 | — | 1,372,464 | 9 | $ | 6,359 | 62.8 | % | 62.8 | % | |||||||||||||||
| Continuing Operations | 16,289,130 | 1,941,186 | 143,777 | 18,374,093 | 190 | $ | 547,941 | 94.9 | % | 94.0 | % | |||||||||||||||
| Properties “held for sale” | 84,286 | — | — | 84,286 | 4 | |||||||||||||||||||||
| Total | 16,373,416 | 1,941,186 | 143,777 | 18,458,379 | 194 | |||||||||||||||||||||
| (1) Includes land and improvements subject to a ground lease with a client tenant aggregating 780,540 RSF. This RSF has been excluded for occupancy purposes. | ||||||||||||||||||||||||||
| ALEXANDRIA REAL ESTATE EQUITIES, INC ALL RIGHTS RESERVED © 2014 | 26 |
ALEXANDRIA REAL ESTATE EQUITIES, INC.
September 30, 2014
Investments in Real Estate
(Dollars in thousands, except per square foot amounts)
(Unaudited)
| Investment in Real Estate | ||||||||||||||||||||||||||||
| Consolidated | Pro Rata Share of Unconsolidated JV | Total | Square Feet | |||||||||||||||||||||||||
| Unconsolidated JV | Per SF (1) | |||||||||||||||||||||||||||
| Page | Amount | % | Consolidated | Total | ||||||||||||||||||||||||
| Rental properties | 21, 32 | $ | 6,849,966 | $ | 43,535 | $ | 6,893,501 | 83 | % | 16,219,316 | 154,100 | 16,373,416 | $ | 427 | ||||||||||||||
| Construction in progress (“CIP”)/current value-creation projects: | ||||||||||||||||||||||||||||
| Current development in North America | 31, 32 | 532,053 | 110,264 | 642,317 | 954,008 | 682,416 | 1,636,424 | 514 | ||||||||||||||||||||
| Current redevelopment in North America | 34 | 32,661 | — | 32,661 | 143,777 | — | 143,777 | 227 | ||||||||||||||||||||
| Current development in Asia | 45 | 35,602 | — | 35,602 | 304,762 | — | 304,762 | 117 | ||||||||||||||||||||
| 600,316 | 110,264 | 710,580 | 9 | % | 1,402,547 | 682,416 | 2,084,963 | 436 | ||||||||||||||||||||
| Rental properties and current value-creation projects | 7,450,282 | 153,799 | 7,604,081 | 17,621,863 | 836,516 | 18,458,379 | 428 | |||||||||||||||||||||
| Near-term value-creation projects in North America (CIP): | ||||||||||||||||||||||||||||
| 50, 60, and 100 Binney Street | 35 | 313,379 | — | 313,379 | 4 | % | 1,062,180 | — | 1,062,180 | 295 | ||||||||||||||||||
| Other projects | 35 | 90,843 | — | 90,843 | 1 | % | 864,151 | — | 864,151 | 105 | ||||||||||||||||||
| 404,222 | — | 404,222 | 1,926,331 | — | 1,926,331 | 210 | ||||||||||||||||||||||
| Future value-creation projects: | ||||||||||||||||||||||||||||
| North America | 35 | 221,572 | — | 221,572 | 2 | % | 4,563,401 | (2) | — | 4,563,401 | (2) | 49 | ||||||||||||||||
| Asia | 45 | 78,319 | — | 78,319 | 1 | % | 6,419,707 | — | 6,419,707 | 12 | ||||||||||||||||||
| 299,891 | — | 299,891 | 10,983,108 | — | 10,983,108 | 27 | ||||||||||||||||||||||
| Land under sales contract | 44 | 12,236 | — | 12,236 | — | % | 250,000 | — | 250,000 | 49 | ||||||||||||||||||
| Near-term and future value-creation projects | 716,349 | — | 716,349 | 13,159,439 | — | 13,159,439 | 54 | |||||||||||||||||||||
| Current, near-term and future value-creation projects | 1,316,665 | 110,264 | 1,426,929 | 17 | % | 14,561,986 | 682,416 | 15,244,402 | 107 | |||||||||||||||||||
| Gross investments in real estate | 8,166,631 | 153,799 | $ | 8,320,430 | 100 | % | 30,781,302 | 836,516 | 31,617,818 | $ | 273 | |||||||||||||||||
| Less: accumulated depreciation | (1,083,169 | ) | (22 | ) | ||||||||||||||||||||||||
Equity method of accounting – unconsolidated JV (3) | 41 | 114,168 | N/A | |||||||||||||||||||||||||
| Investments in real estate | $ | 7,197,630 | $ | 153,777 | ||||||||||||||||||||||||
| (1) | Represents the total cost of our rental properties and value-creation projects, including outside partners’ share in the case of JVs, divided by the total rentable or developable square feet of the respective real estate. |
| (2) | Includes 1,185,000 RSF attributable to embedded land, which generally represents adjacent land acquired in connection with the acquisition of operating properties. As a result, the real estate basis attributable to these land parcels is classified in rental properties. |
| (3) | Represents our equity method of accounting for investment in unconsolidated JVs and includes costs incurred directly by us outside of the JV. See page 32 for further detail of the unconsolidated JV development projects. |
| ALEXANDRIA REAL ESTATE EQUITIES, INC ALL RIGHTS RESERVED © 2014 | 27 |
ALEXANDRIA REAL ESTATE EQUITIES, INC.
September 30, 2014
Investments in Real Estate (continued)
(Unaudited)
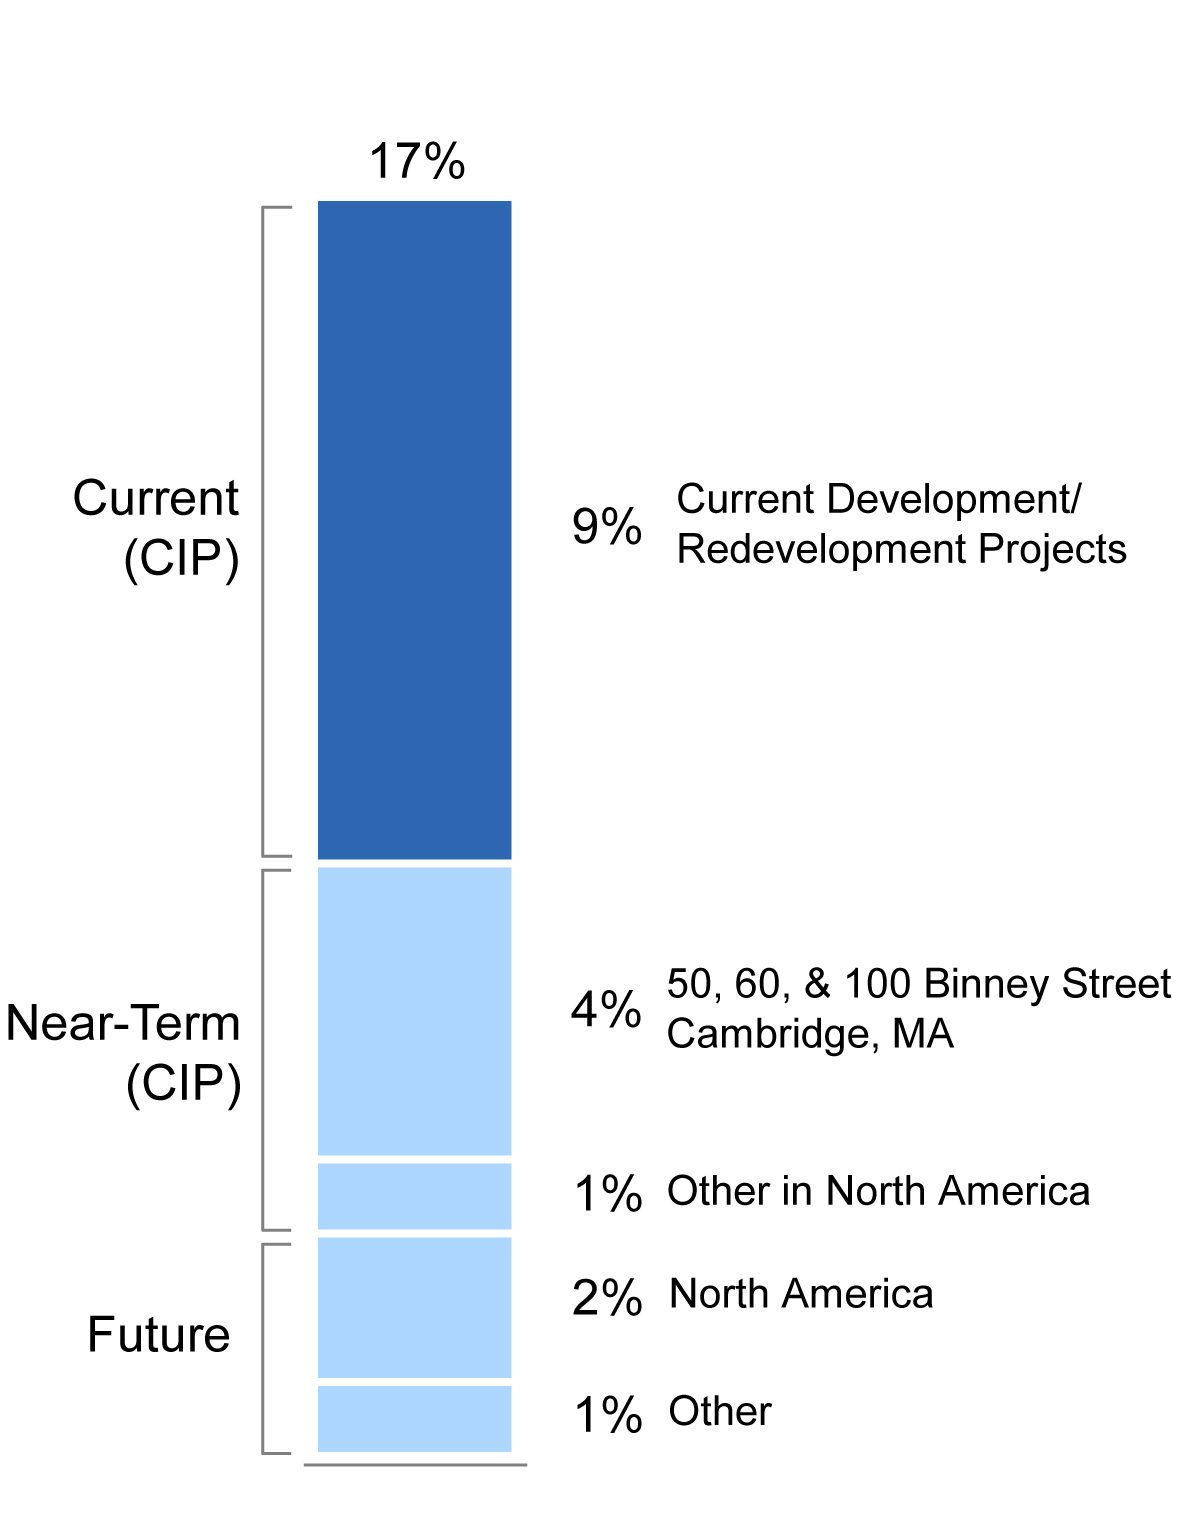 | 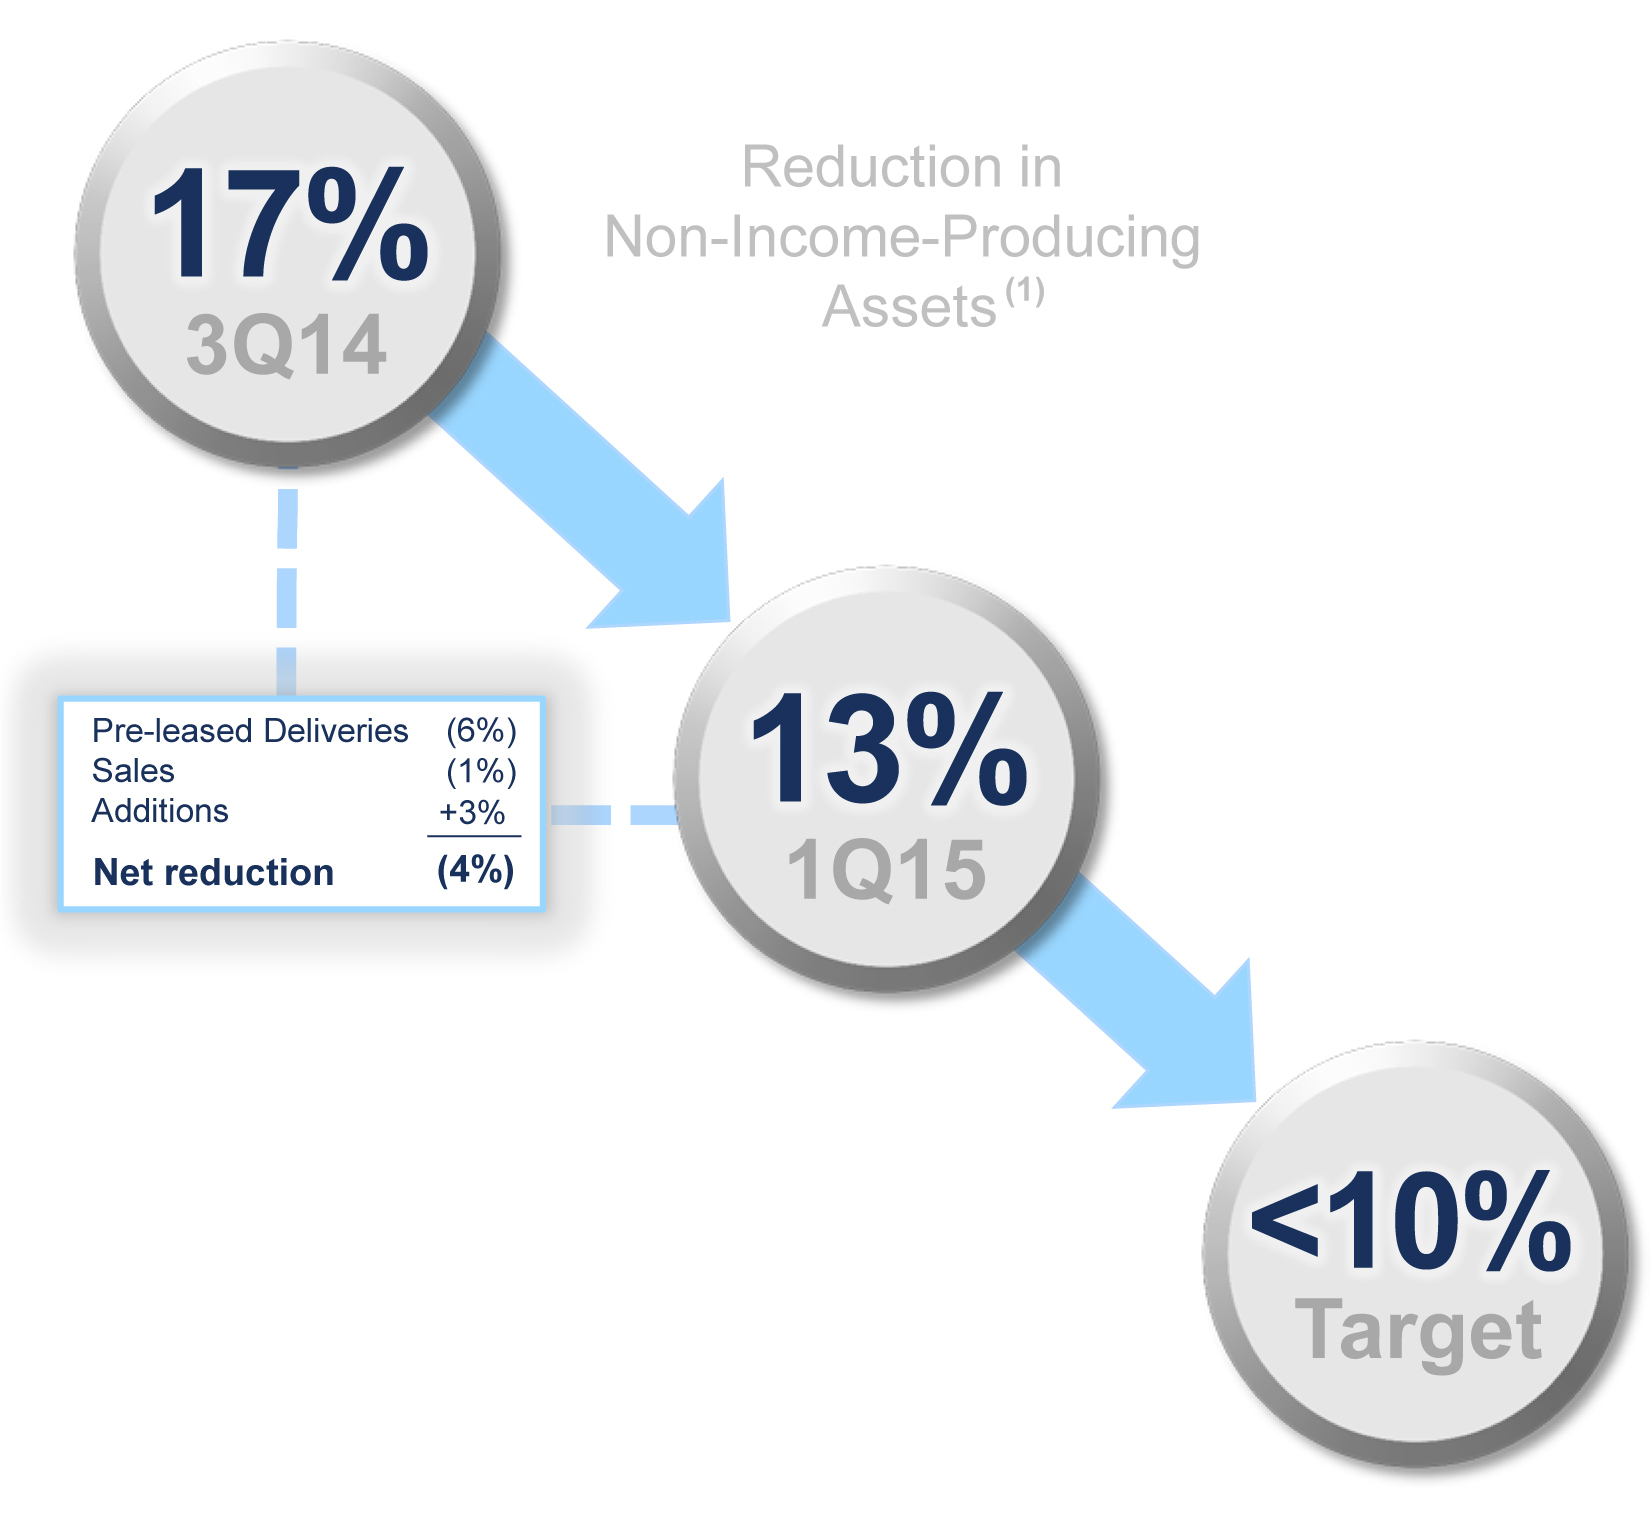 |
| (1) | Represents non-income-producing assets as a percentage of gross investments in real estate. See pre-leasing of current projects on pages 31, 32, and 34. |
| ALEXANDRIA REAL ESTATE EQUITIES, INC ALL RIGHTS RESERVED © 2014 | 28 |
ALEXANDRIA REAL ESTATE EQUITIES, INC.
September 30, 2014
Overview of Value-Creation Pipeline
Square Feet | Leased/Negotiating % | Year of NOI Contribution – Forecast | ||||||||||||||||||||||||
| Market | Submarket | Address | 2014 | 2015 | 2016 | 2017 and Beyond | ||||||||||||||||||||
| Current value-creation development and redevelopment projects | ||||||||||||||||||||||||||
| Greater Boston | Longwood Medical Area | 360 Longwood Avenue | 413,536 | 49% |  | |||||||||||||||||||||
| San Francisco Bay Area | Mission Bay | 499 Illinois Street | 219,574 | 100% | | |||||||||||||||||||||
| New York City | Manhattan | 430 East 29th Street | 418,638 | 83% | | |||||||||||||||||||||
| San Diego | Sorrento Valley | 11055/11065/11075 Roselle Street | 55,213 | 75% |  | |||||||||||||||||||||
| Greater Boston | Cambridge | 75/125 Binney Street | 388,270 | 99% |  | |||||||||||||||||||||
| San Diego | Torrey Pines | 3013/3033 Science Park Road | 165,938 | 63% | | |||||||||||||||||||||
| Greater Boston | Route 128 | 225 Second Avenue | 112,500 | 100% |  | |||||||||||||||||||||
| San Diego | University Town Center | 5200 Illumina Way – Building 6 | 149,663 | 100% |  | |||||||||||||||||||||
| San Francisco Bay Area | Mission Bay | 1455/1515 Third Street | 422,980 | 100% |  | |||||||||||||||||||||
| Total/weighted average | 2,346,312 | 85% | ||||||||||||||||||||||||
Near-term value-creation development projects (1) | Square Feet | Negotiating % | ||||||||||||||||||||||||
| San Diego | University Town Center | 5200 Illumina Way | 140,000 | 100% | (2) | | ||||||||||||||||||||
| San Diego | University Town Center | 10300 Campus Point Drive | 140,000 | 76% | (2) | | ||||||||||||||||||||
| Greater Boston | Cambridge | 50 Binney Street | 276,371 | 100% | (2) | | ||||||||||||||||||||
| Greater Boston | Cambridge | 60 Binney Street | 264,150 | 100% | (2) | | ||||||||||||||||||||
| San Diego | University Town Center | 5200 Illumina Way | 178,151 | —% | | |||||||||||||||||||||
| Seattle | Lake Union | 1165 Eastlake Avenue East | 106,000 | 100% | (2) | | ||||||||||||||||||||
| Greater Boston | Cambridge | 100 Binney Street | 416,788 | 100% | (2) |  | ||||||||||||||||||||
| San Francisco Bay Area | SoMa | 510 Townsend Street | 300,000 | 100% | (2) | | ||||||||||||||||||||
(1) See page 18 for RSF targeted for redevelopment. (2) Under negotiation or subject to letter of intent. |  | Value-Creation Development Projects | ||||||||||||||||||||||||
 | Value-Creation Redevelopment Projects | |||||||||||||||||||||||||
| ALEXANDRIA REAL ESTATE EQUITIES, INC ALL RIGHTS RESERVED © 2014 | 29 |
ALEXANDRIA REAL ESTATE EQUITIES, INC.
September 30, 2014
Deliveries of Value-Creation Development and Redevelopment Projects in North America
(Dollars in thousands)
(Unaudited)
| Property | 499 Illinois Street | 269 East Grand Avenue | 360 Longwood Avenue | 10121 Barnes Canyon Road |
| Project Type | Development | Development | Unconsolidated JV Development | Redevelopment |
| Photograph/ Rendering |  |  |  |  |
| Delivery Summary | Alexandria delivered an additional 85,417 RSF in September 2014, in addition to the 72,216 RSF delivered to Illumina, Inc. in 2Q14. The remaining 61,941 RSF under development is expected to be delivered in 4Q14. | Alexandria delivered the entire 107,250 RSF of this project in September 2014 to Amgen Inc. | Alexandria delivered 154,100 RSF, or 37%, of this project at the end of September 2014 to Dana-Farber Cancer Institute, Inc. | Alexandria delivered the entire 53,512 RSF of this project in September 2014 to Outerwall Inc. |
| Client Tenants | Illumina, Inc. / Medivation, Inc. / The Regents of the University of California | Amgen Inc. | Dana-Farber Cancer Institute, Inc. | Outerwall Inc. |
| RSF | % of Project Delivered | Occupancy at September 30, 2014 | Total Project Investment | Unlevered | ||||||||||||||||||||||||||||||
Average Cash Yield | Initial Stabilized Yield (Cash Basis) | Initial Stabilized Yield | ||||||||||||||||||||||||||||||||
| 3Q14 Delivery | Delivered Prior to 3Q14 | Total Delivered | ||||||||||||||||||||||||||||||||
| Address/Market – Submarket | Date | RSF | ||||||||||||||||||||||||||||||||
| Development projects in North America | ||||||||||||||||||||||||||||||||||
| 499 Illinois Street/San Francisco Bay Area – Mission Bay | September 2014 | 85,417 | 72,216 | 157,633 | 72% | 72% | $ | 202,900 | (1) | 7.3 | % | (2) | 6.4 | % | (2) | 7.2 | % | (2) | ||||||||||||||||
269 East Grand Avenue/ San Francisco Bay Area – So. San Francisco | September 2014 | 107,250 | — | 107,250 | 100% | 100% | $ | 49,600 | 9.7 | % | (3) | 8.4 | % | (3) | 9.7 | % | (3) | |||||||||||||||||
| Unconsolidated joint venture development projects in North America | ||||||||||||||||||||||||||||||||||
360 Longwood Avenue/ Greater Boston – Longwood Medical Area | End of September 2014 | 154,100 | — | 154,100 | 37% | 37% | $ | 350,000 | (1) | 9.3 | % | (2) | 8.3 | % | (2) | 8.9 | % | (2) | ||||||||||||||||
| Redevelopment projects in North America | ||||||||||||||||||||||||||||||||||
| 10121 Barnes Canyon Road/San Diego – Sorrento Mesa | September 2014 | 53,512 | — | 53,512 | 100% | 100% | $ | 18,000 | 8.9 | % | (4) | 7.8 | % | (4) | 7.9 | % | (4) | |||||||||||||||||
(1) Represents 100% of investment at completion for the entire project. Only a portion of the project was placed into operations during 3Q14. See pages 31 and 32 for portion of development still in progress.
(2) Consistent with previously disclosed yields.
(3) Increased from estimated yields at commencement of project of 9.3% for average cash yield, 8.1% for initial stabilized yield (cash basis), and 9.3% for initial stabilized yield.
(4) Increased from estimated yields at commencement of project of 8.8% for average cash yield, 7.7% for initial stabilized yield (cash basis), and 7.7% for initial stabilized yield.
| ALEXANDRIA REAL ESTATE EQUITIES, INC ALL RIGHTS RESERVED © 2014 | 30 |
ALEXANDRIA REAL ESTATE EQUITIES, INC.
September 30, 2014
Current Value-Creation Development Projects in North America – Consolidated
(Dollars in thousands)
(Unaudited)
| Leased Status | Project Start Date | Initial Occupancy Date | Stabilized Occupancy Date | ||||||||||||||||||||||||||||||
| Project RSF | Leased | Negotiating | Total Leased/Negotiating | ||||||||||||||||||||||||||||||
| Property/Market – Submarket | In Service | CIP | Total | RSF | % | RSF | % | RSF | % | ||||||||||||||||||||||||
| Consolidated development projects in North America | |||||||||||||||||||||||||||||||||
75/125 Binney Street/ Greater Boston – Cambridge | — | 388,270 | 388,270 | 386,111 | 99 | % | — | — | % | 386,111 | 99 | % | 1Q13 | 1Q15 | 2015 | ||||||||||||||||||
499 Illinois Street/ San Francisco Bay Area – Mission Bay | 157,633 | 61,941 | 219,574 | 219,574 | 100 | % | — | — | % | 219,574 | 100 | % | 2Q11 | 2Q14 | 2014 | ||||||||||||||||||
| 430 East 29th Street/ New York City – Manhattan | 230,442 | 188,196 | 418,638 | 256,212 | 61 | % | 91,055 | 22 | % | 347,267 | 83 | % | 4Q12 | 4Q13 | 2015 | ||||||||||||||||||
3013/3033 Science Park Road/ San Diego – Torrey Pines | — | 165,938 | 165,938 | 105,047 | 63 | % | — | — | % | 105,047 | 63 | % | 2Q14 | 1Q15 | 2016 | ||||||||||||||||||
5200 Illumina Way – Building 6/ San Diego – University Town Center | — | 149,663 | 149,663 | 149,663 | 100 | % | — | — | % | 149,663 | 100 | % | 3Q14 | 2Q16 | 2016 | ||||||||||||||||||
| Consolidated development projects in North America | 388,075 | 954,008 | 1,342,083 | 1,116,607 | 83 | % | 91,055 | 7 | % | 1,207,662 | 90 | % | |||||||||||||||||||||
| Investment | ||||||||||||||||||||||||||||||||||
| Cost to Complete | Unlevered | |||||||||||||||||||||||||||||||||
| September 30, 2014 | 2014 | Thereafter | Average Cash Yield | Initial Stabilized Yield (Cash Basis) | Initial Stabilized Yield | |||||||||||||||||||||||||||||
| Property/Market – Submarket | Construction Financing | Internal Funding | Construction Financing | Internal Funding | Total at Completion | |||||||||||||||||||||||||||||
| In Service | CIP | |||||||||||||||||||||||||||||||||
| Consolidated development projects in North America | ||||||||||||||||||||||||||||||||||
75/125 Binney Street/ Greater Boston – Cambridge | $ | — | $ | 250,116 | $ | 18,240 | $ | — | $ | 83,083 | $ | — | $ | 351,439 | (1) | 9.1% | 8.0% | 8.2% | ||||||||||||||||
499 Illinois Street/ San Francisco Bay Area – Mission Bay | $ | 136,815 | $ | 49,430 | $ | — | $ | 16,655 | $ | — | $ | — | $ | 202,900 | 7.3% | 6.4% | 7.2% | |||||||||||||||||
| 430 East 29th Street/ New York City – Manhattan | $ | 219,498 | $ | 185,532 | $ | — | $ | 11,539 | $ | — | $ | 46,676 | $ | 463,245 | 7.1% | 6.6% | 6.5% | |||||||||||||||||
3013/3033 Science Park Road/ San Diego – Torrey Pines | $ | — | $ | 43,764 | $ | — | $ | 6,033 | $ | — | $ | 54,994 | $ | 104,791 | 7.7% | 7.2% | 7.1% | |||||||||||||||||
5200 Illumina Way – Building 6/ San Diego – University Town Center | $ | — | $ | 3,211 | $ | — | $ | 3,533 | $ | — | $ | 28,556 | $ | 35,300 | 8.6% | 7.0% | 8.5% | |||||||||||||||||
| Consolidated development projects in North America | $ | 356,313 | $ | 532,053 | $ | 18,240 | $ | 37,760 | $ | 83,083 | $ | 130,226 | $ | 1,157,675 | ||||||||||||||||||||
| (1) | In 3Q13, we completed the preliminary design and budget for interior improvements for use by ARIAD Pharmaceuticals, Inc. (“ARIAD”). Based upon our lease with ARIAD, we expect an increase in both estimated NOI and estimated cost at completion, with no significant change in our estimated yields. In light of certain changes in ARIAD’s business, ARIAD is reassessing its plans to occupy the entire facility. As a result, plans and drawings for the interior improvements for the project have not been approved by ARIAD in accordance with the timelines specified in the lease. We expect ARIAD to finalize the design and budget for all or a portion of the interior improvements in the future and will provide an update on our estimated cost at completion and targeted yields. Pursuant to the terms of the lease, we expect rent to commence in late March 2015. |
| ALEXANDRIA REAL ESTATE EQUITIES, INC ALL RIGHTS RESERVED © 2014 | 31 |
ALEXANDRIA REAL ESTATE EQUITIES, INC.
September 30, 2014
Current Value-Creation Development Projects in North America – Unconsolidated Joint Ventures
(Dollars in thousands)
(Unaudited)
| Leased Status | Project Start Date | Initial Occupancy Date | Stabilized Occupancy Date | ||||||||||||||||||||||||||||||
| Project RSF | Leased | Negotiating | Total Leased/Negotiating | ||||||||||||||||||||||||||||||
| Property/Market – Submarket | In Service | CIP | Total | RSF | % | RSF | % | RSF | % | ||||||||||||||||||||||||
| Unconsolidated JV development projects | |||||||||||||||||||||||||||||||||
360 Longwood Avenue/ Greater Boston – Longwood Medical Area | 154,100 | 259,436 | 413,536 | 154,100 | 37 | % | 49,471 | 12 | % | 203,571 | 49 | % | 2Q12 | 3Q14 | 2016 | ||||||||||||||||||
1455/1515 Third Street/ San Francisco Bay Area – Mission Bay | — | 422,980 | 422,980 | 422,980 | 100 | % | — | — | % | 422,980 | 100 | % | 3Q14 | 3Q16-1Q17 | 2016/2017 | ||||||||||||||||||
| Total | 154,100 | 682,416 | 836,516 | 577,080 | 69 | % | 49,471 | 6 | % | 626,551 | 75 | % | |||||||||||||||||||||
| Investment | ||||||||||||||||||||||||||||||||||
| Cost to Complete | Unlevered (1) | |||||||||||||||||||||||||||||||||
| September 30, 2014 | 2014 | Thereafter | Average Cash Yield | Initial Stabilized Yield (Cash Basis) | Initial Stabilized Yield | |||||||||||||||||||||||||||||
| Property/Market – Submarket | Construction Financing | Internal Funding | Construction Financing | Internal Funding | Total at Completion | |||||||||||||||||||||||||||||
| In Service | CIP | |||||||||||||||||||||||||||||||||
Unconsolidated JV development projects (2) | ||||||||||||||||||||||||||||||||||
100% of JV: 360 Longwood Avenue/ Greater Boston – Longwood Medical Area | $ | 105,599 | $ | 179,804 | $ | 21,180 | $ | — | $ | 43,417 | $ | — | $ | 350,000 | ||||||||||||||||||||
100% of JV: 1455/1515 Third Street/ San Francisco Bay Area – Mission Bay (3) | $ | 21,150 | $ | 105,608 | $ | — | $ | 6,458 | $ | — | TBD | TBD | ||||||||||||||||||||||
ARE share of unconsolidated JV development projects (2) | ||||||||||||||||||||||||||||||||||
27.5% of JV: 360 Longwood Avenue/ Greater Boston – Longwood Medical Area | $ | 32,748 | $ | 55,759 | $ | 5,825 | $ | 374 | $ | 11,939 | $ | 2,320 | $ | 108,965 | 9.3% | 8.3% | 8.9% | |||||||||||||||||
51.0% of JV: 1455/1515 Third Street/ San Francisco Bay Area – Mission Bay | $ | 10,787 | $ | 54,505 | $ | — | $ | 4,126 | $ | — | TBD | TBD | TBD | TBD | TBD | |||||||||||||||||||
| Total ARE share of unconsolidated JV development projects | $ | 43,535 | $ | 110,264 | $ | 5,825 | $ | 4,500 | $ | 11,939 | TBD | TBD | ||||||||||||||||||||||
| (1) | Our projected unlevered initial stabilized cash yield is based upon our share of the $109.0 million investment in real estate by the JV, including costs incurred directly by us outside of the JV. Development management fees earned from this development have been excluded from our estimate of unlevered yields. |
| (2) | See page 41 for additional information regarding our unconsolidated JVs. |
| (3) | In 3Q14, we completed the acquisition of 1455/1515 Third Street and commenced development. The design and budget of this project are in process, and the estimated project cost with related yields will be disclosed in the near future. |
| ALEXANDRIA REAL ESTATE EQUITIES, INC ALL RIGHTS RESERVED © 2014 | 32 |
ALEXANDRIA REAL ESTATE EQUITIES, INC.
September 30, 2014
Current Value-Creation Development Projects in North America
| Property | 75/125 Binney Street | 499 Illinois Street | 430 East 29th Street | 3013/3033 Science Park Road | |
Submarket/ Market | Cambridge/ Greater Boston | Mission Bay/ San Francisco Bay Area | Manhattan/ New York City | Torrey Pines/ San Diego | |
| RSF (in progress) | 388,270 | 61,941 | 188,196 | 165,938 | |
| Project Type | Development | Development | Development | Development | |
| Client Tenants | ARIAD Pharmaceuticals, Inc. | Illumina, Inc./Medivation, Inc./The Regents of the University of California | Roche/New York University/Others | Receptos, Inc./ The Medicines Company | |
| Photograph/ Rendering |  | |  |  | |
| Property | 5200 Illumina Way – Building 6 | 360 Longwood Avenue | 1455/1515 Third Street | ||
Submarket/ Market | University Town Center/ San Diego | Longwood Medical Area/ Greater Boston | Mission Bay/ San Francisco Bay Area | ||
| RSF (in progress) | 149,663 | 259,436 | 422,980 | ||
| Project Type | Development | Unconsolidated JV Development | Unconsolidated JV Development | ||
| Client Tenants | Illumina, Inc. | Dana-Farber Cancer Institute, Inc. | Uber Technologies, Inc. (1) | ||
| Photograph/ Rendering |  | |  |  | |
| (1) | We are currently working closely with Uber in the process to revise the core and exterior architecture of the building design. |
| ALEXANDRIA REAL ESTATE EQUITIES, INC ALL RIGHTS RESERVED © 2014 | 33 |
ALEXANDRIA REAL ESTATE EQUITIES, INC.
September 30, 2014
Current Value-Creation Redevelopment Projects in North America
(Dollars in thousands)
(Unaudited)
| Leased Status | Project Start Date | Initial Occupancy Date | Stabilized Occupancy Date | ||||||||||||||||||||||||||||||
| Project RSF | Leased | Negotiating | Total Leased/Negotiating | ||||||||||||||||||||||||||||||
| Property/Market – Submarket | In Service | CIP | Total | RSF | % | RSF | % | RSF | % | ||||||||||||||||||||||||
| Consolidated redevelopment projects in North America | |||||||||||||||||||||||||||||||||
225 Second Avenue/ Greater Boston – Route 128 (1) | — | 112,500 | 112,500 | 112,500 | 100 | % | — | — | % | 112,500 | 100 | % | 1Q14 | 2Q15 | 2015 | ||||||||||||||||||
11055/11065/11075 Roselle Street/ San Diego – Sorrento Valley (1) | 23,936 | 31,277 | 55,213 | 41,163 | (2) | 75 | % | — | — | % | 41,163 | 75 | % | 4Q13 | 2Q14 | 2015 | |||||||||||||||||
| Consolidated redevelopment projects in North America | 23,936 | 143,777 | 167,713 | 153,663 | 92 | % | — | — | % | 153,663 | 92 | % | |||||||||||||||||||||
| Investment | Unlevered | |||||||||||||||||||||||||
| Property/Market – Submarket | September 30, 2014 | Cost to Complete | Total at Completion | Average Cash Yield | Initial Stabilized Yield (Cash Basis) | Initial Stabilized Yield | ||||||||||||||||||||
| In Service | CIP | 2014 | Thereafter | |||||||||||||||||||||||
| Consolidated redevelopment projects in North America | ||||||||||||||||||||||||||
225 Second Avenue/ Greater Boston – Route 128 | $ | — | $ | 26,244 | $ | 6,577 | $ | 13,850 | $ | 46,671 | 9.0% | 8.3% | 8.3% | |||||||||||||
11055/11065/11075 Roselle Street/ San Diego – Sorrento Valley | $ | 7,232 | $ | 6,417 | $ | 1,423 | $ | 3,278 | $ | 18,350 | 8.0% | 7.8% | 7.9% | |||||||||||||
| Consolidated redevelopment projects in North America | $ | 7,232 | $ | 32,661 | $ | 8,000 | $ | 17,128 | $ | 65,021 | ||||||||||||||||
| (1) | Acquired 225 Second Avenue and 11055/11065/11075 Roselle Street in March 2014 and November 2013, respectively, to accommodate expansion requirements of existing tenants. |
| (2) | In 2Q14, we delivered 23,936 RSF to a life science company. We expect to deliver the remaining pre-leased 17,227 RSF in 2Q15. |
| ALEXANDRIA REAL ESTATE EQUITIES, INC ALL RIGHTS RESERVED © 2014 | 34 |
ALEXANDRIA REAL ESTATE EQUITIES, INC.
September 30, 2014
Near-Term and Future Value-Creation Development Projects in North America
(Dollars in thousands, except per square foot amounts)
(Unaudited)
Embedded Land (1) | Total | ||||||||||||||||||||||||
| Property – Market | Book Value | Square Feet | Cost Per Square Foot | Square Feet | Book Value | Square Feet | Cost Per Square Foot | ||||||||||||||||||
Near-Term Value-Creation Development Projects – Land undergoing predevelopment activities (CIP) | |||||||||||||||||||||||||
| Alexandria Center™ at Kendall Square (“ACKS”) – Greater Boston: | |||||||||||||||||||||||||
50, 60, and 100 Binney Street (2) | $ | 313,379 | 1,062,180 | $ | 295 | — | $ | 313,379 | 1,062,180 | $ | 295 | ||||||||||||||
| 510 Townsend Street – San Francisco Bay Area | 55,537 | 300,000 | 185 | — | 55,537 | 300,000 | 185 | ||||||||||||||||||
5200 Illumina Way – San Diego (3) | 12,955 | 318,151 | 41 | — | 12,955 | 318,151 | 41 | ||||||||||||||||||
10300 Campus Point Drive – San Diego (3) | 4,958 | 140,000 | 35 | — | 4,958 | 140,000 | 35 | ||||||||||||||||||
1165 Eastlake Avenue East – Seattle (4) | 17,393 | 106,000 | 164 | — | 17,393 | 106,000 | 164 | ||||||||||||||||||
| Near-term value-creation development projects | $ | 404,222 | 1,926,331 | $ | 210 | — | 404,222 | 1,926,331 | 210 | ||||||||||||||||
Future Value-Creation Development Projects – Land held for development | |||||||||||||||||||||||||
Alexandria Technology Square® – Greater Boston | $ | 7,721 | 100,000 | $ | 77 | — | 7,721 | 100,000 | 77 | ||||||||||||||||
| ACKS – 50 Rogers Street Residential – Greater Boston | 4,118 | 150,000 | 27 | — | 4,118 | 150,000 | 27 | ||||||||||||||||||
| Grand Avenue – San Francisco Bay Area | 45,056 | 397,132 | 113 | — | 45,056 | 397,132 | 113 | ||||||||||||||||||
| Rozzi/Eccles – San Francisco Bay Area | 73,035 | 514,307 | 142 | — | 73,035 | 514,307 | 142 | ||||||||||||||||||
| East 29th Street – New York City | — | — | — | 420,000 | (5) | — | 420,000 | — | |||||||||||||||||
| Executive Drive/Other – San Diego | 4,443 | 49,920 | 89 | 279,000 | 4,443 | 328,920 | 14 | ||||||||||||||||||
| 400/416/430 Dexter Avenue North – Seattle | 16,088 | 253,000 | 64 | — | 16,088 | 253,000 | 64 | ||||||||||||||||||
| 1150/1166 Eastlake Avenue East – Seattle | 15,250 | 160,266 | 95 | — | 15,250 | 160,266 | 95 | ||||||||||||||||||
| 9800/9950 Medical Center Drive – Maryland | 8,397 | 321,721 | 26 | — | 8,397 | 321,721 | 26 | ||||||||||||||||||
| Research Boulevard – Maryland | 7,637 | 347,000 | 22 | — | 7,637 | 347,000 | 22 | ||||||||||||||||||
| Firstfield Road – Maryland | 4,056 | 95,000 | 43 | — | 4,056 | 95,000 | 43 | ||||||||||||||||||
| Other | 35,771 | 990,055 | 36 | 486,000 | 35,771 | 1,476,055 | 24 | ||||||||||||||||||
| Future value-creation development projects | $ | 221,572 | 3,378,401 | $ | 66 | 1,185,000 | 221,572 | 4,563,401 | 49 | ||||||||||||||||
| Total near-term and future value-creation development projects | 1,185,000 | $ | 625,794 | 6,489,732 | $ | 96 | |||||||||||||||||||
| (1) | Embedded land generally represents adjacent land acquired in connection with the acquisition of operating properties. As a result, the real estate basis attributable to these land parcels is classified in rental properties. |
| (2) | Includes a residential building totaling approximately 105,000 gross square feet and infrastructure related costs consisting of: utility access and roads, installation of storm drain systems, infiltration systems, traffic lighting/signals, streets, and sidewalks related to 50, 60, and 100 Binney Street. |
| (3) | See information on pre-leasing and letter of intent negotiations on pages 38 and 39. |
| (4) | The cost per square foot for 1165 Eastlake Avenue East includes an existing structure that can substantially be incorporated into the development plans. |
| (5) | We hold a right to ground lease a parcel supporting the future ground-up development of approximately 420,000 RSF at the Alexandria Center™ for Life Science pursuant to an option under our ground lease. We have begun discussions regarding this option and the future ground-up development project. |
| ALEXANDRIA REAL ESTATE EQUITIES, INC ALL RIGHTS RESERVED © 2014 | 35 |
ALEXANDRIA REAL ESTATE EQUITIES, INC.
September 30, 2014
Near-Term Value-Creation Development Projects
Greater Boston
| Operating/Development Project | Near-Term Value-Creation Project | |||||
| Property | Alexandria Center™ at Kendall Square |
| Submarket/Market | Cambridge/Greater Boston |
| Aerial | 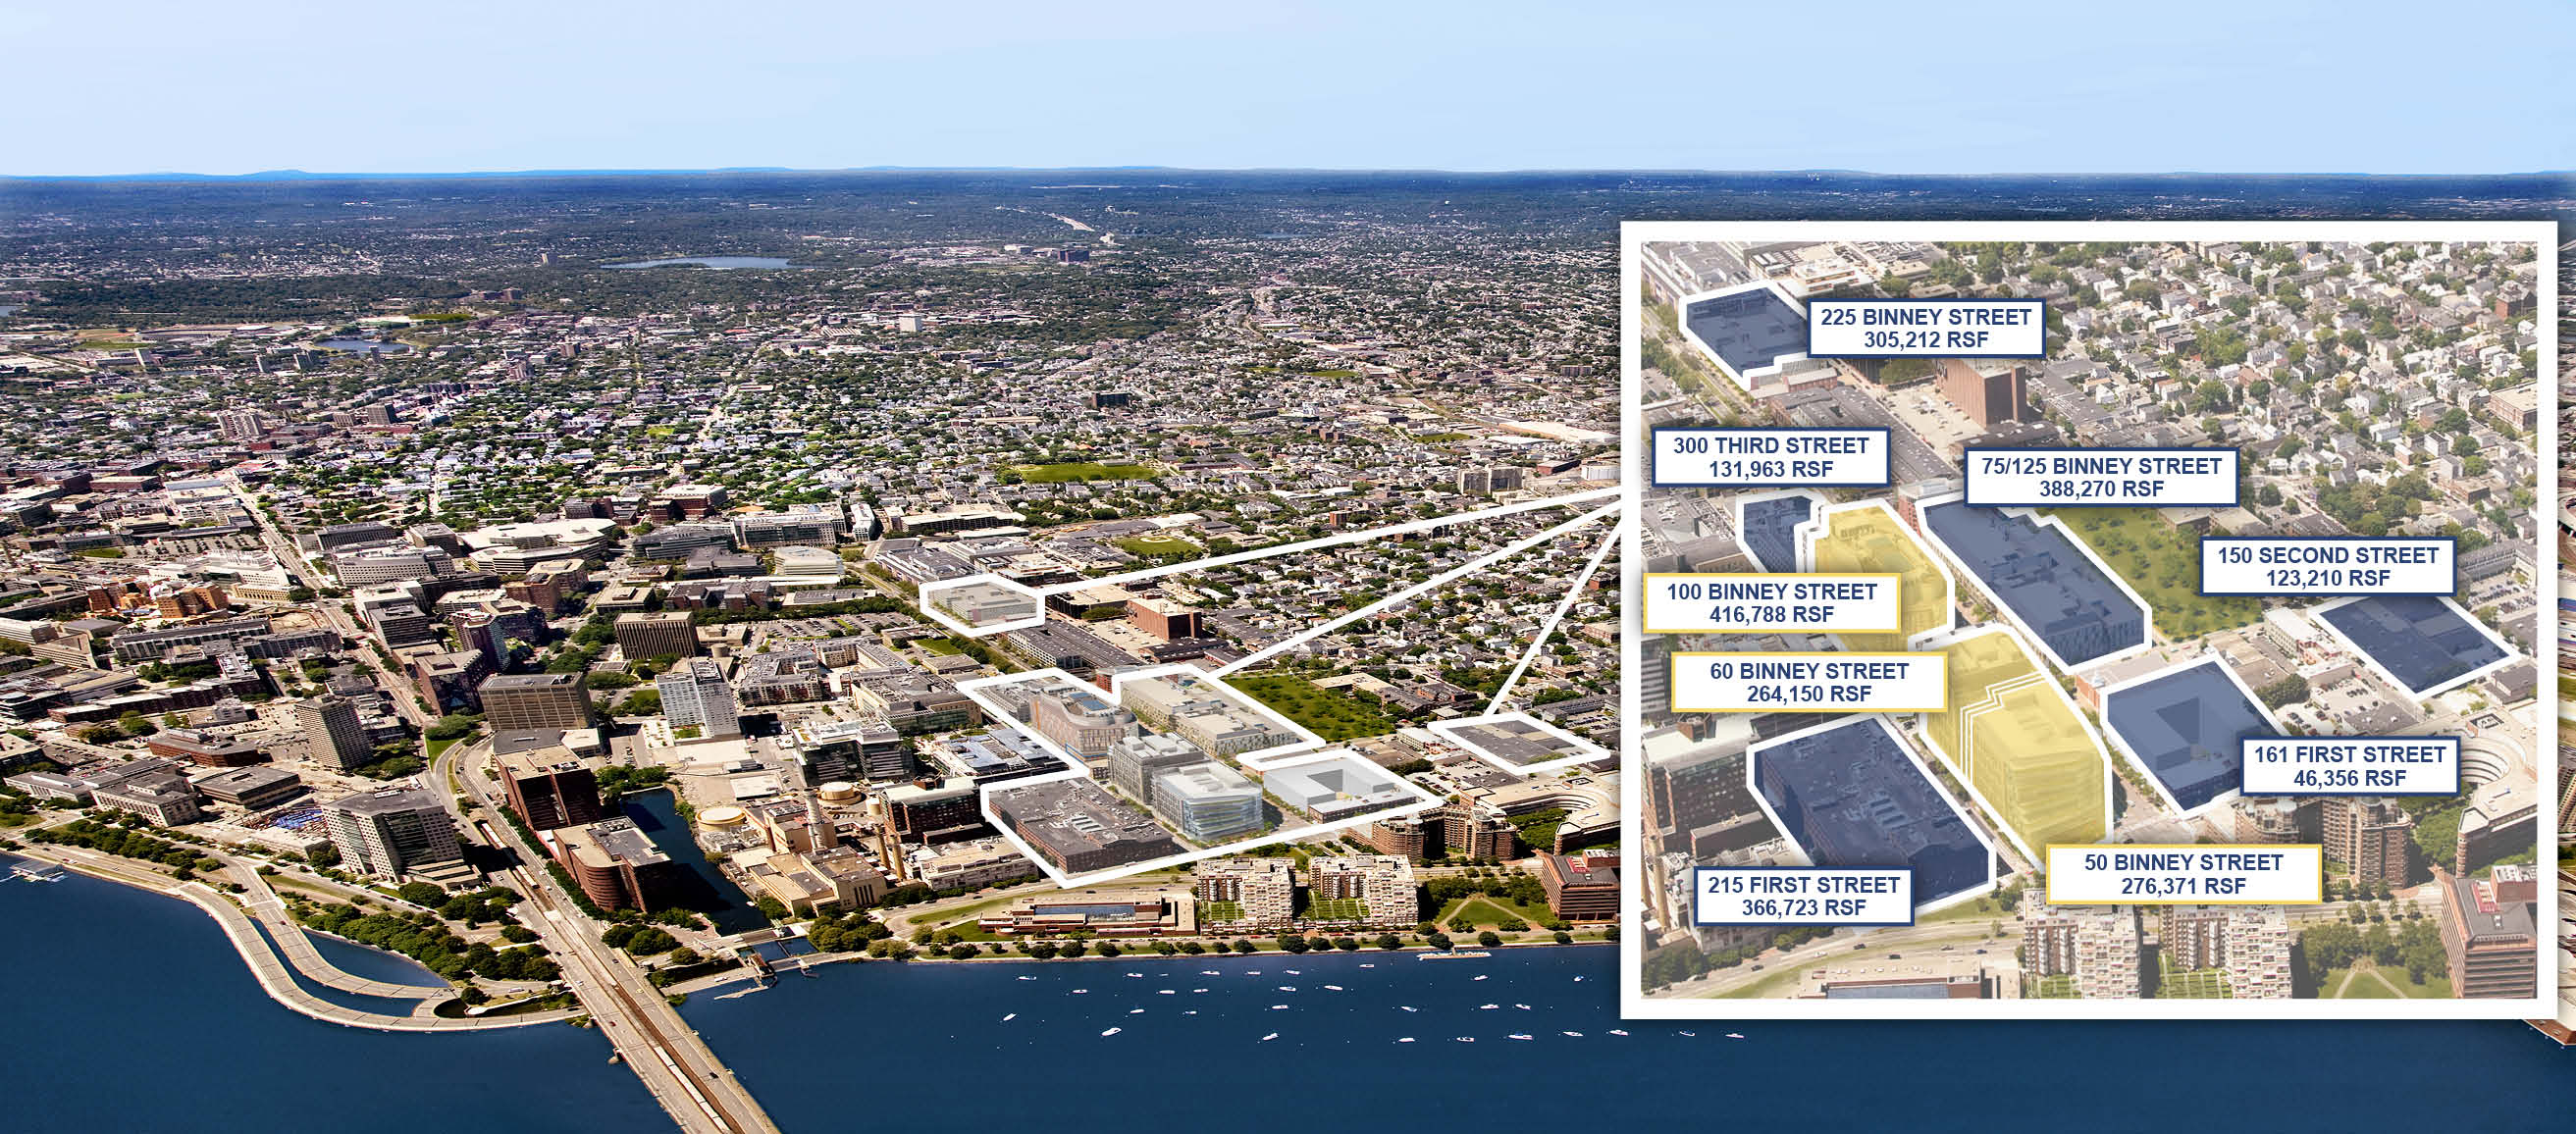 |
| Background | Alexandria received final approval from the City of Cambridge to develop the Alexandria Center™ at Kendall Square, a fully integrated campus featuring four world-class laboratory/office and tech office buildings, high-quality amenities, and green space. Alexandria’s entitlement efforts resulted in an increase of 1.2 million developable square feet over the original entitlements in place at acquisition. |
| Near-Term Opportunity | Our near-term development opportunity consists of 50, 60, and 100 Binney Street aggregating approximately 1.1 million RSF. We have commenced below grade site work for 50 and 60 Binney Street related to the foundation and subterranean parking garage in order to reduce the time to deliver these buildings for occupancy. Subject to market conditions, we expect to commence vertical above-ground construction of 50 and 60 Binney Street in early 2015 and 100 Binney Street in mid-2015. 50, 60, and 100 Binney Street are subject to negotiations or letter of intent, each with a separate full building life science entity. The timing of revenue recognition for 50 and 60 Binney may begin in late 2016 or in 2017, subject to final lease negotiation. In order to maintain maximum strategic optionality and due to extraordinary strong build to suit leasing demand for the Binney Street land parcels and the likely corresponding reduction in lease-up risk, we have updated our strategy noted in 4Q13 to sell a minority interest in the Binney Street land parcels. Our updated guidance assumes we lease 50, 60, and 100 Binney Street in the near term and retain 100% of each project. See page 47 for key capital planning considerations for 2015. |
| ALEXANDRIA REAL ESTATE EQUITIES, INC ALL RIGHTS RESERVED © 2014 | 36 |
ALEXANDRIA REAL ESTATE EQUITIES, INC.
September 30, 2014
Near-Term Value-Creation Development Projects
San Francisco Bay Area
| Operating/Development Project | Near-Term Value-Creation Project | |||||
| Property | 510 Townsend Street |
| Submarket/Market | SoMa/San Francisco Bay Area |
| Aerial | 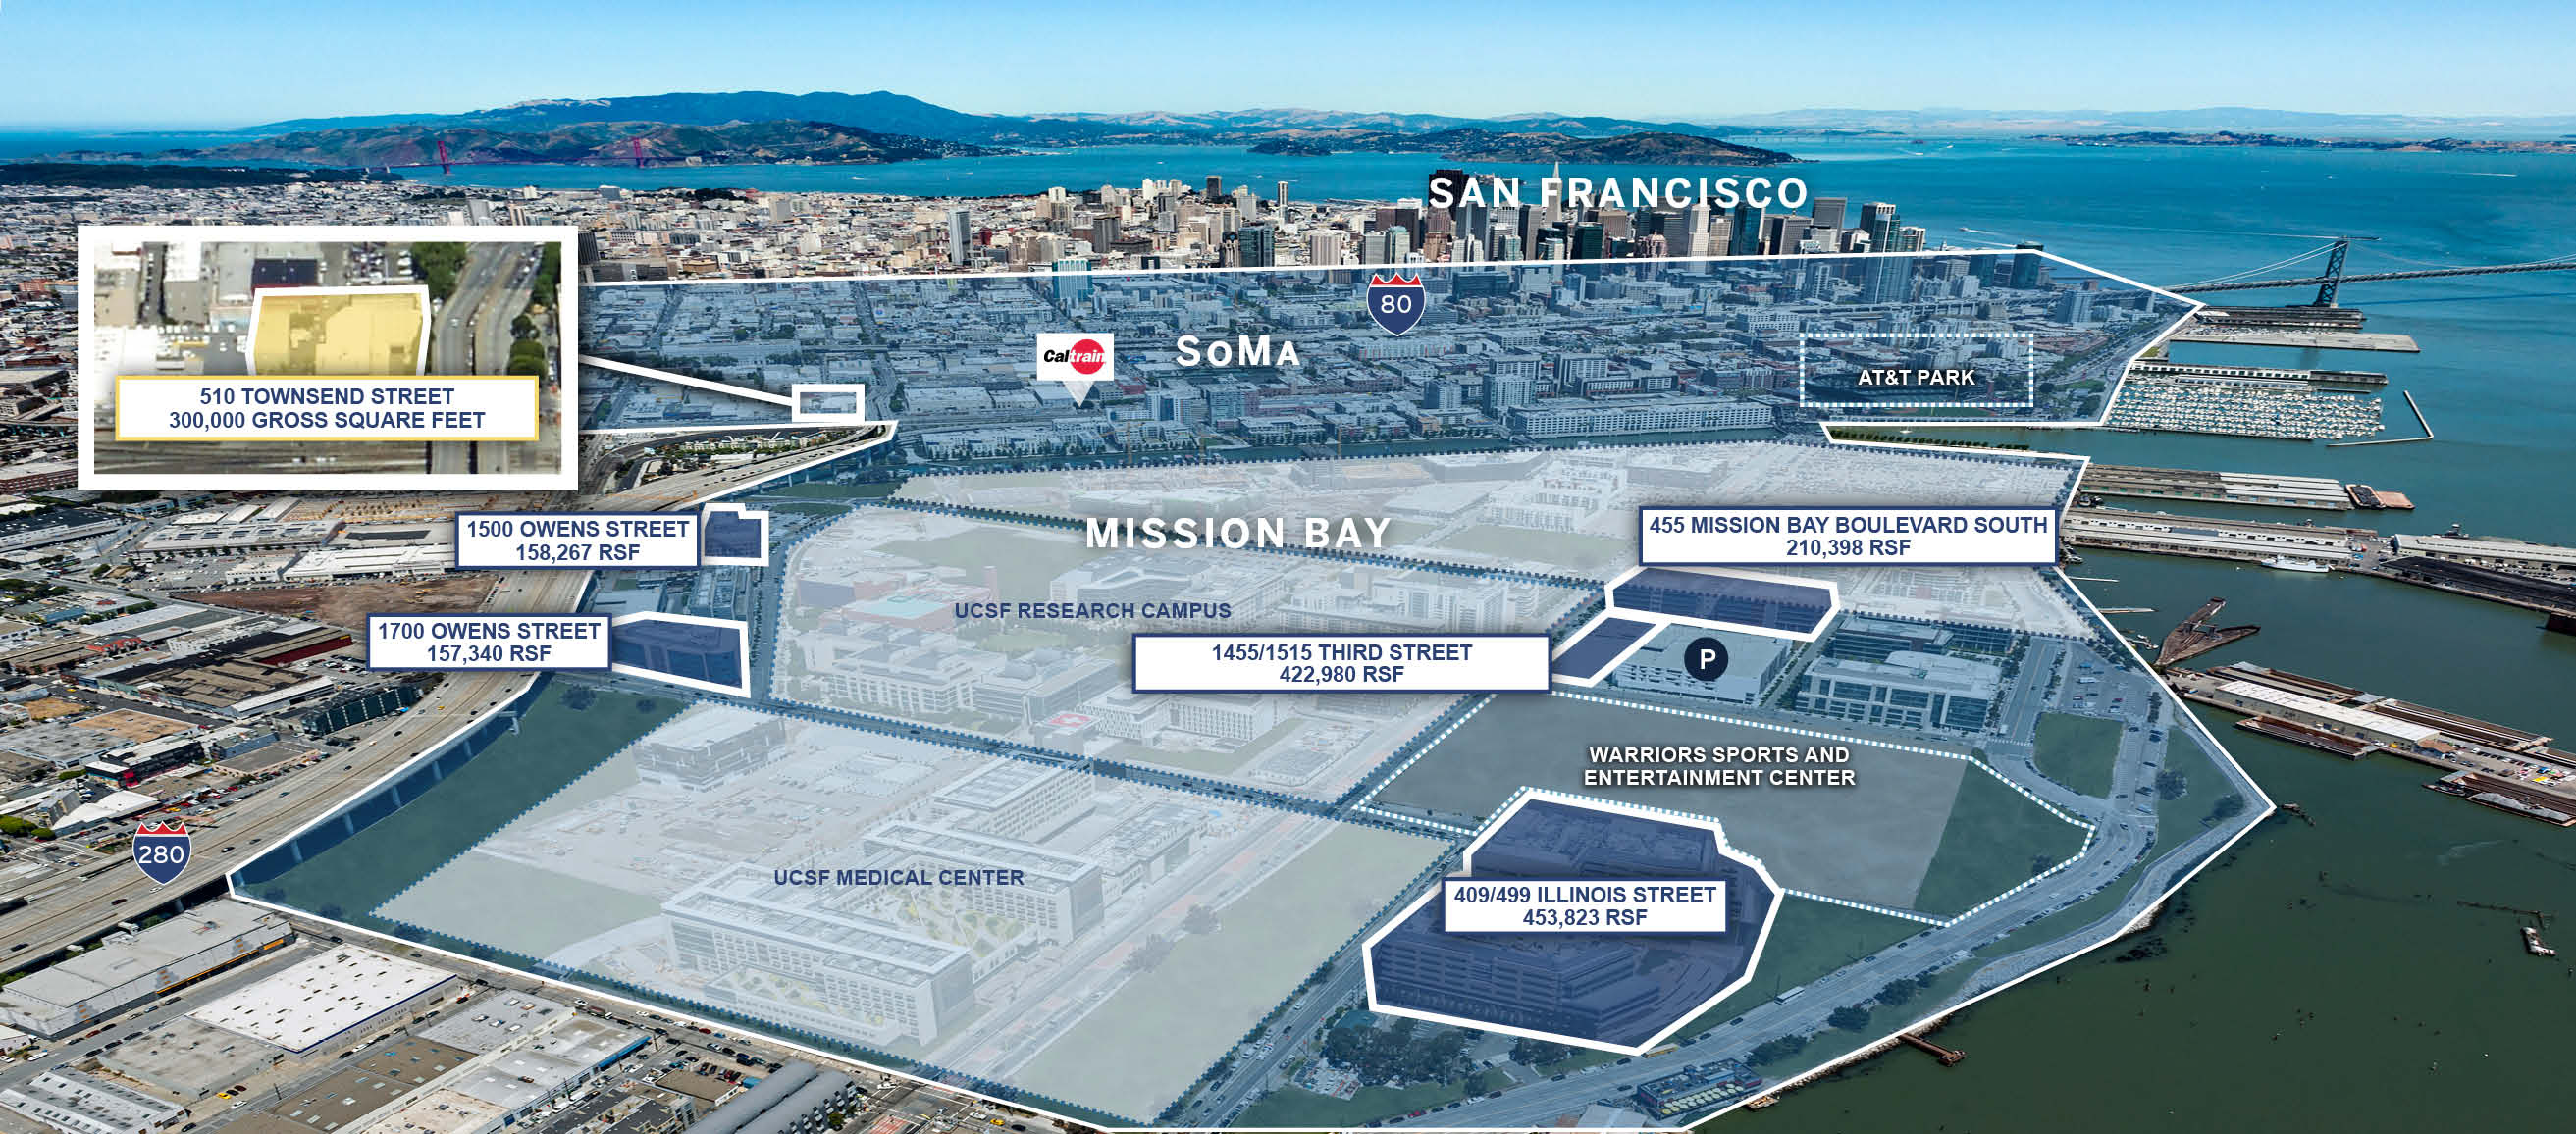 |
| Background | Alexandria’s 510 Townsend Street project was acquired in April 2014 and represents an expansion of our successful Mission Bay science and technology campus into the SoMa submarket. The site is ideally located at the corner of Townsend and 6th Streets, placing it within close proximity to public transportation. The site is also adjacent to one of Interstate 280’s key arrival points into San Francisco and is only blocks away from Interstate 80 and the US 101 Freeway. Furthermore, with its highly strategic location at the intersection of Alexandria’s Mission Bay science and technology campus and the SoMa technology district, the 510 Townsend Street site, and this key cluster expansion, mirrors the convergence of life science, technology, and healthcare occurring with the digital health revolution. |
| Current Development | In September 2014, Alexandria and Uber formed a JV and acquired key land parcels at 1455/1515 Third Street in our Mission Bay submarket of San Francisco, for the ground-up development of two Class A buildings aggregating 422,980 RSF. Alexandria holds a 51% interest in the JV. Additionally, Alexandria executed a 15-year lease with Uber for 100% of the project. The purchase price of the land parcels, including 423 parking structure spaces, foundation piles, plans and permits, was $125.0 million, with 49% funded by Uber. The land parcels are fully entitled, including Proposition M office allocation approvals. The timing of revenue recognition for this lease may begin from 3Q16 to 1Q17, subject to completion of the design and budget of the buildings. |
| Near-Term Opportunity | Ground-up development of a laboratory/office or technology office building at 510 Townsend Street aggregating approximately 300,000 gross square feet for either single or multi-tenancy to strategically capture strong demand from high-quality science and digital health companies in our world-class urban campus in the heart of San Francisco. We are in the process of perfecting entitlements, negotiating with full building users, and subject to market conditions, we plan to commence construction as soon as possible in 2015. We expect to disclose the estimated investment and yields upon commencement of ground-up development. |
| ALEXANDRIA REAL ESTATE EQUITIES, INC ALL RIGHTS RESERVED © 2014 | 37 |
ALEXANDRIA REAL ESTATE EQUITIES, INC.
September 30, 2014
Near-Term Value-Creation Development Projects
San Diego
| Operating/Development Project | Near-Term Value-Creation Project | |||||
| Property | 5200 Illumina Way |
| Submarket/Market | University Town Center/San Diego |
| Aerial | 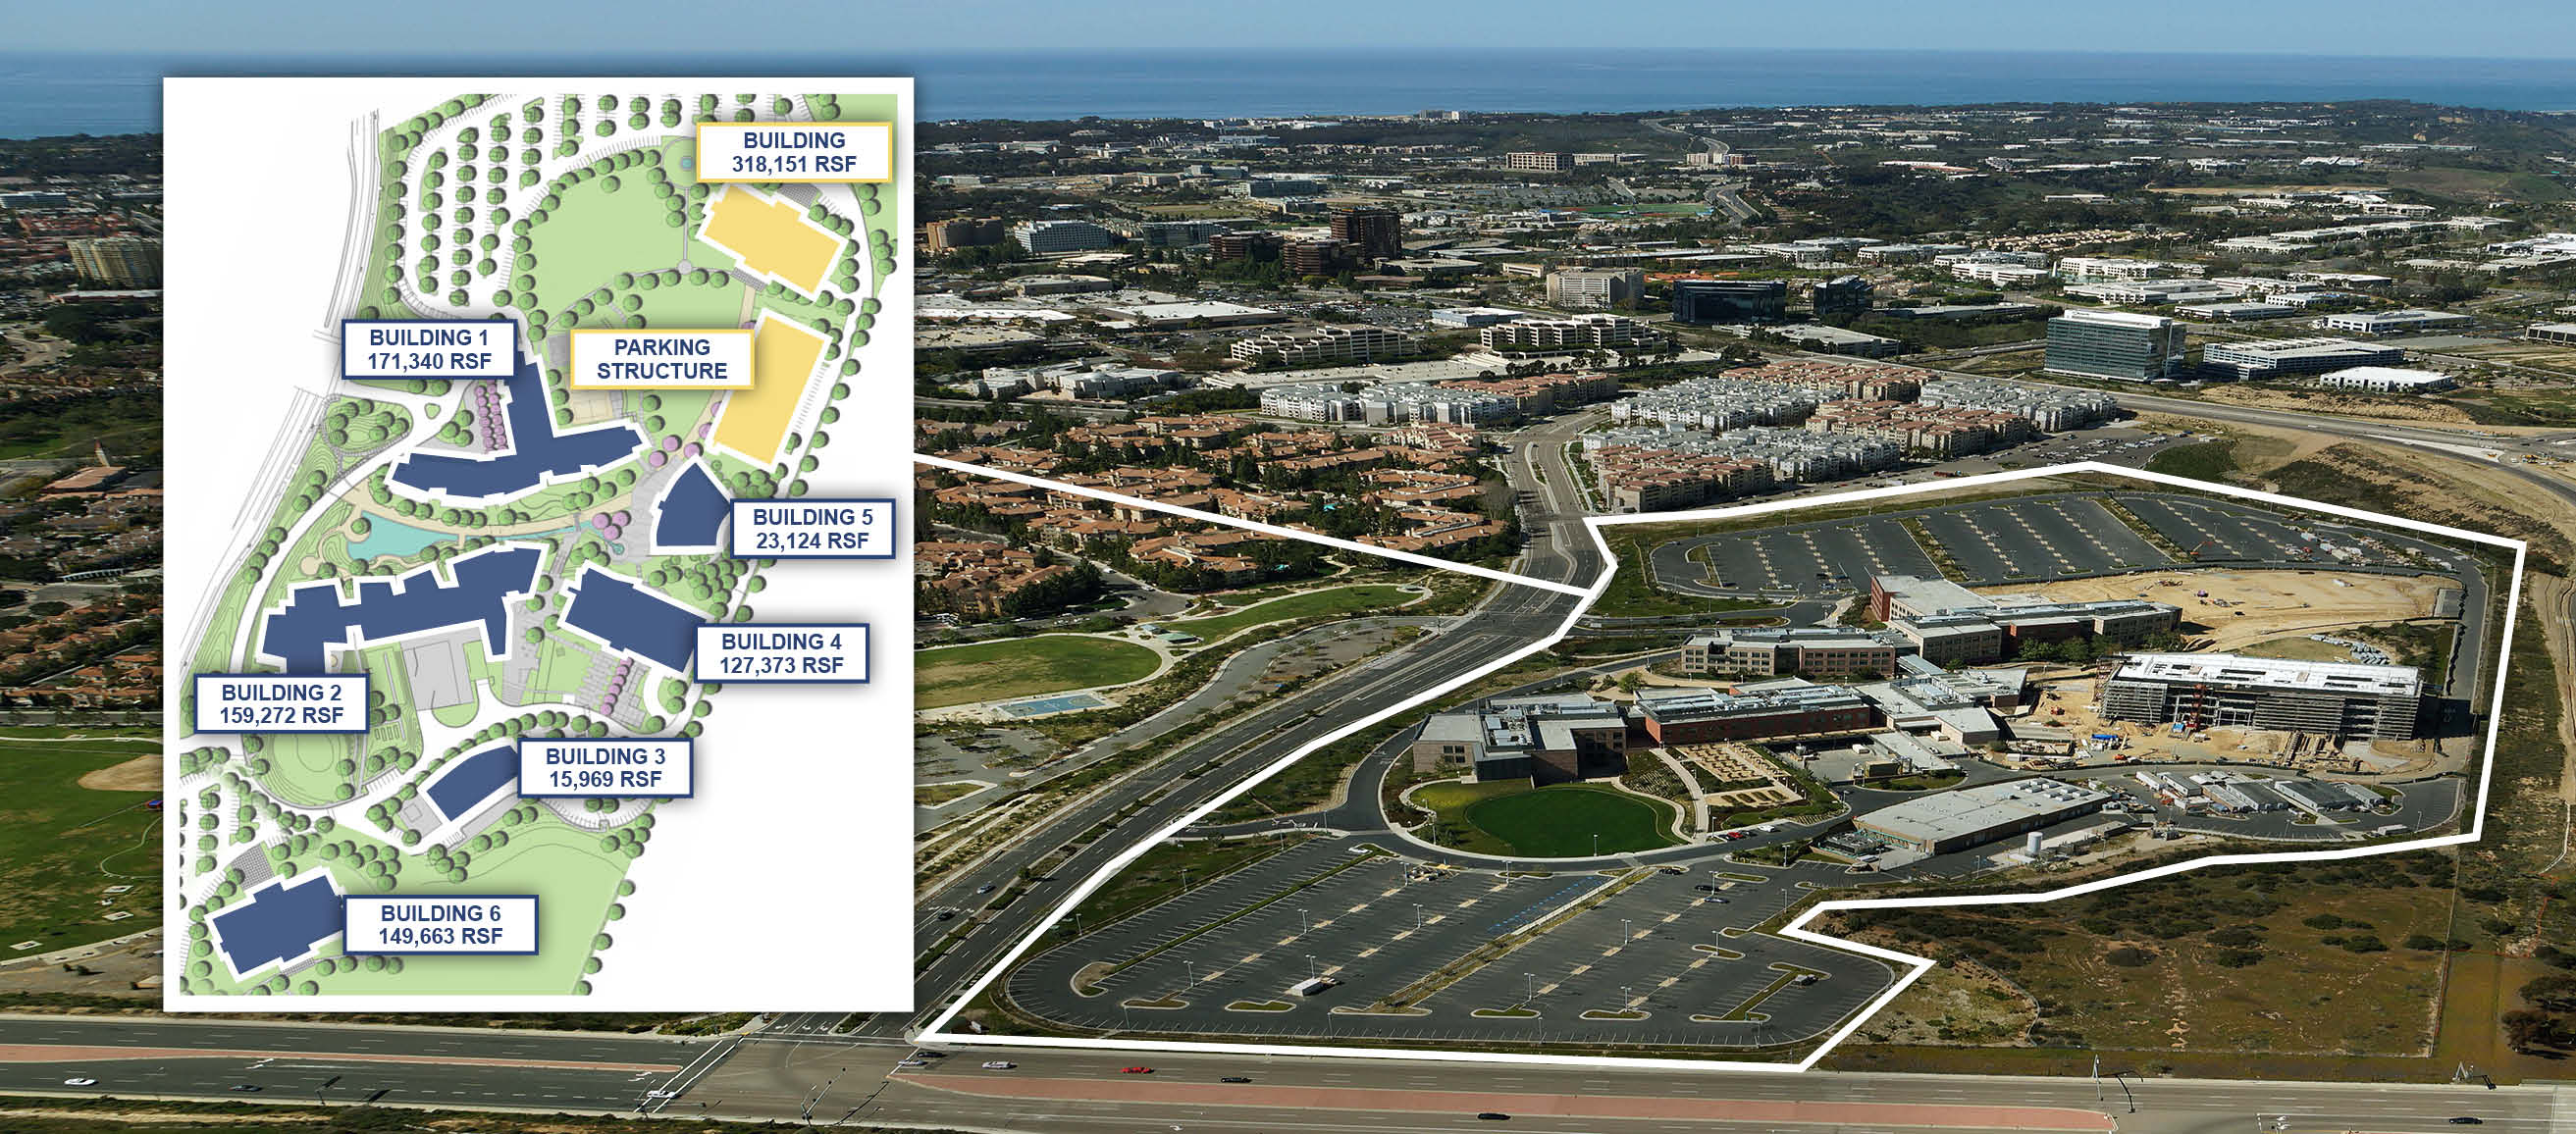 |
| Background | Alexandria owns and operates the headquarters campus of Illumina, Inc., the leading developer, manufacturer, and marketer of life science tools and integrated systems for large-scale analysis of genetic variation and function with a market capitalization of $24.9 billion as of June 30, 2014. We previously delivered two build-to-suit projects, building 4 and building 5, to Illumina, Inc. in 4Q12 and 1Q13, respectively. |
| Current Development | In 3Q14 we commenced development of 5200 Illumina Way – Building 6, a 149,663 RSF project that is 100% pre-leased to Illumina, Inc. |
| Near-Term Opportunity | Ground-up development of additional laboratory/office buildings aggregating 318,151 RSF, of which we are currently in negotiations with an existing tenant for further expansion of approximately 140,000 RSF. The timing of revenue recognition for the initial delivery of this additional 140,000 RSF is expected to be 2Q16, subject to final letter of intent and lease negotiations as well as the completion of the design and budget for the project. Subject to market conditions, we expect to commence development of at least one additional building over the next one to three years as we expect expansion requirements from Illumina, Inc. We expect to disclose the estimated investment and yields upon commencement of ground-up development. We are currently seeking approval to increase the site density. |
| ALEXANDRIA REAL ESTATE EQUITIES, INC ALL RIGHTS RESERVED © 2014 | 38 |
ALEXANDRIA REAL ESTATE EQUITIES, INC.
September 30, 2014
Near-Term Value-Creation Development Projects
San Diego
| Operating | Near-Term Value-Creation Project | |||||
| Property | 10300 Campus Point Drive |
| Submarket/Market | University Town Center/San Diego |
| Aerial | 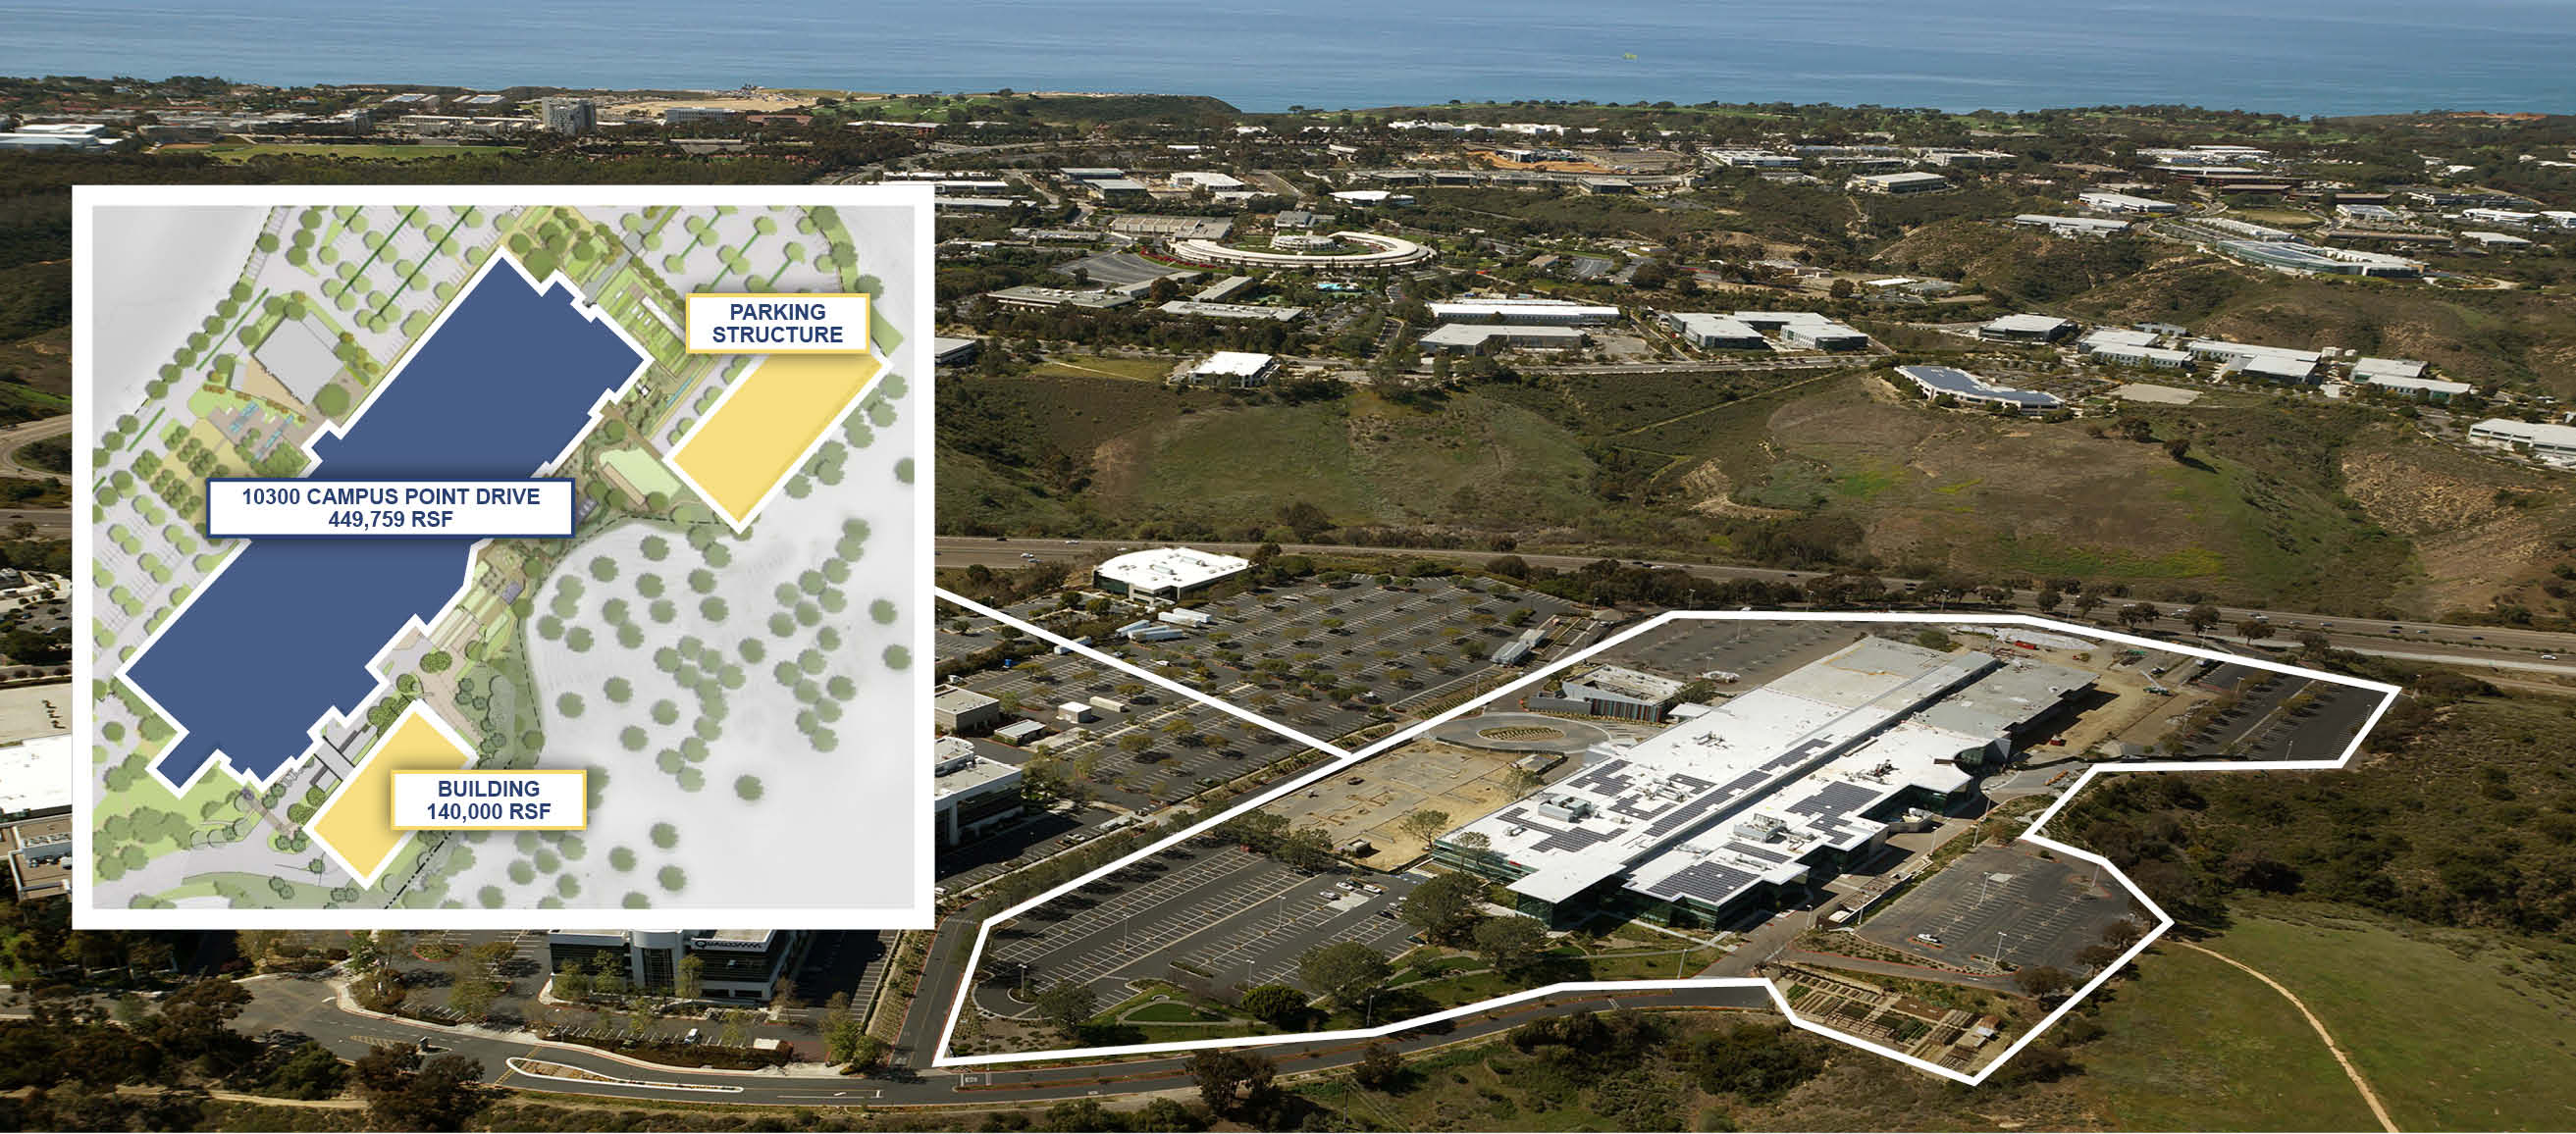 |
| Background | 10300 Campus Point Drive is Alexandria’s flagship 449,759 RSF, multi-tenant laboratory/office campus in University Town Center with additional developable square footage. |
| Near-Term Opportunity | Ground-up development of one building aggregating approximately 140,000 RSF. We are currently negotiating a letter of intent with an existing tenant for an expansion into the majority of a new building. We expect to commence construction of this building in 2015. The timing of revenue recognition for the initial delivery of this project is expected to be 3Q16, subject to final letter of intent and lease negotiations as well as completion of the design and budget for the project. We also expect to disclose the estimated investment and yields upon commencement of ground-up development. We are currently seeking approval to increase the site density. |
| ALEXANDRIA REAL ESTATE EQUITIES, INC ALL RIGHTS RESERVED © 2014 | 39 |
ALEXANDRIA REAL ESTATE EQUITIES, INC.
September 30, 2014
Near-Term and Future Value-Creation Development Projects
Seattle
| Operating | Near-Term and Future Value-Creation Project | |||||
| Property | 1165 Eastlake Avenue East | ||
| Submarket/Market | Lake Union/Seattle | ||
| Aerial | 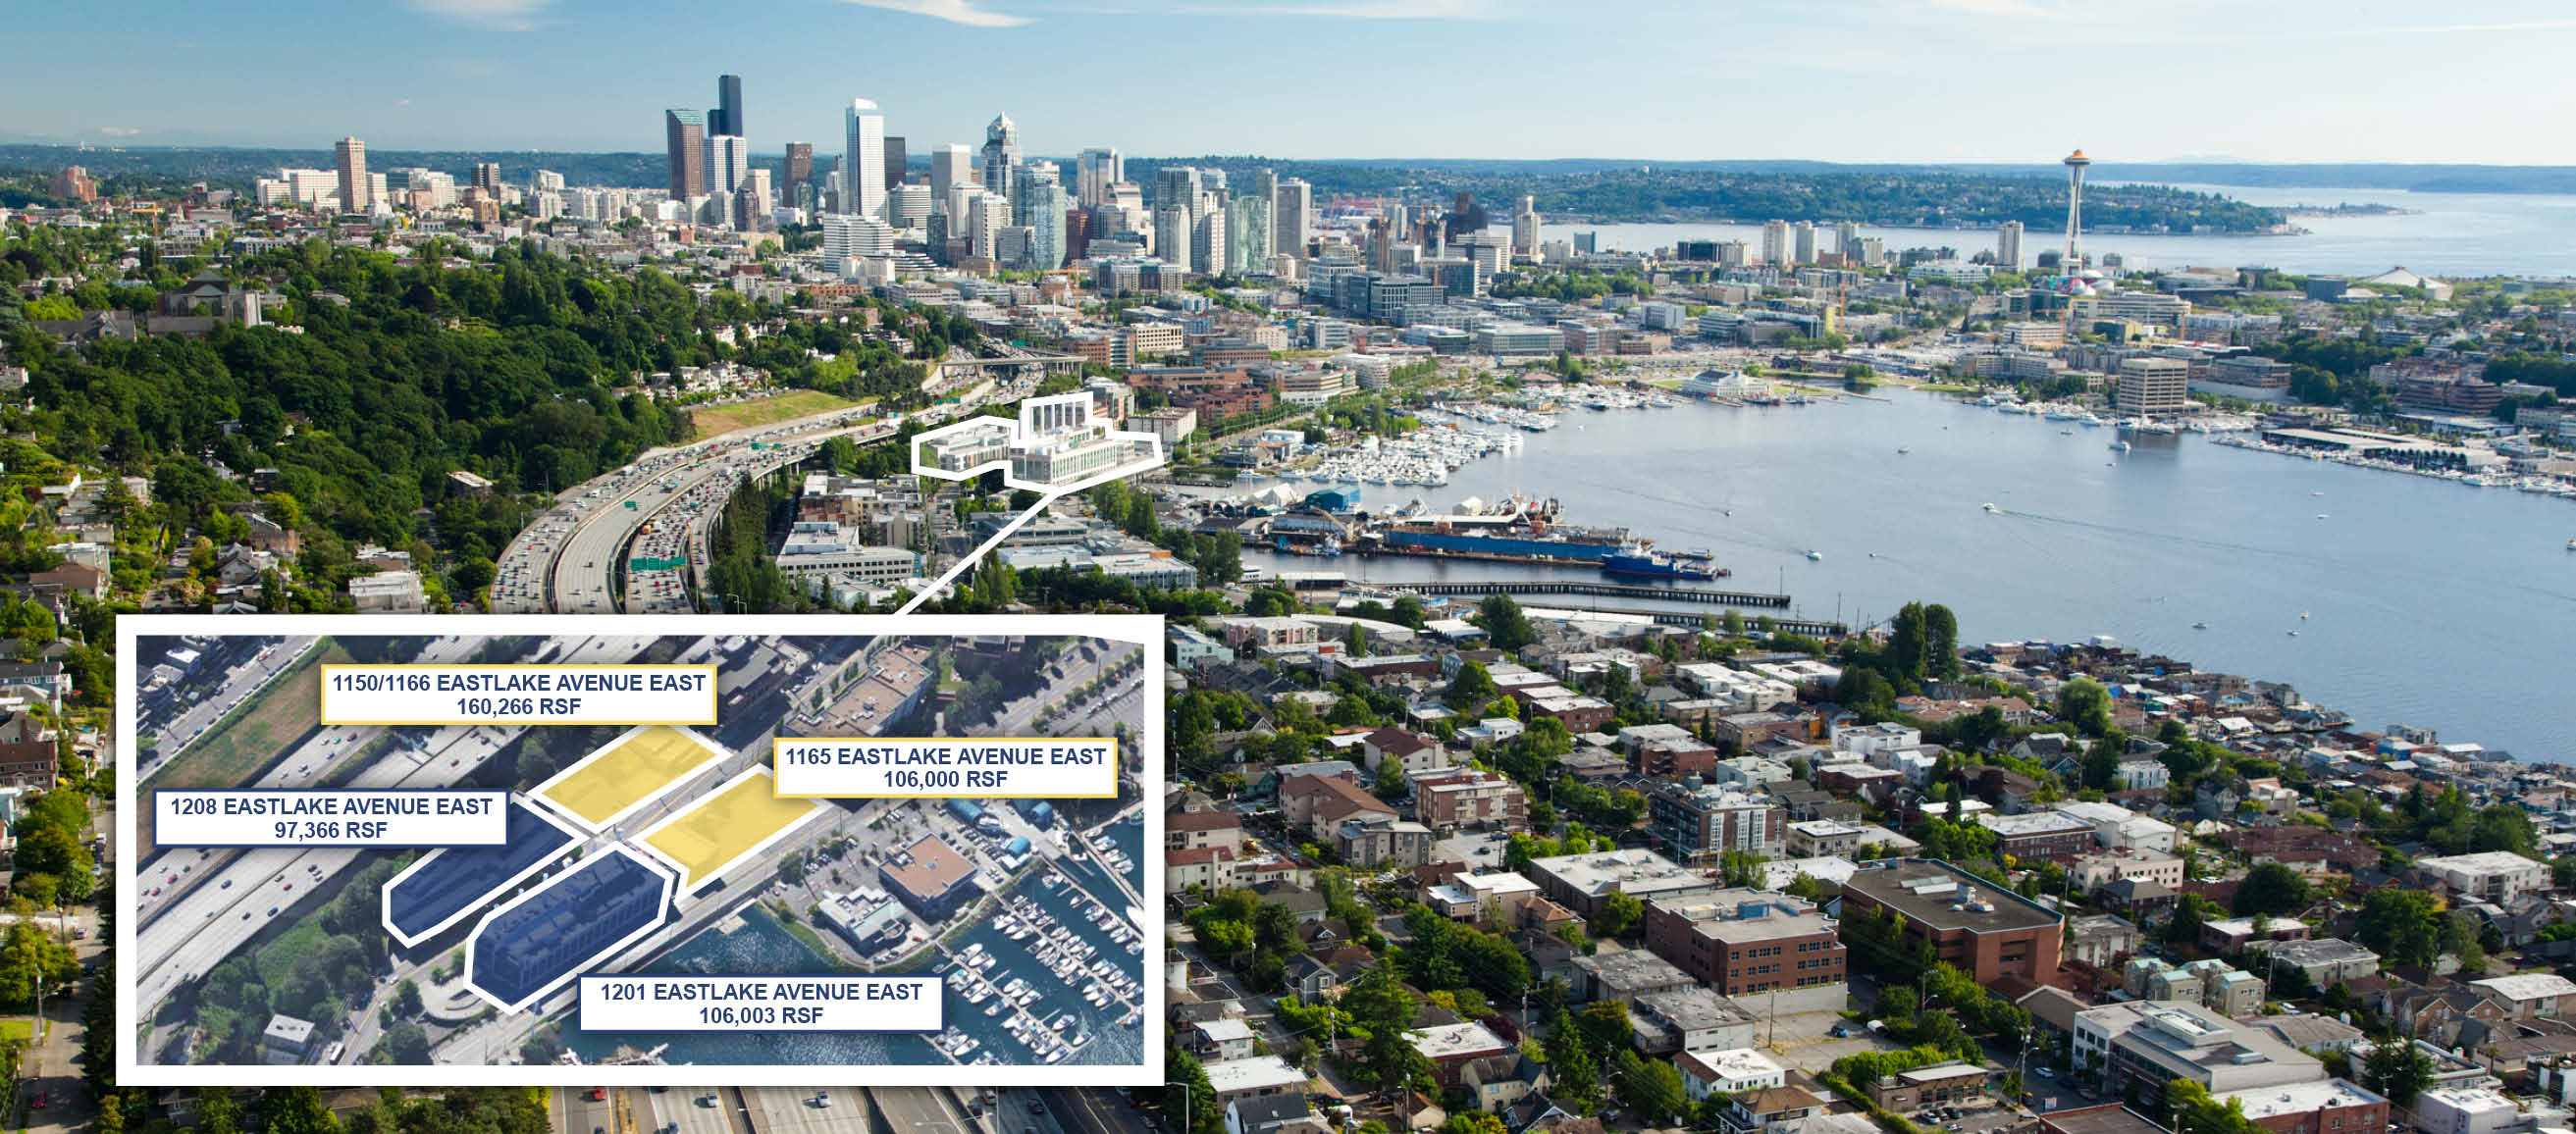 | ||
| Background | Alexandria’s Eastlake Avenue East assets are located in Lake Union, home to numerous highly renowned medical research institutions, including the Fred Hutchinson Cancer Research Center and the University of Washington, as well as the corporate headquarters for Amazon.com, Inc. | ||
| Near-Term Opportunity | Ground-up development of a laboratory/office or tech office building for 106,000 RSF for single or multi-tenancy. We are currently negotiating for single-tenant occupancy. Subject to market conditions, we expect to commence construction of this project over the next one to three years as we have a tenant identified for this project. We expect to disclose the estimated investment and yields upon commencement of ground-up development. | ||
| ALEXANDRIA REAL ESTATE EQUITIES, INC ALL RIGHTS RESERVED © 2014 | 40 |
ALEXANDRIA REAL ESTATE EQUITIES, INC.
September 30, 2014
Unconsolidated Joint Ventures
(Dollars in thousands)
(Unaudited)
| 360 Longwood Avenue | 1455/1515 Third Street | Total ARE Share | ||||||||||||||||||
| 100.0% | ARE’s 27.5% Share | (1) | 100.0% | ARE’s 51.0% Share | (1) | |||||||||||||||
| Rental properties | $ | 105,599 | $ | 32,748 | $ | 21,150 | $ | 10,787 | $ | 43,535 | ||||||||||
| Construction in progress | 179,804 | 55,759 | 105,608 | 54,505 | 110,264 | |||||||||||||||
| Investment in real estate | 285,403 | 88,507 | 126,758 | 65,292 | 153,799 | |||||||||||||||
| Less: accumulated depreciation | — | — | (44 | ) | (22 | ) | (22 | ) | ||||||||||||
| Investment in real estate, net | 285,403 | 88,507 | 126,714 | 65,270 | 153,777 | |||||||||||||||
| Other assets | 6,278 | 1,726 | 4,566 | 2,327 | 4,053 | |||||||||||||||
| Total assets | $ | 291,681 | $ | 90,233 | $ | 131,280 | $ | 67,597 | $ | 157,830 | ||||||||||
| Debt | $ | 143,464 | (2) | $ | 39,453 | $ | — | $ | — | $ | 39,453 | |||||||||
| Other liabilities | 8,205 | 2,256 | 3,830 | 1,953 | 4,209 | |||||||||||||||
| Total liabilities | 151,669 | 41,709 | 3,830 | 1,953 | 43,662 | |||||||||||||||
| Equity | 140,012 | 48,524 | 127,450 | 65,644 | 114,168 | |||||||||||||||
| Total liabilities and equity | $ | 291,681 | $ | 90,233 | $ | 131,280 | $ | 67,597 | $ | 157,830 | ||||||||||
| Square Feet | Square Feet | |||||||||||||||||||
Rental properties (3) | 154,100 | — | ||||||||||||||||||
Active development (CIP) (4) | 259,436 | 422,980 | ||||||||||||||||||
| Investment in real estate | 413,536 | 422,980 | ||||||||||||||||||
| (1) | Amounts include costs incurred directly by us outside of the JVs. We believe the pro rata basis in our investments in unconsolidated JVs is useful information for investors as it provides our proportional share of the investment in real estate from all properties, including our share of the assets and liabilities of our unconsolidated JVs, which cannot be readily determined under GAAP consolidated financial statements or related notes. The pro rata basis allows investors to estimate the impact of real estate investments and debt financing at the JV level. |
| (2) | Secured construction loan with an aggregate commitment of $213.2 million, which bears interest at LIBOR+3.75%, with a floor of 5.25%. The maturity date of the loan is April 1, 2017, with two, one-year options to extend the stated maturity date to April 1, 2019, subject to certain conditions. |
| (3) | Delivery of RSF occurred in late September 2014. |
| (4) | See page 32 for further detail of the unconsolidated JV development projects. |
| ALEXANDRIA REAL ESTATE EQUITIES, INC ALL RIGHTS RESERVED © 2014 | 41 |
ALEXANDRIA REAL ESTATE EQUITIES, INC.
September 30, 2014
Actual and Projected Construction Spending
(Dollars in thousands, except per square foot amounts)
(Unaudited)
| Projected Construction Spending | Three Months Ended December 31, 2014 | 2014 Guidance Range | ||||||||||||||||
| Current value-creation projects in North America: | ||||||||||||||||||
| Development (Consolidated) | $ | 56,000 | ||||||||||||||||
| Development (Unconsolidated JV) | 4,500 | |||||||||||||||||
| Redevelopment | 8,000 | |||||||||||||||||
| Developments/redevelopments recently transferred to rental properties | 22,000 | (1) | ||||||||||||||||
| Generic laboratory infrastructure/building improvement projects | 18,000 | (2) | ||||||||||||||||
| Current value-creation projects in North America | 108,500 | |||||||||||||||||
| Near-term value-creation projects: | ||||||||||||||||||
| Predevelopment/development | 59,000 | 59,000 | (3) | |||||||||||||||
| Value-creation projects | 167,500 | |||||||||||||||||
| Non-revenue-enhancing capital expenditures | 5,500 | |||||||||||||||||
| Projected construction spending | $ | 173,000 | $ | 148,000 | – | 198,000 | ||||||||||||
| Actual construction spending for the nine months ended September 30, 2014 | 382,081 | |||||||||||||||||
| Guidance range for the year ended December 31, 2014 | $ | 530,000 | – | 580,000 | ||||||||||||||
| (1) | Represents spending for recently delivered projects, including 4757 Nexus Center Drive, 1616 Eastlake Avenue East, and 1551 Eastlake Avenue East, that may require additional construction prior to occupancy, generally ranging from 15,000 to 30,000 RSF of the project. |
| (2) | Includes, among others, 3535 General Atomics Court, 3000/3018 Western Avenue, 5810/5820 Nancy Ridge Drive, 8000 Virginia Manor Road, 125 Shoreway Road, and 44 Hartwell Avenue. |
| (3) | Includes costs related to: (i) approximately $19 million in connection with site excavation and construction of the slurry wall and building foundation related to 50 and 60 Binney Street, (ii) approximately $4 million of site and infrastructure costs for the 1.1 million RSF related to the Alexandria Center™ at Kendall Square, including utility access and roads, installation of storm drain systems, infiltration systems, traffic lighting/signals, streets, and sidewalks (excluding the portion related to 75/125 Binney Street, which is included in the projected development spending), and (iii) other predevelopment costs related to 10300 Campus Point Drive, 510 Townsend Street, and 1165 Eastlake Avenue East. |
| Actual Construction Spending | Nine Months Ended September 30, 2014 | |||||
| Development – North America | $ | 238,035 | ||||
| Redevelopment – North America | 47,458 | |||||
| Predevelopment | 43,017 | |||||
Generic laboratory infrastructure/building improvement projects in North America (1) | 42,993 | |||||
| Development and redevelopment – Asia | 10,578 | |||||
| Total construction spending | $ | 382,081 | ||||
| (1) | Includes revenue-enhancing projects and amounts shown in the table to the right related to non-revenue-enhancing capital expenditures. |
Non-revenue-enhancing Capital Expenditures, Tenant Improvements, and Leasing Costs (1) | Nine Months Ended September 30, 2014 | 5 Year (2) Average Per RSF | |||||||||||||
| Amount | RSF | Per RSF | |||||||||||||
| Non-revenue-enhancing capital expenditures | $ | 5,440 | 14,888,722 | $ | 0.37 | $ | 0.24 | ||||||||
| Tenant improvements and leasing costs: | |||||||||||||||
| Re-tenanted space | $ | 4,486 | 252,223 | $ | 17.79 | $ | 9.66 | ||||||||
| Renewal space | 5,194 | 876,859 | $ | 5.92 | $ | 5.40 | |||||||||
| Total tenant improvements and leasing costs/weighted average | $ | 9,680 | 1,129,082 | $ | 8.57 | $ | 6.57 | ||||||||
| (1) | Excludes amounts that are recoverable from client tenants, revenue-enhancing, or related to properties that have undergone redevelopment. |
| (2) | Represents the average of the years ended December 31, 2010, through December 31, 2013, and the nine months ended September 30, 2014, annualized. |
| ALEXANDRIA REAL ESTATE EQUITIES, INC ALL RIGHTS RESERVED © 2014 | 42 |
ALEXANDRIA REAL ESTATE EQUITIES, INC.
September 30, 2014
Acquisitions
(Dollars in thousands)
(Unaudited)
| Unlevered | |||||||||||||||||||||||||||
| Property/Market – Submarket | Type | Date Acquired | Number of Properties | Purchase Price | Loan Assumption | SF | Leased % | Negotiating % | Average Cash Yield | Initial Stabilized Yield (Cash) | Initial Stabilized Yield | ||||||||||||||||
3545 Cray Court/ San Diego – Torrey Pines | Operating | 1/30/14 | 1 | $ | 64,000 | $ | 40,724 | (1) | 116,556 | 100% | —% | 7.2% | 7.0% | 7.2% | |||||||||||||
| 4025/4031/4045 Sorrento Valley Boulevard/ San Diego – Sorrento Valley | Operating | 3/17/14 | 3 | 12,400 | 7,605 | (2) | 42,566 | 100% | —% | 8.2% | 7.8% | 8.2% | |||||||||||||||
225 Second Avenue/ Greater Boston – Route 128 | Redevelopment | 3/27/14 | 1 | 16,330 | — | 112,500 | 100% | (3) | —% | 9.0% | 8.3% | 8.3% | |||||||||||||||
510 Townsend Street/ San Francisco Bay Area – SoMa | Land | 4/18/14 | — | 50,000 | — | 300,000 | —% | 100% | TBD | TBD | TBD | ||||||||||||||||
1455/1515 Third Street/ San Francisco Bay Area – Mission Bay (4) | Land | 9/4/14 | — | 125,000 | — | 422,980 | 100% | —% | TBD | TBD | TBD | ||||||||||||||||
| Total | 5 | $ | 267,730 | $ | 48,329 | ||||||||||||||||||||||
| (1) | Secured note payable with a contractual rate of 4.66% and a maturity date of January 1, 2023. |
| (2) | Secured note payable with a contractual rate of 5.74% and a maturity date of April 15, 2016. |
| (3) | Acquired vacant. We subsequently leased 100% of the project to accommodate the expansion requirements of an existing tenant. |
| (4) | In 3Q14, Alexandria and Uber formed a JV and acquired key land parcels for the ground-up development of two Class A buildings. Alexandria holds a 51% interest in the JV and Uber holds a 49% interest. Additionally, Alexandria executed a 15-year lease with Uber. The purchase price of the land parcels, includes 423 parking structure spaces, foundation piles, plans and permits, and was funded by pro rata contributions from Uber and Alexandria. The land parcels are fully entitled, and include Proposition M office allocation approvals. See page 32 for details of this development project. The design and budget of this project are in process, and the estimated project cost with related yields will be disclosed in the near future. |
| ALEXANDRIA REAL ESTATE EQUITIES, INC ALL RIGHTS RESERVED © 2014 | 43 |
ALEXANDRIA REAL ESTATE EQUITIES, INC.
September 30, 2014
Dispositions
(In thousands)
(Unaudited)
Asset Dispositions
| Amount | ||||
| Completed asset sales as of November 3, 2014 | $ | 33,000 | ||
Pending asset sales under contract or subject to advanced negotiations (1) | 83,000 | |||
| $ | 116,000 | |||
| Total projected asset sales in 2014 | $ | 110,000 – 130,000 | ||
Other real estate sales – next one to five quarters (2) | $ | TBD | ||
| (1) | At contractual or estimated sales price. Assets under sales contract may be subject to, among other steps, completion of due diligence, environmental review including public commentary, and various board and regulatory approvals. |
| (2) | We expect to identify real estate sales, including land and non-core/“core-like” operating assets, over the next one to five quarters to generate proceeds for reinvestment into high-value Class A pre-leased development projects. Additionally, we will continue to execute our strategy to deliver solid growth in funds from operations per share, as adjusted, and net asset value in 2014 and 2015, including any impact of asset sales. |
Discontinued Operations
| Three Months Ended September 30, 2014 | Nine Months Ended September 30, 2014 | |||||||
| Total revenues | $ | — | $ | — | ||||
| Operating expenses | 180 | 489 | ||||||
| NOI from discontinued operations | (180 | ) | (489 | ) | ||||
| Depreciation expense | — | — | ||||||
Loss from discontinued operations (1) | $ | (180 | ) | $ | (489 | ) | ||
| (1) | Loss from discontinued operations includes the results of operations for four operating properties that were classified as “held for sale” as of September 30, 2014. In October 2014, we completed the sale of one property which was classified as “held for sale” as of September 30, 2014. |
| ALEXANDRIA REAL ESTATE EQUITIES, INC ALL RIGHTS RESERVED © 2014 | 44 |
ALEXANDRIA REAL ESTATE EQUITIES, INC.
September 30, 2014
Real Estate Investments in Asia
(Unaudited)
Number of Properties | ABR (in thousands) | Occupancy Percentage | Book Value (in thousands) | Square Feet | |||||||||||
| Rental properties, net, in China | 2 | $ | 1,229 | 53.8 | % | $ | 83,166 | 632,078 | |||||||
| Rental properties, net, in India | 7 | 5,130 | 75.8 | 52,159 | 435,624 | ||||||||||
| Rental properties, net, in Asia | 9 | $ | 6,359 | 62.8 | % | (1) | 135,325 | 1,067,702 | |||||||
| Construction in progress: current development projects in India | 35,602 | 304,762 | |||||||||||||
| Land held for future development in India | 78,319 | 6,419,707 | |||||||||||||
| Total investments in real estate, net, in Asia | $ | 249,246 | 7,792,171 | ||||||||||||
| (1) | Decrease in occupancy primarily due to the completion and delivery during 3Q14 of a development project in China, aggregating 160,694 RSF, consisting of 39,676 leased RSF and 121,018 RSF that are subject to marketing for lease. |
| ALEXANDRIA REAL ESTATE EQUITIES, INC ALL RIGHTS RESERVED © 2014 | 45 |
ALEXANDRIA REAL ESTATE EQUITIES, INC.
September 30, 2014
Key Credit Metrics
(Unaudited)
| Net Debt to Adjusted EBITDA | Fixed Charge Coverage Ratio | Target | |||
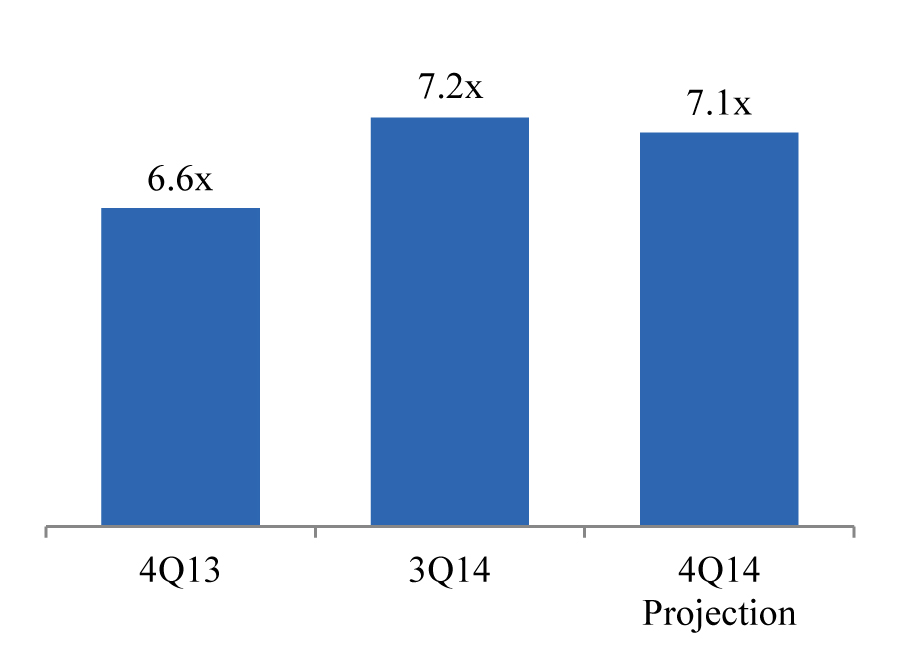 | 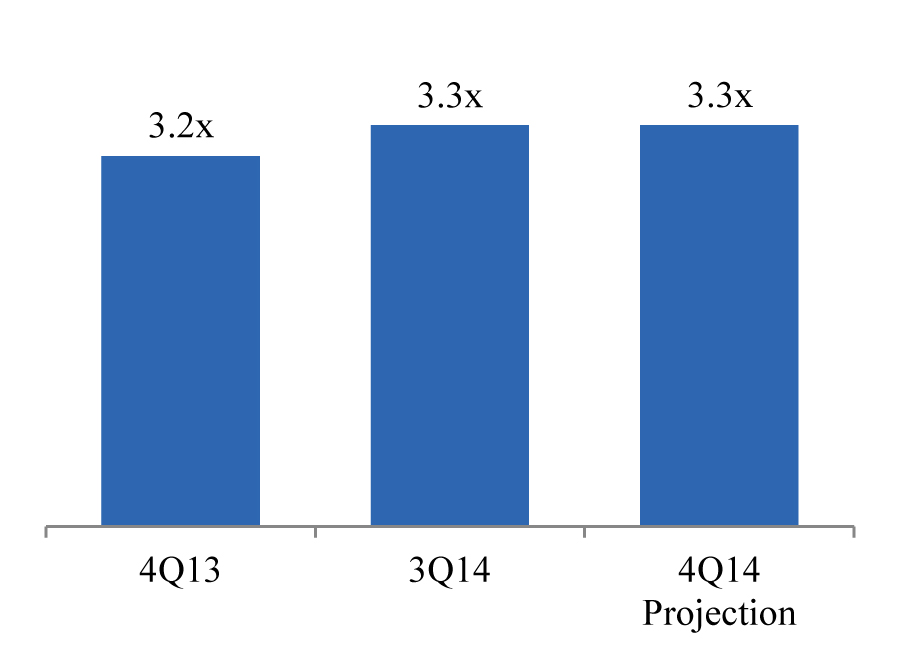 | ||||
Net Debt to Adjusted EBITDA | <6.5x | ||||
Fixed Charge Coverage Ratio | >3.0x | ||||
 | |||||
| High-Quality Tenancy | Pre-Leased Deliveries Drive Decline in Non-Income-Producing Assets (1) | Liquidity | |||||
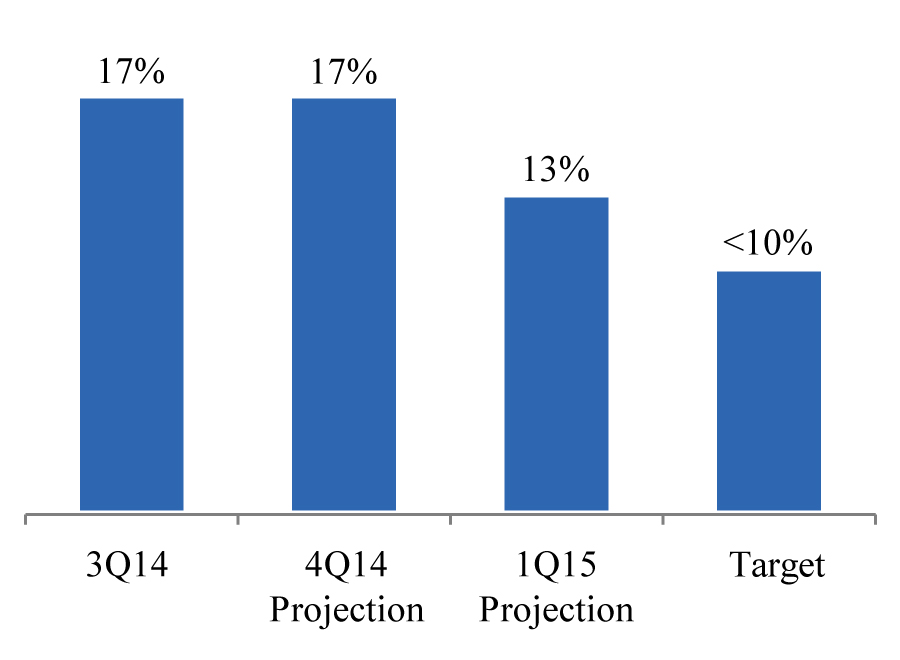 | 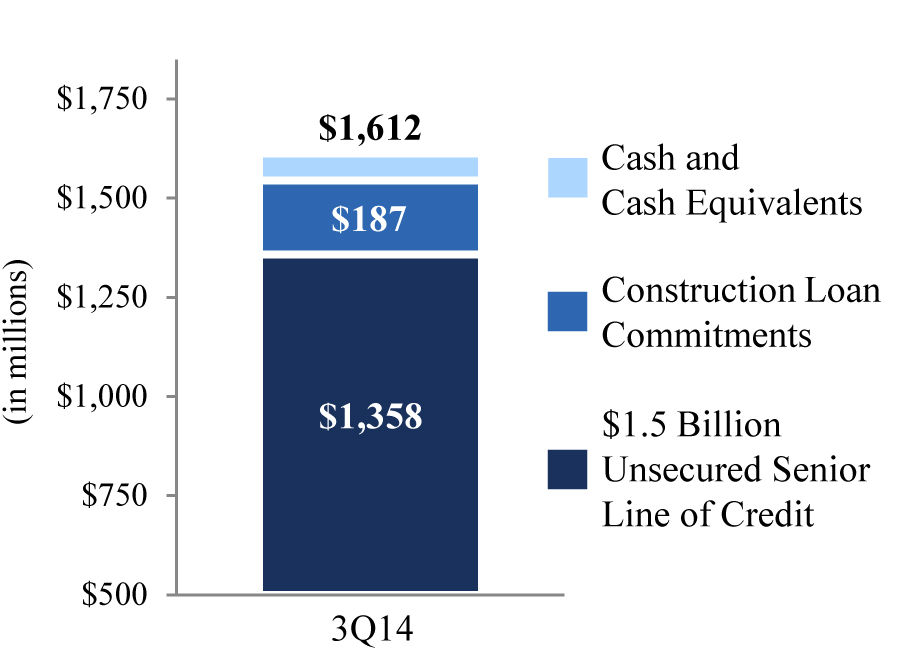 | ||||||
| Investment-Grade Client Tenants: | |||||||
| 53% | |||||||
| of ARE's Total ABR | |||||||
| (1) | Represents non-income-producing assets (CIP and land) as a percentage of gross investments in real estate. |
| ALEXANDRIA REAL ESTATE EQUITIES, INC ALL RIGHTS RESERVED © 2014 | 46 |
ALEXANDRIA REAL ESTATE EQUITIES, INC.
September 30, 2014
Key Earnings and Capital Planning Considerations
(Unaudited)
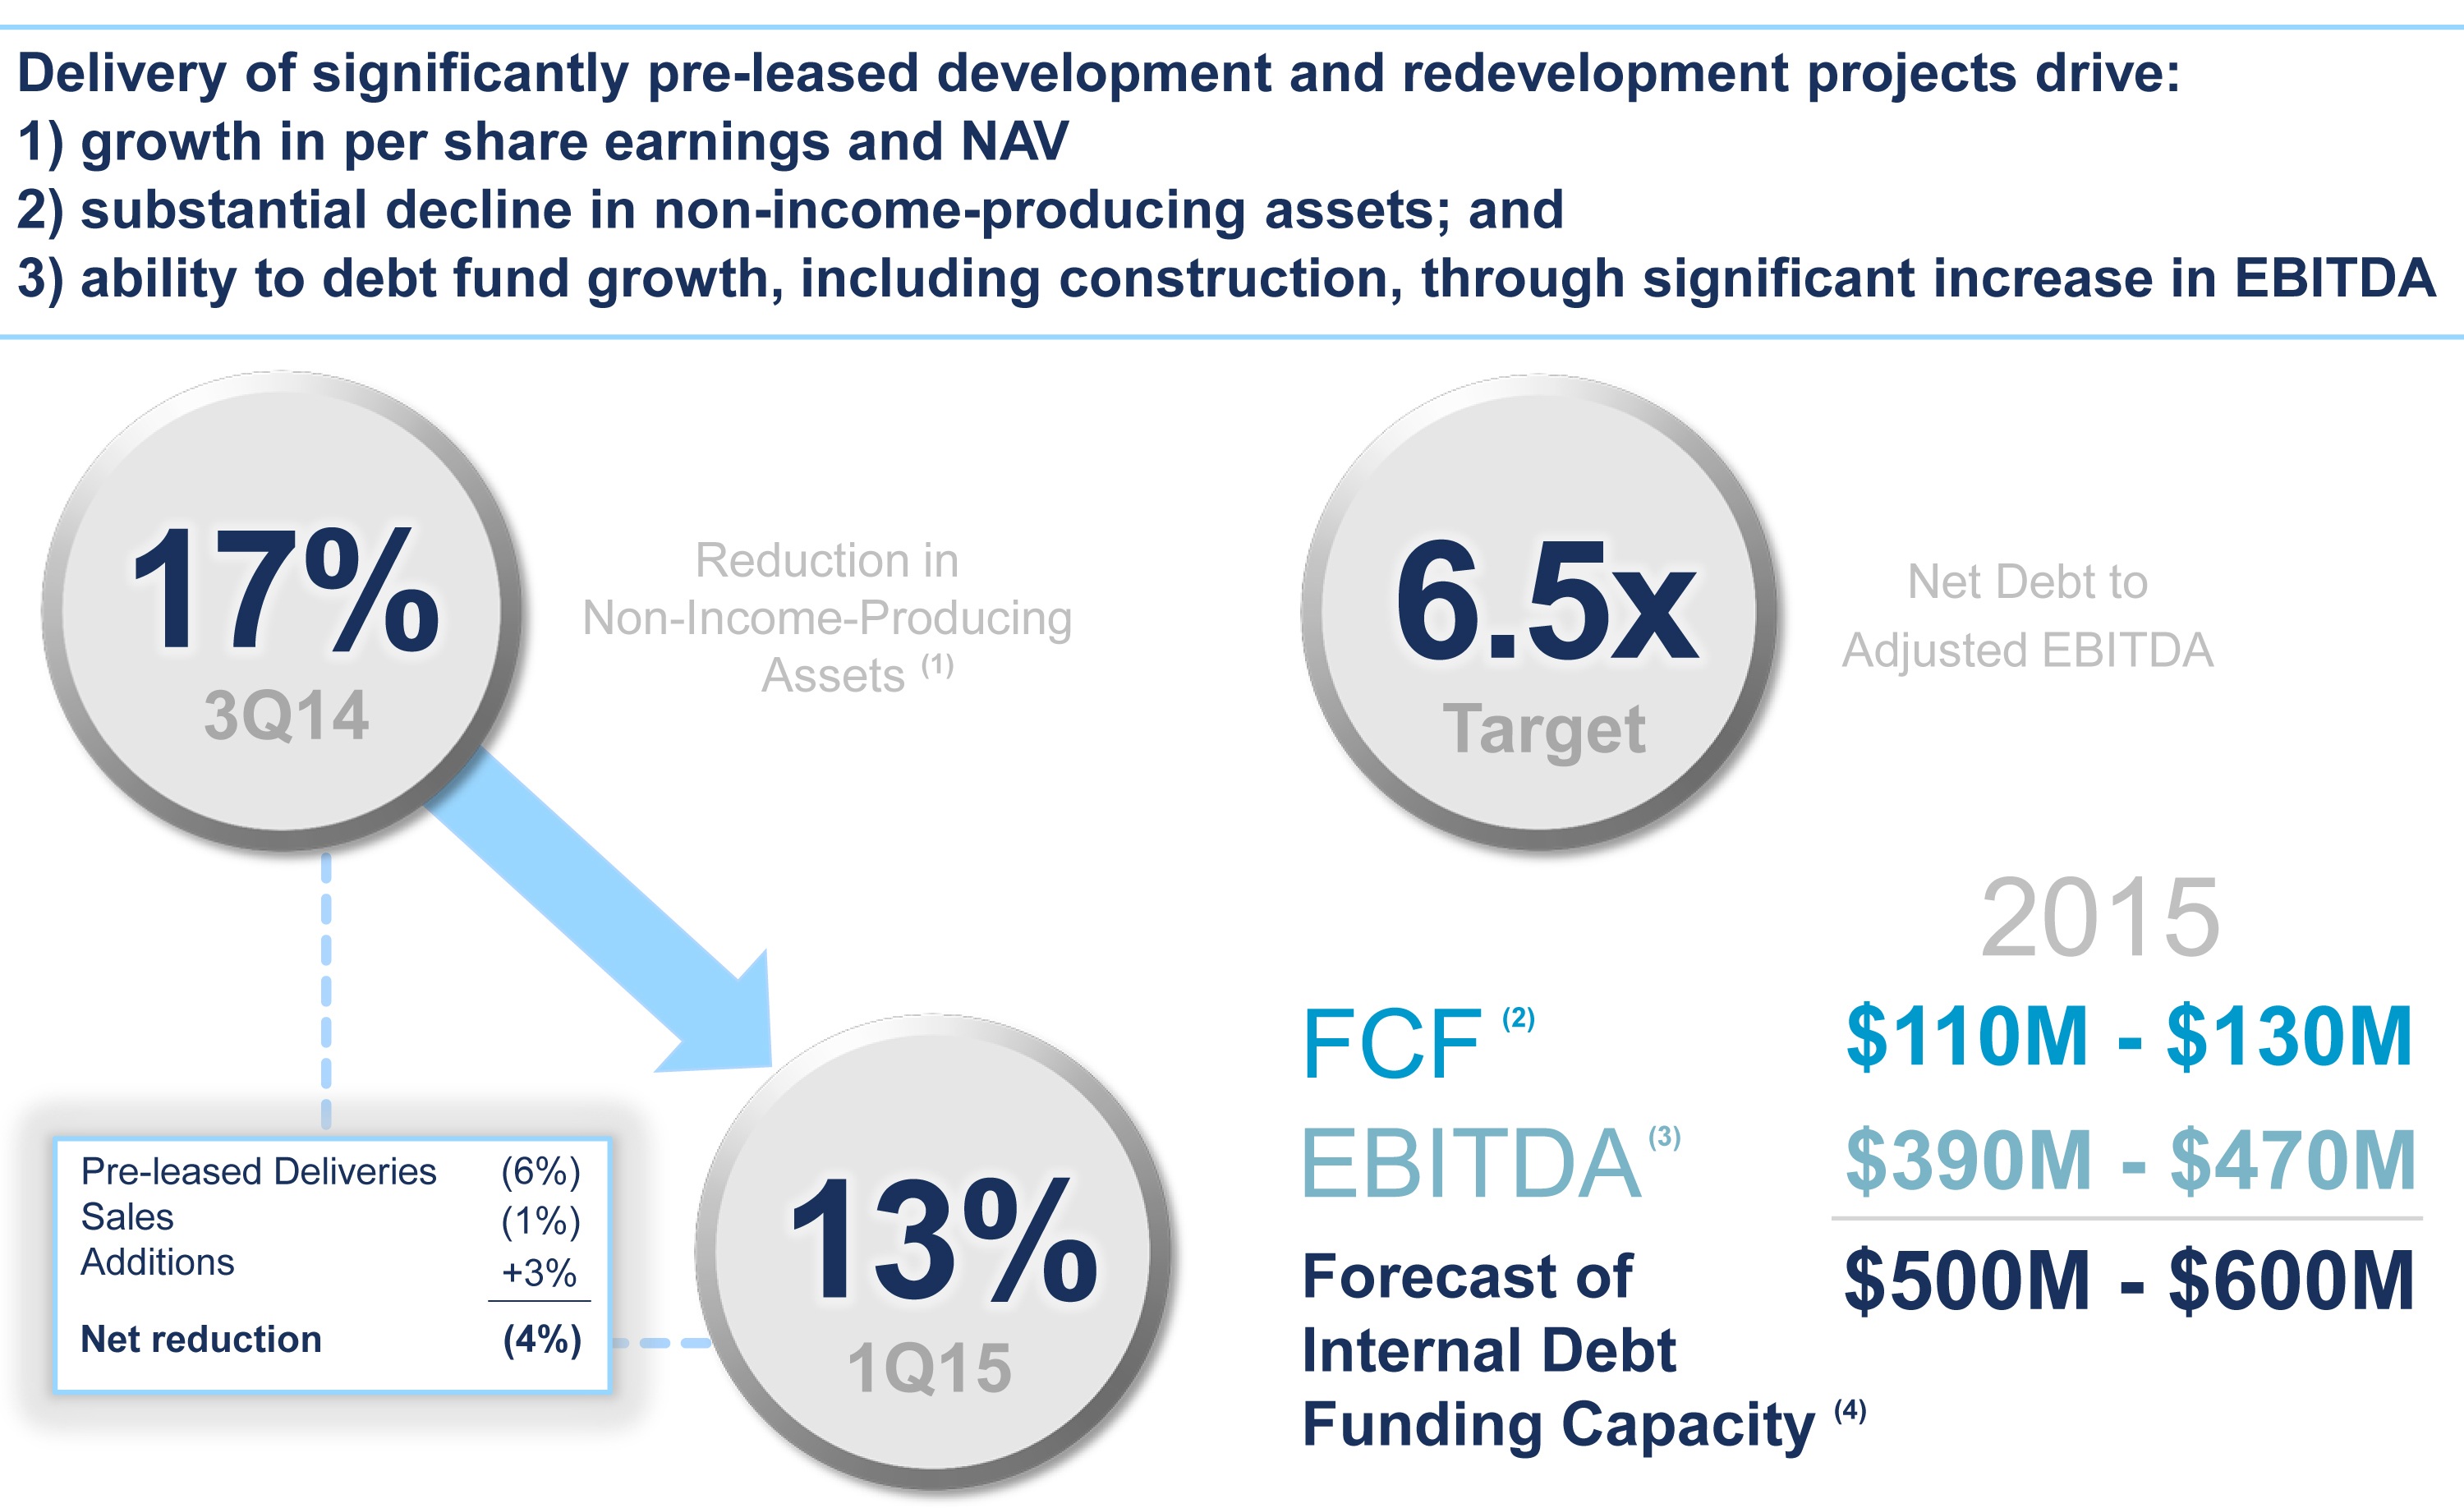 |
| (1) | Represents non-income-producing assets as a percentage of gross investments in real estate. See pre-leasing of current projects on pages 31, 32, and 34. |
| (2) | Free cash flow (“FCF”) represents estimated net cash provided by operating activities after dividends. |
| (3) | Represents amount of construction that can be funded by debt on a leverage neutral basis through growth in Adjusted EBITDA of a range from approximately $60 million to $70 million. |
| (4) | Selective asset sales are expected to provide additional equity-type capital for 2015, in addition to forecasted internal debt funding capacity generated by EBITDA growth and cash flows from operating activities after dividends. Additionally, we will continue to execute our strategy to deliver solid growth in funds from operations per share, as adjusted, and net asset value in 2014 and 2015, including any impact in asset sales. |
| ALEXANDRIA REAL ESTATE EQUITIES, INC ALL RIGHTS RESERVED © 2014 | 47 |
ALEXANDRIA REAL ESTATE EQUITIES, INC.
September 30, 2014
Summary of Debt
(Dollars in thousands)
(Unaudited)
Fixed-rate/hedged and unhedged variable-rate debt
Fixed Rate/Hedged Variable Rate | Unhedged Variable Rate | Total Consolidated | Percentage of Total Debt | Weighted Average Interest Rate at End of Period (1) | Weighted Average Remaining Term (in years) | ||||||||||||||
| Secured notes payable | $ | 406,125 | $ | 230,700 | $ | 636,825 | 18.2 | % | 4.67 | % | 2.9 | ||||||||
| Unsecured senior notes payable | 1,747,290 | — | 1,747,290 | 49.9 | 3.98 | 8.6 | |||||||||||||
| $1.5 billion unsecured senior line of credit | — | 142,000 | 142,000 | 4.1 | 1.25 | 4.3 | |||||||||||||
| 2016 Unsecured Senior Bank Term Loan | 350,000 | 25,000 | 375,000 | 10.7 | 1.42 | 1.8 | |||||||||||||
| 2019 Unsecured Senior Bank Term Loan | 600,000 | — | 600,000 | 17.1 | 2.05 | 4.3 | |||||||||||||
| Total/weighted average | $ | 3,103,415 | $ | 397,700 | $ | 3,501,115 | 100.0 | % | 3.39 | % | 5.9 | ||||||||
| Percentage of total debt | 89% | 11% | 100% | ||||||||||||||||
| (1) | Represents the weighted average interest rate as of the end of the period plus the impact of debt premiums/discounts and our interest rate swap agreements. The weighted average interest rate excludes bank fees and amortization of loan fees. |
Debt maturities chart (In millions) | ||
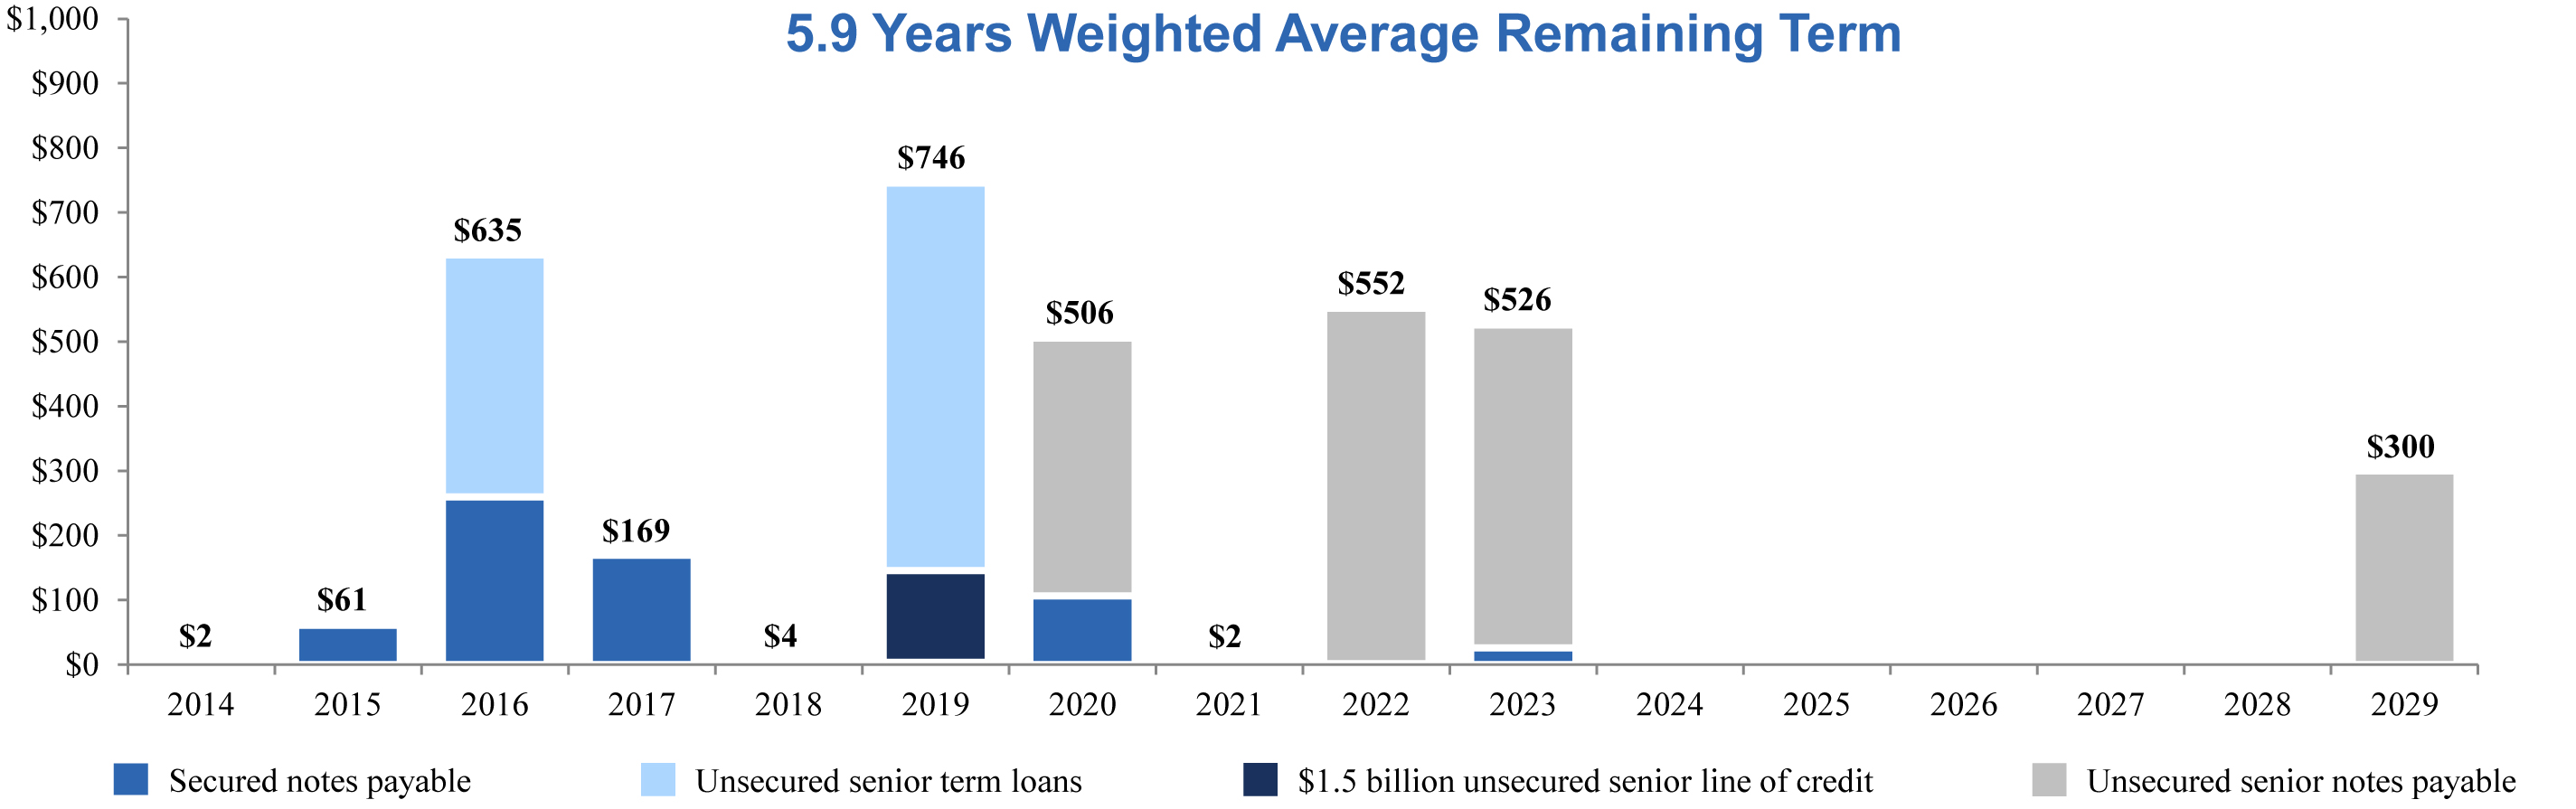 | ||
| ALEXANDRIA REAL ESTATE EQUITIES, INC ALL RIGHTS RESERVED © 2014 | 48 |
ALEXANDRIA REAL ESTATE EQUITIES, INC.
September 30, 2014
Summary of Debt (continued)
(Dollars in thousands)
(Unaudited)
Stated Rate | Weighted Average Interest Rate (1) | Maturity Date (2) | Principal Payments Remaining for the Period Ending December 31, | |||||||||||||||||||||||||||||||||
| Debt | 2014 | 2015 | 2016 | 2017 | 2018 | Thereafter | Total | |||||||||||||||||||||||||||||
| Secured notes payable | ||||||||||||||||||||||||||||||||||||
| Seattle | 6.00 | % | 6.00 | % | 11/18/14 | $ | 60 | $ | — | $ | — | $ | — | $ | — | $ | — | $ | 60 | |||||||||||||||||
| Maryland | 5.64 | 4.50 | 6/1/15 | 34 | 5,777 | — | — | — | — | 5,811 | ||||||||||||||||||||||||||
| San Francisco Bay Area | L+1.50 | 1.66 | 7/1/15 | — | 46,596 | — | — | — | — | 46,596 | ||||||||||||||||||||||||||
| Greater Boston, San Francisco Bay Area, and San Diego | 5.73 | 5.73 | 1/1/16 | 440 | 1,816 | 75,501 | — | — | — | 77,757 | ||||||||||||||||||||||||||
| Greater Boston, San Diego, and New York City | 5.82 | 5.82 | 4/1/16 | 234 | 988 | 29,389 | — | — | — | 30,611 | ||||||||||||||||||||||||||
| San Diego | 5.74 | 3.00 | 4/15/16 | 42 | 175 | 6,916 | — | — | — | 7,133 | ||||||||||||||||||||||||||
| San Francisco Bay Area | L+1.40 | 1.56 | 6/1/16 | — | — | 17,952 | — | — | — | 17,952 | ||||||||||||||||||||||||||
| San Francisco Bay Area | 6.35 | 6.35 | 8/1/16 | 619 | 2,652 | 126,715 | — | — | — | 129,986 | ||||||||||||||||||||||||||
| Maryland | 2.14 | 2.14 | 1/20/17 | — | — | — | 76,000 | — | — | 76,000 | ||||||||||||||||||||||||||
| Greater Boston | L+1.35 | 1.50 | 8/23/17 | — | — | — | 90,092 | — | — | 90,092 | ||||||||||||||||||||||||||
| San Diego, Maryland, and Seattle | 7.75 | 7.75 | 4/1/20 | 374 | 1,570 | 1,696 | 1,832 | 1,979 | 106,490 | 113,941 | ||||||||||||||||||||||||||
| San Diego | 4.66 | 4.66 | 1/1/23 | 337 | 1,402 | 1,464 | 1,540 | 1,614 | 33,367 | 39,724 | ||||||||||||||||||||||||||
| San Francisco Bay Area | 6.50 | 6.50 | 6/1/37 | — | 18 | 19 | 20 | 22 | 751 | 830 | ||||||||||||||||||||||||||
| Unamortized premiums | 54 | 218 | 60 | — | — | — | 332 | |||||||||||||||||||||||||||||
| Secured notes payable average/subtotal | 4.71 | % | 4.67 | 2,194 | 61,212 | 259,712 | 169,484 | 3,615 | 140,608 | 636,825 | ||||||||||||||||||||||||||
| 2016 Unsecured Senior Bank Term Loan | L+1.20 | % | 1.42 | 7/31/16 | — | — | 375,000 | — | — | — | 375,000 | |||||||||||||||||||||||||
| 2019 Unsecured Senior Bank Term Loan | L+1.20 | % | 2.05 | 1/3/19 | — | — | — | — | — | 600,000 | 600,000 | |||||||||||||||||||||||||
| $1.5 billion unsecured senior line of credit | L+1.10 | % | (3) | 1.25 | 1/3/19 | — | — | — | — | — | 142,000 | 142,000 | ||||||||||||||||||||||||
| Unsecured senior notes payable | 2.75 | % | 2.79 | 1/15/20 | — | — | — | — | — | 400,000 | 400,000 | |||||||||||||||||||||||||
| Unsecured senior notes payable | 4.60 | % | 4.61 | 4/1/22 | — | — | — | — | — | 550,000 | 550,000 | |||||||||||||||||||||||||
| Unsecured senior notes payable | 3.90 | % | 3.94 | 6/15/23 | — | — | — | — | — | 500,000 | 500,000 | |||||||||||||||||||||||||
| Unsecured senior notes payable | 4.50 | % | 4.51 | 7/30/29 | — | — | — | — | — | 300,000 | 300,000 | |||||||||||||||||||||||||
| Unamortized discounts | (79 | ) | (326 | ) | (337 | ) | (350 | ) | (362 | ) | (1,256 | ) | (2,710 | ) | ||||||||||||||||||||||
| Unsecured debt average/subtotal | 3.11 | (79 | ) | (326 | ) | 374,663 | (350 | ) | (362 | ) | 2,490,744 | 2,864,290 | ||||||||||||||||||||||||
| Average/total | 3.39 | % | $ | 2,115 | $ | 60,886 | $ | 634,375 | $ | 169,134 | $ | 3,253 | $ | 2,631,352 | $ | 3,501,115 | ||||||||||||||||||||
| Balloon payments | $ | — | $ | 52,336 | $ | 629,851 | $ | 166,092 | $ | — | $ | 2,622,238 | $ | 3,470,517 | ||||||||||||||||||||||
| Principal amortization | 2,115 | 8,550 | 4,524 | 3,042 | 3,253 | 9,114 | 30,598 | |||||||||||||||||||||||||||||
| Total consolidated debt | $ | 2,115 | $ | 60,886 | $ | 634,375 | $ | 169,134 | $ | 3,253 | $ | 2,631,352 | $ | 3,501,115 | ||||||||||||||||||||||
| Fixed-rate/hedged variable-rate debt | $ | 2,055 | $ | 14,290 | $ | 591,423 | $ | 3,042 | $ | 3,253 | $ | 2,489,352 | $ | 3,103,415 | ||||||||||||||||||||||
| Unhedged variable-rate debt | 60 | 46,596 | 42,952 | 166,092 | — | 142,000 | 397,700 | |||||||||||||||||||||||||||||
| Total consolidated debt | $ | 2,115 | $ | 60,886 | $ | 634,375 | $ | 169,134 | $ | 3,253 | $ | 2,631,352 | $ | 3,501,115 | ||||||||||||||||||||||
| (1) | Represents the weighted average contractual interest rate as of the end of the period plus the impact of debt premiums/discounts and our interest rate swap agreements. The weighted average interest rate excludes bank fees and amortization of loan fees. |
| (2) | Includes any extension options that we control. |
| (3) | In addition to the stated rate, the unsecured senior line of credit is subject to an annual facility fee of 0.20%. |
| ALEXANDRIA REAL ESTATE EQUITIES, INC ALL RIGHTS RESERVED © 2014 | 49 |
ALEXANDRIA REAL ESTATE EQUITIES, INC.
September 30, 2014
Summary of Debt (continued)
(Dollars in thousands)
(Unaudited)
| Secured construction loans | ||||||||||||||||||||||
| Address | Market | Stated Rate | Maturity Date | Outstanding Balance | Remaining Commitment | Total Aggregate Commitments | ||||||||||||||||
| 259 East Grand Avenue | San Francisco Bay Area | L+1.50% | 7/1/15 | (1) | $ | 46,596 | $ | 8,404 | $ | 55,000 | ||||||||||||
| 269 East Grand Avenue | San Francisco Bay Area | L+1.40% | 6/1/16 | (2) | 17,952 | 18,048 | 36,000 | |||||||||||||||
| 75/125 Binney Street | Greater Boston | L+1.35% | 8/23/17 | (3) | 90,092 | 160,308 | 250,400 | |||||||||||||||
| $ | 154,640 | $ | 186,760 | $ | 341,400 | |||||||||||||||||
| (1) | We have two, one-year options to extend the stated maturity date to July 1, 2017, subject to certain conditions. |
| (2) | We have two, one-year options to extend the stated maturity date to June 1, 2018, subject to certain conditions. |
| (3) | We have a one-year option to extend the stated maturity date to August 23, 2018, subject to certain conditions. |
| Debt covenants | Unsecured Senior Notes Payable | Unsecured Senior Line of Credit and Unsecured Senior Bank Term Loans | ||||||
| Debt Covenant Ratios | Requirement | Actual | Requirement | Actual | ||||
| Total Debt to Total Assets | ≤ 60% | 39% | ≤ 60.0% | 34.9% | ||||
| Secured Debt to Total Assets | ≤ 40% | 7% | ≤ 45.0% | 6.4% | ||||
| Consolidated EBITDA to Interest Expense | ≥ 1.5x | 6.0x | ≥ 1.50x | 3.06x | ||||
| Unencumbered Total Asset Value to Unsecured Debt | ≥ 150% | 257% | N/A | N/A | ||||
| Unsecured Leverage Ratio | N/A | N/A | ≤ 60.0% | 37.8% | ||||
| Unsecured Interest Coverage Ratio | N/A | N/A | ≥ 1.50x | 8.64x | ||||
| Interest rate swap agreements | ||||||||||||||||||||||||||
| Number of Contracts | Weighted Average Interest Pay Rate (1) | Fair Value as of 9/30/14 | Notional Amount in Effect as of | |||||||||||||||||||||||
| Effective Date | Maturity Date | 9/30/14 | 12/31/14 | 12/31/15 | 12/31/16 | |||||||||||||||||||||
| December 31, 2013 | December 31, 2014 | 2 | 0.98% | $ | (1,051 | ) | $ | 500,000 | $ | — | $ | — | $ | — | ||||||||||||
| December 31, 2013 | March 31, 2015 | 2 | 0.23% | (110 | ) | 250,000 | 250,000 | — | — | |||||||||||||||||
| March 31, 2014 | March 31, 2015 | 4 | 0.21% | (61 | ) | 200,000 | 200,000 | — | — | |||||||||||||||||
| December 31, 2014 | March 31, 2016 | 3 | 0.53% | (23 | ) | — | 500,000 | 500,000 | — | |||||||||||||||||
| March 31, 2016 | March 31, 2017 | 3 | 1.40% | 958 | — | — | — | 500,000 | ||||||||||||||||||
| Total | $ | (287 | ) | $ | 950,000 | $ | 950,000 | $ | 500,000 | $ | 500,000 | |||||||||||||||
| (1) | In addition to the interest pay rate, borrowings outstanding as of September 30, 2014, under our unsecured senior bank term loans include an applicable margin of 1.20% and borrowings outstanding under our unsecured senior line of credit include an applicable margin of 1.10%. |
| ALEXANDRIA REAL ESTATE EQUITIES, INC ALL RIGHTS RESERVED © 2014 | 50 |
ALEXANDRIA REAL ESTATE EQUITIES, INC.
September 30, 2014
Definitions and Reconciliations
(Unaudited)
This section contains additional information for sections throughout this supplemental information package as well as explanations of certain non-GAAP financial measures and the reasons why we use these supplemental measures of performance. Our computation of non-GAAP measures may not be comparable to similar measures reported by other companies. Additional detail can be found in our most recent annual report on Form 10-K and subsequent quarterly reports on Form 10-Q, as well as other documents filed with or furnished to the SEC from time to time.
Adjusted EBITDA
The following table reconciles net income, the most directly comparable financial measure calculated and presented in accordance with GAAP, to EBITDA and Adjusted EBITDA:
| Three Months Ended | Nine Months Ended | ||||||||||||||||||||||||||
| (In thousands) | 9/30/14 | 6/30/14 | 3/31/14 | 12/31/13 | 9/30/13 | 9/30/14 | 9/30/13 | ||||||||||||||||||||
| Net income | $ | 35,943 | $ | 36,116 | $ | 40,749 | $ | 44,222 | $ | 32,453 | $ | 112,808 | $ | 96,027 | |||||||||||||
| Interest expense | 20,555 | 17,433 | 19,123 | 17,783 | 16,171 | 57,111 | 50,169 | ||||||||||||||||||||
| Depreciation and amortization: | |||||||||||||||||||||||||||
| Continuing operations | 58,388 | 57,314 | 50,421 | 48,084 | 48,866 | 166,123 | 141,039 | ||||||||||||||||||||
| Discontinued operations | — | — | — | 17 | 236 | — | 1,638 | ||||||||||||||||||||
| EBITDA | 114,886 | 110,863 | 110,293 | 110,106 | 97,726 | 336,042 | 288,873 | ||||||||||||||||||||
| Stock compensation expense | 3,068 | 3,076 | 3,228 | 4,011 | 3,729 | 9,372 | 11,541 | ||||||||||||||||||||
| Loss on early extinguishment of debt | 525 | — | — | — | 1,432 | 525 | 1,992 | ||||||||||||||||||||
| Loss on sale of real estate | — | — | — | — | — | — | 121 | ||||||||||||||||||||
| Gain on sales of land parcels | (8 | ) | (797 | ) | — | (4,052 | ) | — | (805 | ) | (772 | ) | |||||||||||||||
| Impairment of investments | — | — | — | 853 | — | — | — | ||||||||||||||||||||
| Deal costs | — | — | — | 1,446 | — | — | — | ||||||||||||||||||||
| Adjusted EBITDA | $ | 118,471 | $ | 113,142 | $ | 113,521 | $ | 112,364 | $ | 102,887 | $ | 345,134 | $ | 301,755 | |||||||||||||
EBITDA represents earnings before interest, taxes, depreciation, and amortization, a non-GAAP financial measure, and is used by us and others as a supplemental measure of performance. We use adjusted EBITDA (“Adjusted EBITDA”) to assess the performance of our core operations, for financial and operational decision making, and as a supplemental or additional means of evaluating period-to-period comparisons on a consistent basis. Adjusted EBITDA is calculated as EBITDA, excluding stock compensation expense, gains or losses on early extinguishment of debt, gains or losses on sales of real estate and land parcels, deal costs, and impairments. We believe Adjusted EBITDA provides investors relevant and useful information because it permits investors to view income from our operations on an unleveraged basis before the effects of taxes, depreciation and amortization, stock compensation expense, gains or losses on early extinguishment of debt, gains or losses on sales of real estate and land parcels, deal costs, and impairments.
Adjusted EBITDA margins
Our total revenues exclude revenues from discontinued operations, and for the purposes of calculating the adjusted EBITDA margin ratio, we exclude adjusted EBITDA generated by our discontinued operations to improve the consistency and comparability from period to period.
The following table reconciles adjusted EBITDA to adjusted EBITDA – excluding discontinued operations:
| Three Months Ended | Nine Months Ended | ||||||||||||||||||||||||||
| (Dollars in thousands) | 9/30/14 | 6/30/14 | 3/31/14 | 12/31/13 | 9/30/13 | 9/30/14 | 9/30/13 | ||||||||||||||||||||
| Adjusted EBITDA | $ | 118,471 | $ | 113,142 | $ | 113,521 | $ | 112,364 | $ | 102,887 | $ | 345,134 | $ | 301,755 | |||||||||||||
| Add back: operating (income) loss from discontinued operations | 180 | 147 | 162 | 126 | (193 | ) | 489 | (2,802 | ) | ||||||||||||||||||
| Adjusted EBITDA – excluding discontinued operations | $ | 118,651 | $ | 113,289 | $ | 113,683 | $ | 112,490 | $ | 102,694 | $ | 345,623 | $ | 298,953 | |||||||||||||
| Total revenues | $ | 185,615 | $ | 176,402 | $ | 176,186 | $ | 168,823 | $ | 158,315 | $ | 538,203 | $ | 462,328 | |||||||||||||
| Adjusted EBITDA margins | 64% | 64% | 65% | 67% | 65% | 64% | 65% | ||||||||||||||||||||
Adjusted funds from operations
Adjusted funds from operations (“AFFO”) is a non-GAAP financial measure that we use as a supplemental measure of our performance. AFFO excludes certain items that are not representative of our core operating results because such items are dependent upon historical costs or are subject to judgmental valuation inputs and the timing of our decisions.
AFFO is not intended to represent cash flow for the period, and is intended only to provide an additional measure of performance. We believe that net income attributable to Alexandria’s common stockholders is the most directly comparable GAAP financial measure to AFFO. We believe that AFFO is a widely recognized measure of the operations of equity REITs, and presenting AFFO will enable investors to assess our performance in comparison to other equity REITs. However, other equity REITs may use different methodologies for calculating AFFO and, accordingly, our AFFO may not be comparable to AFFO calculated by other equity REITs. AFFO should not be considered as an alternative to net income (determined in accordance with GAAP) as an indication of financial performance, or to cash flows from operating activities (determined in accordance with GAAP) as a measure of our liquidity, nor is it indicative of funds available to fund our cash needs, including our ability to make distributions.
Annualized base rent
Annualized base rent means the annualized fixed base rental amount in effect as of the end of the period, related to our operating rentable square feet (using rental revenue computed on a straight-line basis in accordance with GAAP).
Average cash yield
See definition of initial stabilized yield (unlevered).
| ALEXANDRIA REAL ESTATE EQUITIES, INC ALL RIGHTS RESERVED © 2014 | 51 |
ALEXANDRIA REAL ESTATE EQUITIES, INC.
September 30, 2014
Definitions and Reconciliations (continued)
(Unaudited)
Cash interest
Cash interest is equal to interest expense calculated in accordance with GAAP, plus capitalized interest, less amortization of loan fees and debt premiums/discounts. See definition of fixed charge coverage ratio for a reconciliation of interest expense, the most directly comparable GAAP financial measure, to cash interest.
Construction in progress
A key component of our business model is our value-creation development and redevelopment projects. These projects are focused on providing high-quality, generic, and reusable science and technology space to meet the real estate requirements of and are reusable by a wide range of client tenants. We also have certain significant value-creation projects undergoing important and substantial predevelopment activities to bring these assets to their intended use. These critical activities add significant value and are required for the construction of buildings. Upon completion, each value-creation project is expected to generate significant revenues and cash flows. Our development and redevelopment projects are generally in locations that are highly desirable to high-quality science and technology entities, which we believe results in higher occupancy levels, longer lease terms, and higher rental income and returns. Development projects consist of the ground-up development of generic and reusable facilities. We generally will not commence new development projects for above-ground construction of Class A science and technology space without first securing pre-leasing for such space except when there is significant market demand for high-quality Class A facilities. Redevelopment projects consist of the permanent change in use of office, warehouse, and shell space into science and technology space.
Land undergoing predevelopment activities (CIP)
Land undergoing predevelopment activities is classified as construction in progress and is undergoing activities prior to commencement of construction of aboveground building improvements. If aboveground construction is not initiated at completion of predevelopment activities, the land parcel will be classified as land held for future development. Our objective with predevelopment is to reduce the time it takes to deliver projects to prospective client tenants.
We are required to capitalize project costs, including interest, property taxes, insurance, and other costs directly related and essential to the development or construction of a project during periods when activities necessary to prepare an asset for its intended use are in progress. Predevelopment costs generally include the following activities prior to commencement of vertical construction:
| Ÿ | Traditional preconstruction costs including entitlement, design, construction drawings, Building Information Modeling (3-D virtual modeling), budgeting, sustainability and energy optimization reviews, permitting, and planning for all aspects of the project. |
| Ÿ | Site and infrastructure construction costs including belowground site work, utility connections, land grading, drainage, egress and regress access points, foundation, and other costs to prepare the site for construction of aboveground building improvements. |
Land held for future development
All predevelopment efforts have been advanced to appropriate stages and no further predevelopment activities are ongoing and therefore, interest, property taxes, and other costs related to these assets are expensed as incurred.
Dividend payout ratio
Dividend payout ratio (common stock) is the ratio of the absolute dollar amount of dividends on our common stock (shares of common stock outstanding on the respective record date multiplied by the related dividend per share) to FFO attributable to Alexandria’s common stockholders on a diluted basis, as adjusted.
Dividend yield
Dividend yield for the quarter represents the annualized quarter dividend divided by the closing common stock price at the end of the quarter.
Fixed charge coverage ratio
The fixed charge coverage ratio is a supplemental measure of our ability to satisfy fixed financing obligations and preferred stock dividends. The following table presents a reconciliation of interest expense, the most directly comparable GAAP financial measure to cash interest and fixed charges:
| Three Months Ended | |||||||||||||||||||
| (Dollars in thousands) | 9/30/14 | 6/30/14 | 3/31/14 | 12/31/13 | 9/30/13 | ||||||||||||||
| Adjusted EBITDA | $ | 118,471 | $ | 113,142 | $ | 113,521 | $ | 112,364 | $ | 102,887 | |||||||||
| Interest expense | $ | 20,555 | $ | 17,433 | $ | 19,123 | $ | 17,783 | $ | 16,171 | |||||||||
| Add: capitalized interest | 12,125 | 11,302 | 12,013 | 14,116 | 16,788 | ||||||||||||||
| Less: amortization of loan fees | (2,786 | ) | (2,743 | ) | (2,561 | ) | (2,636 | ) | (2,487 | ) | |||||||||
| Less: amortization of debt premiums (discounts) | 36 | 69 | (205 | ) | (146 | ) | (153 | ) | |||||||||||
| Cash interest | 29,930 | 26,061 | 28,370 | 29,117 | 30,319 | ||||||||||||||
| Dividends on preferred stock | 6,471 | 6,472 | 6,471 | 6,471 | 6,472 | ||||||||||||||
| Fixed charges | $ | 36,401 | $ | 32,533 | $ | 34,841 | $ | 35,588 | $ | 36,791 | |||||||||
| Fixed charge coverage ratio: | |||||||||||||||||||
| – quarter annualized | 3.3x | 3.5x | 3.3x | 3.2x | 2.8x | ||||||||||||||
| – trailing 12 months | 3.3x | 3.2x | 3.0x | 2.9x | 2.8x | ||||||||||||||
Funds from operations and funds from operations, as adjusted
FFO is a widely used non-GAAP financial measure among equity REITs. We believe that FFO is helpful to investors as an additional measure of the performance of an equity REIT. Moreover, we believe that FFO, as adjusted, is also helpful because it allows investors to compare our performance to the performance of other real estate companies on a consistent basis, without having to account for differences caused by investment and disposition decisions, financing decisions, terms of securities, capital structures, and capital market transactions. We compute FFO in accordance with standards established by the Board of Governors of the National Association of Real Estate Investment Trusts (“NAREIT”) in its April 2002 White Paper and related implementation guidance. Neither FFO nor FFO, as adjusted, should be considered as an alternative to net income (determined in accordance with GAAP) as an indication of financial performance, or to cash flows from operating activities (determined in accordance with GAAP) as a measure of liquidity, nor are they indicative of the availability of funds for our cash needs, including funds available to make distributions.
| ALEXANDRIA REAL ESTATE EQUITIES, INC ALL RIGHTS RESERVED © 2014 | 52 |
ALEXANDRIA REAL ESTATE EQUITIES, INC.
September 30, 2014
Definitions and Reconciliations (continued)
(Unaudited)
Initial stabilized yield (unlevered)
Initial stabilized yield is calculated as the quotient of the estimated amounts of NOI and our investment in the property. Our initial stabilized yield excludes the impact of leverage. Our cash rents related to our value-creation projects are expected to increase over time and our average cash yields are expected, in general, to be greater than our initial stabilized yields on a cash basis. Our estimates for initial yields, initial yields on a cash basis, and total costs at completion, represent our initial estimates at the commencement of the project. We expect to update this information upon completion of the project, or sooner, if there are significant changes to the expected project yields or costs.
| Ÿ | Initial stabilized yield: reflects rental income less straight-line rent, including contractual rent escalations and any rent concessions over the term(s) of the lease(s), calculated on a straight-line basis. |
| Ÿ | Initial stabilized yield – cash basis: reflects cash rents at the stabilization date after initial rental concessions, if any, have elapsed. |
Average cash yield reflects cash rents, including contractual rent escalations after initial rental concessions have elapsed, calculated on a straight-line basis.
Net debt to Adjusted EBITDA
Net debt to Adjusted EBITDA is a non-GAAP financial measure that we believe is useful to investors as a supplemental measure in evaluating our balance sheet leverage. The following table reconciles net debt to Adjusted EBITDA:
| (Dollars in thousands) | 9/30/14 | 6/30/14 | 3/31/14 | 12/31/13 | 9/30/13 | |||||||||||||||
| Secured notes payable | $ | 636,825 | $ | 615,551 | $ | 597,511 | $ | 708,831 | $ | 708,653 | ||||||||||
| Unsecured senior notes payable | 1,747,290 | 1,048,310 | 1,048,270 | 1,048,230 | 1,048,190 | |||||||||||||||
| Unsecured senior line of credit | 142,000 | 571,000 | 506,000 | 204,000 | 14,000 | |||||||||||||||
| Unsecured senior bank term loans | 975,000 | 1,100,000 | 1,100,000 | 1,100,000 | 1,100,000 | |||||||||||||||
| Less: cash and cash equivalents | (67,023 | ) | (61,701 | ) | (74,970 | ) | (57,696 | ) | (53,839 | ) | ||||||||||
| Less: restricted cash | (24,245 | ) | (24,519 | ) | (30,454 | ) | (27,709 | ) | (30,654 | ) | ||||||||||
| Net debt | $ | 3,409,847 | $ | 3,248,641 | $ | 3,146,357 | $ | 2,975,656 | $ | 2,786,350 | ||||||||||
| Adjusted EBITDA: | ||||||||||||||||||||
| – quarter annualized | $ | 473,884 | $ | 452,568 | $ | 454,084 | $ | 449,456 | $ | 411,548 | ||||||||||
| – trailing 12 months | $ | 457,498 | $ | 441,914 | $ | 428,699 | $ | 414,119 | $ | 403,974 | ||||||||||
| Net debt to Adjusted EBITDA: | ||||||||||||||||||||
| – quarter annualized | 7.2 | x | 7.2 | x | 6.9 | x | 6.6 | x | 6.8 | x | ||||||||||
| – trailing 12 months | 7.5 | x | 7.4 | x | 7.3 | x | 7.2 | x | 6.9 | x | ||||||||||
NOI
The following table reconciles total NOI from continuing operations to income from continuing operations:
| Three Months Ended | Nine Months Ended | |||||||||||||||
| (In thousands) | 9/30/14 | 9/30/13 | 9/30/14 | 9/30/13 | ||||||||||||
| Income from continuing operations | $ | 36,115 | $ | 32,496 | $ | 112,492 | $ | 94,212 | ||||||||
| Add back other expenses: | ||||||||||||||||
| General and administrative | 12,609 | 11,666 | 39,669 | 35,769 | ||||||||||||
| Interest | 20,555 | 16,171 | 57,111 | 50,169 | ||||||||||||
| Depreciation and amortization | 58,388 | 48,866 | 166,123 | 141,039 | ||||||||||||
| Loss on early extinguishment of debt | 525 | 1,432 | 525 | 1,992 | ||||||||||||
| Total other expenses | 92,077 | 78,135 | 263,428 | 228,969 | ||||||||||||
| Total NOI from continuing operations | $ | 128,192 | $ | 110,631 | $ | 375,920 | $ | 323,181 | ||||||||
NOI is a non-GAAP financial measure equal to income from continuing operations, the most directly comparable GAAP financial measure, excluding loss on early extinguishment of debt, impairment of land parcel, depreciation and amortization, interest expense, and general and administrative expense. We believe NOI provides useful information to investors regarding our financial condition and results of operations because it reflects primarily those income and expense items that are incurred at the property level. Therefore, we believe NOI is a useful measure for evaluating the operating performance of our real estate assets. NOI on a cash basis is NOI, adjusted to exclude the effect of straight-line rent adjustments required by GAAP. We believe that NOI on a cash basis is helpful to investors as an additional measure of operating performance because it eliminates straight-line rent adjustments to rental revenue.
Further, we believe NOI is useful to investors as a performance measure, because when compared across periods, NOI reflects the impact on operations from trends in occupancy rates, rental rates, and operating costs, providing perspective not immediately apparent from income from continuing operations. NOI presented by us may not be comparable to NOI reported by other equity REITs that define NOI differently. We believe that in order to facilitate a clear understanding of our operating results, NOI should be examined in conjunction with income from continuing operations as presented in our consolidated statements of income. NOI should not be considered as an alternative to income from continuing operations as an indication of our performance, or as an alternative to cash flows as a measure of liquidity, or our ability to make distributions.
| ALEXANDRIA REAL ESTATE EQUITIES, INC ALL RIGHTS RESERVED © 2014 | 53 |
ALEXANDRIA REAL ESTATE EQUITIES, INC.
September 30, 2014
Definitions and Reconciliations (continued)
(Unaudited)
Same property comparisons
As a result of changes within our total property portfolio during the comparative periods presented, including assets acquired, properties placed into development and redevelopment, and projects delivered into operations from development and redevelopment, the consolidated total rental revenues, tenant recoveries and rental operating expenses in our operating results can show significant changes from period to period. In order to supplement an evaluation of our results of operations over a given period, we analyze the operating performance for all properties that were fully operating for the entirety of the comparative periods presented separately from properties acquired subsequent to the first day in the earliest comparable period presented, properties that underwent development or redevelopment at any time during the comparative periods, and corporate entities (legal entities performing general and administrative functions), which are excluded from same property results. Additionally, rental revenues from lease termination fees, if any, are excluded from the results of the same properties.
Stabilized occupancy date
The stabilized occupancy date represents the estimated date on which the project is expected to reach occupancy of 95% or greater.
Total market capitalization
Total market capitalization is equal to the sum of outstanding shares of series E cumulative convertible preferred stock and common stock multiplied by the related closing price of each class at the end of each period presented, the liquidation value of the series D cumulative convertible preferred stock, and total debt.
Unencumbered NOI as a percentage of total NOI from continuing operations
Unencumbered NOI as a percentage of total NOI from continuing operations is a non-GAAP financial measure that we believe is useful to investors as a performance measure of the results of operations of our unencumbered real estate assets, as it reflects primarily those income and expense items that are incurred at the unencumbered property level. We use unencumbered NOI as a percentage of total NOI from continuing operations in order to assess our compliance with our financial covenants under our debt obligations because the measure serves as a proxy for a financial measure under such debt obligations. Unencumbered NOI is derived from assets classified in continuing operations which are not subject to any mortgage, deed of trust, lien, or other security interest as of the period for which income is presented. Unencumbered NOI for periods prior to the three months ended September 30, 2014, has been reclassified to conform to current period presentation related to discontinued operations.
| Three Months Ended | Nine Months Ended | ||||||||||||||||||||||||||
| (Dollars in thousands) | 9/30/14 | 6/30/14 | 3/31/14 | 12/31/13 | 9/30/13 | 9/30/14 | 9/30/13 | ||||||||||||||||||||
| Unencumbered NOI | $ | 108,155 | $ | 103,951 | $ | 103,096 | $ | 82,267 | $ | 76,607 | $ | 315,202 | $ | 222,716 | |||||||||||||
| Encumbered NOI | 20,037 | 20,098 | 20,583 | 36,664 | 34,024 | 60,718 | 100,465 | ||||||||||||||||||||
| Total NOI from continuing operations | $ | 128,192 | $ | 124,049 | $ | 123,679 | $ | 118,931 | $ | 110,631 | $ | 375,920 | $ | 323,181 | |||||||||||||
| Unencumbered NOI as a percentage of total NOI | 84% | 84% | 83% | 69% | 69% | 84% | 69% | ||||||||||||||||||||
Weighted average interest rate for capitalization of interest
The weighted average interest rate required for calculating capitalization of interest pursuant to GAAP represents a weighted average rate based on the rates applicable to borrowings outstanding during the period and includes the impact of our interest rate swap agreements, amortization of debt discounts/premiums, amortization of loan fees, and other bank fees. A separate calculation is performed to determine our weighted average interest rate for capitalization for each month. The rate will vary each month due to changes in variable interest rates, outstanding debt balances, the proportion of variable-rate debt to fixed-rate debt, the amount and terms of effective interest rate swap agreements, and the amount of loan fee amortization.
The following table presents the weighted average interest rate for capitalization of interest:
| Three Months Ended | |||||||||
| 9/30/14 | 6/30/14 | 3/31/14 | 12/31/13 | 9/30/13 | |||||
| Weighted average interest rate | 3.73% | 3.41% | 3.88% | 4.09% | 4.33% | ||||
Weighted average shares for calculating FFO, FFO, as adjusted, and AFFO per share
Weighted average shares of common stock outstanding for calculating FFO, FFO, as adjusted, and AFFO per share attributable to Alexandria’s common stockholders represent the weighted average of common shares outstanding during the period, calculated as follows:
| Three Months Ended | Nine Months Ended | |||||||||||||||||||
| (In thousands) | 9/30/14 | 6/30/14 | 3/31/14 | 12/31/13 | 9/30/13 | 9/30/14 | 9/30/13 | |||||||||||||
| Weighted average shares – basic | 71,195 | 71,126 | 71,073 | 71,000 | 70,900 | 71,121 | 67,040 | |||||||||||||
| Assumed conversion of 8.00% unsecured senior convertible notes | — | — | — | — | 5 | — | 6 | |||||||||||||
| Weighted average shares – diluted | 71,195 | 71,126 | 71,073 | 71,000 | 70,905 | 71,121 | 67,046 | |||||||||||||
| ALEXANDRIA REAL ESTATE EQUITIES, INC ALL RIGHTS RESERVED © 2014 | 54 |