| Alexandria Real Estate Equities, Inc. All Rights Reserved. © 2017 | ||
| Alexandria Real Estate Equities, Inc. All Rights Reserved. © 2017 | i | |
| (1) Represents annual rental revenue in effect as of March 31, 2017. |
 | |
| Table of Contents | |
| March 31, 2017 | |
| EARNINGS PRESS RELEASE | Page |
| SUPPLEMENTAL INFORMATION | |
| Internal Growth | |
| SUPPLEMENTAL INFORMATION (CONTINUED) | Page |
| External Growth | |
| Development and Redevelopment of New Class A Properties: | |
2017 Deliveries (Undergoing Construction) | |
| Balance Sheet Management | |
| Definitions and Reconciliations | |
This document includes “forward-looking statements” within the meaning of Section 27A of the Securities Act of 1933, as amended, and Section 21E of the Securities Exchange Act of 1934, as amended. Please see page 7 of our Earnings Press Release for further information. |
| This document is not an offer to sell or a solicitation to buy securities of Alexandria Real Estate Equities, Inc. Any offers to sell or solicitations to buy our securities shall be made only by means of a prospectus approved for that purpose. Unless otherwise indicated, the “Company,” “Alexandria,” “ARE,” “we,” “us,” and “our” refer to Alexandria Real Estate Equities, Inc. and its consolidated subsidiaries. |
| Alexandria Real Estate Equities, Inc. All Rights Reserved. © 2017 | iii | |

Alexandria Real Estate Equities, Inc.
Reports
First Quarter Ended March 31, 2017, Financial and Operating Results
Strong Internal and External Growth
PASADENA, Calif. – May 1, 2017 – Alexandria Real Estate Equities, Inc. (NYSE:ARE)
announced financial and operating results for the first quarter ended March 31, 2017.
Key highlights
Addition to S&P 500 Index
We achieved another significant milestone with the announcement that the S&P Dow Jones Indices added Alexandria to the S&P 500® Index. This significant and important recognition reflects our best-in-class team’s ability to successfully execute our differentiated business strategy, which drives our successful operating and financial performance.
Credit rating upgrade
S&P Global Ratings upgraded our corporate credit rating to BBB/Stable from
BBB-/Positive.
Strong internal growth
| • | Total revenues of $270.9 million, up 25.4%, for 1Q17, compared to $216.1 million for 1Q16; |
| • | Substantial leasing activity and strong rental rate growth, in light of minimal contractual lease expirations at the beginning of 2017 and a highly leased value-creation pipeline: |
| 1Q17 | |||
| Total leasing activity – RSF | 1,320,781 | ||
| Lease renewals and re-leasing of space: | |||
| Rental rate increases | 27.8% | ||
| Rental rate increases (cash basis) | 17.7% | ||
| RSF (included in total leasing activity above) | 878,863 | ||
| • | Executed key leases at average rental rate increases of 25.9% and 17.4% (cash basis) during 1Q17, included in the statistics above: |
| • | 302,626 RSF, leased to Novartis AG at 100 and 200 Technology Square in our Cambridge submarket; |
| • | 155,685 RSF, leased to Genentech, Inc., a subsidiary of Roche, at 500 Forbes Boulevard in our South San Francisco submarket; and |
| • | 43,625 RSF, leased to Vir Biotechnology, Inc. at 499 Illinois Street in our Mission Bay/SoMa submarket. |
| • | Same property net operating income growth: |
| • | 2.6% and 5.5% (cash basis) for 1Q17, compared to 1Q16. |
Strong external growth; disciplined allocation of capital to visible, multiyear, highly leased
value-creation pipeline
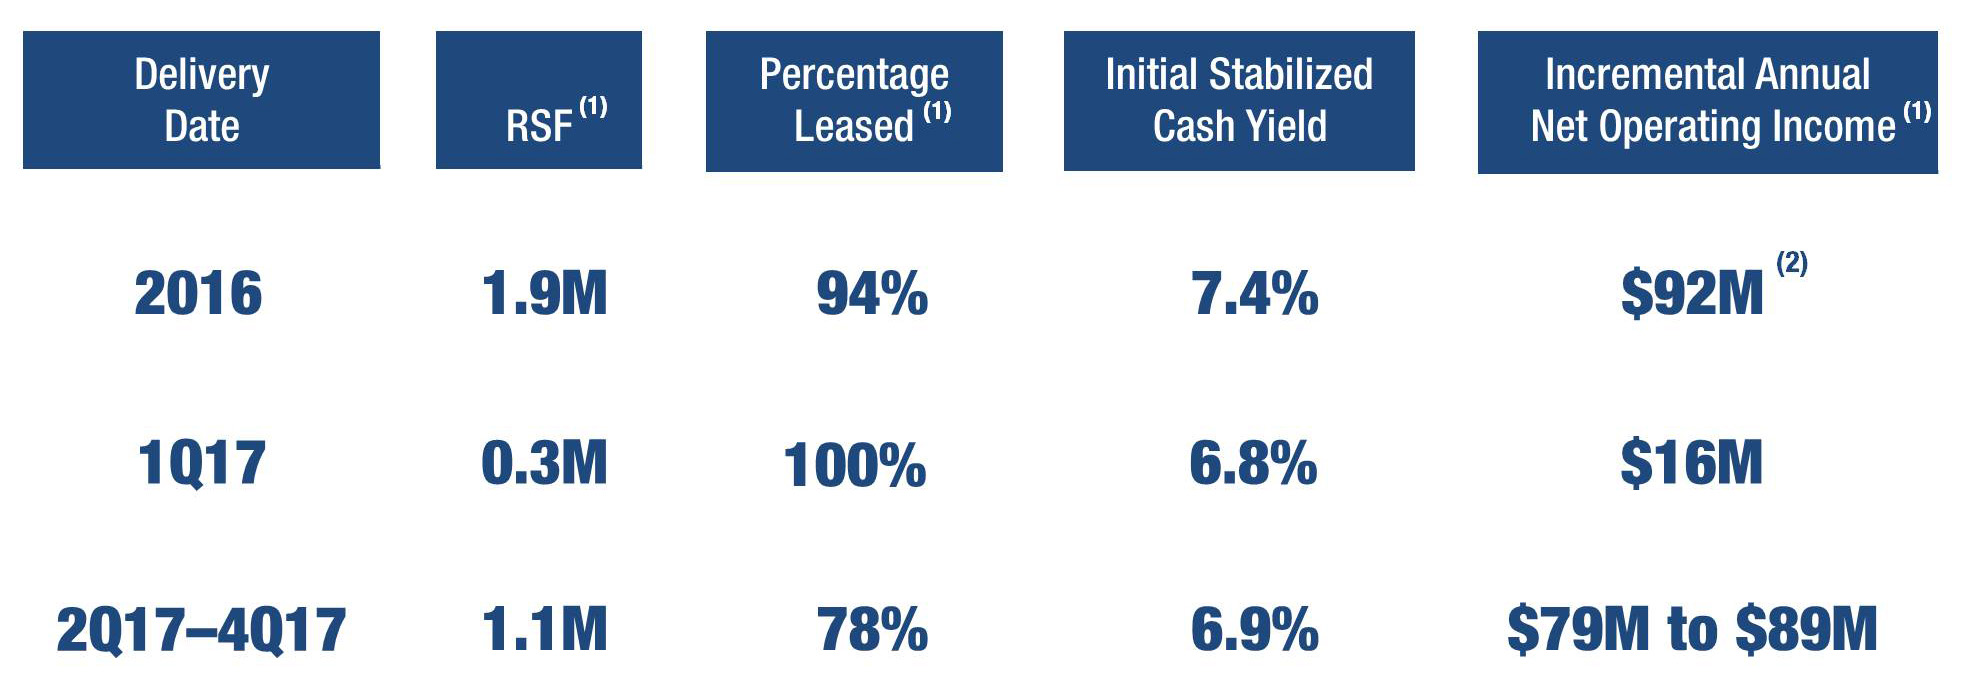
| • | Current and recent deliveries of Class A properties in our urban innovation clusters from our value-creation pipeline is expected to significantly increase net operating income: |
| Delivery Date | RSF | Percentage Leased | Incremental Annual Net Operating Income | ||||||
| 2016 | 1,893,928 | 94% | $92 million | (1) | |||||
| 1Q17 | 272,612 | 100% | $16 million | ||||||
| 2Q17–4Q17 | 1,132,505 | 78% | $79 million to $89 million | ||||||
| (1) Delivery of 2016 projects were primarily weighted toward 4Q16. | |||||||||
| • | 1Q17 key development project placed into service: 241,276 RSF, leased to Juno Therapeutics, Inc. at 400 Dexter Avenue North in our Lake Union submarket; and |
| • | Incremental contractual cash rents of $10 million per quarter, or $40 million annually, commenced in April 2017 primarily from our recently developed buildings at 75/125 Binney Street and 50 and 60 Binney Street in our Cambridge submarket. |
Increased common stock dividend
Common stock dividend for 1Q17 of $0.83 per common share, up 3 cents, or 4%, over 1Q16; continuation of our strategy to share growth in cash flows from operating activities with our stockholders while also retaining a significant portion for reinvestment.
Operating results
| 1Q17 | 1Q16 | Change | ||||||||
| Net income (loss) attributable to Alexandria’s common stockholders – diluted: | ||||||||||
| In millions | $ | 25.7 | $ | (3.8 | ) | N/A | ||||
| Per share | $ | 0.29 | $ | (0.05 | ) | N/A | ||||
| Funds from operations attributable to Alexandria’s common stockholders – diluted, as adjusted: | ||||||||||
| In millions | $ | 130.6 | $ | 97.1 | 34.5 | % | ||||
| Per share | $ | 1.48 | $ | 1.34 | 10.4 | % | ||||
Items included in net income (loss) attributable to Alexandria’s common stockholders (amounts are shown after deducting any amounts attributable to noncontrolling interests): | |||||||||||||||
| (In millions, except per share amounts) | Amount | Per Share – Diluted | |||||||||||||
| 1Q17 | 1Q16 | 1Q17 | 1Q16 | ||||||||||||
| Impairment of real estate – Asia | $ | — | $ | (29.0 | ) | $ | — | $ | (0.40 | ) | |||||
| Loss on early extinguishment of debt | (0.7 | ) | — | (0.01 | ) | — | |||||||||
| Preferred stock redemption charge | (11.3 | ) | (3.0 | ) | (0.12 | ) | (0.04 | ) | |||||||
| Total | $ | (12.0 | ) | $ | (32.0 | ) | $ | (0.13 | ) | $ | (0.44 | ) | |||
Weighted-average shares of common stock outstanding – diluted | 88.2 | 72.6 | |||||||||||||
| |
| First Quarter Ended March 31, 2017, Financial and Operating Results (continued) | |
| March 31, 2017 | |
Core operating metrics and internal growth
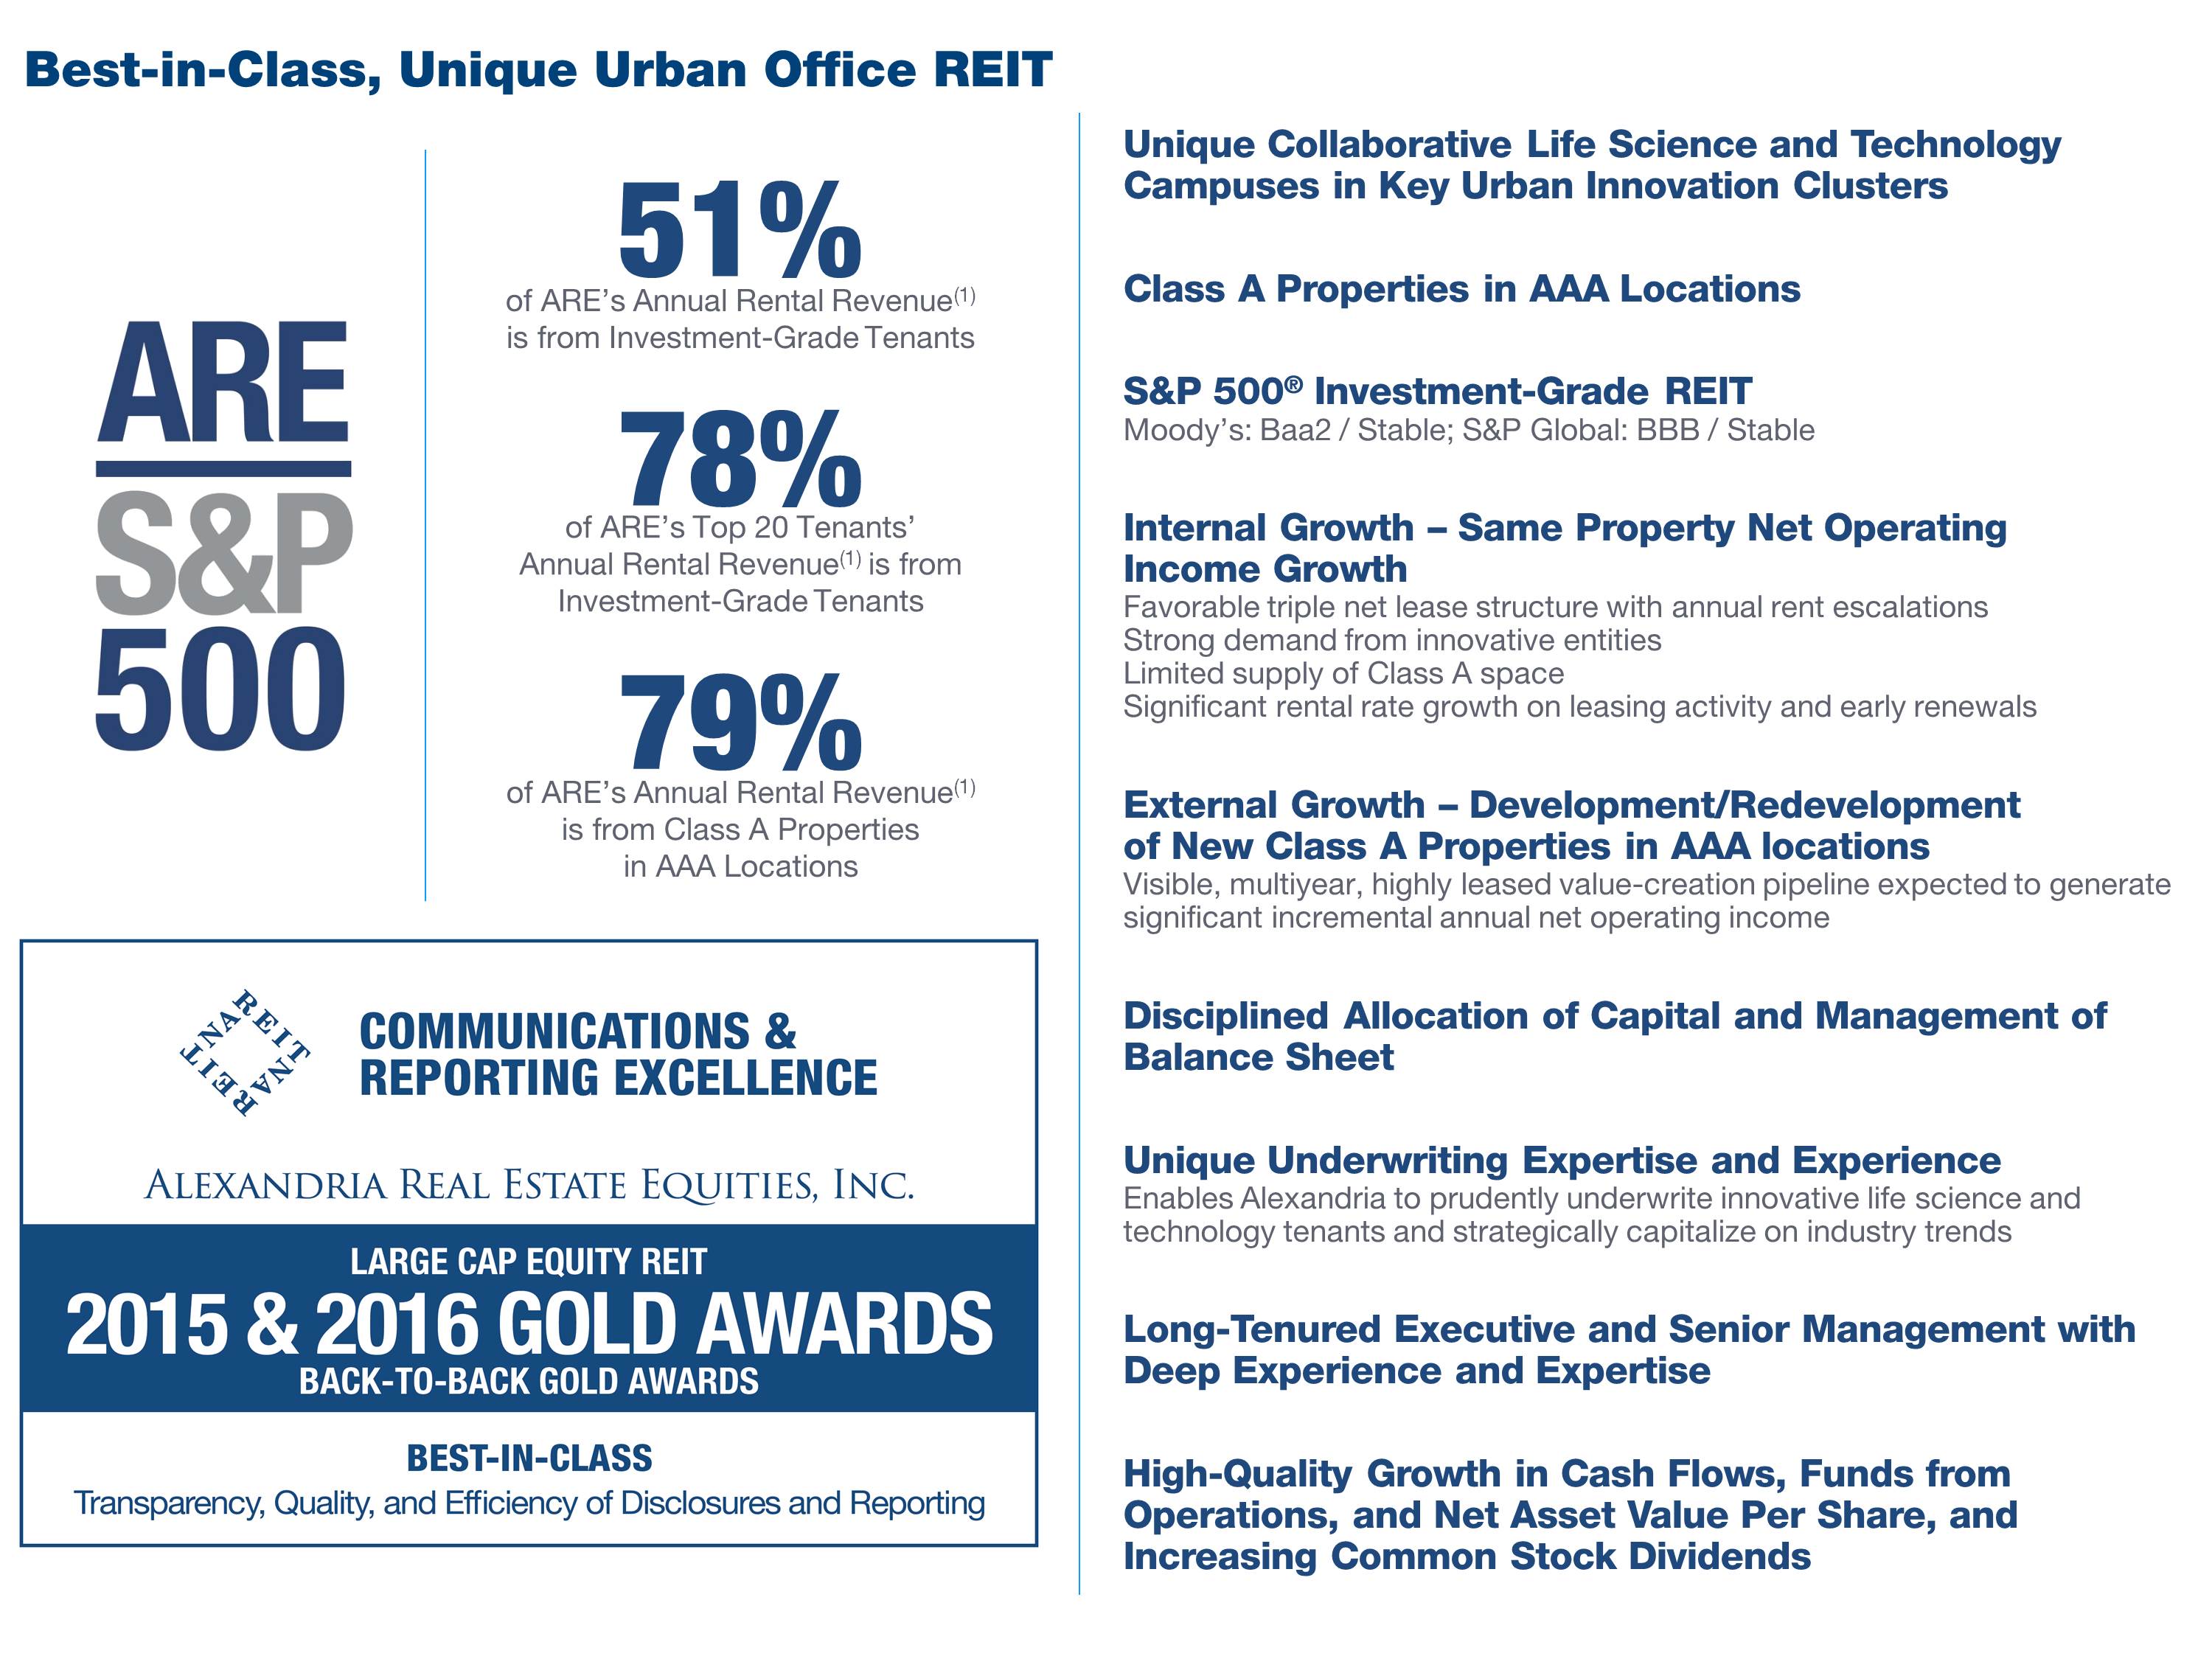
| • | Percentage of annual rental revenue in effect from investment-grade tenants as of 1Q17: 51%; |
| • | Percentage of annual rental revenue in effect from Class A properties in AAA locations as of |
1Q17: 79%;
| • | Occupancy for operating properties in North America as of 1Q17: 95.5%; a decline of 1.1% from 4Q16 primarily relating to 125,409 RSF vacated in 1Q17 by Eli Lilly and Company at 10300 Campus Point Drive located in our University Town Center submarket as they relocated and expanded into 305,006 RSF at 10290 Campus Point Drive in December 2016; |
| • | Operating margin for 1Q17: 72%; |
| • | Adjusted EBITDA margin for 1Q17: 67%; |
| • | See “Strong internal growth” in the Key highlights section on page 1 of this Earnings Press Release for information on our leasing activity, rental rate growth, and same property net operating income growth. |
External growth
Disciplined allocation of capital to visible, multiyear, highly leased value-creation pipeline
| • | See page 1 of this Earnings Press Release for key highlights |
Disciplined management of development pipeline
| • | Solid pre-leasing of 5.2 million RSF of ground-up developments that commenced since January 1, 2009: |
| • | 100% pre-leasing on 2.7 million RSF for 16 single-tenant buildings; and |
| • | 38% pre-leasing on 2.5 million RSF for nine multi-tenant buildings. |
Strategic acquisitions
| • | We completed or entered into several agreements to acquire real estate consisting primarily of land parcels and a redevelopment property aggregating 3.2 million SF across our AAA urban innovation cluster locations for an aggregate purchase price of $412.2 million; and |
| • | See page 4 of this Earnings Press Release for additional information on our completed and pending strategic acquisitions. |
Balance sheet management
| • | In February 2017, S&P Global Ratings upgraded our corporate credit rating to BBB/Stable from BBB-/Positive; |
| • | $14.5 billion total market capitalization as of 1Q17; |
| • | $2.2 billion of liquidity as of 1Q17; |
| • | Net debt to Adjusted EBITDA: |
| • | 1Q17 annualized: 5.9x; 1Q17 trailing 12 months: 6.6x; and |
| • | 4Q17 annualized target range: 5.3x to 5.8x; |
| • | Fixed-charge coverage ratio: |
| • | 1Q17 annualized: 4.1x; 1Q17 trailing 12 months: 3.8x; and |
| • | 4Q17 annualized target: greater than 4.0x; |
| • | Current and future value-creation pipeline was 11% of gross investments in real estate in North America as of 1Q17, with a 4Q17 target of less than 10%; and |
| • | 5% unhedged variable-rate debt as a percentage of total debt as of 1Q17. |
Balance sheet management (continued)
Key capital events
| • | In March 2017, we completed the offering of $425.0 million of unsecured senior notes, due in 2028, at an interest rate of 3.95% for net proceeds of $420.5 million; |
| • | In March 2017, we entered into an offering to sell an aggregate 6.9 million shares of our common stock, at a public offering price of $108.55 per share. Approximately 60% of the proceeds will fund value-creation acquisitions and construction and 40% will fund balance sheet improvements, including reduction in our projected net debt to Adjusted EBITDA – 4Q17 annualized by 0.2x, and redemption of our Series E Redeemable Preferred Stock. Aggregate net proceeds from the sale, after underwriters’ discount and issuance costs, of $713.3 million consisted of the following: |
| • | 2.1 million shares issued at closing with net proceeds of $217.8 million; and |
| • | 4.8 million shares subject to forward equity sales agreements expiring no later than March 2018 with net proceeds of $495.5 million, which will be further adjusted as provided in the sales agreements. |
| • | In March 2017, we announced the redemption of all 5.2 million outstanding shares of our Series E Redeemable Preferred Stock at a redemption price of $25.00 per share plus accrued dividends. As a result of this announcement, we reclassified the $130.0 million par value outstanding to a preferred stock redemption liability and recognized a preferred stock redemption charge of $5.5 million related to the write-off of original issuance costs. We completed the redemption on April 14, 2017; |
| • | Repurchased, in privately negotiated transactions, 501,115 shares of our 7.00% Series D cumulative convertible preferred stock for $17.9 million, or $35.79 per share, and recognized a preferred stock redemption charge of $5.8 million in 1Q17; and |
| • | In March 2017, we repaid $200 million of our 2019 Unsecured Senior Bank Term Loan, reducing the total outstanding balance from $400 million to $200 million, and recognized a loss of $670 thousand related to the write-off of unamortized loan fees. |
Corporate social responsibility/thought leadership
| • | 50% of total annual rental revenue expected from Leadership in Energy and Environmental Design (“LEED”) certified projects upon completion of in-process projects; |
| • | In January 2017, 75/125 Binney Street at Alexandria Center® at Kendall Square achieved LEED GOLD certification from the U.S. Green Building Council; |
| • | In March 2017, Alexandria and Joel S. Marcus were honored to chair the U.S. Navy SEAL Foundation’s Ninth Annual Benefit Dinner in New York City. The event raised a record-breaking $12.8 million to support the Navy SEAL Foundation’s mission-critical work providing vital services for U.S. Navy SEAL families and included support from 100% of Alexandria’s employees; |
| • | In February 2017, Alexandria convened the Alexandria Summit® – Innovate Ag 2017 in New York City. |
Subsequent events in April 2017
| • | Executed three interest rate swap agreements: |
| • | $150 million notional amount at a fixed pay rate of 1.60% effective March 29, 2018; and |
| • | $100 million notional amount at a fixed pay rate of 1.89% effective March 29, 2019. |
| |
| Incremental Annual Net Operating Income from Development and Redevelopment of New Class A Properties | |
| March 31, 2017 | |
| (1) | Represents incremental annual net operating income upon stabilization of our development and redevelopment of new Class A properties, including only our share of real estate joint venture projects. RSF and percentage leased represent 100% of each property. |
| (2) | Delivery of 2016 projects were primarily weighted toward 4Q16. |
| Acquisitions | |
| March 31, 2017 | |
| (Dollars in thousands) | |
| Submarket/Market | Property | Date of Purchase | Number of Properties | Square Footage | Purchase Price | |||||||||||||||||||
| Operating | Redevelopment | Future Development | Completed | Pending | ||||||||||||||||||||
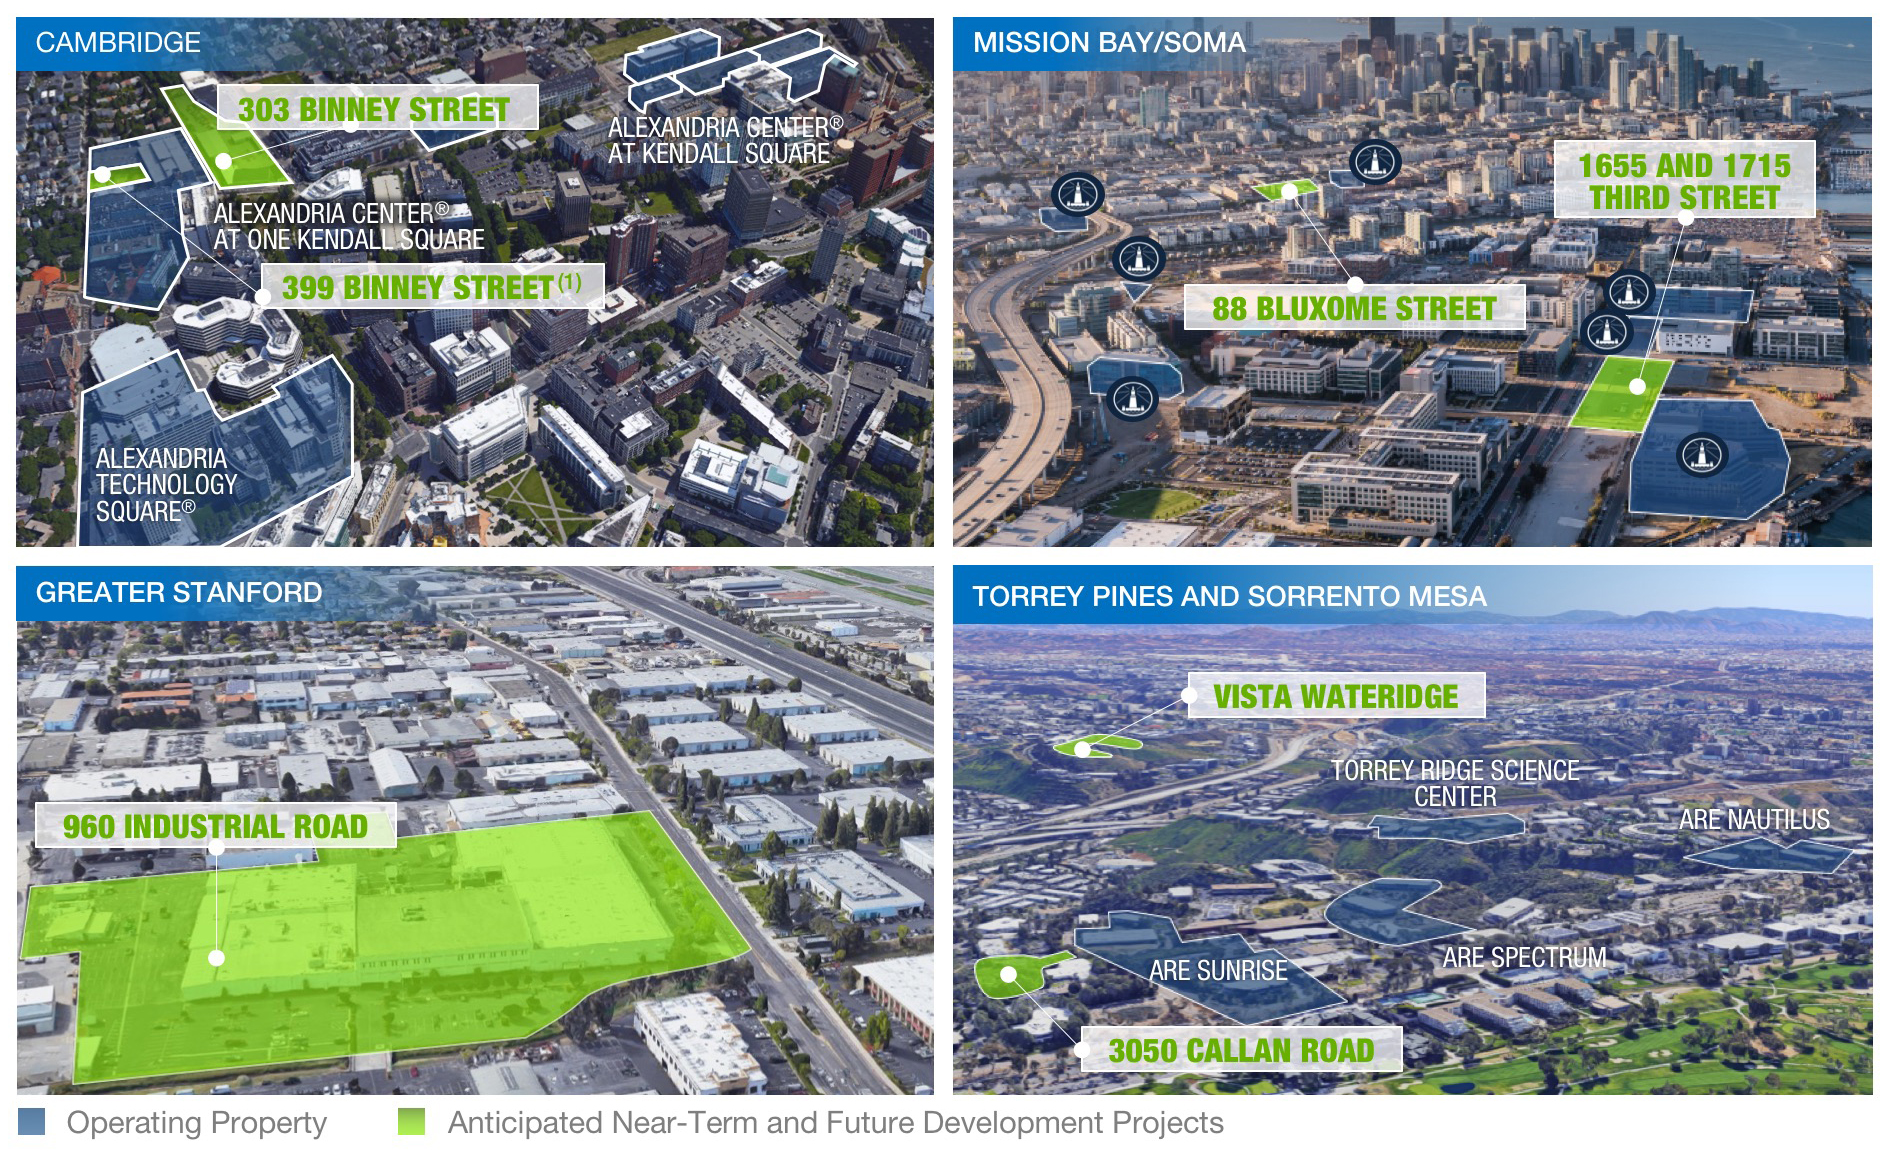
| Cambridge/Greater Boston | 303 Binney Street (1) | 3/29/17 | — | — | — | 208,965 | $ | 80,250 | $ | — | ||||||||||||||
Mission Bay/SoMa/ San Francisco | 88 Bluxome Street (2) | 1/10/17 | 1 | 232,470 | — | 1,070,925 | 130,000 | — | ||||||||||||||||
1655 and 1715 Third Street (3) (10% interest in real estate joint venture) | 1H18 | — | — | — | 580,000 | — | 35,000 | |||||||||||||||||
| Greater Stanford/San Francisco | 960 Industrial Road (4) | 2Q17 | 1 | 195,000 | — | 500,000 | — | 64,959 | ||||||||||||||||
Torrey Pines/Sorrento Mesa/ San Diego | 3050 Callan Road and Vista Wateridge | 3/24/17 | — | — | — | 229,000 | 8,250 | — | ||||||||||||||||
| Research Triangle Park/RTP | 3054 East Cornwallis Road | 2Q17 | 1 | — | 150,000 | — | — | 8,750 | ||||||||||||||||
Pending acquisition (5) | 2Q17 | — | — | — | 500,000 | — | 85,000 | |||||||||||||||||
| 3 | 427,470 | 150,000 | 3,088,890 | $ | 218,500 | $ | 193,709 | |||||||||||||||||
| $412,209 | ||||||||||||||||||||||||
| (1) | Land parcels located adjacent to our Alexandria Center® at One Kendall Square campus that are currently entitled for the development of 163,339 RSF of office or office/laboratory space and 45,626 RSF of residential space. We may seek to increase the entitlements, which may result in additional purchase price consideration. |
| (2) | We are currently pursuing entitlements for the development of two buildings aggregating 1,070,925 RSF in two phases. The existing 232,470 RSF building is operating as a leading tennis and fitness facility. The future development square footage is inclusive of the current operating RSF. |
| (3) | Executed an agreement to purchase a 10% interest in a joint venture with Uber Technologies, Inc. (“Uber”) and the Golden State Warriors. Our initial cash contribution of $35 million will be funded at closing of the joint venture in 2018. The joint venture will acquire land with completed below-grade improvements, building foundation and parking garage, and will complete vertical construction of two buildings aggregating 580,000 RSF, which will be leased to Uber. |
| (4) | Future ground-up development site with an operating component. We expect to pursue entitlements aggregating 500,000 RSF for a multi-building development. We anticipate leasing the existing property back to the seller on a short-term basis until we obtain entitlements. |
| (5) | Land parcel for the development of two buildings aggregating 500,000 RSF. Details of the pending acquisition will be disclosed in our 2Q17 Earnings Press Release and Supplemental Information. |
| Acquisitions (continued) | | |
| March 31, 2017 | ||
(1) 172,500 SF redevelopment parcel acquired in November 2016 with the acquisition of Alexandria Center® at One Kendall Square.
| Guidance | | |
| March 31, 2017 | ||
| (Dollars in millions, except per share amounts) | ||
The following updated guidance is based on our current view of existing market conditions and assumptions for the year ending December 31, 2017. There can be no assurance that actual amounts will be materially higher or lower than these expectations. See our discussion of “forward-looking statements” on page 7 of this Earnings Press Release.
| Summary of Key Changes in Guidance | As of 5/1/17 | As of 3/9/17 | Summary of Key Changes in Guidance | As of 5/1/17 | As of 3/9/17 | |||||||
| EPS, FFO per share, and FFO per share, as adjusted | See below | See below | Key sources and uses of capital | See update below | ||||||||
| Rental rate increases up 1% | 19.5% to 22.5% | 18.5% to 21.5% | Same property NOI increase up 0.5% | 2.0% to 4.0% | 1.5% to 3.5% | |||||||
| Rental rate increases (cash basis) up 1% | 7.5% to 10.5% | 6.5% to 9.5% | Capitalization of interest (1) | $48 to $58 million | $42 to $52 million | |||||||
Earnings per Share and Funds From Operations per Share Attributable to Alexandria’s Common Stockholders – Diluted | |||||||
| As of 5/1/17 | As of 3/9/17 | ||||||
| Earnings per share | $1.43 to $1.53 | $1.39 to $1.59 | |||||
| Depreciation and amortization | 4.45 | 4.45 | |||||
| Allocation to unvested restricted stock awards | (0.04) | (0.04) | |||||
| Funds from operations per share | $5.84 to $5.94 | $5.80 to $6.00 | |||||
| Add: loss on early extinguishment of debt | 0.01 | 0.01 | |||||
| Add: preferred stock redemption charge | 0.12 (2) | 0.09 | |||||
| Funds from operations per share, as adjusted | $5.97 to $6.07 | $5.90 to $6.10 | |||||
| Key Assumptions | Low | High | |||||||
| Occupancy percentage in North America as of December 31, 2017 | 96.6% | 97.2% | |||||||
| Lease renewals and re-leasing of space: | |||||||||
| Rental rate increases | 19.5% | 22.5% | |||||||
| Rental rate increases (cash basis) | 7.5% | 10.5% | |||||||
| Same property performance: | |||||||||
| Net operating income increase | 2.0% | 4.0% | |||||||
| Net operating income increase (cash basis) | 5.5% | 7.5% | |||||||
| Straight-line rent revenue | $ | 107 | $ | 112 | |||||
| General and administrative expenses | $ | 68 | $ | 73 | |||||
Capitalization of interest (1) | $ | 48 | $ | 58 | |||||
| Interest expense | $ | 131 | $ | 141 | |||||
| Key Credit Metrics | As of 5/1/17 | ||
| Net debt to Adjusted EBITDA – 4Q17 annualized | 5.3x to 5.8x | ||
| Net debt and preferred stock to Adjusted EBITDA – 4Q17 annualized | 5.3x to 5.8x | ||
| Fixed-charge coverage ratio – 4Q17 annualized | Greater than 4.0x | ||
Value-creation pipeline as a percentage of gross real estate as of December 31, 2017 | Less than 10% | ||
| Key Sources and Uses of Capital | Range | Midpoint | |||||||||||
| Sources of capital: | |||||||||||||
| Net cash provided by operating activities after dividends | $ | 115 | $ | 135 | $ | 125 | |||||||
| Incremental debt | 300 | 280 | 290 | ||||||||||
| Real estate dispositions and common equity | 970 | 1,240 | 1,105 | (3)(4) | |||||||||
| Total sources of capital | $ | 1,385 | $ | 1,655 | $ | 1,520 | |||||||
| Uses of capital: | |||||||||||||
| Construction | $ | 815 | $ | 915 | $ | 865 | |||||||
| Acquisitions | 380 | 480 | 430 | (4) | |||||||||
| 7.00% Series D convertible preferred stock repurchases | 60 | 130 | 95 | ||||||||||
| 6.45% Series E redeemable preferred stock redemption | 130 | 130 | 130 | ||||||||||
| Total uses of capital | $ | 1,385 | $ | 1,655 | $ | 1,520 | |||||||
| Incremental debt (included above): | |||||||||||||
| Issuance of unsecured senior notes payable | $ | 425 | $ | 425 | $ | 425 | |||||||
| Borrowings – secured construction loans | 200 | 250 | 225 | ||||||||||
| Repayments of secured notes payable | (5 | ) | (10 | ) | (8 | ) | |||||||
| Repayment of unsecured senior term loan | (200 | ) | (200 | ) | (200 | ) | |||||||
| $1.65 billion unsecured senior line of credit/other | (120 | ) | (185 | ) | (152 | ) | |||||||
| Incremental debt | $ | 300 | $ | 280 | $ | 290 | |||||||
| (1) | Increased from a range from $42 million to $52 million to a range from $48 million to $58 million to reflect capitalization of interest related to the completed and projected acquisitions of 303 Binney Street, 3054 East Cornwallis Road, 3050 Callan Road, Vista Wateridge, and a pending acquisition of a land parcel. See “Acquisitions” on page 4 of this Earnings Press Release for additional information. There was no change in our guidance for interest expense. |
| (2) | Includes charges aggregating $5.8 million related to the repurchases of 501,115 outstanding shares of our Series D Convertible Preferred Stock in 1Q17 and $5.5 million related to the redemption of our Series E Redeemable Preferred Stock in April 2017. Excludes any charges related to future repurchases of our Series D Convertible Preferred Stock. |
| (3) | Includes the public offering of 6.9 million shares of our common stock in March 2017, of which 4.8 million shares are subject to forward equity sales agreements, with anticipated aggregate net proceeds of $713.3 million, subject to adjustments as provided in the forward equity sales agreements. Also includes our share of the proceeds from the anticipated sale of a condominium interest in 203,090 RSF of our unconsolidated real estate joint venture property at 360 Longwood Avenue, aggregating approximately $65.7 million, pursuant to the exercise of a purchase option by the anchor tenant. The sale is expected to close in July 2017. |
| (4) | Increase since March 9, 2017, is related to the pending $85.0 million acquisition of a land parcel for the development of 500,000 RSF of new Class A properties. Also includes remaining purchase price of $56.8 million related to the acquisition of the remaining 49% interest in our unconsolidated real estate joint venture with Uber completed in November 2016. This amount will be paid in three equal installments in 2017, upon Uber’s completion of construction milestones. See “Acquisitions” on page 4 of this Earnings Press Release for additional information. |
| |
| Earnings Call Information and About the Company | |
| March 31, 2017 | |
We will host a conference call on Tuesday, May 2, 2017, at 3:00 p.m. Eastern Time (“ET”)/noon Pacific Time (“PT”), which is open to the general public to discuss our financial and operating results for the first quarter ended March 31, 2017. To participate in this conference call, dial (866) 524-3160 or (412) 317-6760 shortly before 3:00 p.m. ET/noon PT and ask the operator to join the Alexandria Real Estate Equities, Inc. call. The audio webcast can be accessed at www.are.com, in the “For Investors” section. A replay of the call will be available for a limited time from 5:00 p.m. ET/2:00 p.m. PT on Tuesday, May 2, 2017. The replay number is (877) 344-7529 or (412) 317-0088, and the confirmation code is 10102394.
Additionally, a copy of this Earnings Press Release and Supplemental Information for the first quarter ended March 31, 2017, is available in the “For Investors” section of our website at www.are.com or by following this link: http://www.are.com/fs/2017q1.pdf.
For any questions, please contact Joel S. Marcus, chairman, chief executive officer, and founder, at (626) 578-9693 or Dean A. Shigenaga, executive vice president, chief financial officer, and treasurer, at (626) 578-0777.
About the Company
Alexandria Real Estate Equities, Inc. (NYSE:ARE), an S&P 500® company, is an urban office real estate investment trust (“REIT”) uniquely focused on collaborative life science and technology campuses in AAA innovation cluster locations, with a total market capitalization of $14.5 billion and an asset base in North America of 28.2 million square feet, as of March 31, 2017. The asset base in North America includes 20.1 million RSF of operating properties, including 1.6 million RSF of development and redevelopment of new Class A properties currently undergoing construction. Additionally, the asset base in North America includes 8.1 million SF of future development projects, including 1.5 million SF of near-term projects undergoing marketing for lease and preconstruction activities and 2.0 million SF of other near-term development projects. Founded in 1994, Alexandria pioneered this niche and has since established a significant market presence in key locations, including Greater Boston, San Francisco, New York City, San Diego, Seattle, Maryland, and Research Triangle Park. Alexandria has a longstanding and proven track record of developing Class A properties clustered in urban life science and technology campuses that provide its innovative tenants with highly dynamic and collaborative environments that enhance their ability to successfully recruit and retain world-class talent and inspire productivity, efficiency, creativity, and success. We believe these advantages result in higher occupancy levels, longer lease terms, higher rental income, higher returns, and greater long-term asset value. For additional information on Alexandria, please visit www.are.com.
***********
This document includes “forward-looking statements” within the meaning of Section 27A of the Securities Act of 1933, as amended, and Section 21E of the Securities Exchange Act of 1934, as amended. Such forward-looking statements include, without limitation, statements regarding our 2017 earnings per share attributable to Alexandria’s common stockholders – diluted, 2017 funds from operations per share attributable to Alexandria’s common stockholders – diluted, net operating income, and our projected sources and uses of capital. You can identify the forward-looking statements by their use of forward-looking words, such as “forecast,” “guidance,” “projects,” “estimates,” “anticipates,” “believes,” “expects,” “intends,” “may,” “plans,” “seeks,” “should,” or “will,” or the negative of those words or similar words. These forward-looking statements are based on our current expectations, beliefs, projections, future plans and strategies, anticipated events or trends, and similar expressions concerning matters that are not historical facts, as well as a number of assumptions concerning future events. There can be no assurance that actual results will not be materially higher or lower than these expectations. These statements are subject to risks, uncertainties, assumptions, and other important factors that could cause actual results to differ materially from the results discussed in the forward-looking statements. Factors that might cause such a difference include, without limitation, our failure to obtain capital (debt, construction financing, and/or equity) or refinance debt maturities, increased interest rates and operating costs, adverse economic or real estate developments in our markets, our failure to successfully place into service and lease any properties undergoing development or redevelopment and our existing space held for future development or redevelopment (including new properties acquired for that purpose), our failure to successfully operate or lease acquired properties, decreased rental rates, increased vacancy rates or failure to renew or replace expiring leases, defaults on or non-renewal of leases by tenants, adverse general and local economic conditions, an unfavorable capital market environment, decreased leasing activity or lease renewals, and other risks and uncertainties detailed in our filings with the Securities and Exchange Commission (“SEC”). Accordingly, you are cautioned not to place undue reliance on such forward-looking statements. All forward-looking statements are made as of the date of this earnings press release, and unless otherwise stated, we assume no obligation to update this information and expressly disclaim any obligation to update or revise any forward-looking statements, whether as a result of new information, future events, or otherwise. For more discussion relating to risks and uncertainties that could cause actual results to differ materially from those anticipated in our forward-looking statements, and risks to our business in general, please refer to our SEC filings, including our most recent annual report on Form 10-K and any subsequent quarterly reports on Form 10-Q.
| Consolidated Statements of Income | |
| March 31, 2017 | |
| (In thousands, except per share amounts) | |
| Three Months Ended | ||||||||||||||||||||
| 3/31/17 | 12/31/16 | 9/30/16 | 6/30/16 | 3/31/16 | ||||||||||||||||
| Revenues: | ||||||||||||||||||||
| Rental | $ | 207,193 | $ | 187,315 | $ | 166,591 | $ | 161,638 | $ | 158,276 | ||||||||||
| Tenant recoveries | 61,346 | 58,270 | 58,681 | 54,107 | 52,597 | |||||||||||||||
| Other income | 2,338 | 3,577 | 5,107 | 10,331 | 5,216 | |||||||||||||||
| Total revenues | 270,877 | 249,162 | 230,379 | 226,076 | 216,089 | |||||||||||||||
| Expenses: | ||||||||||||||||||||
| Rental operations | 77,087 | 73,244 | 72,002 | 67,325 | 65,837 | |||||||||||||||
| General and administrative | 19,229 | 17,458 | 15,854 | 15,384 | 15,188 | |||||||||||||||
| Interest | 29,784 | 31,223 | 25,850 | 25,025 | 24,855 | |||||||||||||||
| Depreciation and amortization | 97,183 | 95,222 | 77,133 | 70,169 | 70,866 | |||||||||||||||
| Impairment of real estate | — | 16,024 | 8,114 | 156,143 | 28,980 | |||||||||||||||
| Loss on early extinguishment of debt | 670 | — | 3,230 | — | — | |||||||||||||||
| Total expenses | 223,953 | 233,171 | 202,183 | 334,046 | 205,726 | |||||||||||||||
| Equity in earnings (losses) of unconsolidated real estate joint ventures | 361 | 86 | 273 | (146 | ) | (397 | ) | |||||||||||||
| Gain on sales of real estate – rental properties | 270 | 3,715 | — | — | — | |||||||||||||||
| Income (loss) from continuing operations | 47,555 | 19,792 | 28,469 | (108,116 | ) | 9,966 | ||||||||||||||
| Gain on sales of real estate – land parcels | — | — | 90 | — | — | |||||||||||||||
| Net income (loss) | 47,555 | 19,792 | 28,559 | (108,116 | ) | 9,966 | ||||||||||||||
| Net income attributable to noncontrolling interests | (5,844 | ) | (4,488 | ) | (4,084 | ) | (3,500 | ) | (4,030 | ) | ||||||||||
| Net income (loss) attributable to Alexandria Real Estate Equities, Inc.’s stockholders | 41,711 | 15,304 | 24,475 | (111,616 | ) | 5,936 | ||||||||||||||
| Dividends on preferred stock | (3,784 | ) | (3,835 | ) | (5,007 | ) | (5,474 | ) | (5,907 | ) | ||||||||||
| Preferred stock redemption charge | (11,279 | ) | (35,653 | ) | (13,095 | ) | (9,473 | ) | (3,046 | ) | ||||||||||
| Net income attributable to unvested restricted stock awards | (987 | ) | (943 | ) | (921 | ) | (1,085 | ) | (801 | ) | ||||||||||
| Net income (loss) attributable to Alexandria Real Estate Equities, Inc.’s common stockholders | $ | 25,661 | $ | (25,127 | ) | $ | 5,452 | $ | (127,648 | ) | $ | (3,818 | ) | |||||||
| Net income (loss) per share attributable to Alexandria Real Estate Equities, Inc.’s common stockholders – basic and diluted | $ | 0.29 | $ | (0.31 | ) | $ | 0.07 | $ | (1.72 | ) | $ | (0.05 | ) | |||||||
| Weighted-average shares of common stock outstanding: | ||||||||||||||||||||
| Basic | 88,147 | 80,800 | 76,651 | 74,319 | 72,584 | |||||||||||||||
| Diluted | 88,200 | 80,800 | 77,402 | 74,319 | 72,584 | |||||||||||||||
| Dividends declared per share of common stock | $ | 0.83 | $ | 0.83 | $ | 0.80 | $ | 0.80 | $ | 0.80 | ||||||||||
| Consolidated Balance Sheets | |
| March 31, 2017 | |
| (In thousands) | |
| 3/31/17 | 12/31/16 | 9/30/16 | 6/30/16 | 3/31/16 | ||||||||||||||||
| Assets | ||||||||||||||||||||
| Investments in real estate | $ | 9,470,667 | $ | 9,077,972 | $ | 7,939,179 | $ | 7,774,608 | $ | 7,741,466 | ||||||||||
| Investments in unconsolidated real estate joint ventures | 50,457 | 50,221 | 133,580 | 132,433 | 127,165 | |||||||||||||||
| Cash and cash equivalents | 151,209 | 125,032 | 157,928 | 256,000 | 146,197 | |||||||||||||||
| Restricted cash | 18,320 | 16,334 | 16,406 | 13,131 | 14,885 | |||||||||||||||
| Tenant receivables | 9,979 | 9,744 | 9,635 | 9,196 | 9,979 | |||||||||||||||
| Deferred rent | 364,348 | 335,974 | 318,286 | 303,379 | 293,144 | |||||||||||||||
| Deferred leasing costs | 202,613 | 195,937 | 191,765 | 191,619 | 192,418 | |||||||||||||||
| Investments | 394,471 | 342,477 | 320,989 | 360,050 | 316,163 | |||||||||||||||
| Other assets | 206,562 | 201,197 | 206,133 | 104,414 | 130,115 | |||||||||||||||
| Total assets | $ | 10,868,626 | $ | 10,354,888 | $ | 9,293,901 | $ | 9,144,830 | $ | 8,971,532 | ||||||||||
| Liabilities, Noncontrolling Interests, and Equity | ||||||||||||||||||||
| Secured notes payable | $ | 1,083,758 | $ | 1,011,292 | $ | 789,450 | $ | 722,794 | $ | 816,578 | ||||||||||
| Unsecured senior notes payable | 2,799,508 | 2,378,262 | 2,377,482 | 2,376,713 | 2,031,284 | |||||||||||||||
| Unsecured senior line of credit | — | 28,000 | 416,000 | 72,000 | 299,000 | |||||||||||||||
| Unsecured senior bank term loans | 547,420 | 746,471 | 746,162 | 945,030 | 944,637 | |||||||||||||||
| Accounts payable, accrued expenses, and tenant security deposits | 782,637 | 731,671 | 605,181 | 593,628 | 628,467 | |||||||||||||||
| Dividends payable | 78,976 | 76,914 | 66,705 | 67,188 | 64,275 | |||||||||||||||
| Preferred stock redemption liability | 130,000 | — | — | — | — | |||||||||||||||
| Total liabilities | 5,422,299 | 4,972,610 | 5,000,980 | 4,777,353 | 4,784,241 | |||||||||||||||
| Commitments and contingencies | ||||||||||||||||||||
| Redeemable noncontrolling interests | 11,320 | 11,307 | 9,012 | 9,218 | 14,218 | |||||||||||||||
| Alexandria Real Estate Equities, Inc.’s stockholders’ equity: | ||||||||||||||||||||
| 7.00% Series D cumulative convertible preferred stock | 74,386 | 86,914 | 161,792 | 188,864 | 213,864 | |||||||||||||||
| 6.45% Series E cumulative redeemable preferred stock | — | 130,000 | 130,000 | 130,000 | 130,000 | |||||||||||||||
| Common stock | 899 | 877 | 768 | 766 | 729 | |||||||||||||||
| Additional paid-in capital | 4,855,686 | 4,672,650 | 3,649,263 | 3,693,807 | 3,529,660 | |||||||||||||||
| Accumulated other comprehensive income (loss) | 21,460 | 5,355 | (31,745 | ) | 8,272 | (8,533 | ) | |||||||||||||
| Alexandria Real Estate Equities, Inc.’s stockholders’ equity | 4,952,431 | 4,895,796 | 3,910,078 | 4,021,709 | 3,865,720 | |||||||||||||||
| Noncontrolling interests | 482,576 | 475,175 | 373,831 | 336,550 | 307,353 | |||||||||||||||
| Total equity | 5,435,007 | 5,370,971 | 4,283,909 | 4,358,259 | 4,173,073 | |||||||||||||||
| Total liabilities, noncontrolling interests, and equity | $ | 10,868,626 | $ | 10,354,888 | $ | 9,293,901 | $ | 9,144,830 | $ | 8,971,532 | ||||||||||
| Funds From Operations and Funds From Operations per Share | |
| March 31, 2017 | |
| (In thousands, except per share amounts) | |
The following tables present a reconciliation of net income (loss) attributable to Alexandria’s common stockholders – basic, the most directly comparable financial measure presented in accordance with generally accepted accounting principles (“GAAP”), including our share of amounts from consolidated and unconsolidated real estate joint ventures, to funds from operations attributable to Alexandria’s common stockholders – diluted, and funds from operations attributable to Alexandria’s common stockholders – diluted, as adjusted, and related per share amounts. Amounts allocable to unvested restricted stock awards are not material and are not presented separately within the per share table below. Per share amounts may not add due to rounding.
| Three Months Ended | ||||||||||||||||||||
| 3/31/17 | 12/31/16 | 9/30/16 | 6/30/16 | 3/31/16 | ||||||||||||||||
| Net income (loss) attributable to Alexandria’s common stockholders | $ | 25,661 | $ | (25,127 | ) | $ | 5,452 | $ | (127,648 | ) | $ | (3,818 | ) | |||||||
| Depreciation and amortization | 97,183 | 95,222 | 77,133 | 70,169 | 70,866 | |||||||||||||||
| Noncontrolling share of depreciation and amortization from consolidated real estate JVs | (3,642 | ) | (2,598 | ) | (2,224 | ) | (2,226 | ) | (2,301 | ) | ||||||||||
| Our share of depreciation and amortization from unconsolidated real estate JVs | 412 | 655 | 658 | 651 | 743 | |||||||||||||||
| Gain on sales of real estate – rental properties | (270 | ) | (3,715 | ) | — | — | — | |||||||||||||
| Gain on sales of real estate – land parcels | — | — | (90 | ) | — | — | ||||||||||||||
| Impairment of real estate – rental properties | — | 3,506 | 6,293 | 88,395 | — | |||||||||||||||
| Allocation to unvested restricted stock awards | (561 | ) | — | (438 | ) | — | (80 | ) | ||||||||||||
Funds from operations attributable to Alexandria’s common stockholders – basic and diluted (1) | 118,783 | 67,943 | 86,784 | 29,341 | 65,410 | |||||||||||||||
| Non-real estate investment income | — | — | — | (4,361 | ) | — | ||||||||||||||
| Impairment of land parcels and non-real estate investments | — | 12,511 | 4,886 | 67,162 | 28,980 | |||||||||||||||
| Loss on early extinguishment of debt | 670 | — | 3,230 | — | — | |||||||||||||||
| Preferred stock redemption charge | 11,279 | 35,653 | 13,095 | 9,473 | 3,046 | |||||||||||||||
| Allocation to unvested restricted stock awards | (150 | ) | (605 | ) | (359 | ) | (530 | ) | (358 | ) | ||||||||||
| Funds from operations attributable to Alexandria’s common stockholders – diluted, as adjusted | $ | 130,582 | $ | 115,502 | $ | 107,636 | $ | 101,085 | $ | 97,078 | ||||||||||
| Net income (loss) per share attributable to Alexandria’s common stockholders | $ | 0.29 | $ | (0.31 | ) | $ | 0.07 | $ | (1.72 | ) | $ | (0.05 | ) | |||||||
Depreciation and amortization | 1.06 | 1.15 | 0.97 | 0.92 | 0.95 | |||||||||||||||
| Gain on sales of real estate – rental properties | — | (0.05 | ) | — | — | — | ||||||||||||||
| Impairment of real estate – rental properties | — | 0.05 | 0.08 | 1.19 | — | |||||||||||||||
Funds from operations per share attributable to Alexandria’s common stockholders – basic and diluted (1) | 1.35 | 0.84 | 1.12 | 0.39 | 0.90 | |||||||||||||||
| Non-real estate investment income | — | — | — | (0.06 | ) | — | ||||||||||||||
| Impairment of land parcels and non-real estate investments | — | 0.15 | 0.06 | 0.90 | 0.40 | |||||||||||||||
| Loss on early extinguishment of debt | 0.01 | — | 0.04 | — | — | |||||||||||||||
| Preferred stock redemption charge | 0.12 | 0.43 | 0.17 | 0.13 | 0.04 | |||||||||||||||
Funds from operations per share attributable to Alexandria’s common stockholders – diluted, as adjusted | $ | 1.48 | $ | 1.42 | $ | 1.39 | $ | 1.36 | $ | 1.34 | ||||||||||
| Weighted-average shares of common stock outstanding for calculating funds from operations per share and funds from operations, as adjusted, per share – diluted | 88,200 | 81,280 | 77,402 | 74,319 | 72,584 | |||||||||||||||
| (1) | Calculated in accordance with standards established by the Advisory Board of Governors of the National Association of Real Estate Investment Trusts (the “NAREIT Board of Governors”) in its April 2002 White Paper and related implementation guidance. |
SUPPLEMENTAL
INFORMATION
| |
| Company Profile | |
| March 31, 2017 | |
Alexandria Real Estate Equities, Inc. (NYSE:ARE), an S&P 500® company, is an urban office REIT uniquely focused on collaborative life science and technology campuses in AAA innovation cluster locations, with a total market capitalization of $14.5 billion and an asset base in North America of 28.2 million square feet, as of March 31, 2017. The asset base in North America includes 20.1 million RSF of operating properties, including 1.6 million RSF of development and redevelopment of new Class A properties currently undergoing construction. Additionally, the asset base in North America includes 8.1 million SF of future development projects, including 1.5 million SF of near-term projects undergoing marketing for lease and preconstruction activities and 2.0 million SF of other near-term development projects. Founded in 1994, Alexandria pioneered this niche and has since established a significant market presence in key locations, including Greater Boston, San Francisco, New York City, San Diego, Seattle, Maryland, and Research Triangle Park. Alexandria has a longstanding and proven track record of developing Class A properties clustered in urban life science and technology campuses that provide its innovative tenants with highly dynamic and collaborative environments that enhance their ability to successfully recruit and retain world-class talent and inspire productivity, efficiency, creativity, and success. We believe these advantages result in higher occupancy levels, longer lease terms, higher rental income, higher returns, and greater long-term asset value. For additional information on Alexandria, please visit www.are.com.
Tenant base
Alexandria is known for our high-quality and diverse tenant base, with 51% of our annual rental revenue generated from investment grade tenants. The impressive quality, diversity, breadth, and depth of our significant relationships with our tenants provide Alexandria with high-quality and stable cash flows. Alexandria’s underwriting team and long-term industry relationships positively distinguish us from all other publicly traded REITs and real estate companies.
Executive and senior management team
Alexandria’s executive and senior management team has unique experience and expertise in creating highly dynamic and collaborative campuses in key urban life science and technology cluster locations that inspire innovation. From the development of high-quality, sustainable real estate, to the ongoing cultivation of collaborative environments with unique amenities and events, the Alexandria team has a first-in-class reputation of excellence in its niche. Alexandria’s highly experienced management team also includes regional market directors with leading reputations and longstanding relationships within the life science and technology communities in their respective urban innovation clusters. We believe that our expertise, experience, reputation, and key relationships with the real estate, life science, and technology industries provide Alexandria significant competitive advantages in attracting new business opportunities.
Alexandria’s executive and senior management team consists of 28 individuals, averaging more than 26 years of real estate experience, including more than 13 years with Alexandria.
| EXECUTIVE MANAGEMENT TEAM |
| Joel S. Marcus |
Chairman, Chief Executive Officer & Founder |
| Dean A. Shigenaga |
Executive Vice President Chief Financial Officer & Treasurer |
| Thomas J. Andrews |
Executive Vice President Regional Market Director – Greater Boston |
| Jennifer J. Banks |
Executive Vice President General Counsel & Corporate Secretary |
| Vincent R. Ciruzzi |
| Chief Development Officer |
| Peter M. Moglia |
| Chief Investment Officer |
| Stephen A. Richardson |
Chief Operating Officer & Regional Market Director – San Francisco |
| Daniel J. Ryan |
Executive Vice President Regional Market Director – San Diego & Strategic Operations |
| |
| Investor Information | |
| March 31, 2017 | |
| Corporate Headquarters | New York Stock Exchange Trading Symbols | Information Requests | |||
| 385 East Colorado Boulevard, Suite 299 | Common stock: ARE | Phone: | (626) 396-4828 | ||
| Pasadena, California 91101 | 7.00% Series D preferred stock: ARE PRD | Email: | corporateinformation@are.com | ||
| Web: | www.are.com | ||||
| Equity Research Coverage |
| Alexandria is currently covered by the following research analysts. This list may not be complete and is subject to change as firms initiate or discontinue coverage of our company. Please note that any opinions, estimates, or forecasts regarding our historical or predicted performance made by these analysts are theirs alone and do not represent opinions, estimates, or forecasts of Alexandria or its management. Alexandria does not by its reference or distribution of the information below imply its endorsement of or concurrence with any opinions, estimates, or forecasts of these analysts. Interested persons may obtain copies of analysts’ reports on their own as we do not distribute these reports. Several of these firms may, from time to time, own our stock and/or hold other long or short positions in our stock and may provide compensated services to us. |
| Bank of America Merrill Lynch | Citigroup Global Markets Inc. | J.P. Morgan Securities LLC | Robert W. Baird & Co. Incorporated | |||
| Jamie Feldman / Jeffrey Spector | Michael Bilerman / Emmanuel Korchman | Anthony Paolone / Gene Nusinzon | David Rodgers / Richard Schiller | |||
| (646) 855-5808 / (646) 855-1363 | (212) 816-1383 / (212) 816-1382 | (212) 622-6682 / (212) 622-1041 | (216) 737-7341 / (312) 609-5485 | |||
| Barclays Capital Inc. | Evercore ISI | Mitsubishi UFJ Securities (USA), Inc. | UBS Securities LLC | |||
| Ross Smotrich / Linda Tsai | Sheila McGrath / Nathan Crossett | Karin Ford / Ryan Cybart | Nick Yulico / Frank Lee | |||
| (212) 526-2306 / (212) 526-9937 | (212) 497-0882 / (212) 497-0870 | (212) 405-7349 / (212) 405-6591 | (212) 713-3402 / (415) 352-5679 | |||
| BTIG, LLC | Green Street Advisors, Inc. | Mizuho Securities USA Inc. | ||||
| Thomas Catherwood / James Sullivan | Jed Reagan / Daniel Ismail | Richard Anderson / Zachary Silverberg | ||||
| (212) 738-6140 / (212) 738-6139 | (949) 640-8780 / (949) 640-8780 | (212) 205-8445 / (212) 205-7855 | ||||
| CFRA | JMP Securities – JMP Group, Inc. | RBC Capital Markets | ||||
| Kenneth Leon | Peter Martin / Brian Riley | Michael Carroll / Brian Hawthorne | ||||
| (212) 438-4638 | (415) 835-8904 / (415) 835-8908 | (440) 715-2649 / (440) 715-2653 | ||||
| Rating Agencies | ||
| Moody’s Investors Service | S&P Global Ratings | |
| Philip Kibel / Reed Valutas | Fernanda Hernandez / Anita Ogbara | |
| (212) 553-4402 / (212) 553-4169 | (212) 438-1347 / (212) 438-5077 | |
| |
| High-Quality, Diversified, and Innovative Tenants | |
| March 31, 2017 | |
Cash Flows from High-Quality, Diversified, and Innovative Tenants
| Investment-Grade Tenants | Tenant Mix by Annual Rental Revenue(1) | ||
| 51% | 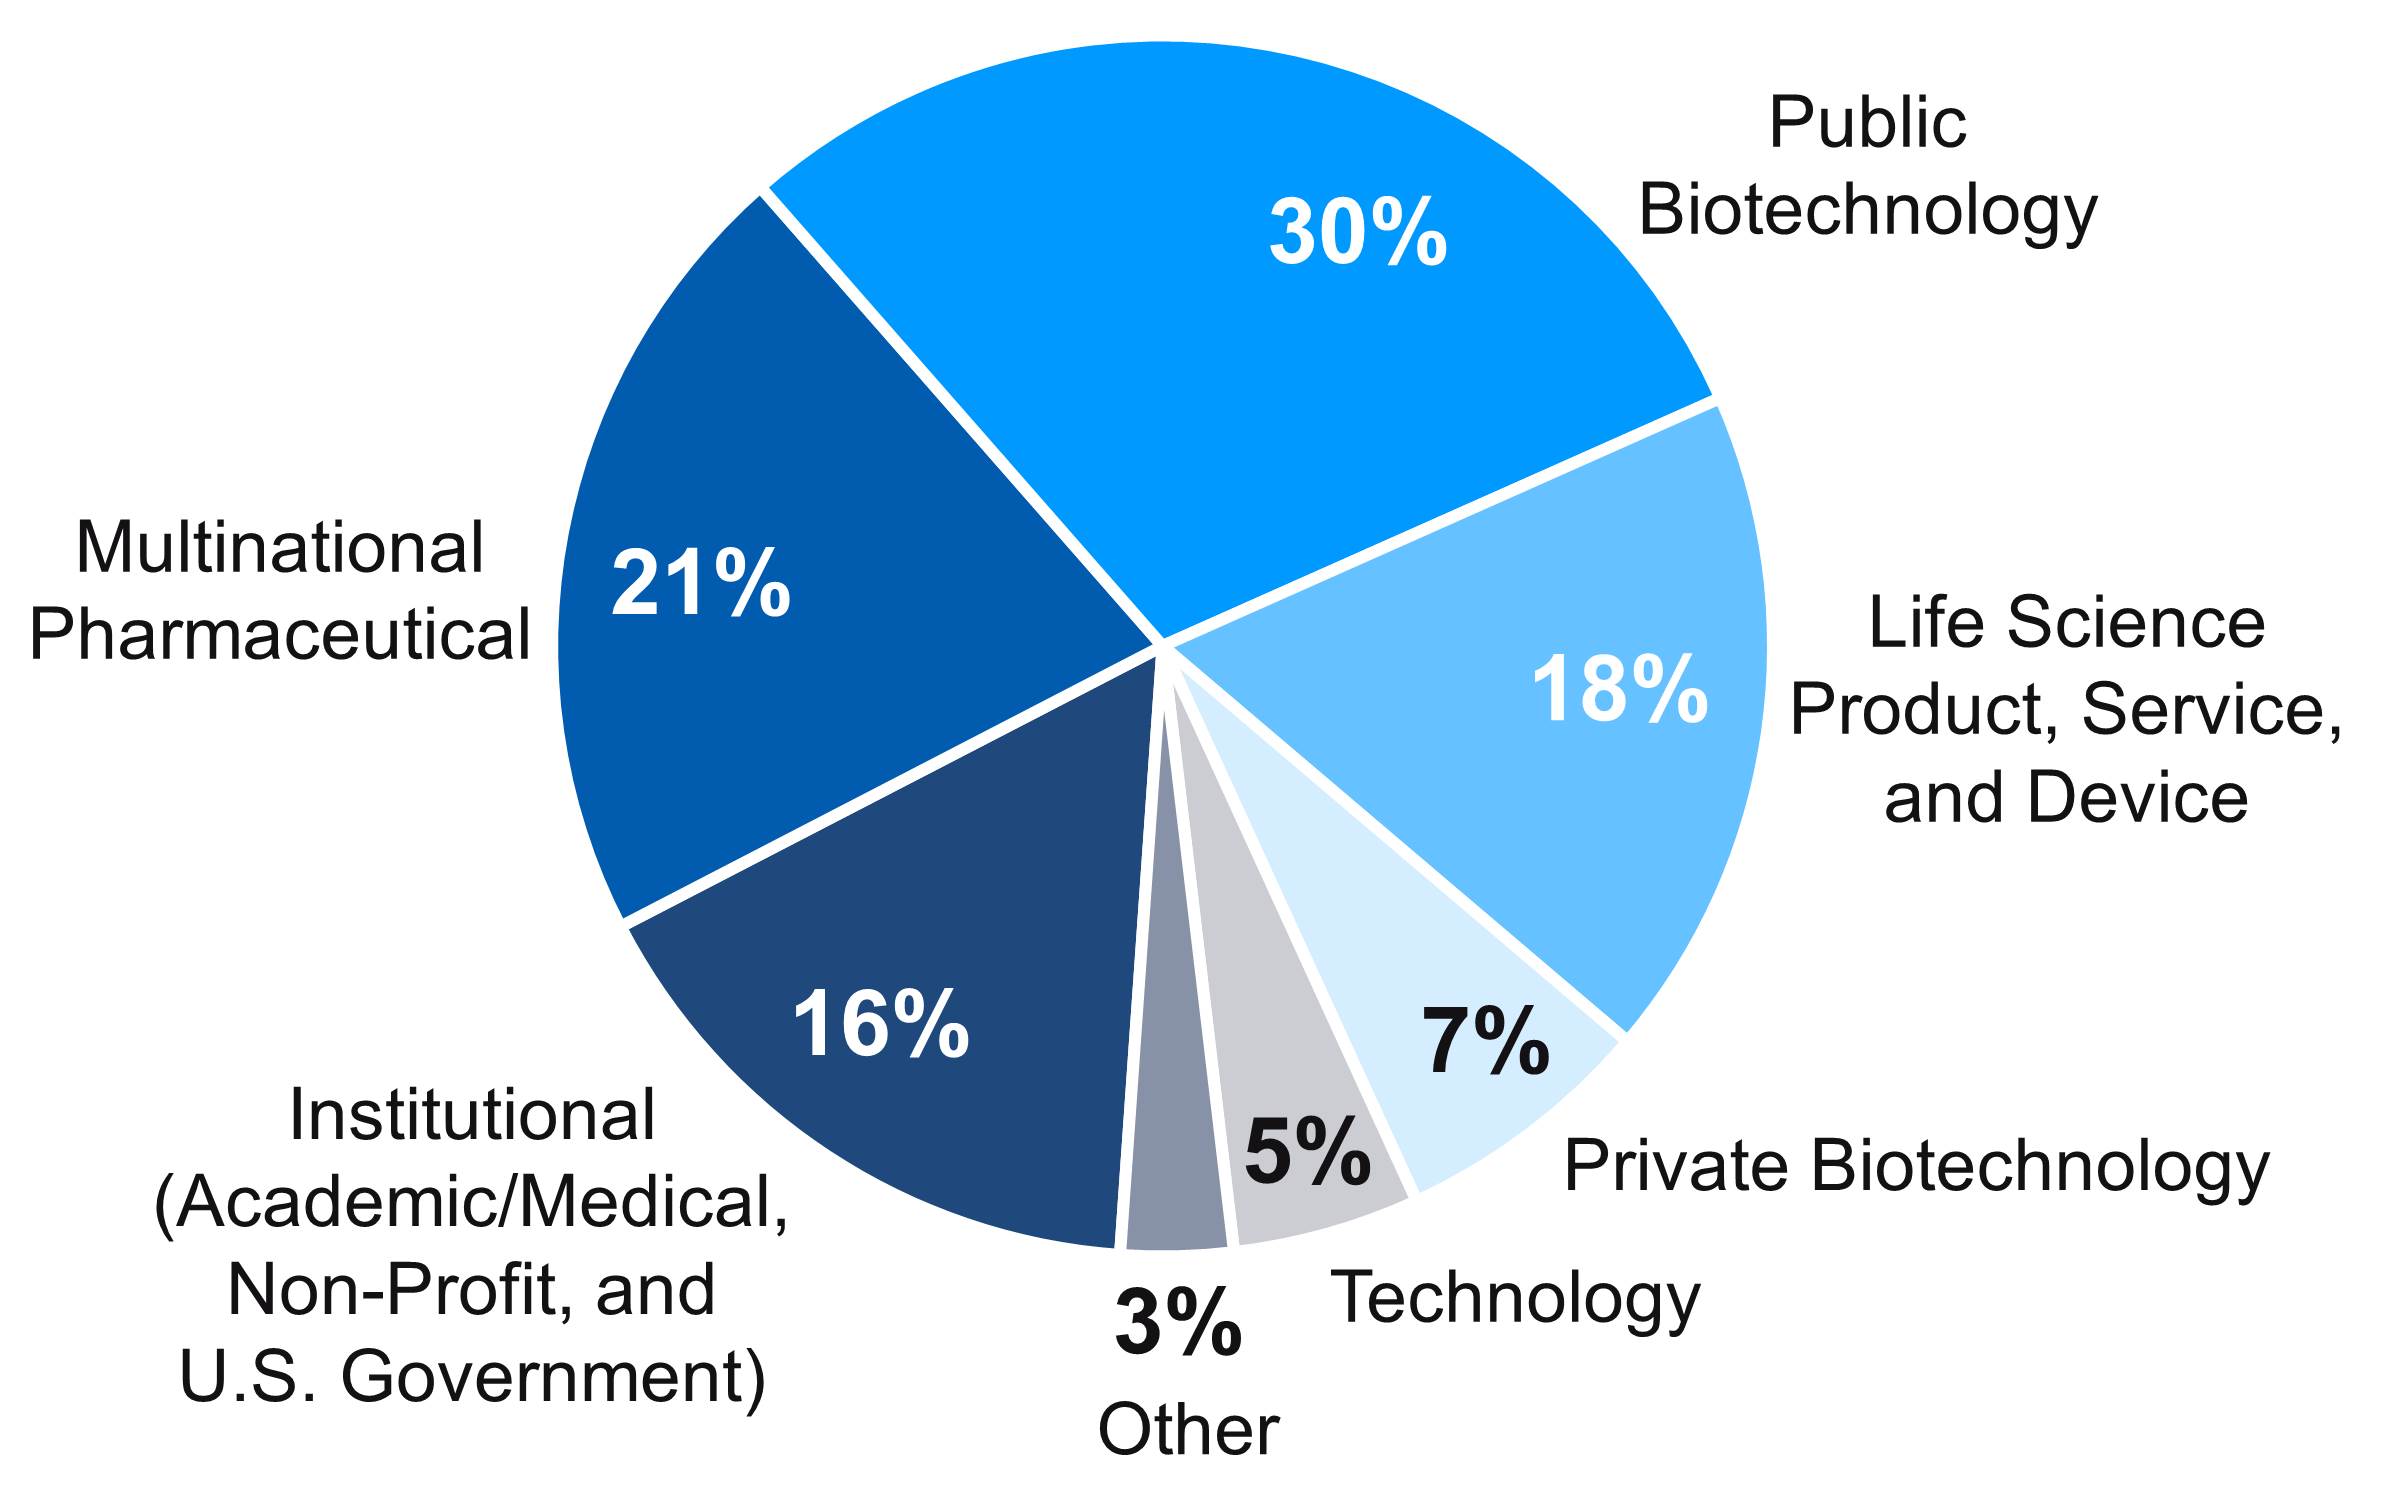 | ||
of ARE’s Total Annual Rental Revenue(1) | |||
| (1) | Represents annual rental revenue in effect as of March 31, 2017. |
| |
| Class A Properties in AAA Locations | |
| March 31, 2017 | |
High-Quality Cash Flows from Class A Properties in AAA Locations
Class A Properties in AAA Locations | AAA Locations | ||
| 79% | 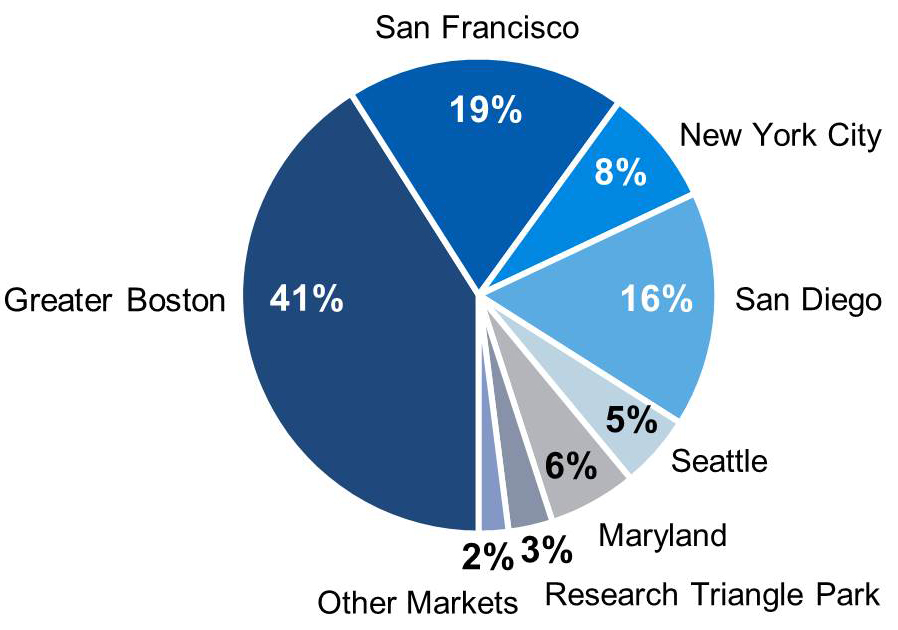 | ||
of ARE’s Annual Rental Revenue(1) | |||
Percentage of ARE’s Annual Rental Revenue (1) | |||
| (1) | Represents annual rental revenue in effect as of March 31, 2017. |
| |
| Occupancy | |
| March 31, 2017 | |
Solid Demand for Class A Properties in AAA Locations
Drives Solid Occupancy
Solid Historical Occupancy (1) | Occupancy of Operating Properties across Key Locations as of March 31, 2017 | ||
| 95% |  | ||
| Over 10 Years | |||
| (1) | Average occupancy of operating properties in North America as of each December 31 for the last 10 years and as of March 31, 2017. |
| Financial and Asset Base Highlights | |
| March 31, 2017 | |
| (Dollars in thousands, except per share amounts) | |
| Three Months Ended (unless stated otherwise) | ||||||||||||||||||||
| 3/31/17 | 12/31/16 | 9/30/16 | 6/30/16 | 3/31/16 | ||||||||||||||||
| Selected financial data from consolidated financial statements and related information | ||||||||||||||||||||
| Adjusted EBITDA – quarter annualized | $ | 723,764 | $ | 662,836 | $ | 614,668 | $ | 601,048 | $ | 564,804 | ||||||||||
| Adjusted EBITDA – trailing 12 months | $ | 650,579 | $ | 610,839 | $ | 591,646 | $ | 579,880 | $ | 562,454 | ||||||||||
| Adjusted EBITDA margins | 67% | 67% | 67% | 66% | 65% | |||||||||||||||
| Operating margins | 72% | 71% | 69% | 70% | 70% | |||||||||||||||
| Net debt (excluding unamortized deferred financing costs) at end of period | $ | 4,292,773 | $ | 4,052,576 | $ | 4,186,180 | $ | 3,881,708 | $ | 3,958,891 | ||||||||||
| Net debt to Adjusted EBITDA – quarter annualized | 5.9x | 6.1x | 6.8x | 6.5x | 7.0x | |||||||||||||||
| Net debt to Adjusted EBITDA – trailing 12 months | 6.6x | 6.6x | 7.1x | 6.7x | 7.0x | |||||||||||||||
| Net debt and preferred stock to Adjusted EBITDA – quarter annualized | 6.0x | 6.4x | 7.3x | 7.0x | 7.6x | |||||||||||||||
| Net debt and preferred stock to Adjusted EBITDA – trailing 12 months | 6.7x | 7.0x | 7.6x | 7.2x | 7.6x | |||||||||||||||
| Fixed-charge coverage ratio – quarter annualized | 4.1x | 3.8x | 3.6x | 3.6x | 3.5x | |||||||||||||||
| Fixed-charge coverage ratio – trailing 12 months | 3.8x | 3.6x | 3.6x | 3.6x | 3.5x | |||||||||||||||
| Unencumbered net operating income as a percentage of total net operating income | 81% | 82% | 87% | 87% | 82% | |||||||||||||||
| Closing stock price at end of period | $ | 110.52 | $ | 111.13 | $ | 108.77 | $ | 103.52 | $ | 90.89 | ||||||||||
| Common shares outstanding (in thousands) at end of period | 89,884 | 87,666 | 76,824 | 76,615 | 72,874 | |||||||||||||||
| Total equity capitalization at end of period | $ | 10,037,702 | $ | 9,991,832 | $ | 8,717,246 | $ | 8,326,096 | $ | 7,008,376 | ||||||||||
| Total market capitalization at end of period | $ | 14,468,388 | $ | 14,155,857 | $ | 13,046,340 | $ | 12,442,633 | $ | 11,099,875 | ||||||||||
| Dividend per share – quarter/annualized | $0.83/$3.32 | $0.83/$3.32 | $0.80/$3.20 | $0.80/$3.20 | $0.80/$3.20 | |||||||||||||||
| Dividend payout ratio for the quarter | 57% | 63% | 57% | 61% | 60% | |||||||||||||||
| Dividend yield – annualized | 3.0% | 3.0% | 2.9% | 3.1% | 3.5% | |||||||||||||||
| General and administrative expense as a percentage of total assets – trailing 12 months | 0.6% | 0.6% | 0.7% | 0.7% | 0.7% | |||||||||||||||
| General and administrative expense as a percentage of total revenues – trailing 12 months | 7.0% | 6.9% | 6.9% | 6.9% | 7.0% | |||||||||||||||
| Capitalized interest | $ | 13,164 | $ | 11,659 | $ | 14,903 | $ | 13,788 | $ | 12,099 | ||||||||||
| Weighted-average interest rate for capitalization of interest during period | 3.95% | 3.72% | 3.78% | 3.70% | 3.60% | |||||||||||||||
| Financial and Asset Base Highlights (continued) | |
| March 31, 2017 | |
| (Dollars in thousands, except annual rental revenue per occupied RSF amounts) | |
| Three Months Ended (unless stated otherwise) | ||||||||||||||||||||
| 3/31/17 | 12/31/16 | 9/30/16 | 6/30/16 | 3/31/16 | ||||||||||||||||
| Amounts included in funds from operations and non-revenue-enhancing capital expenditures | ||||||||||||||||||||
| Straight-line rent revenue | $ | 35,592 | (1) | $ | 20,993 | $ | 16,111 | $ | 2,430 | $ | 12,138 | |||||||||
| Amortization of acquired below-market leases | $ | 5,359 | $ | 2,818 | $ | 965 | $ | 966 | $ | 974 | ||||||||||
| Straight-line rent on ground leases | $ | 198 | $ | 557 | $ | (1,331 | ) | $ | 777 | $ | 592 | |||||||||
| Stock compensation expense | $ | 5,252 | $ | 6,426 | $ | 7,451 | $ | 6,117 | $ | 5,439 | ||||||||||
| Amortization of loan fees | $ | 2,895 | $ | 3,080 | $ | 3,080 | $ | 2,953 | $ | 2,759 | ||||||||||
| Amortization of debt premiums | $ | 596 | $ | 383 | $ | 5 | $ | 26 | $ | 86 | ||||||||||
| Non-revenue-enhancing capital expenditures: | ||||||||||||||||||||
| Building improvements | $ | 1,138 | $ | 2,135 | $ | 1,920 | $ | 2,833 | $ | 2,318 | ||||||||||
| Tenant improvements and leasing commissions | $ | 18,377 | (2) | $ | 11,614 | $ | 10,289 | $ | 9,041 | $ | 2,475 | |||||||||
| Operating statistics and related information (at end of period) | ||||||||||||||||||||
| Number of properties – North America | 199 | 199 | 189 | 189 | 190 | |||||||||||||||
| RSF (including development and redevelopment projects under construction) – North America | 20,084,195 | 19,869,729 | 18,820,579 | 18,819,315 | 18,903,424 | |||||||||||||||
Total square feet – North America (see details on page 32) | 28,176,780 | 25,162,360 | 24,499,286 | 24,400,303 | 24,509,859 | |||||||||||||||
| Annual rental revenue per occupied RSF – North America | $ | 45.94 | $ | 45.15 | $ | 43.39 | $ | 42.06 | $ | 41.67 | ||||||||||
| Occupancy of operating properties – North America | 95.5% | 96.6% | 97.1% | 97.0% | 97.3% | |||||||||||||||
| Occupancy of operating and redevelopment properties – North America | 94.7% | 95.7% | 94.4% | 93.9% | 93.8% | |||||||||||||||
| Total leasing activity – RSF | 1,320,781 | 1,501,376 | 683,307 | 816,512 | 388,872 | |||||||||||||||
| Lease renewals and re-leasing of space – change in average new rental rates over expiring rates: | ||||||||||||||||||||
| Rental rate increases | 27.8% | 25.8% | 28.2% | 27.1% | 33.6% | |||||||||||||||
| Rental rate increases (cash basis) | 17.7% | 9.5% | 16.2% | 9.3% | 16.9% | |||||||||||||||
| RSF (included in total leasing activity above) | 878,863 | 671,222 | 592,776 | 647,268 | 218,342 | |||||||||||||||
| Same property – percentage change over comparable quarter from prior year: | ||||||||||||||||||||
| Net operating income increase | 2.6% | 3.2% | 5.3% | 4.9% | 5.3% | |||||||||||||||
| Net operating income increase (cash basis) | 5.5% | 4.9% | 6.1% | 6.4% | 6.2% | |||||||||||||||
(1) The increase from 4Q16 relates primarily to free rent granted on our 1455 and 1515 Third Street, 10290 Campus Point Drive, and 4796 Executive Drive projects placed into service during 4Q16. We expect a decline in straight-line rent revenue from 1Q17 to 2Q17 primarily related to the increase in contractual cash rents at our 75/125 Binney Street and 50 and 60 Binney Street properties by approximately $10.0 million per quarter, or $40.0 million annually, as a result of the end of previously granted free rent. (2) Increase from 4Q16 primarily relates to tenant improvements granted and leasing commissions incurred for leases executed that generated average increases in rental rates of 25.9% and 17.4% (cash basis), respectively. Includes approximately $3.8 million, or $4.30 per square foot, related to base building work to be performed by tenants for enhancements to common areas and building energy efficiency projects at two of our properties in Cambridge. | ||||||||||||||||||||
| |
| Key Operating Metrics | |
| March 31, 2017 | |
Favorable Lease Structure (1) | Same Property Net Operating Income Increases | |||||||||
 | 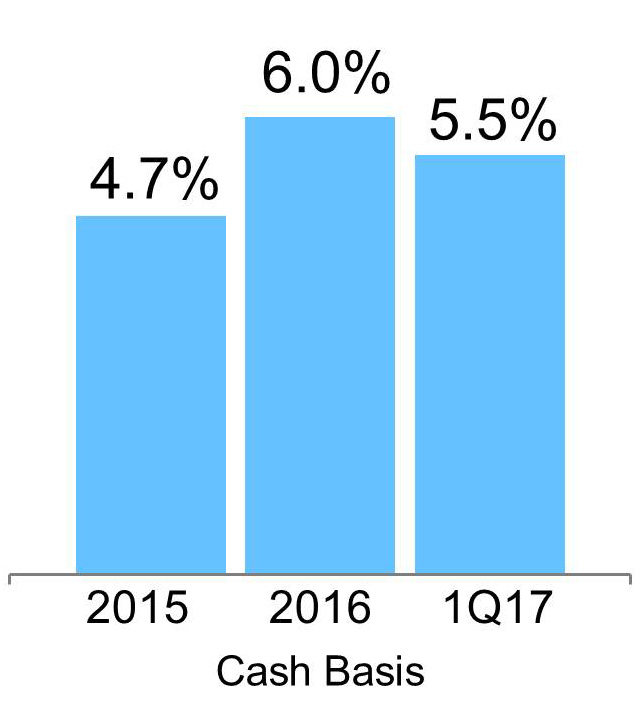 | |||||||||
| Stable cash flows | ||||||||||
Percentage of triple net leases | 97% | |||||||||
| Increasing cash flows | ||||||||||
Percentage of leases containing annual rent escalations | 96% | |||||||||
| Lower capex burden | ||||||||||
Percentage of leases providing for the recapture of capital expenditures | 95% | |||||||||
Margins (2) | Rental Rate Increases: Renewed/Re-Leased Space | |||||||||
 |  | |||||||||
| Adjusted EBITDA | Operating | |||||||||
| 67% | 72% | |||||||||
| (1) | Percentages calculated based on RSF as of March 31, 2017. |
| (2) | Represents the three months ended March 31, 2017. |
| |
| Same Property Performance | |
| March 31, 2017 | |
| Same Property Financial Data | 1Q17 | Same Property Statistical Data | 1Q17 | ||||
| Percentage change over comparable period from prior year: | Number of same properties | 166 | |||||
| Net operating income increase | 2.6% | Rentable square feet | 14,385,549 | ||||
| Net operating income increase (cash basis) | 5.5% | Occupancy – current-period average | 96.5% | (1) | |||
| Operating margin | 71% | Occupancy – same-period prior-year average | 97.1% | ||||
| Three Months Ended March 31, | ||||||||||||||||
| 2017 | 2016 | $ Change | % Change | |||||||||||||
| Same properties | $ | 151,620 | $ | 146,917 | $ | 4,703 | 3.2 | % | ||||||||
| Non-same properties | 55,573 | 11,359 | 44,214 | 389.2 | ||||||||||||
| Total rental | 207,193 | 158,276 | 48,917 | 30.9 | ||||||||||||
| Same properties | 50,415 | 48,148 | 2,267 | 4.7 | ||||||||||||
| Non-same properties | 10,931 | 4,449 | 6,482 | 145.7 | ||||||||||||
| Total tenant recoveries | 61,346 | 52,597 | 8,749 | 16.6 | ||||||||||||
| Same properties | 141 | 9 | 132 | 1,466.7 | ||||||||||||
| Non-same properties | 2,197 | 5,207 | (3,010 | ) | (57.8 | ) | ||||||||||
| Total other income | 2,338 | 5,216 | (2,878 | ) | (55.2 | ) | ||||||||||
| Same properties | 202,176 | 195,074 | 7,102 | 3.6 | ||||||||||||
| Non-same properties | 68,701 | 21,015 | 47,686 | 226.9 | ||||||||||||
| Total revenues | 270,877 | 216,089 | 54,788 | 25.4 | ||||||||||||
| Same properties | 59,449 | 55,949 | 3,500 | 6.3 | ||||||||||||
| Non-same properties | 17,638 | 9,888 | 7,750 | 78.4 | ||||||||||||
| Total rental operations | 77,087 | 65,837 | 11,250 | 17.1 | ||||||||||||
| Same properties | 142,727 | 139,125 | 3,602 | 2.6 | ||||||||||||
| Non-same properties | 51,063 | 11,127 | 39,936 | 358.9 | ||||||||||||
| Net operating income | $ | 193,790 | $ | 150,252 | $ | 43,538 | 29.0 | % | ||||||||
| Net operating income – same properties | $ | 142,727 | $ | 139,125 | $ | 3,602 | 2.6 | % | ||||||||
Straight-line rent revenue and amortization of acquired below-market leases | (8,044 | ) | (11,456 | ) | 3,412 | (29.8 | ) | |||||||||
| Net operating income – same properties (cash basis) | $ | 134,683 | $ | 127,669 | $ | 7,014 | 5.5 | % | ||||||||
| (1) | The decline in Same Property occupancy from 1Q16 primarily relates to 125,409 RSF vacated in 1Q17 by Eli Lilly and Company at 10300 Campus Point Drive located in our University Town Center submarket. Eli Lilly and Company relocated and expanded into 305,006 RSF at our recently delivered redevelopment project at 10290 Campus Point Drive, a non-same property, in December 2016. Additionally, 59,838 RSF became vacant in 1Q17 at 930 Clopper Road located in our Gaithersburg submarket. We are actively marketing these spaces for lease. |
| |
| Leasing Activity | |
| March 31, 2017 | |
| Three Months Ended | Year Ended | |||||||||||||||
| March 31, 2017 | December 31, 2016 | |||||||||||||||
| (Dollars are per RSF) | Including Straight-Line Rent | Cash Basis | Including Straight-Line Rent | Cash Basis | ||||||||||||
| Leasing activity: | ||||||||||||||||
Renewed/re-leased space (1) | ||||||||||||||||
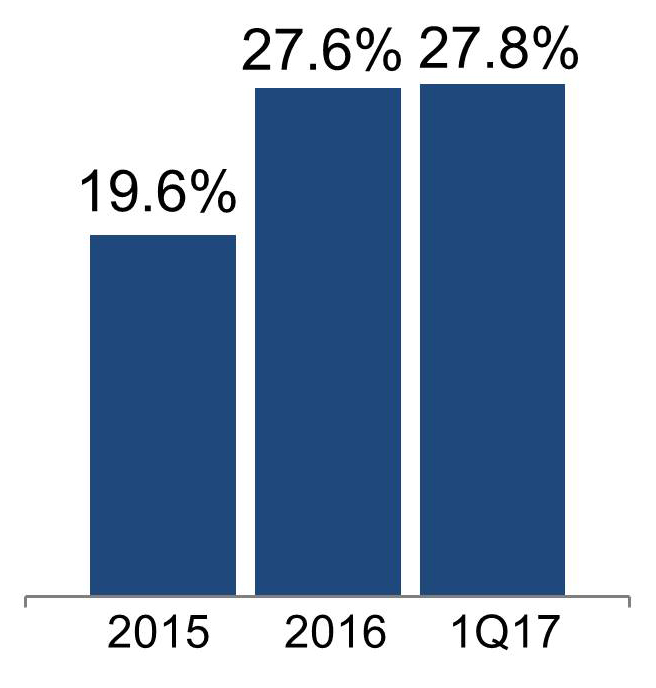
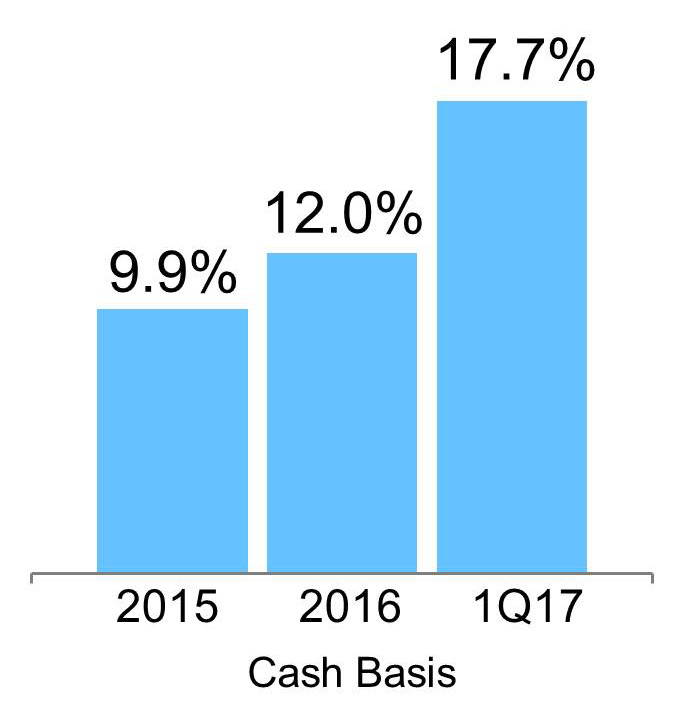
| Rental rate changes | 27.8% | 17.7% | 27.6% | 12.0% | ||||||||||||
| New rates | $ | 54.59 | $ | 50.03 | $ | 48.60 | $ | 45.83 | ||||||||
| Expiring rates | $ | 42.72 | $ | 42.49 | $ | 38.09 | $ | 40.92 | ||||||||
| Rentable square footage | 878,863 | 2,129,608 | ||||||||||||||
| Number of leases | 41 | 126 | ||||||||||||||
| Tenant improvements/leasing commissions | $ | 20.91 | (2) | $ | 15.69 | |||||||||||
| Weighted-average lease term | 6.2 years | 5.5 years | ||||||||||||||
| Developed/redeveloped/previously vacant space leased | ||||||||||||||||
| New rates | $ | 23.13 | (3) | $ | 14.55 | (3) | $ | 50.24 | $ | 38.72 | ||||||
| Rentable square footage | 441,918 | (3) | 1,260,459 | |||||||||||||
| Number of leases | 16 | 53 | ||||||||||||||
| Tenant improvements/leasing commissions | $ | 2.51 | $ | 12.42 | ||||||||||||
| Weighted-average lease term | 15.3 years | 32.6 years | ||||||||||||||
| Leasing activity summary (totals): | ||||||||||||||||
| New rates | $ | 44.06 | $ | 38.16 | $ | 49.21 | $ | 43.19 | ||||||||
| Rentable square footage | 1,320,781 | (4) | 3,390,067 | |||||||||||||
| Number of leases | 57 | (5) | 179 | |||||||||||||
| Tenant improvements/leasing commissions | $ | 14.75 | $ | 14.48 | ||||||||||||
| Weighted-average lease term | 9.2 years | 15.6 years | ||||||||||||||
Lease expirations: (1) | ||||||||||||||||
| Expiring rates | $ | 40.50 | $ | 40.53 | $ | 36.70 | $ | 39.32 | ||||||||
| Rentable square footage | 1,144,838 | 2,484,169 | ||||||||||||||
| Number of leases | 49 | 166 | ||||||||||||||
Leasing activity includes 100% of results for each property managed by us.
| (1) | Excludes 21 month-to-month leases for 35,665 RSF and 20 month-to-month leases for 31,207 RSF as of March 31, 2017, and December 31, 2016, respectively. |
| (2) | Includes approximately $3.8 million, or $4.30 per square foot, related to base building work to be performed by tenants for enhancements to common areas and building energy efficiency projects at two of our properties in Cambridge. |
| (3) | 1Q17 amounts reflect our lease of the existing 232,470 RSF with a leading tennis and fitness facility at 88 Bluxome Street in our Mission Bay/SoMa submarket of San Francisco. Excluding this lease, new rental rates on developed/redeveloped/previously vacant space were $30.60 and $27.84 (cash basis) on 209,448 RSF of total developed/redeveloped/previously vacant space leasing activity. |
| (4) | During the three months ended March 31, 2017, we granted tenant concessions/free rent averaging 2.6 months with respect to the 1,320,781 RSF leased. |
| (5) | Approximately 68% of the 57 leases executed during the three months ended March 31, 2017, did not include concessions for free rent. |
| |
| Contractual Lease Expirations | |
| March 31, 2017 | |
| Year | Number of Leases | RSF | Percentage of Occupied RSF | Annual Rental Revenue (per RSF) | Percentage of Total Annual Rental Revenue | ||||||||||||||||||||||
| 2017 | 59 | (1) | 593,561 | (1) | 3.4 | % | (1) | $ | 31.79 | (1) | 2.7 | % | (1) | ||||||||||||||
| 2018 | 117 | 1,426,548 | 8.1 | % | $ | 38.83 | 7.0 | % | |||||||||||||||||||
| 2019 | 83 | 1,454,711 | 8.3 | % | $ | 41.03 | 7.5 | % | |||||||||||||||||||
| 2020 | 90 | 1,892,243 | 10.7 | % | $ | 38.79 | 9.2 | % | |||||||||||||||||||
| 2021 | 74 | 1,629,965 | 9.2 | % | $ | 42.46 | 8.7 | % | |||||||||||||||||||
| 2022 | 57 | 1,193,068 | 6.8 | % | $ | 46.09 | 6.9 | % | |||||||||||||||||||
| 2023 | 33 | 1,618,375 | 9.2 | % | $ | 42.78 | 8.7 | % | |||||||||||||||||||
| 2024 | 20 | 1,121,672 | 6.4 | % | $ | 45.17 | 6.4 | % | |||||||||||||||||||
| 2025 | 15 | 453,982 | 2.6 | % | $ | 48.45 | 2.8 | % | |||||||||||||||||||
| 2026 | 17 | 716,922 | 4.1 | % | $ | 43.85 | 4.0 | % | |||||||||||||||||||
| Thereafter | 49 | 5,527,161 | 31.2 | % | $ | 51.99 | 36.1 | % | |||||||||||||||||||
| Market | 2017 Contractual Lease Expirations | Annual Rental Revenue (per RSF) | 2018 Contractual Lease Expirations | Annual Rental Revenue (per RSF) | ||||||||||||||||||||||||||||||||||||||
| Leased | Negotiating/ Anticipating | Targeted for Redevelopment | Remaining Expiring Leases | Total (1) | Leased | Negotiating/ Anticipating | Targeted for Redevelopment | Remaining Expiring Leases | Total | |||||||||||||||||||||||||||||||||
| Greater Boston | 8,893 | 42,054 | — | 62,329 | 113,276 | $ | 41.27 | 18,263 | 71,025 | — | 426,774 | (2) | 516,062 | $ | 50.54 | |||||||||||||||||||||||||||
| San Francisco | 68,079 | — | — | 1,184 | 69,263 | 58.75 | 34,623 | — | — | 268,641 | 303,264 | 42.17 | ||||||||||||||||||||||||||||||
| New York City | — | — | — | 15,919 | 15,919 | N/A | — | — | — | 4,941 | 4,941 | N/A | ||||||||||||||||||||||||||||||
| San Diego | 129,687 | (3) | 11,932 | — | 50,776 | 192,395 | 27.04 | 15,611 | — | — | 240,341 | 255,952 | 33.88 | |||||||||||||||||||||||||||||
| Seattle | 22,471 | — | — | 6,180 | 28,651 | 47.69 | 7,770 | — | — | 15,264 | 23,034 | 49.04 | ||||||||||||||||||||||||||||||
| Maryland | — | 24,027 | — | 3,868 | 27,895 | 19.03 | — | 4,925 | — | 167,411 | 172,336 | 15.20 | ||||||||||||||||||||||||||||||
| Research Triangle Park | 53,167 | 33,916 | — | 31,714 | 118,797 | 16.01 | — | — | — | 59,666 | 59,666 | 26.28 | ||||||||||||||||||||||||||||||
| Canada | — | — | — | — | — | — | — | — | — | 80,689 | 80,689 | 20.71 | ||||||||||||||||||||||||||||||
| Non-cluster markets | — | — | — | 27,365 | 27,365 | 22.58 | — | — | — | 10,604 | 10,604 | 26.58 | ||||||||||||||||||||||||||||||
| Total | 282,297 | 111,929 | — | 199,335 | 593,561 | $ | 31.79 | 76,267 | 75,950 | — | 1,274,331 | 1,426,548 | $ | 38.83 | ||||||||||||||||||||||||||||
| Percentage of expiring leases | 48 | % | 19 | % | — | % | 33 | % | 100 | % | 5 | % | 5 | % | — | % | 90 | % | 100 | % | ||||||||||||||||||||||
Lease expirations include 100% of RSF for each property managed by us in North America. Annual rental revenue (per RSF) represents amounts in effect as of March 31, 2017.
| (1) | Excludes 21 month-to-month leases for 35,665 RSF. |
| (2) | Includes 297,191 RSF located in our Cambridge submarket for our remaining expiring leases in 2018. |
(3) Includes one lease aggregating 109,780 RSF that was renewed in April 2017.
| Top 20 Tenants | |
| March 31, 2017 | |
| (Dollars in thousands) | |
78% of Top 20 Annual Rental Revenue from Investment-Grade Tenants
| Tenant | Remaining Lease Term in Years (1) | Aggregate RSF | Annual Rental Revenue (1) | Percentage of Aggregate Annual Rental Revenue (1) | Investment-Grade Ratings | ||||||||||||||||||
| Moody’s | S&P | ||||||||||||||||||||||
| 1 | Illumina, Inc. | 13.2 | 891,495 | $ | 31,301 | 3.9 | % | — | BBB | ||||||||||||||
| 2 | Takeda Pharmaceutical Company Ltd. | 13.0 | 386,111 | 30,051 | 3.7 | A1 | A- | ||||||||||||||||
| 3 | Eli Lilly and Company | 12.6 | 469,266 | 29,342 | 3.6 | A2 | AA- | ||||||||||||||||
| 4 | Novartis AG | 9.6 | 377,831 | 28,630 | 3.5 | Aa3 | AA- | ||||||||||||||||
| 5 | Sanofi | 10.7 | 446,975 | 25,163 | 3.1 | A1 | AA | ||||||||||||||||
| 6 | bluebird bio, Inc. | 8.9 | 338,911 | 23,566 | 2.9 | — | — | ||||||||||||||||
| 7 | Uber Technologies, Inc. | 75.7 | 422,980 | 22,107 | 2.7 | — | — | ||||||||||||||||
| 8 | New York University | 13.4 | 209,224 | 20,651 | 2.5 | Aa3 | AA- | ||||||||||||||||
| 9 | Dana-Farber Cancer Institute, Inc. | 13.6 | 254,130 | 19,512 | 2.4 | A1 | — | ||||||||||||||||
| 10 | Roche | 4.9 | 343,861 | 17,597 | 2.2 | A1 | AA | ||||||||||||||||
| 11 | Amgen Inc. | 7.0 | 407,369 | 16,838 | 2.1 | Baa1 | A | ||||||||||||||||
| 12 | Massachusetts Institute of Technology | 8.2 | 256,126 | 16,554 | 2.0 | Aaa | AAA | ||||||||||||||||
| 13 | United States Government | 8.2 | 263,147 | 14,816 | 1.8 | Aaa | AA+ | ||||||||||||||||
| 14 | Celgene Corporation | 6.4 | 344,320 | 14,608 | 1.8 | Baa2 | BBB+ | ||||||||||||||||
| 15 | FibroGen, Inc. | 6.6 | 234,249 | 14,198 | 1.7 | — | — | ||||||||||||||||
| 16 | Biogen Inc. | 11.5 | 305,212 | 13,278 | 1.6 | Baa1 | A- | ||||||||||||||||
| 17 | Juno Therapeutics, Inc. | 12.0 | 241,276 | 12,619 | 1.6 | — | — | ||||||||||||||||
| 18 | Merrimack Pharmaceuticals, Inc. | 2.3 | 167,167 | 11,246 | 1.4 | — | — | ||||||||||||||||
| 19 | Bristol-Myers Squibb Company | 1.9 | 251,316 | 10,743 | 1.3 | A2 | A+ | ||||||||||||||||
| 20 | The Regents of the University of California | 6.4 | 233,527 | 10,707 | 1.3 | Aa2 | AA | ||||||||||||||||
| Total/weighted average | 13.6 | (2) | 6,844,493 | $ | 383,527 | 47.1 | % | ||||||||||||||||
Annual rental revenue and RSF include 100% of each property managed by us in North America.
| (1) | Based on percentage of aggregate annual rental revenue in effect as of March 31, 2017. |
| (2) | Excluding Uber Technologies, Inc., the weighted-average remaining lease term for our top 20 tenants is 9.8 years. |
| Summary of Properties and Occupancy | |
| March 31, 2017 | |
| (Dollars in thousands, except per RSF amounts) | |
Summary of properties
| Market | RSF | Number of Properties | Annual Rental Revenue | |||||||||||||||||||||||||||
| Operating | Development | Redevelopment | Total | % of Total | Total | % of Total | Per RSF | |||||||||||||||||||||||
| Greater Boston | 5,852,281 | 431,483 | — | 6,283,764 | 31 | % | 51 | $ | 334,603 | 41 | % | $ | 59.50 | |||||||||||||||||
| San Francisco | 3,441,926 | 747,355 | — | 4,189,281 | 21 | 31 | 153,943 | 19 | 44.81 | |||||||||||||||||||||
| New York City | 727,674 | — | — | 727,674 | 4 | 2 | 62,011 | 8 | 87.12 | |||||||||||||||||||||
| San Diego | 3,826,635 | 202,187 | 162,156 | 4,190,978 | 21 | 52 | 128,395 | 16 | 36.89 | |||||||||||||||||||||
| Seattle | 989,085 | 48,835 | — | 1,037,920 | 5 | 11 | 46,484 | 5 | 47.88 | |||||||||||||||||||||
| Maryland | 2,085,196 | — | — | 2,085,196 | 11 | 28 | 49,711 | 6 | 25.74 | |||||||||||||||||||||
| Research Triangle Park | 1,043,726 | — | — | 1,043,726 | 5 | 15 | 23,775 | 3 | 23.36 | |||||||||||||||||||||
| Canada | 256,967 | — | — | 256,967 | 1 | 3 | 6,474 | 1 | 25.41 | |||||||||||||||||||||
| Non-cluster markets | 268,689 | — | — | 268,689 | 1 | 6 | 6,052 | 1 | 25.48 | |||||||||||||||||||||
| North America | 18,492,179 | 1,429,860 | 162,156 | 20,084,195 | 100 | % | 199 | $ | 811,448 | 100 | % | $ | 45.94 | |||||||||||||||||
RSF, number of properties, and annual rental revenue include 100% of each property managed by us in North America. Annual rental revenue amounts represent amounts in effect as of March 31, 2017.
Summary of occupancy
| Operating Properties | Operating and Redevelopment Properties | |||||||||||||||||
| Market | 3/31/17 | 12/31/16 | 3/31/16 | 3/31/17 | 12/31/16 | 3/31/16 | ||||||||||||
| Greater Boston | 96.1 | % | 96.2 | % | 97.6 | % | 96.1 | % | 96.2 | % | 96.3 | % | ||||||
| San Francisco | 99.8 | 99.9 | 100.0 | 99.8 | 99.9 | 100.0 | ||||||||||||
| New York City | 97.8 | 97.3 | 99.7 | 97.8 | 97.3 | 99.7 | ||||||||||||
| San Diego | 91.0 | (1) | 94.3 | 94.5 | 87.3 | (1) | 90.4 | 80.1 | ||||||||||
| Seattle | 98.2 | 97.6 | 99.2 | 98.2 | 97.6 | 99.2 | ||||||||||||
| Maryland | 92.6 | (2) | 95.8 | 95.9 | 92.6 | (2) | 95.8 | 95.9 | ||||||||||
| Research Triangle Park | 97.5 | 99.0 | 98.6 | 97.5 | 99.0 | 98.6 | ||||||||||||
| Subtotal | 95.6 | 96.7 | 97.5 | 94.7 | 95.8 | 93.8 | ||||||||||||
| Canada | 99.2 | 99.2 | 99.3 | 99.2 | 99.2 | 99.3 | ||||||||||||
| Non-cluster markets | 88.4 | 87.7 | 88.1 | 88.4 | 87.7 | 88.1 | ||||||||||||
| North America | 95.5 | % | 96.6 | % | 97.3 | % | 94.7 | % | 95.7 | % | 93.8 | % | ||||||
| Occupancy includes 100% of each property managed by us in North America. | ||||||||||||||||||
| (1) | The decline from 4Q16 primarily relates to 125,409 RSF vacated in 1Q17 by Eli Lilly and Company (“Eli Lilly”) at 10300 Campus Point Drive located in our University Town Center submarket. Eli Lilly and Company relocated and expanded into 305,006 RSF at 10290 Campus Point Drive in December 2016. We are in negotiations with a tenant to lease 86,010 RSF. |
| (2) | The decline from 4Q16 primarily relates to 59,838 RSF that became vacant at 930 Clopper Road located in our Gaithersburg submarket. We are actively marketing the property for lease and do not anticipate significant additional capital to be invested to re-tenant the space. |
| Property Listing | |
| March 31, 2017 | |
| (Dollars in thousands) | |
Market / Submarket / Address | RSF | Number of Properties | Annual Rental Revenue | Occupancy Percentage | |||||||||||||||||||||||
| Operating | Operating and Redevelopment | ||||||||||||||||||||||||||
| Operating | Development | Redevelopment | Total | ||||||||||||||||||||||||
| Greater Boston | |||||||||||||||||||||||||||
| Cambridge/Inner Suburbs | |||||||||||||||||||||||||||
Alexandria Center® at Kendall Square | 1,648,700 | 431,483 | — | 2,080,183 | 9 | $ | 104,245 | 98.9 | % | 98.9 | % | ||||||||||||||||
| 50, 60, 75/125, and 100 Binney Street, 161 and 215 First Street,150 Second Street, 300 Third Street, and 11 Hurley Street | |||||||||||||||||||||||||||
225 Binney Street (consolidated joint venture – 30% ownership) | 305,212 | — | — | 305,212 | 1 | 13,278 | 100.0 | 100.0 | |||||||||||||||||||
Alexandria Technology Square® | 1,181,635 | — | — | 1,181,635 | 7 | 82,397 | 99.1 | 99.1 | |||||||||||||||||||
| 100, 200, 300, 400, 500, 600, and 700 Technology Square | |||||||||||||||||||||||||||
Alexandria Center® at One Kendall Square | 644,771 | — | — | 644,771 | 9 | 49,060 | 97.0 | 97.0 | |||||||||||||||||||
| 480 and 500 Arsenal Street | 234,260 | — | — | 234,260 | 2 | 9,539 | 100.0 | 100.0 | |||||||||||||||||||
| 640 Memorial Drive | 225,504 | — | — | 225,504 | 1 | 13,730 | 100.0 | 100.0 | |||||||||||||||||||
| 780 and 790 Memorial Drive | 99,658 | — | — | 99,658 | 2 | 7,338 | 100.0 | 100.0 | |||||||||||||||||||
| 167 Sidney Street and 99 Erie Street | 54,549 | — | — | 54,549 | 2 | 3,656 | 100.0 | 100.0 | |||||||||||||||||||
| 79/96 13th Street (Charlestown Navy Yard) | 25,309 | — | — | 25,309 | 1 | 620 | 100.0 | 100.0 | |||||||||||||||||||
| Cambridge/Inner Suburbs | 4,419,598 | 431,483 | — | 4,851,081 | 34 | 283,863 | 98.9 | 98.9 | |||||||||||||||||||
| Longwood Medical Area | |||||||||||||||||||||||||||
| 360 Longwood Avenue (unconsolidated joint venture – 27.5% ownership) | 413,799 | — | — | 413,799 | 1 | 23,713 | 75.7 | 75.7 | |||||||||||||||||||
| Route 128 | |||||||||||||||||||||||||||
| Alexandria Park at 128 | 343,882 | — | — | 343,882 | 8 | 9,546 | 93.8 | 93.8 | |||||||||||||||||||
3 and 6/8 Preston Court, 29, 35, and 44 Hartwell Avenue, 35 and 45/47 Wiggins Avenue, and 60 Westview Street | |||||||||||||||||||||||||||
| 19 Presidential Way | 144,892 | — | — | 144,892 | 1 | 3,052 | 59.8 | 59.8 | |||||||||||||||||||
| 225 Second Avenue | 113,860 | — | — | 113,860 | 1 | 5,115 | 100.0 | 100.0 | |||||||||||||||||||
| 100 Beaver Street | 82,330 | — | — | 82,330 | 1 | 3,104 | 100.0 | 100.0 | |||||||||||||||||||
| 285 Bear Hill Road | 26,270 | — | — | 26,270 | 1 | 1,167 | 100.0 | 100.0 | |||||||||||||||||||
| Route 128 | 711,234 | — | — | 711,234 | 12 | 21,984 | 88.8 | 88.8 | |||||||||||||||||||
| Route 495 | |||||||||||||||||||||||||||
| 111 and 130 Forbes Boulevard | 155,846 | — | — | 155,846 | 2 | 1,629 | 100.0 | 100.0 | |||||||||||||||||||
| 20 Walkup Drive | 91,045 | — | — | 91,045 | 1 | 649 | 100.0 | 100.0 | |||||||||||||||||||
| 30 Bearfoot Road | 60,759 | — | — | 60,759 | 1 | 2,765 | 100.0 | 100.0 | |||||||||||||||||||
| Route 495 | 307,650 | — | — | 307,650 | 4 | 5,043 | 100.0 | 100.0 | |||||||||||||||||||
| Greater Boston | 5,852,281 | 431,483 | — | 6,283,764 | 51 | $ | 334,603 | 96.1 | % | 96.1 | % | ||||||||||||||||
RSF, annual rental revenue, and occupancy percentage include 100% of each property managed by us in North America. Annual rental revenue amounts represent amounts in effect as of March 31, 2017. | |||||||||||||||||||||||||||
| Property Listing (continued) | |
| March 31, 2017 | |
| (Dollars in thousands) | |
Market / Submarket / Address | RSF | Number of Properties | Annual Rental Revenue | Occupancy Percentage | |||||||||||||||||||||||
| Operating | Operating and Redevelopment | ||||||||||||||||||||||||||
| Operating | Development | Redevelopment | Total | ||||||||||||||||||||||||
| San Francisco | |||||||||||||||||||||||||||
| Mission Bay/SoMa | |||||||||||||||||||||||||||
| 409 and 499 Illinois Street (consolidated joint venture – 60% ownership) | 455,069 | — | — | 455,069 | 2 | $ | 28,203 | 100.0 | % | 100.0 | % | ||||||||||||||||
| 1455 and 1515 Third Street | 422,980 | — | — | 422,980 | 2 | 22,107 | 100.0 | 100.0 | |||||||||||||||||||
| 510 Townsend Street | — | 300,000 | — | 300,000 | 1 | — | — | — | |||||||||||||||||||
| 88 Bluxome Street | 232,470 | — | — | 232,470 | 1 | 3,813 | 100.0 | 100.0 | |||||||||||||||||||
| 455 Mission Bay Boulevard South | 210,398 | — | — | 210,398 | 1 | 10,105 | 100.0 | 100.0 | |||||||||||||||||||
| 1500 Owens Street (consolidated joint venture – 50.1% ownership) | 158,267 | — | — | 158,267 | 1 | 7,724 | 100.0 | 100.0 | |||||||||||||||||||
| 1700 Owens Street | 157,340 | — | — | 157,340 | 1 | 10,324 | 100.0 | 100.0 | |||||||||||||||||||
| 505 Brannan Street (consolidated joint venture – 99.6% ownership) | — | 150,000 | — | 150,000 | 1 | — | — | — | |||||||||||||||||||
| Mission Bay/SoMa | 1,636,524 | 450,000 | — | 2,086,524 | 10 | 82,276 | 100.0 | 100.0 | |||||||||||||||||||
| South San Francisco | |||||||||||||||||||||||||||
| 213, 249, 259, and 269 East Grand Avenue | 407,369 | 297,355 | — | 704,724 | 4 | 16,838 | 100.0 | 100.0 | |||||||||||||||||||
Alexandria Technology Center® – Gateway | 448,175 | — | — | 448,175 | 6 | 17,895 | 100.0 | 100.0 | |||||||||||||||||||
| 600, 630, 650, 681, 901, and 951 Gateway Boulevard | |||||||||||||||||||||||||||
| 400 and 450 East Jamie Court | 163,035 | — | — | 163,035 | 2 | 6,453 | 100.0 | 100.0 | |||||||||||||||||||
| 500 Forbes Boulevard | 155,685 | — | — | 155,685 | 1 | 6,619 | 100.0 | 100.0 | |||||||||||||||||||
| 7000 Shoreline Court | 136,395 | — | — | 136,395 | 1 | 4,582 | 100.0 | 100.0 | |||||||||||||||||||
| 341 and 343 Oyster Point Boulevard | 107,960 | — | — | 107,960 | 2 | 4,479 | 100.0 | 100.0 | |||||||||||||||||||
| 849/863 Mitten Road/866 Malcolm Road | 103,857 | — | — | 103,857 | 1 | 3,089 | 94.1 | 94.1 | |||||||||||||||||||
| South San Francisco | 1,522,476 | 297,355 | — | 1,819,831 | 17 | 59,955 | 99.6 | 99.6 | |||||||||||||||||||
| Greater Stanford | |||||||||||||||||||||||||||
| 2425 Garcia Avenue/2400/2450 Bayshore Parkway | 99,208 | — | — | 99,208 | 1 | 4,257 | 100.0 | 100.0 | |||||||||||||||||||
| 3165 Porter Drive | 91,644 | — | — | 91,644 | 1 | 3,885 | 100.0 | 100.0 | |||||||||||||||||||
| 3350 West Bayshore Road | 60,000 | — | — | 60,000 | 1 | 1,919 | 100.0 | 100.0 | |||||||||||||||||||
| 2625/2627/2631 Hanover Street | 32,074 | — | — | 32,074 | 1 | 1,651 | 100.0 | 100.0 | |||||||||||||||||||
| Greater Stanford | 282,926 | — | — | 282,926 | 4 | 11,712 | 100.0 | 100.0 | |||||||||||||||||||
| San Francisco | 3,441,926 | 747,355 | — | 4,189,281 | 31 | 153,943 | 99.8 | 99.8 | |||||||||||||||||||
| New York City | |||||||||||||||||||||||||||
| Manhattan | |||||||||||||||||||||||||||
Alexandria Center® for Life Science | 727,674 | — | — | 727,674 | 2 | 62,011 | 97.8 | 97.8 | |||||||||||||||||||
| 430 and 450 East 29th Street | |||||||||||||||||||||||||||
| New York City | 727,674 | — | — | 727,674 | 2 | $ | 62,011 | 97.8 | % | 97.8 | % | ||||||||||||||||
| RSF, annual rental revenue, and occupancy percentage include 100% of each property managed by us in North America. Annual rental revenue amounts represent amounts in effect as of March 31, 2017. | |||||||||||||||||||||||||||
| Property Listing (continued) | |
| March 31, 2017 | |
| (Dollars in thousands) | |
Market / Submarket / Address | RSF | Number of Properties | Annual Rental Revenue | Occupancy Percentage | |||||||||||||||||||||||
| Operating | Operating and Redevelopment | ||||||||||||||||||||||||||
| Operating | Development | Redevelopment | Total | ||||||||||||||||||||||||
| San Diego | |||||||||||||||||||||||||||
| Torrey Pines | |||||||||||||||||||||||||||
| ARE Spectrum | 134,274 | 202,187 | — | 336,461 | 3 | $ | 5,772 | 100.0 | % | 100.0 | % | ||||||||||||||||
| 3215 Merryfield Row, and 3013 and 3033 Science Park Road | |||||||||||||||||||||||||||
| Torrey Ridge Science Center | 294,993 | — | — | 294,993 | 3 | 11,229 | 74.3 | 74.3 | |||||||||||||||||||
| 10578, 10614, and 10628 Science Center Drive | |||||||||||||||||||||||||||
| ARE Sunrise | 234,596 | — | — | 234,596 | 3 | 9,160 | 100.0 | 100.0 | |||||||||||||||||||
10931/10933 and 10975 North Torrey Pines Road, 3010 Science Park Road, and 10996 Torreyana Road | |||||||||||||||||||||||||||
| ARE Nautilus | 223,751 | — | — | 223,751 | 4 | 9,284 | 94.4 | 94.4 | |||||||||||||||||||
| 3530 and 3550 John Hopkins Court, and 3535 and 3565 General Atomics Court | |||||||||||||||||||||||||||
| 3545 Cray Court | 116,556 | — | — | 116,556 | 1 | 4,827 | 100.0 | 100.0 | |||||||||||||||||||
| 11119 North Torrey Pines Road | 72,506 | — | — | 72,506 | 1 | 3,274 | 100.0 | 100.0 | |||||||||||||||||||
| Torrey Pines | 1,076,676 | 202,187 | — | 1,278,863 | 15 | 43,546 | 91.8 | 91.8 | |||||||||||||||||||
| University Town Center | |||||||||||||||||||||||||||
| 5200 Illumina Way | 792,687 | — | — | 792,687 | 6 | 25,371 | 100.0 | 100.0 | |||||||||||||||||||
| Campus Pointe by Alexandria (consolidated joint venture – 55% ownership) | 754,765 | — | — | 754,765 | 2 | 27,801 | 83.4 | 83.4 | |||||||||||||||||||
| 10290 and 10300 Campus Point Drive | |||||||||||||||||||||||||||
| ARE Towne Centre | 107,253 | — | 162,156 | 269,409 | 4 | 2,048 | 100.0 | 39.8 | |||||||||||||||||||
| 9363, 9373, 9393, and 9625 Towne Centre Drive | |||||||||||||||||||||||||||
| ARE Esplanade | 241,963 | — | — | 241,963 | 4 | 9,517 | 96.3 | 96.3 | |||||||||||||||||||
| 4755, 4757, and 4767 Nexus Center Drive, and 4796 Executive Drive | |||||||||||||||||||||||||||
| 9880 Campus Point Drive | 71,510 | — | — | 71,510 | 1 | 2,774 | 100.0 | 100.0 | |||||||||||||||||||
| University Town Center | 1,968,178 | — | 162,156 | 2,130,334 | 17 | 67,511 | 93.2 | 86.1 | |||||||||||||||||||
| Sorrento Mesa | |||||||||||||||||||||||||||
| 5810/5820 and 6138/6150 Nancy Ridge Drive | 138,970 | — | — | 138,970 | 2 | 3,950 | 100.0 | 100.0 | |||||||||||||||||||
| ARE Portola | 105,812 | — | — | 105,812 | 3 | 1,408 | 43.1 | 43.1 | |||||||||||||||||||
| 6175, 6225, and 6275 Nancy Ridge Drive | |||||||||||||||||||||||||||
10121 and 10151 Barnes Canyon Road | 102,392 | — | — | 102,392 | 2 | 1,987 | 100.0 | 100.0 | |||||||||||||||||||
| 7330 Carroll Road | 66,244 | — | — | 66,244 | 1 | 2,431 | 100.0 | 100.0 | |||||||||||||||||||
| 5871 Oberlin Drive | 33,817 | — | — | 33,817 | 1 | 993 | 100.0 | 100.0 | |||||||||||||||||||
| Sorrento Mesa | 447,235 | — | — | 447,235 | 9 | 10,769 | 86.5 | 86.5 | |||||||||||||||||||
| Sorrento Valley | |||||||||||||||||||||||||||
| 11025, 11035, 11045, 11055, 11065, and 11075 Roselle Street | 121,655 | — | — | 121,655 | 6 | 2,900 | 92.0 | 92.0 | |||||||||||||||||||
| 3985, 4025, 4031, and 4045 Sorrento Valley Boulevard | 103,111 | — | — | 103,111 | 4 | 1,174 | 48.2 | 48.2 | |||||||||||||||||||
| Sorrento Valley | 224,766 | — | — | 224,766 | 10 | 4,074 | 71.9 | 71.9 | |||||||||||||||||||
| I-15 Corridor | |||||||||||||||||||||||||||
| 13112 Evening Creek Drive | 109,780 | — | — | 109,780 | 1 | 2,495 | 100.0 | 100.0 | |||||||||||||||||||
| San Diego | 3,826,635 | 202,187 | 162,156 | 4,190,978 | 52 | $ | 128,395 | 91.0 | % | 87.3 | % | ||||||||||||||||
RSF, annual rental revenue, and occupancy percentage include 100% of each property managed by us in North America. Annual rental revenue amounts represent amounts in effect as of March 31, 2017. | |||||||||||||||||||||||||||
| Property Listing (continued) | |
| March 31, 2017 | |
| (Dollars in thousands) | |
Market / Submarket / Address | RSF | Number of Properties | Annual Rental Revenue | Occupancy Percentage | |||||||||||||||||||||||
| Operating | Operating and Redevelopment | ||||||||||||||||||||||||||
| Operating | Development | Redevelopment | Total | ||||||||||||||||||||||||
| Seattle | |||||||||||||||||||||||||||
| Lake Union | |||||||||||||||||||||||||||
| 400 Dexter Avenue North | 241,276 | 48,835 | — | 290,111 | 1 | $ | 12,619 | 100.0 | % | 100.0 | % | ||||||||||||||||
| 1201 and 1208 Eastlake Avenue East | 203,369 | — | — | 203,369 | 2 | 8,748 | 100.0 | 100.0 | |||||||||||||||||||
| 1616 Eastlake Avenue East | 168,708 | — | — | 168,708 | 1 | 8,396 | 95.4 | 95.4 | |||||||||||||||||||
| 1551 Eastlake Avenue East | 117,482 | — | — | 117,482 | 1 | 4,778 | 100.0 | 100.0 | |||||||||||||||||||
| 199 East Blaine Street | 115,084 | — | — | 115,084 | 1 | 6,188 | 100.0 | 100.0 | |||||||||||||||||||
| 219 Terry Avenue North | 30,705 | — | — | 30,705 | 1 | 1,750 | 100.0 | 100.0 | |||||||||||||||||||
| 1600 Fairview Avenue East | 27,991 | — | — | 27,991 | 1 | 1,138 | 100.0 | 100.0 | |||||||||||||||||||
| Lake Union | 904,615 | 48,835 | — | 953,450 | 8 | 43,617 | 99.1 | 99.1 | |||||||||||||||||||
| Elliott Bay | |||||||||||||||||||||||||||
| 3000/3018 Western Avenue | 47,746 | — | — | 47,746 | 1 | 1,839 | 100.0 | 100.0 | |||||||||||||||||||
| 410 West Harrison Street and 410 Elliott Avenue West | 36,724 | — | — | 36,724 | 2 | 1,028 | 71.1 | 71.1 | |||||||||||||||||||
| Elliott Bay | 84,470 | — | — | 84,470 | 3 | 2,867 | 87.5 | 87.5 | |||||||||||||||||||
| Seattle | 989,085 | 48,835 | — | 1,037,920 | 11 | 46,484 | 98.2 | 98.2 | |||||||||||||||||||
| Maryland | |||||||||||||||||||||||||||
| Rockville | |||||||||||||||||||||||||||
| 9800 Medical Center Drive | 282,436 | — | — | 282,436 | 4 | 12,573 | 100.0 | 100.0 | |||||||||||||||||||
| 1330 Piccard Drive | 131,511 | — | — | 131,511 | 1 | 2,433 | 75.7 | 75.7 | |||||||||||||||||||
| 1500 and 1550 East Gude Drive | 90,489 | — | — | 90,489 | 2 | 1,681 | 100.0 | 100.0 | |||||||||||||||||||
| 14920 and 15010 Broschart Road | 86,703 | — | — | 86,703 | 2 | 2,078 | 100.0 | 100.0 | |||||||||||||||||||
| 1405 Research Boulevard | 71,669 | — | — | 71,669 | 1 | 2,104 | 100.0 | 100.0 | |||||||||||||||||||
| 5 Research Place | 63,852 | — | — | 63,852 | 1 | 2,390 | 100.0 | 100.0 | |||||||||||||||||||
| 9920 Medical Center Drive | 58,733 | — | — | 58,733 | 1 | 455 | 100.0 | 100.0 | |||||||||||||||||||
| 5 Research Court | 54,906 | — | — | 54,906 | 1 | — | — | — | |||||||||||||||||||
| 12301 Parklawn Drive | 49,185 | — | — | 49,185 | 1 | 1,329 | 100.0 | 100.0 | |||||||||||||||||||
| Rockville | 889,484 | — | — | 889,484 | 14 | 25,043 | 90.2 | 90.2 | |||||||||||||||||||
| Gaithersburg | |||||||||||||||||||||||||||
Alexandria Technology Center® – Gaithersburg I | 377,401 | — | — | 377,401 | 4 | 7,225 | 82.3 | 82.3 | |||||||||||||||||||
| 9 West Watkins Mill Road and 910, 930, and 940 Clopper Road | |||||||||||||||||||||||||||
Alexandria Technology Center® – Gaithersburg II | 237,137 | — | — | 237,137 | 5 | 6,131 | 100.0 | 100.0 | |||||||||||||||||||
708 Quince Orchard Road, 1300 Quince Orchard Boulevard, and 19, 20, and 22 Firstfield Road | |||||||||||||||||||||||||||
| 401 Professional Drive | 63,154 | — | — | 63,154 | 1 | 1,438 | 100.0 | 100.0 | |||||||||||||||||||
| 950 Wind River Lane | 50,000 | — | — | 50,000 | 1 | 1,082 | 100.0 | 100.0 | |||||||||||||||||||
| 620 Professional Drive | 27,950 | — | — | 27,950 | 1 | 1,191 | 100.0 | 100.0 | |||||||||||||||||||
| Gaithersburg | 755,642 | — | — | 755,642 | 12 | 17,067 | 91.2 | 91.2 | |||||||||||||||||||
| Beltsville | |||||||||||||||||||||||||||
| 8000/9000/10000 Virginia Manor Road | 191,884 | — | — | 191,884 | 1 | 2,463 | 100.0 | 100.0 | |||||||||||||||||||
| Northern Virginia | |||||||||||||||||||||||||||
| 14225 Newbrook Drive | 248,186 | — | — | 248,186 | 1 | 5,138 | 100.0 | 100.0 | |||||||||||||||||||
| Maryland | 2,085,196 | — | — | 2,085,196 | 28 | $ | 49,711 | 92.6 | % | 92.6 | % | ||||||||||||||||
RSF, annual rental revenue, and occupancy percentage include 100% of each property managed by us in North America. Annual rental revenue amounts represent amounts in effect as of March 31, 2017. | |||||||||||||||||||||||||||
| Property Listing (continued) | |
| March 31, 2017 | |
| (Dollars in thousands) | |
Market / Submarket / Address | RSF | Number of Properties | Annual Rental Revenue | Occupancy Percentage | |||||||||||||||||||||||
| Operating | Operating and Redevelopment | ||||||||||||||||||||||||||
| Operating | Development | Redevelopment | Total | ||||||||||||||||||||||||
| Research Triangle Park | |||||||||||||||||||||||||||
| Research Triangle Park | |||||||||||||||||||||||||||
Alexandria Technology Center® – Alston | 186,870 | — | — | 186,870 | 3 | $ | 3,409 | 93.0 | % | 93.0 | % | ||||||||||||||||
| 100, 800, and 801 Capitola Drive | |||||||||||||||||||||||||||
| 108/110/112/114 TW Alexander Drive | 158,417 | — | — | 158,417 | 1 | 4,607 | 100.0 | 100.0 | |||||||||||||||||||
Alexandria Innovation Center® – Research Triangle Park | 135,677 | — | — | 135,677 | 3 | 3,339 | 99.1 | 99.1 | |||||||||||||||||||
| 7010, 7020, and 7030 Kit Creek Road | |||||||||||||||||||||||||||
| 6 Davis Drive | 100,000 | — | — | 100,000 | 1 | 1,272 | 88.5 | 88.5 | |||||||||||||||||||
| 7 Triangle Drive | 96,626 | — | — | 96,626 | 1 | 3,156 | 100.0 | 100.0 | |||||||||||||||||||
| 407 Davis Drive | 81,956 | — | — | 81,956 | 1 | 1,644 | 100.0 | 100.0 | |||||||||||||||||||
| 2525 East NC Highway 54 | 82,996 | — | — | 82,996 | 1 | 1,690 | 100.0 | 100.0 | |||||||||||||||||||
| 601 Keystone Park Drive | 77,395 | — | — | 77,395 | 1 | 1,379 | 100.0 | 100.0 | |||||||||||||||||||
| 6040 George Watts Hill Drive | 61,547 | — | — | 61,547 | 1 | 2,051 | 100.0 | 100.0 | |||||||||||||||||||
| 5 Triangle Drive | 32,120 | — | — | 32,120 | 1 | 689 | 100.0 | 100.0 | |||||||||||||||||||
| 6101 Quadrangle Drive | 30,122 | — | — | 30,122 | 1 | 539 | 100.0 | 100.0 | |||||||||||||||||||
| Research Triangle Park | 1,043,726 | — | — | 1,043,726 | 15 | 23,775 | 97.5 | 97.5 | |||||||||||||||||||
| Canada | 256,967 | — | — | 256,967 | 3 | 6,474 | 99.2 | 99.2 | |||||||||||||||||||
| Non-cluster markets | 268,689 | — | — | 268,689 | 6 | 6,052 | 88.4 | 88.4 | |||||||||||||||||||
| Total – North America | 18,492,179 | 1,429,860 | 162,156 | 20,084,195 | 199 | $ | 811,448 | 95.5 | % | 94.7 | % | ||||||||||||||||
RSF, annual rental revenue, and occupancy percentage include 100% of each property managed by us in North America. Annual rental revenue amounts represent amounts in effect as of March 31, 2017. | |||||||||||||||||||||||||||
| Incremental Annual Net Operating Income from Development and Redevelopment of New Class A Properties | | |
| March 31, 2017 | ||
| (1) | Represents incremental annual net operating income upon stabilization of our development and redevelopment of new Class A properties, including only our share of real estate joint venture projects. RSF and percentage leased represent 100% of each property. |
| (2) | Delivery of 2016 projects were primarily weighted toward 4Q16. |
| |
| Green Building, Sustainability, and Health and Wellness | |
| March 31, 2017 | |
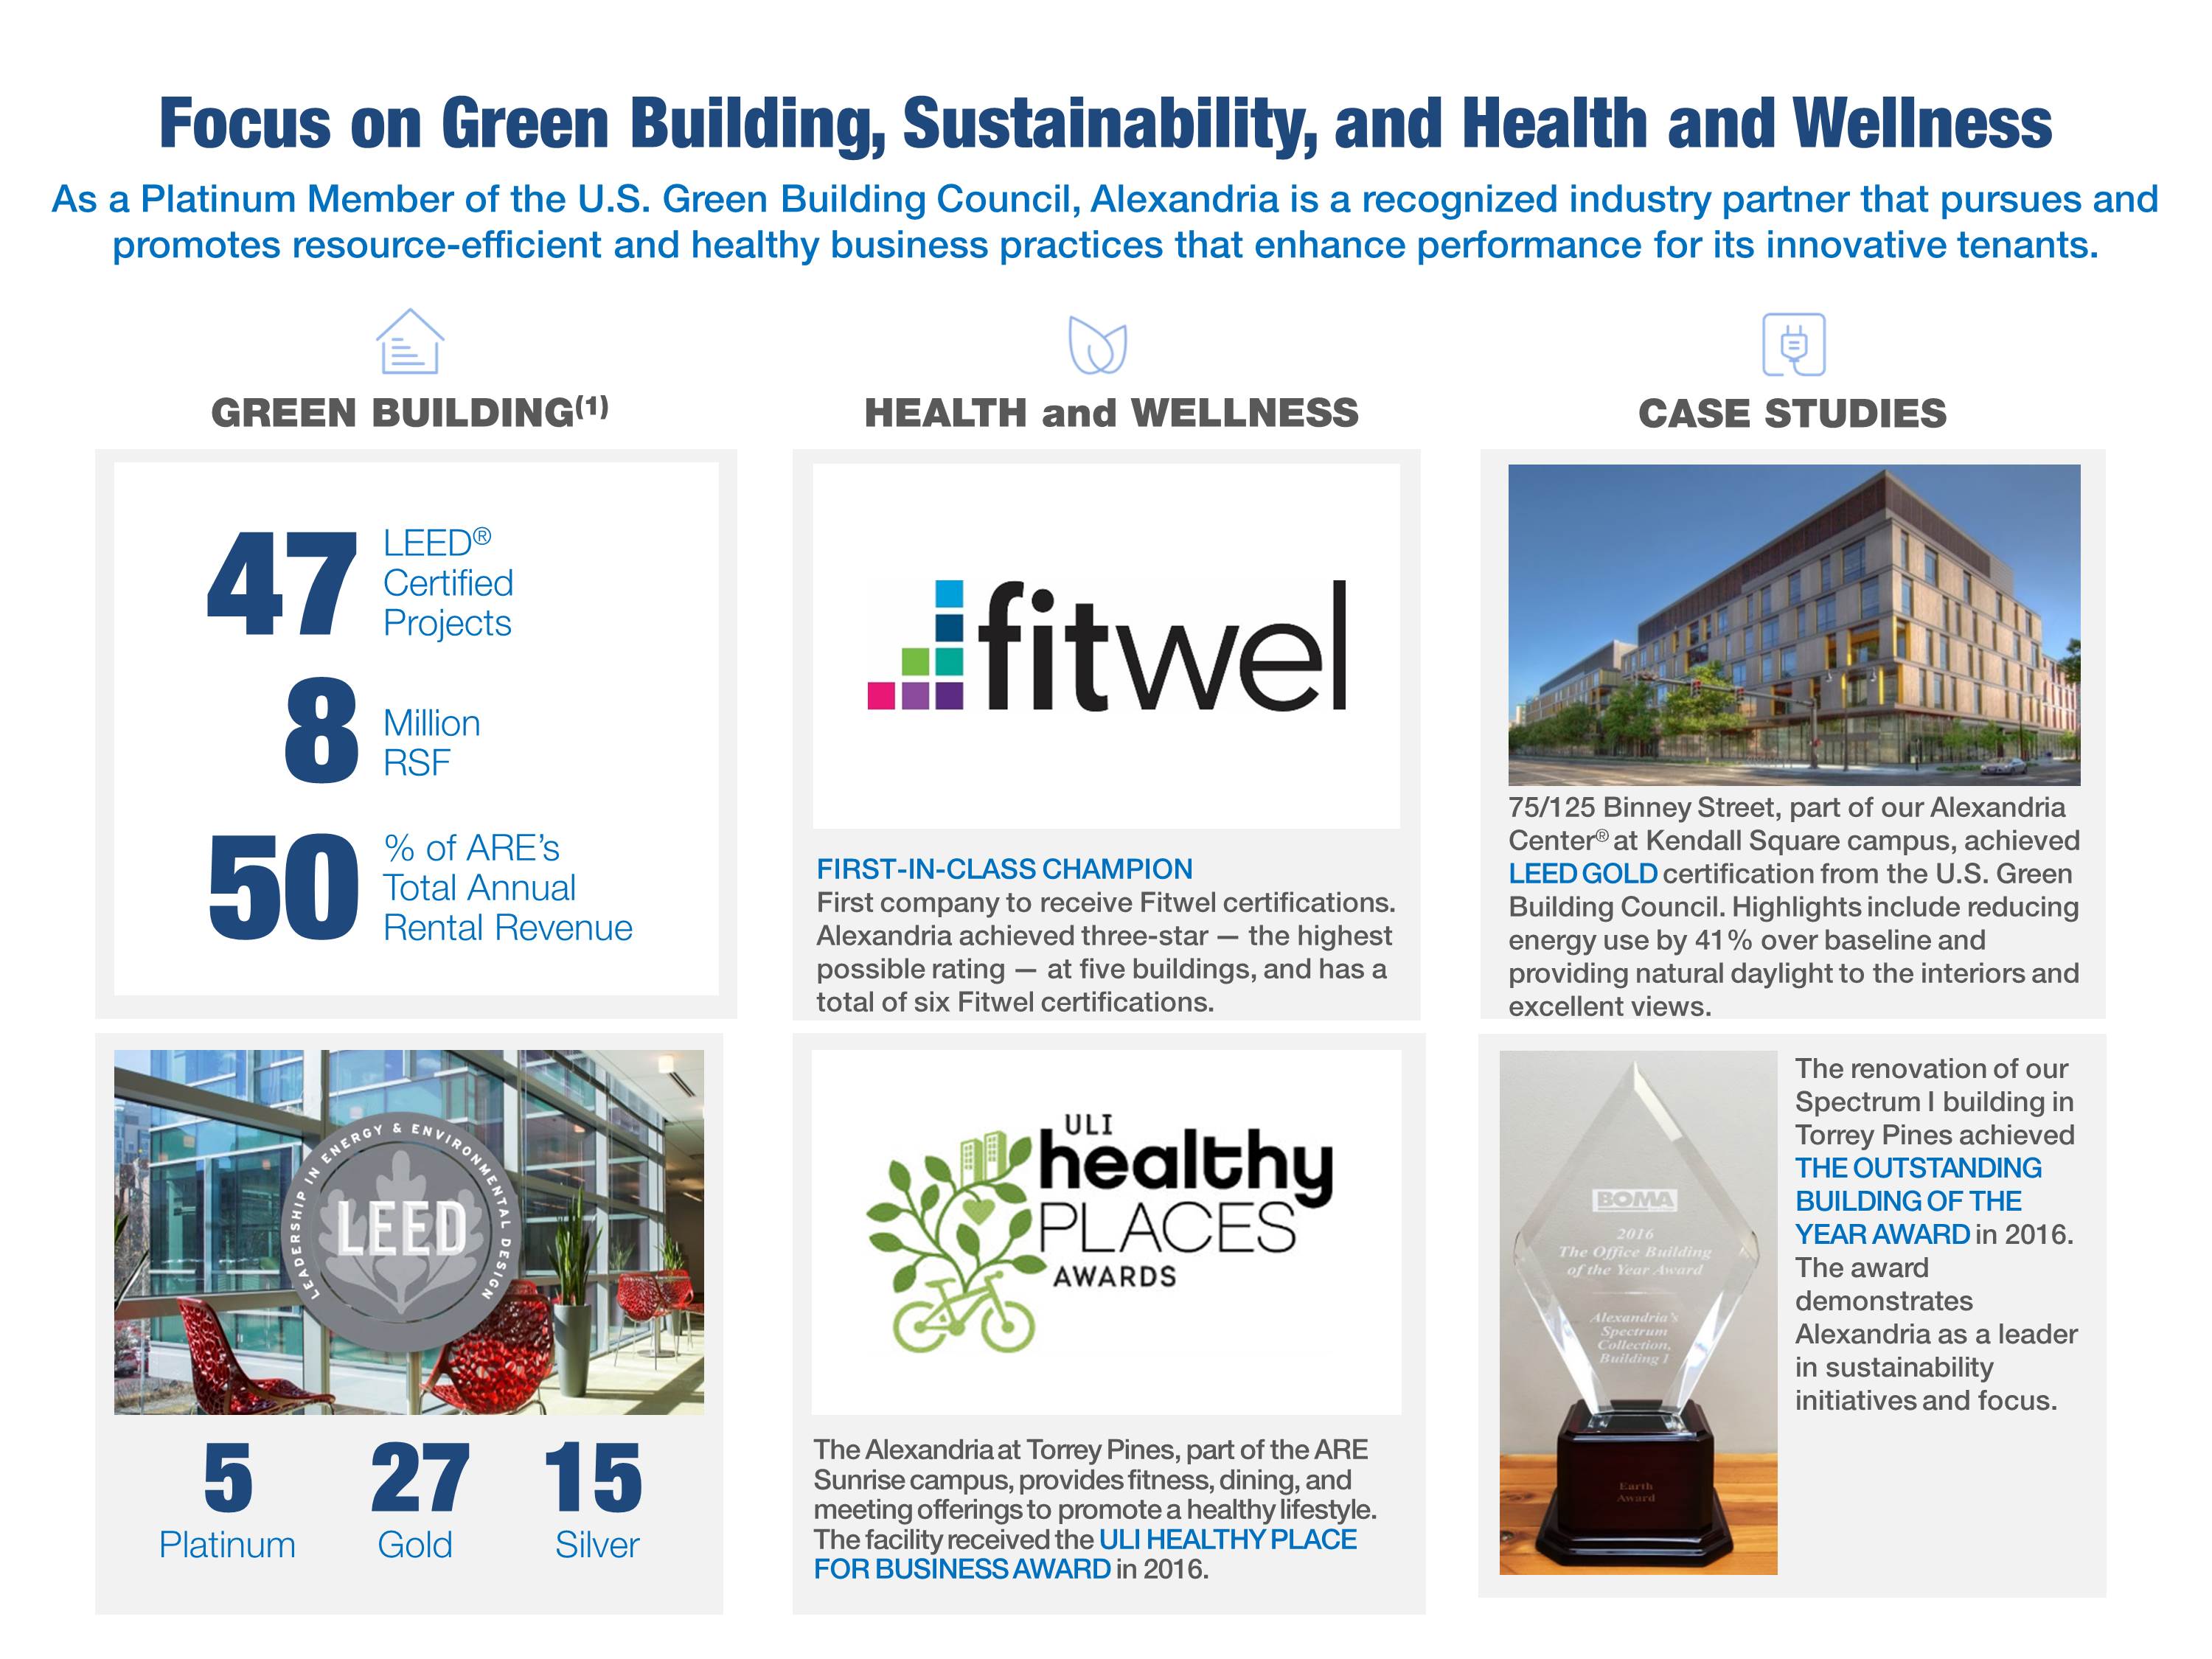
(1) Upon completion of 14 in-process LEED certified projects.
| Investments in Real Estate | |
| March 31, 2017 | |
| (Dollars in thousands, except per SF amounts) | |
| Investments in Real Estate | Occupancy/ Percentage Leased | Square Feet | |||||||||||||||||
| Consolidated | Unconsolidated | Total | |||||||||||||||||
| Investments in real estate – North America: | |||||||||||||||||||
| Rental properties | $ | 9,801,318 | 95.5 | % | 18,078,380 | 413,799 | 18,492,179 | ||||||||||||
| Development and redevelopment of New Class A Properties: | |||||||||||||||||||
| 2017 deliveries | 675,206 | 83.0 | % | 79.0% | 1,132,505 | — | 1,132,505 | ||||||||||||
| 2018 and 2019 deliveries | |||||||||||||||||||
| Undergoing construction | 69,015 | 65.0 | % | 459,511 | — | 459,511 | |||||||||||||
| Marketing and pre-construction | 91,872 | N/A | 1,473,634 | — | 1,473,634 | ||||||||||||||
| 2019 and beyond – near-term developments | 111,113 | N/A | 2,010,009 | — | 2,010,009 | ||||||||||||||
| Future development projects | 309,343 | N/A | 4,608,942 | — | 4,608,942 | ||||||||||||||
| Gross investments in real estate – North America | 11,057,867 | 27,762,981 | 413,799 | 28,176,780 | |||||||||||||||
| Less: accumulated depreciation | (1,623,228 | ) | |||||||||||||||||
| Net investments in real estate – North America | 9,434,639 | ||||||||||||||||||
| Net investments in real estate – Asia | 36,028 | ||||||||||||||||||
| Investments in real estate | $ | 9,470,667 | |||||||||||||||||
| Solid Pre-Leasing of Ground-Up Developments | |
| March 31, 2017 | |
| (Dollars in thousands) | |
Solid Pre-Leased Percentage: 5.2 Million RSF of Ground-Up Developments Commenced Since January 1, 2009
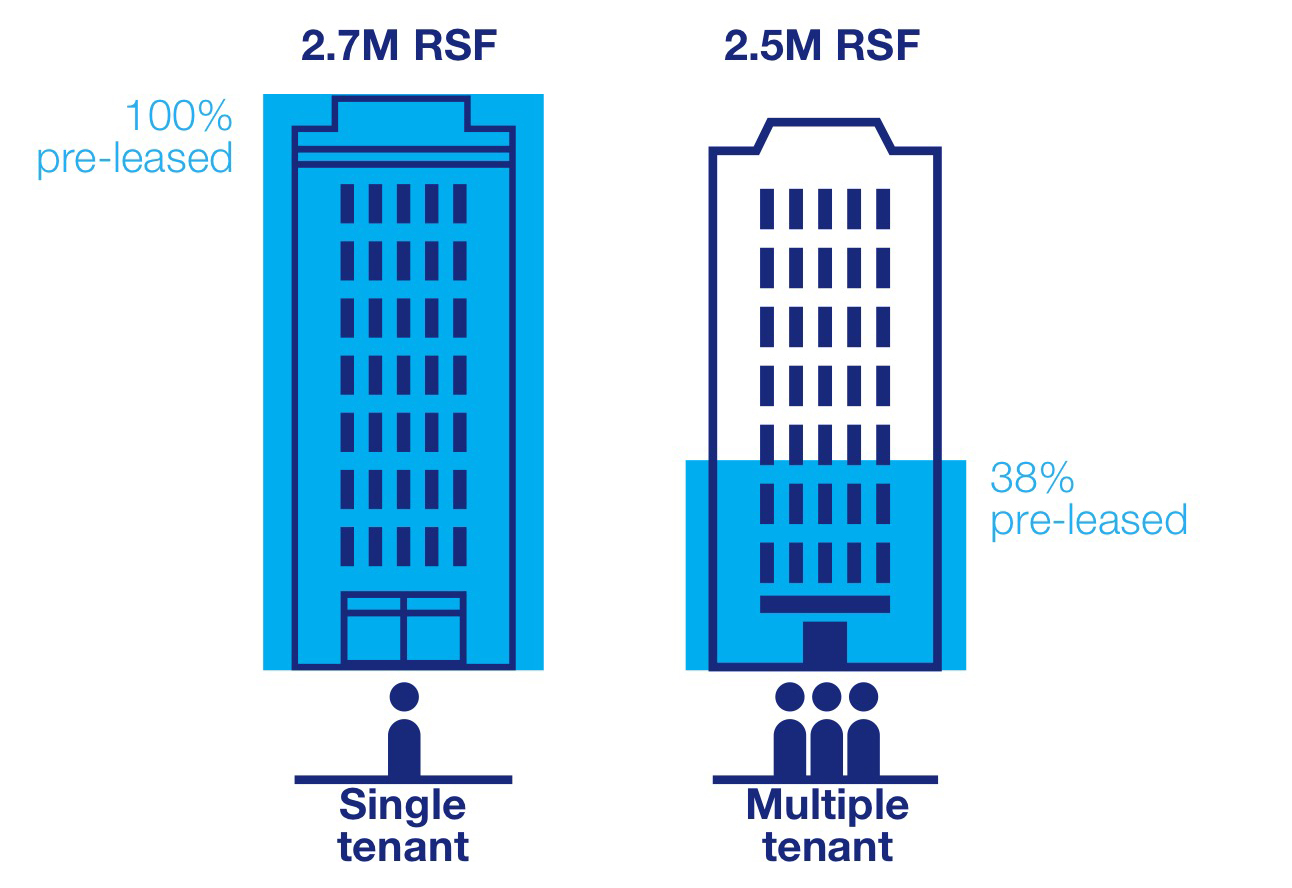
| Development and Redevelopment of New Class A Properties: Recently Placed into Service (Trailing 12 Months) | | |
| March 31, 2017 | ||
| 50 Binney Street | 60 Binney Street | 11 Hurley Street | 1455 and 1515 Third Street | 430 East 29th Street | ||||
| Greater Boston/Cambridge | Greater Boston/Cambridge | Greater Boston/Cambridge | San Francisco/Mission Bay/SoMa | New York City/Manhattan | ||||
| 274,734 RSF | 255,743 RSF | 59,783 RSF | 422,980 RSF | 418,639 RSF | ||||
| Sanofi Genzyme | bluebird bio, Inc. | Editas Medicine, Inc. | Uber Technologies, Inc. | Roche/New York University/Others | ||||
 |  |  |  |  | ||||
| ARE Spectrum | 10290 Campus Point Drive | 5200 Illumina Way, Building 6 | 4796 Executive Drive | 400 Dexter Avenue North | ||||
| San Diego/Torrey Pines | San Diego/University Town Center | San Diego/University Town Center | San Diego/University Town Center | Seattle/Lake Union | ||||
| 31,336 RSF | 305,006 RSF | 295,609 RSF | 61,755 RSF | 241,276 RSF | ||||
| The Medicines Company | Eli Lilly and Company | Illumina, Inc. | Otonomy, Inc. | Juno Therapeutics, Inc. | ||||
 |  |  |  |  | ||||
| Development and Redevelopment of New Class A Properties: Recently Placed into Service (Trailing 12 Months) (continued) | |
| March 31, 2017 | |
| (Dollars in thousands) | |
| Property/Market/Submarket | Our Ownership Interest | Date Delivered | RSF in Service | Total Project | Unlevered Yields | ||||||||||||||||||||||||||||||||||||||||
| Prior to 4/1/16 | Placed into Service | Total | Average Cash | Initial Stabilized Cash Basis | Initial Stabilized | ||||||||||||||||||||||||||||||||||||||||
| 2Q16 | 3Q16 | 4Q16 | 1Q17 | Leased | RSF | Investment | |||||||||||||||||||||||||||||||||||||||
| Consolidated development projects | |||||||||||||||||||||||||||||||||||||||||||||
50 and 60 Binney Street/ Greater Boston/Cambridge | 100% | 9/30/16 | — | — | 530,477 | — | — | 530,477 | 99% | 530,477 | $ | 474,000 | 8.6 | % | 7.7 | % | 7.9 | % | |||||||||||||||||||||||||||
1455 and 1515 Third Street/ San Francisco/Mission Bay/SoMa | 100% | 11/10/16 | — | — | — | 422,980 | — | 422,980 | 100% | 422,980 | $ | 155,000 | 14.5 | % | 7.0 | % | 14.4 | % | |||||||||||||||||||||||||||
430 East 29th Street/ New York City/ Manhattan | 100% | Various | 356,044 | 62,595 | — | — | — | 418,639 | 100% | 418,639 | $ | 471,000 | 7.6 | % | 7.0 | % | 7.1 | % | |||||||||||||||||||||||||||
ARE Spectrum/San Diego/ Torrey Pines | 100% | Various | 102,938 | — | — | — | 31,336 | 134,274 | 98% | 336,461 | $ | 278,000 | 6.9 | % | 6.1 | % | 6.4 | % | |||||||||||||||||||||||||||
5200 Illumina Way, Building 6/ San Diego/University Town Center | 100% | 6/20/16 | — | 295,609 | — | — | — | 295,609 | 100% | 295,609 | $ | 68,000 | 8.8 | % | 7.2 | % | 8.6 | % | |||||||||||||||||||||||||||
| 4796 Executive Drive/ San Diego/University Town Center | 100% | 12/1/16 | — | — | — | 61,755 | — | 61,755 | 100% | 61,755 | $ | 41,000 | 8.0 | % | 7.0 | % | 7.4 | % | |||||||||||||||||||||||||||
400 Dexter Avenue North/Seattle/ Lake Union | 100% | 3/31/17 | — | — | — | — | 241,276 | 241,276 | 89% | 290,111 | $ | 232,000 | 7.3 | % | 6.9 | % | 7.2 | % | |||||||||||||||||||||||||||
| Consolidated redevelopment projects | |||||||||||||||||||||||||||||||||||||||||||||
11 Hurley Street/ Greater Boston/Cambridge | 100% | 9/29/16 | — | — | 59,783 | — | — | 59,783 | 100% | 59,783 | $ | 36,500 | 9.8 | % | 8.8 | % | 9.7 | % | |||||||||||||||||||||||||||
| 10290 Campus Point Drive/ San Diego/University Town Center | 55% | 12/2/16 | — | — | — | 305,006 | — | 305,006 | 100% | 305,006 | $ | 231,000 | 7.7 | % | 6.8 | % | 7.1 | % | |||||||||||||||||||||||||||
| Unconsolidated joint venture development project | |||||||||||||||||||||||||||||||||||||||||||||
360 Longwood Avenue/ Greater Boston/ Longwood Medical Area | 27.5% | Various | 262,367 | 51,040 | — | 100,392 | — | 413,799 | 80% | 413,799 | $ | 108,965 | 8.2 | % | 7.3 | % | 7.8 | % | |||||||||||||||||||||||||||
| Total | 721,349 | 409,244 | 590,260 | 890,133 | 272,612 | 2,883,598 | |||||||||||||||||||||||||||||||||||||||
| Development of New Class A Properties: 2017 Deliveries (Undergoing Construction) | |
| March 31, 2017 | |
| (Dollars in thousands) | |
| 100 Binney Street | 510 Townsend Street | 505 Brannan Street, Phase I | ARE Spectrum | 400 Dexter Avenue North | ||||
| Greater Boston/Cambridge | San Francisco/Mission Bay/SoMa | San Francisco/Mission Bay/SoMa | San Diego/Torrey Pines | Seattle/Lake Union | ||||
| 431,483 RSF | 300,000 RSF | 150,000 RSF | 202,187 RSF | 48,835 RSF | ||||
| Bristol-Myers Squibb Company | Stripe, Inc. | Pinterest, Inc. | Celgene Corporation Vertex Pharmaceuticals Incorporated Wellspring Biosciences LLC | Juno Therapeutics, Inc. ClubCorp Holdings, Inc. | ||||
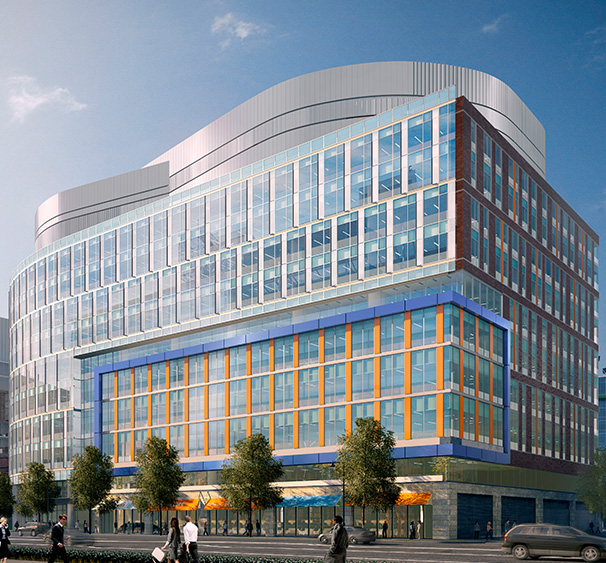 | 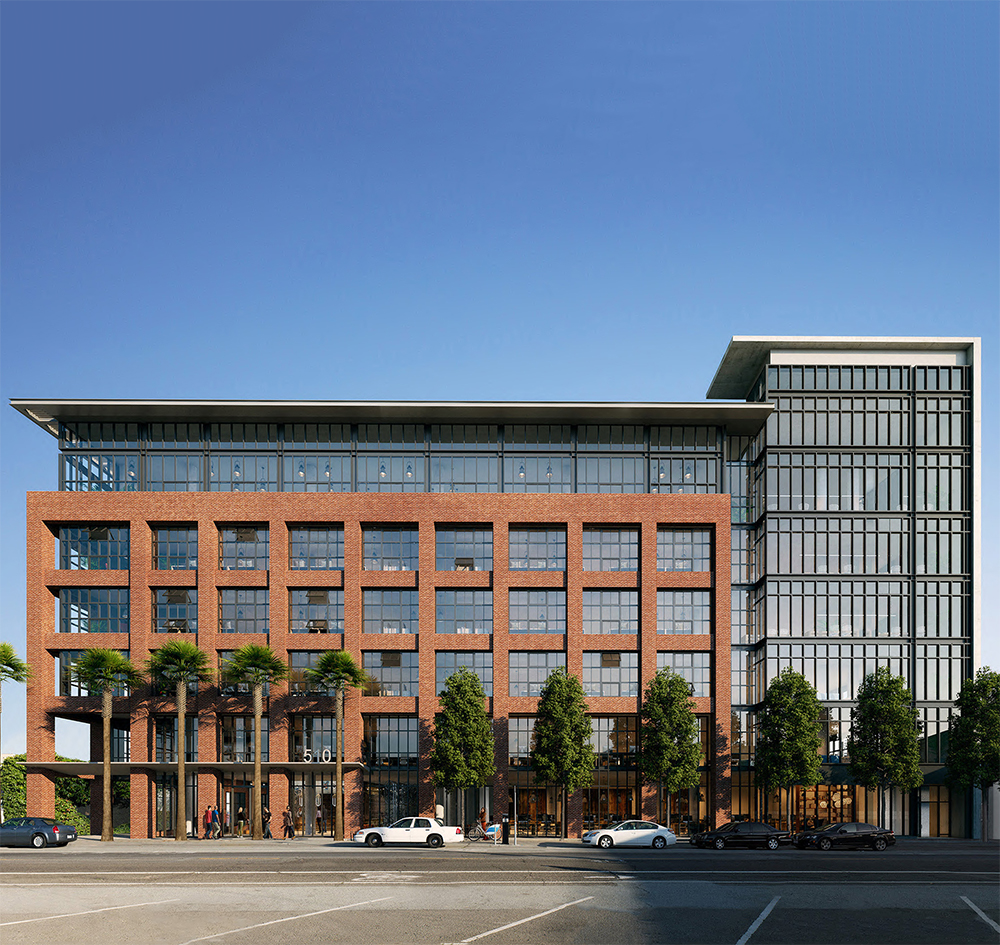 | 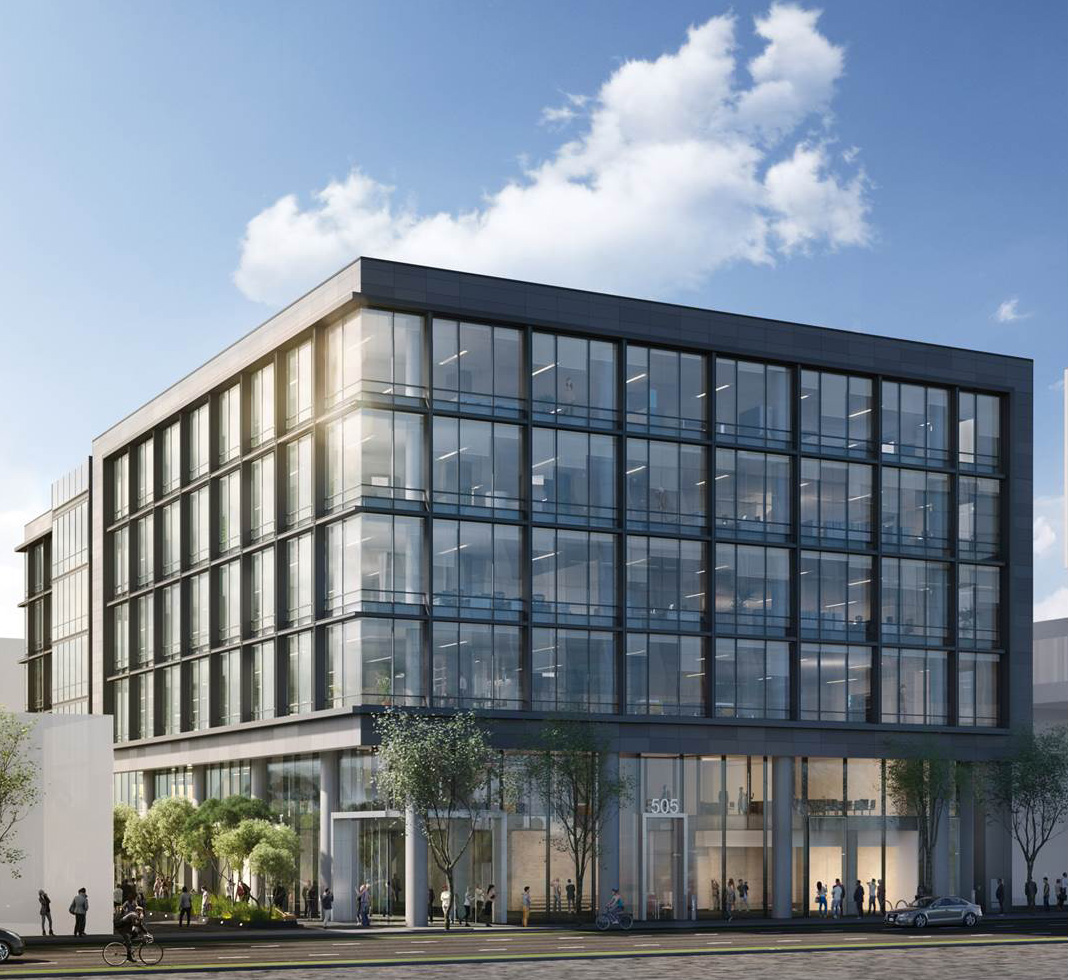 | | | ||||
| Property/Market/Submarket | Project RSF | Percentage | Project Start | Occupancy | ||||||||||||||||||
| In Service | CIP | Total | Leased | Negotiating | Total | Initial | Stabilized | |||||||||||||||
| ARE Spectrum/San Diego/Torrey Pines | 134,274 | 202,187 | 336,461 | 98 | % | — | % | 98 | % | 2Q16 | 1Q17 | 4Q17 | ||||||||||
| 400 Dexter Avenue North/Seattle/Lake Union | 241,276 | 48,835 | 290,111 | 89 | % | 11 | % | 100 | % | 2Q15 | 1Q17 | 4Q17 | ||||||||||
| 5200 Illumina Way, Parking Structure/San Diego/University Town Center | — | N/A | N/A | �� | 100 | % | — | % | 100 | % | 2Q16 | 2Q17 | 2Q17 | |||||||||
| 510 Townsend Street/San Francisco/Mission Bay/SoMa | — | 300,000 | 300,000 | 100 | % | — | % | 100 | % | 3Q15 | 4Q17 | 4Q17 | ||||||||||
| 100 Binney Street/Greater Boston/Cambridge | — | 431,483 | 431,483 | 48 | % | 47 | % | 95 | % | 3Q15 | 4Q17 | 4Q17 | ||||||||||
| 505 Brannan Street, Phase I/San Francisco/Mission Bay/SoMa | — | 150,000 | 150,000 | 100 | % | — | % | 100 | % | 1Q16 | 4Q17 | 4Q17 | ||||||||||
| Total | 375,550 | 1,132,505 | 1,508,055 | 83 | % | 15 | % | 98 | % | |||||||||||||
| Property/Market/Submarket | Our Ownership Interest | In Service | CIP | Cost to Complete | Total at Completion | Unlevered Yields | |||||||||||||||||||||
Average Cash | Initial Stabilized Cash Basis | Initial Stabilized | |||||||||||||||||||||||||
| ARE Spectrum/San Diego/Torrey Pines | 100% | $ | 88,115 | $ | 106,506 | $ | 83,379 | $ | 278,000 | 6.9% | 6.1% | 6.4% | |||||||||||||||
| 400 Dexter Avenue North/Seattle/Lake Union | 100% | 160,862 | 28,296 | 42,842 | 232,000 | 7.3% | 6.9% | 7.2% | |||||||||||||||||||
| 5200 Illumina Way, Parking Structure/San Diego/University Town Center | 100% | — | 34,761 | 35,239 | 70,000 | 7.0% | 7.0% | 7.0% | |||||||||||||||||||
| 510 Townsend Street/San Francisco/Mission Bay/SoMa | 100% | — | 131,955 | 106,045 | 238,000 | 7.9% | 7.0% | 7.2% | |||||||||||||||||||
| 100 Binney Street/Greater Boston/Cambridge | 100% | 11,555 | 296,917 | 226,528 | 535,000 | 7.9% | 7.0% | 7.7% | |||||||||||||||||||
| 505 Brannan Street, Phase I/San Francisco/Mission Bay/SoMa | 99.6% | — | 76,771 | 64,229 | 141,000 | 8.6% | 7.0% | 8.2% | |||||||||||||||||||
| Total | $ | 260,532 | $ | 675,206 | $ | 558,262 | $ | 1,494,000 | |||||||||||||||||||
Development and Redevelopment of New Class A Properties: 2018 & 2019 Deliveries (Including Marketing and Pre-Construction Projects) | | |
| March 31, 2017 | ||
| 399 Binney Street | 161 First Street | 1655 and 1715 Third Street | 213 East Grand Avenue | |||
| Greater Boston/Cambridge | Greater Boston/Cambridge | San Francisco/Mission Bay/SoMa | San Francisco/South San Francisco | |||
| 172,500 SF | 183,644 SF | 580,000 SF | 297,355 RSF | |||
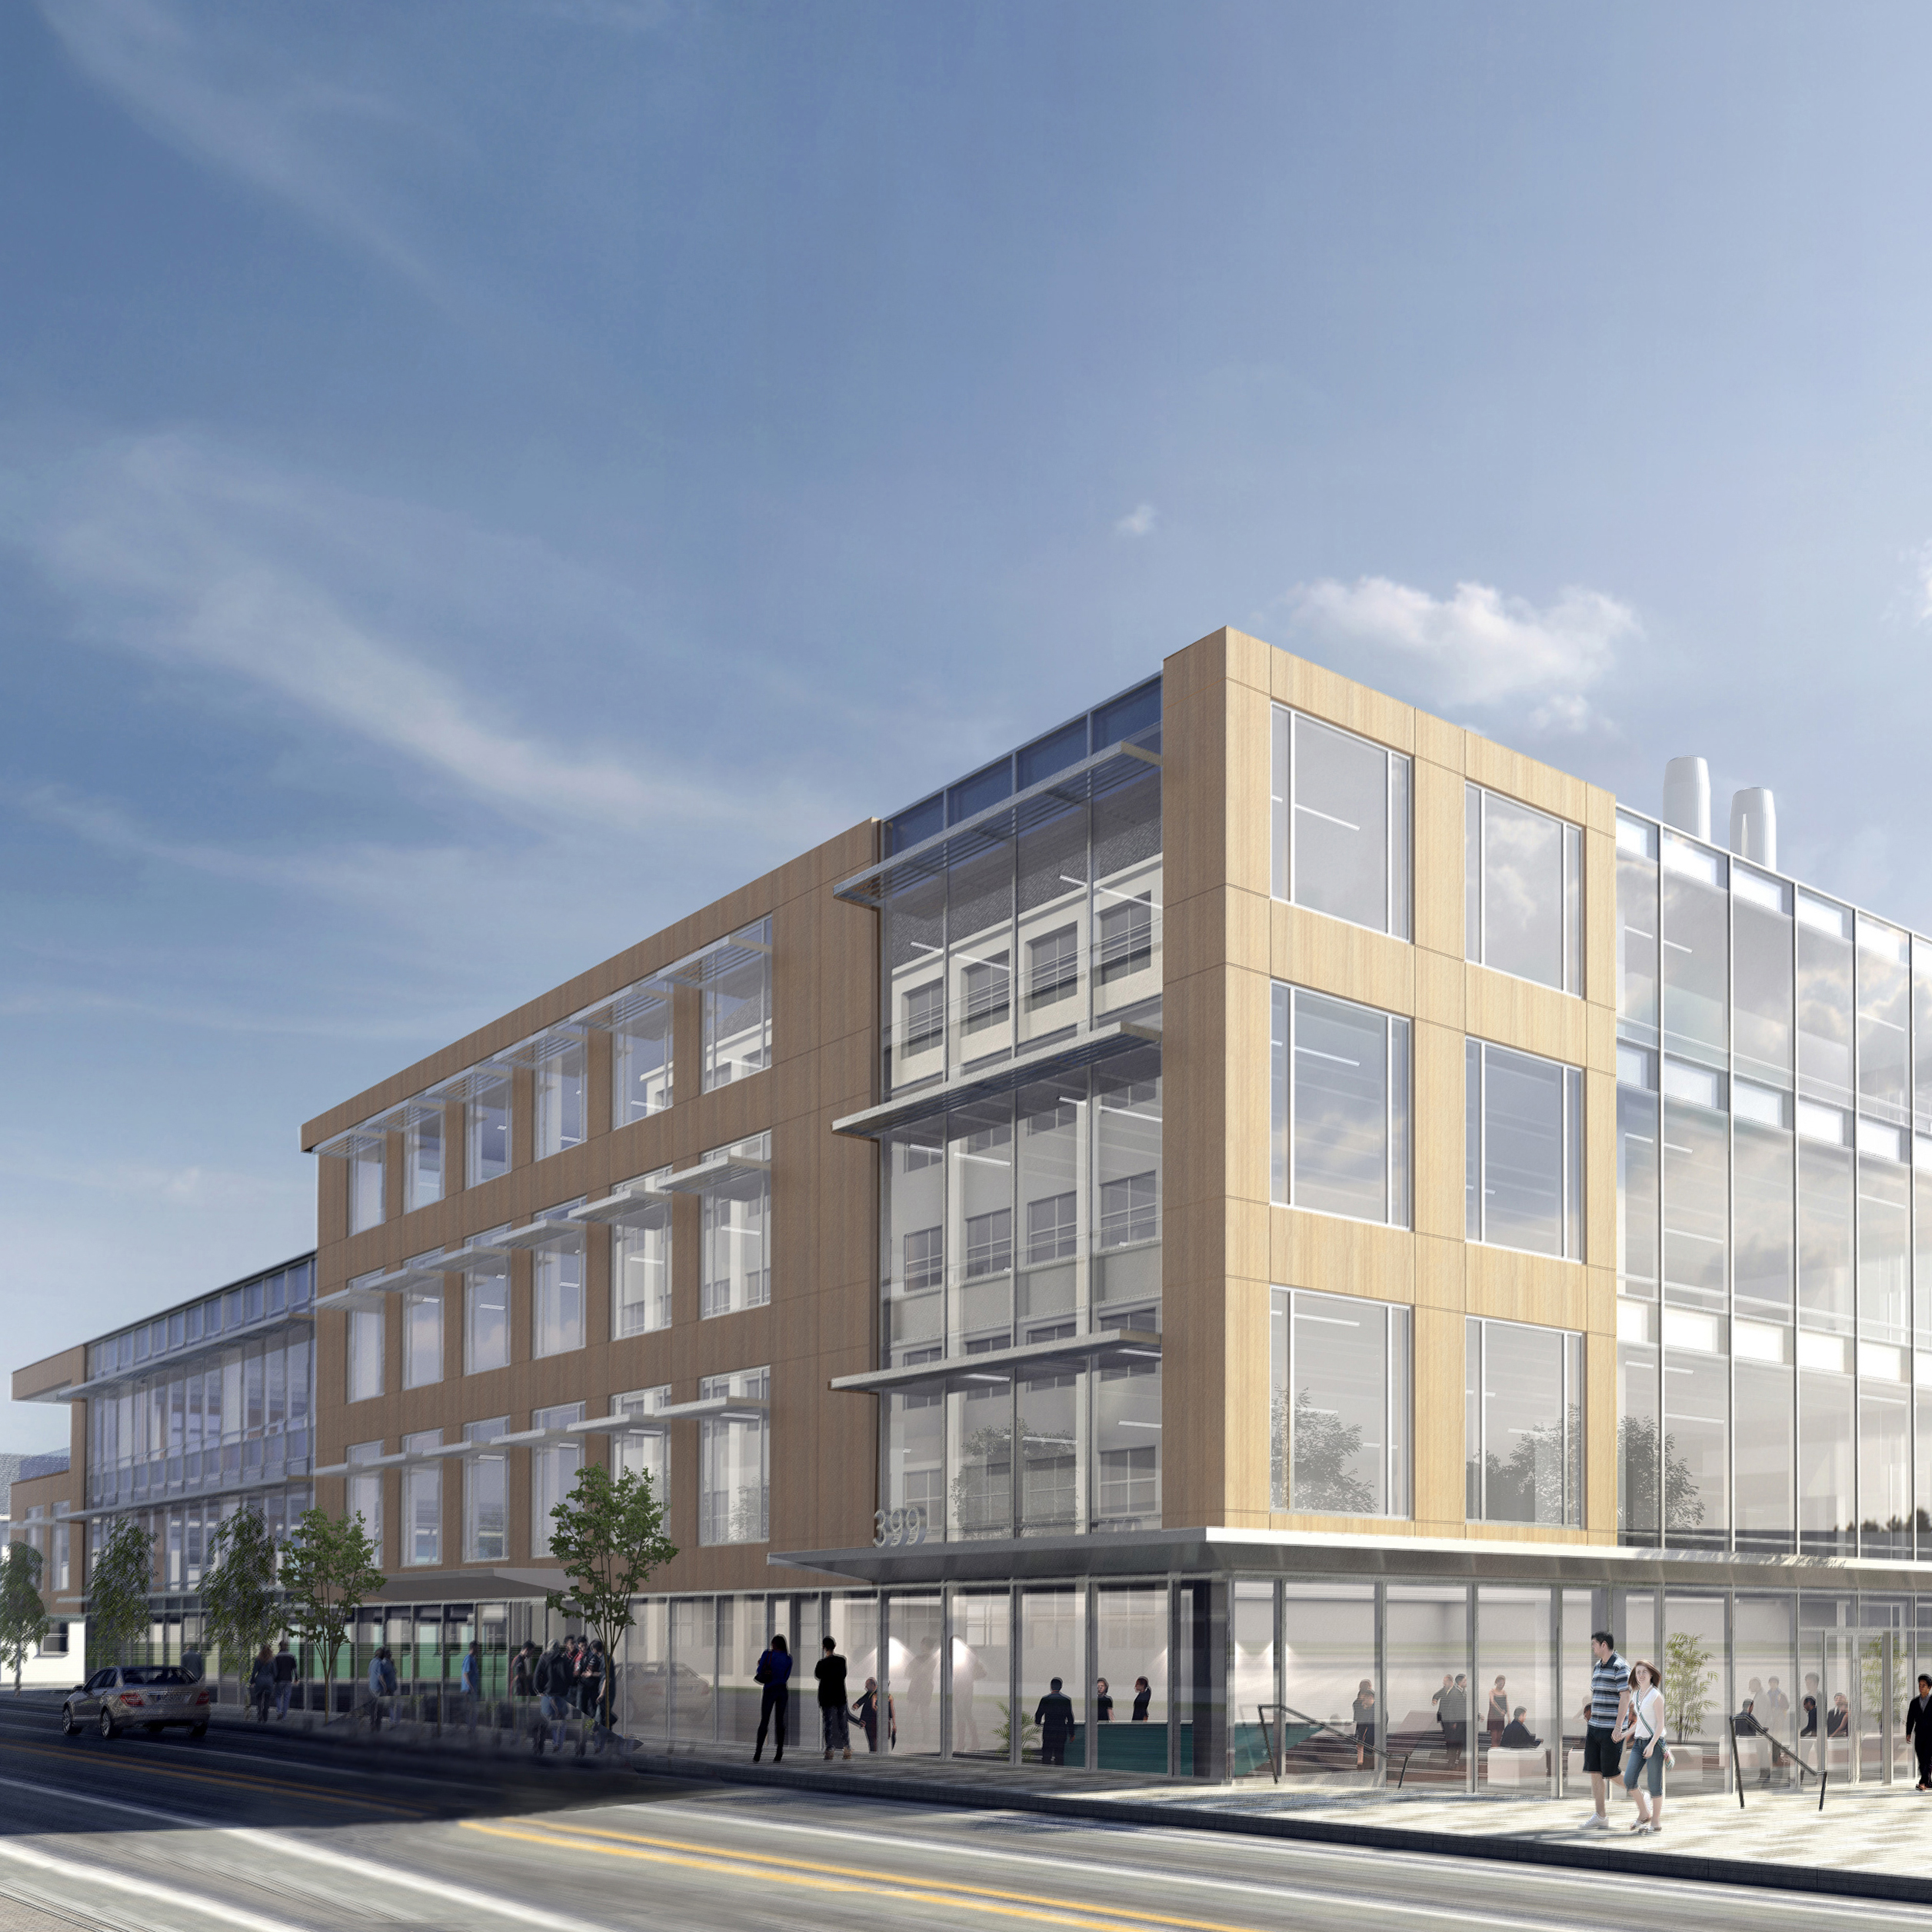 |  |  |  | |||
| 279 East Grand Avenue | 9625 Towne Centre Drive | 1818 Fairview Avenue East | 3054 Cornwallis Road | ||||
| San Francisco/South San Francisco | San Diego/University Town Center | Seattle/Lake Union | Research Triangle Park/RTP | ||||
| 199,000 SF | 162,156 SF | 188,490 SF | 150,000 SF | ||||
 | 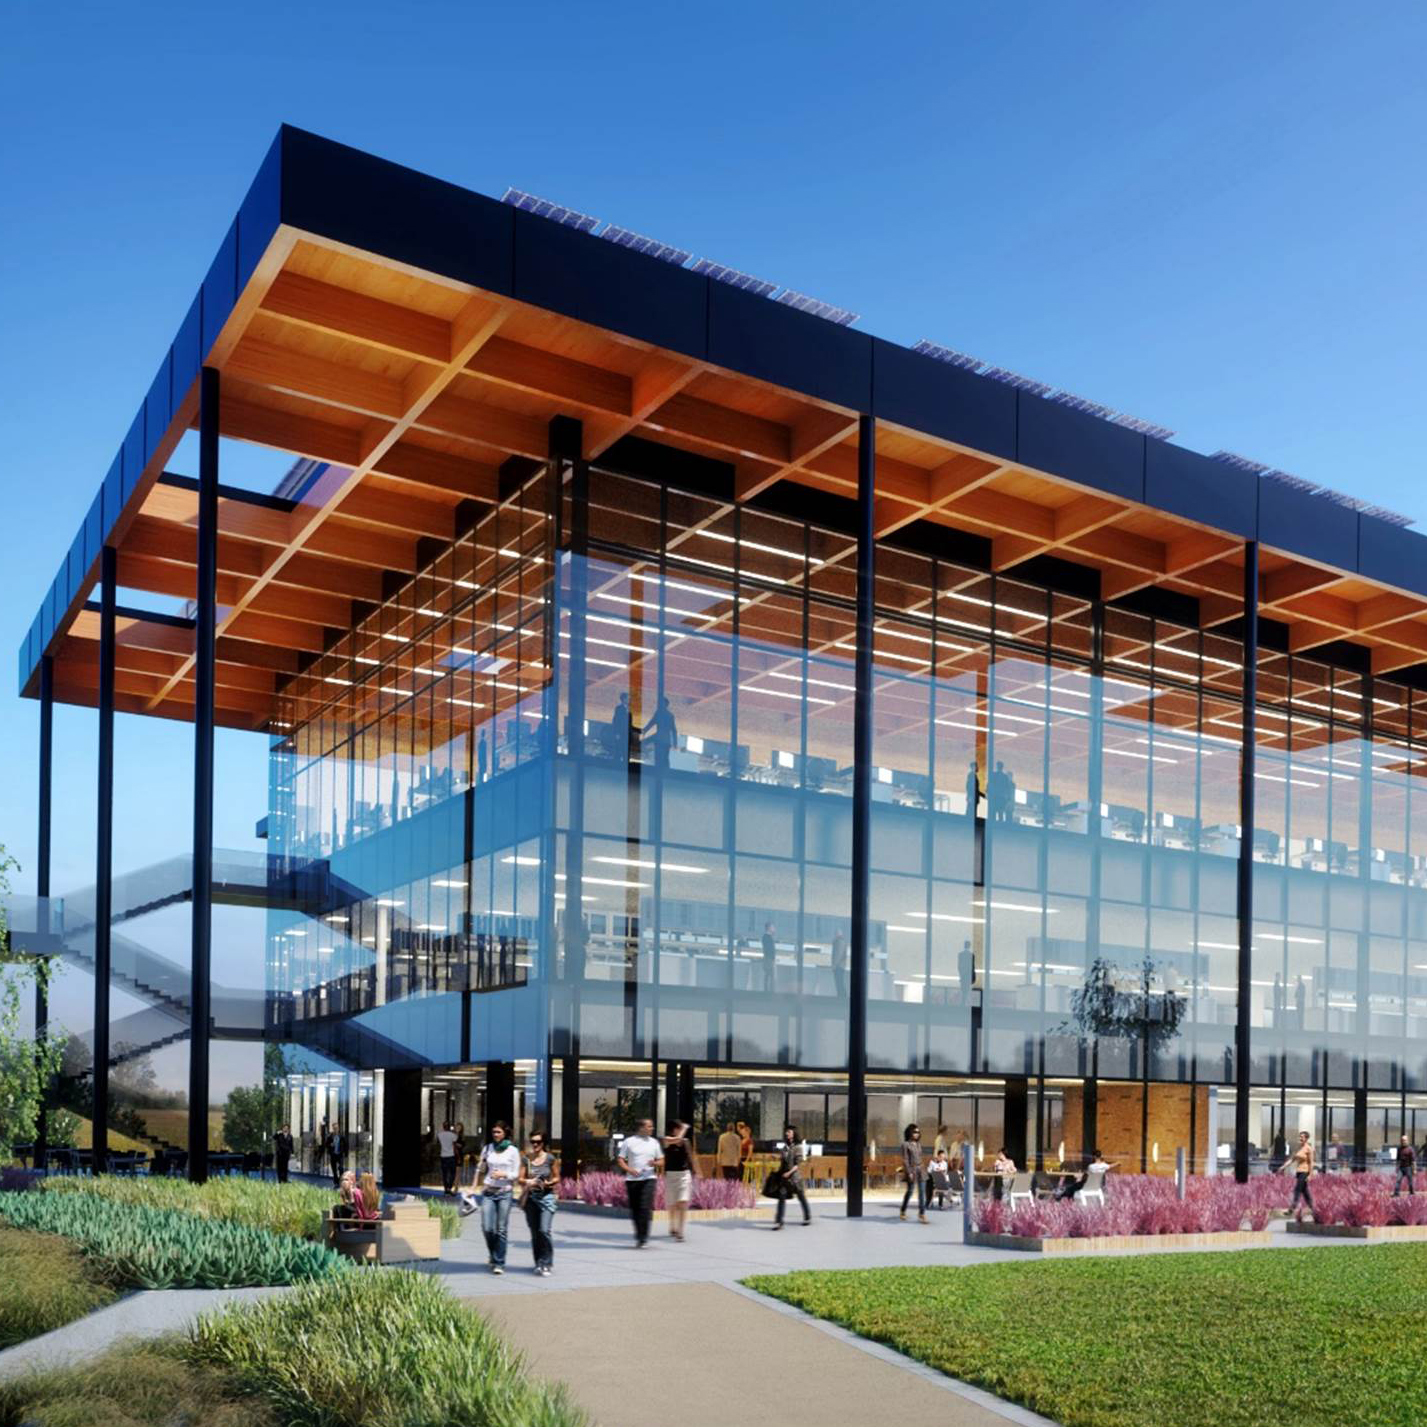 | 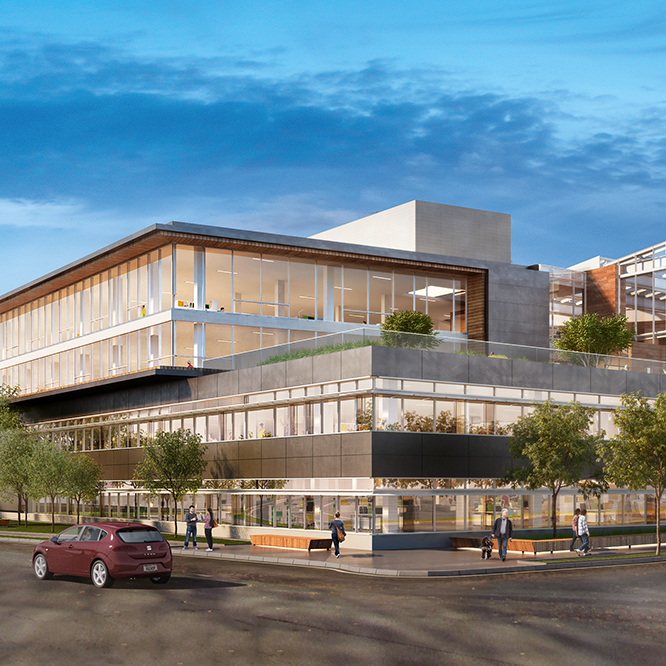 | 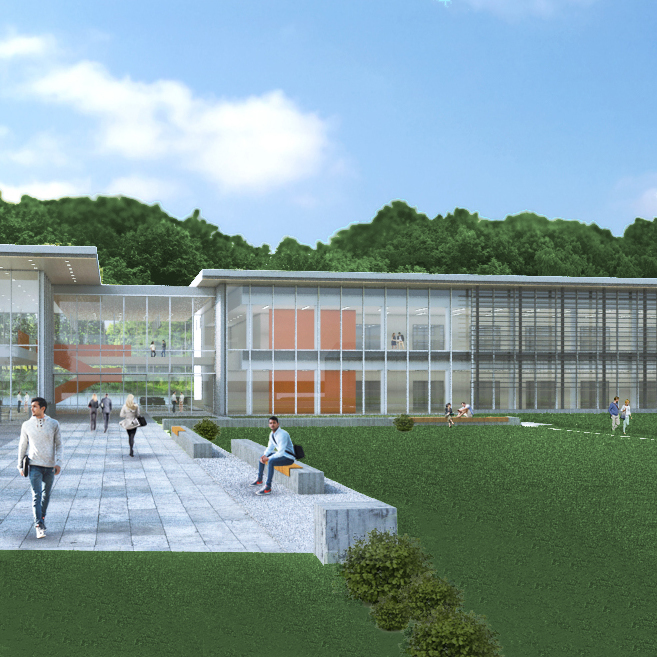 | ||||
Development and Redevelopment of New Class A Properties: 2018 & 2019 Deliveries (Including Marketing and Pre-Construction Projects) (continued) | |
| March 31, 2017 | |
| (Dollars in thousands) | |
| Property/Market/Submarket | Dev/ Redev | Project RSF | Percentage | Project Start (1) | Occupancy (1) | ||||||||||||||||||||
| In Service | CIP | Total | Leased | Negotiating | Total | Initial | Stabilized | ||||||||||||||||||
| Active construction projects | |||||||||||||||||||||||||
| 9625 Towne Centre Drive/San Diego/University Town Center | Redev | — | 162,156 | 162,156 | — | % | 100 | % | 100 | % | 3Q15 | 4Q18 | 2018 | ||||||||||||
| 213 East Grand Avenue/San Francisco/South San Francisco | Dev | — | 297,355 | 297,355 | 100 | % | — | % | 100 | % | 2Q17 | 1Q19 | 2019 | ||||||||||||
| — | 459,511 | 459,511 | 65 | % | 35 | % | 100 | % | |||||||||||||||||
| Marketing and pre-construction projects | |||||||||||||||||||||||||
| 399 Binney Street (Alexandria Center® at One Kendall Square)/Greater Boston/Cambridge | Dev | — | 172,500 | 172,500 | TBD | 2018 | TBD | ||||||||||||||||||
3054 Cornwallis Road/Research Triangle Park/RTP (2) | Redev | — | 150,000 | 150,000 | 2018 | TBD | |||||||||||||||||||
1655 and 1715 Third Street/San Francisco/Mission Bay/SoMa (3) | Dev | — | 580,000 | 580,000 | — | % | 100 | % | 100 | % | 2018 | 2019 | 2019 | ||||||||||||
| 279 East Grand Avenue/San Francisco/South San Francisco | Dev | — | 199,000 | 199,000 | TBD | 2019 | TBD | ||||||||||||||||||
| 1818 Fairview Avenue East/Seattle/Lake Union | Dev | — | 188,490 | 188,490 | 2019 | TBD | |||||||||||||||||||
161 First Street/Greater Boston/Cambridge (4) | Dev | — | 183,644 | 183,644 | N/A | N/A | |||||||||||||||||||
| — | 1,473,634 | 1,473,634 | |||||||||||||||||||||||
| Property/Market/Submarket | Our Ownership Interest | In Service | CIP | Cost to Complete (5) | Total at Completion (5) | Unlevered Yields (5) | ||||||||||||
| Active construction projects | ||||||||||||||||||
| 9625 Towne Centre Drive/San Diego/University Town Center | 100% | $ | — | $ | 26,540 | TBD | TBD | TBD | ||||||||||
| 213 East Grand Avenue/San Francisco/South San Francisco | 100% | — | 42,475 | TBD | TBD | TBD | ||||||||||||
| $ | — | $ | 69,015 | TBD | TBD | TBD | ||||||||||||
| Marketing and pre-construction projects | ||||||||||||||||||
| 399 Binney Street (Alexandria Center® at One Kendall Square)/Greater Boston/Cambridge | 100% | $ | — | $ | 64,984 | TBD | ||||||||||||
3054 Cornwallis Road/Research Triangle Park/RTP (2) | 100% | — | — | |||||||||||||||
1655 and 1715 Third Street/San Francisco/Mission Bay/SoMa (3) | 10% | — | — | |||||||||||||||
| 279 East Grand Avenue/San Francisco/South San Francisco | 100% | — | 9,842 | |||||||||||||||
| 1818 Fairview Avenue East/Seattle/Lake Union | 100% | — | 11,308 | |||||||||||||||
161 First Street/Greater Boston/Cambridge (4) | 100% | — | 5,738 | |||||||||||||||
| $ | — | $ | 91,872 | |||||||||||||||
| (1) | Anticipated project start dates and initial occupancy dates are subject to leasing and/or market conditions. Stabilized occupancy may vary depending on single tenancy versus multi-tenancy. |
| (2) | Represents acquisition under contract as of 1Q17, we expect to complete the acquisition during 2Q17. |
| (3) | Executed an agreement to purchase a 10% interest in a joint venture with Uber and the Golden State Warriors. Our initial cash contribution of $35 million will be funded at closing of the joint venture in 2018. The joint venture will acquire land with completed below-grade improvements to the building foundation and parking garage, and complete vertical construction of two buildings aggregating 580,000 RSF, which will be leased to Uber. |
| (4) | Represents a multi-family residential development with approximately 130-140 units. As part of our successful efforts to increase the entitlements on our Alexandria Center® at Kendall Square development, we were required to develop two multi-family residential projects, one of which was previously completed and sold. We may market this project for sale. |
| (5) | The design and budget of these projects are in process, and the estimated project costs with related yields will be disclosed in the future. |
Development of New Class A Properties: 2019 and Beyond – Near-Term Development Projects | |
| March 31, 2017 | |
| (Dollars in thousands, except per SF amounts) | |
| 303 Binney Street | 960 Industrial Road | East 29th Street | ||
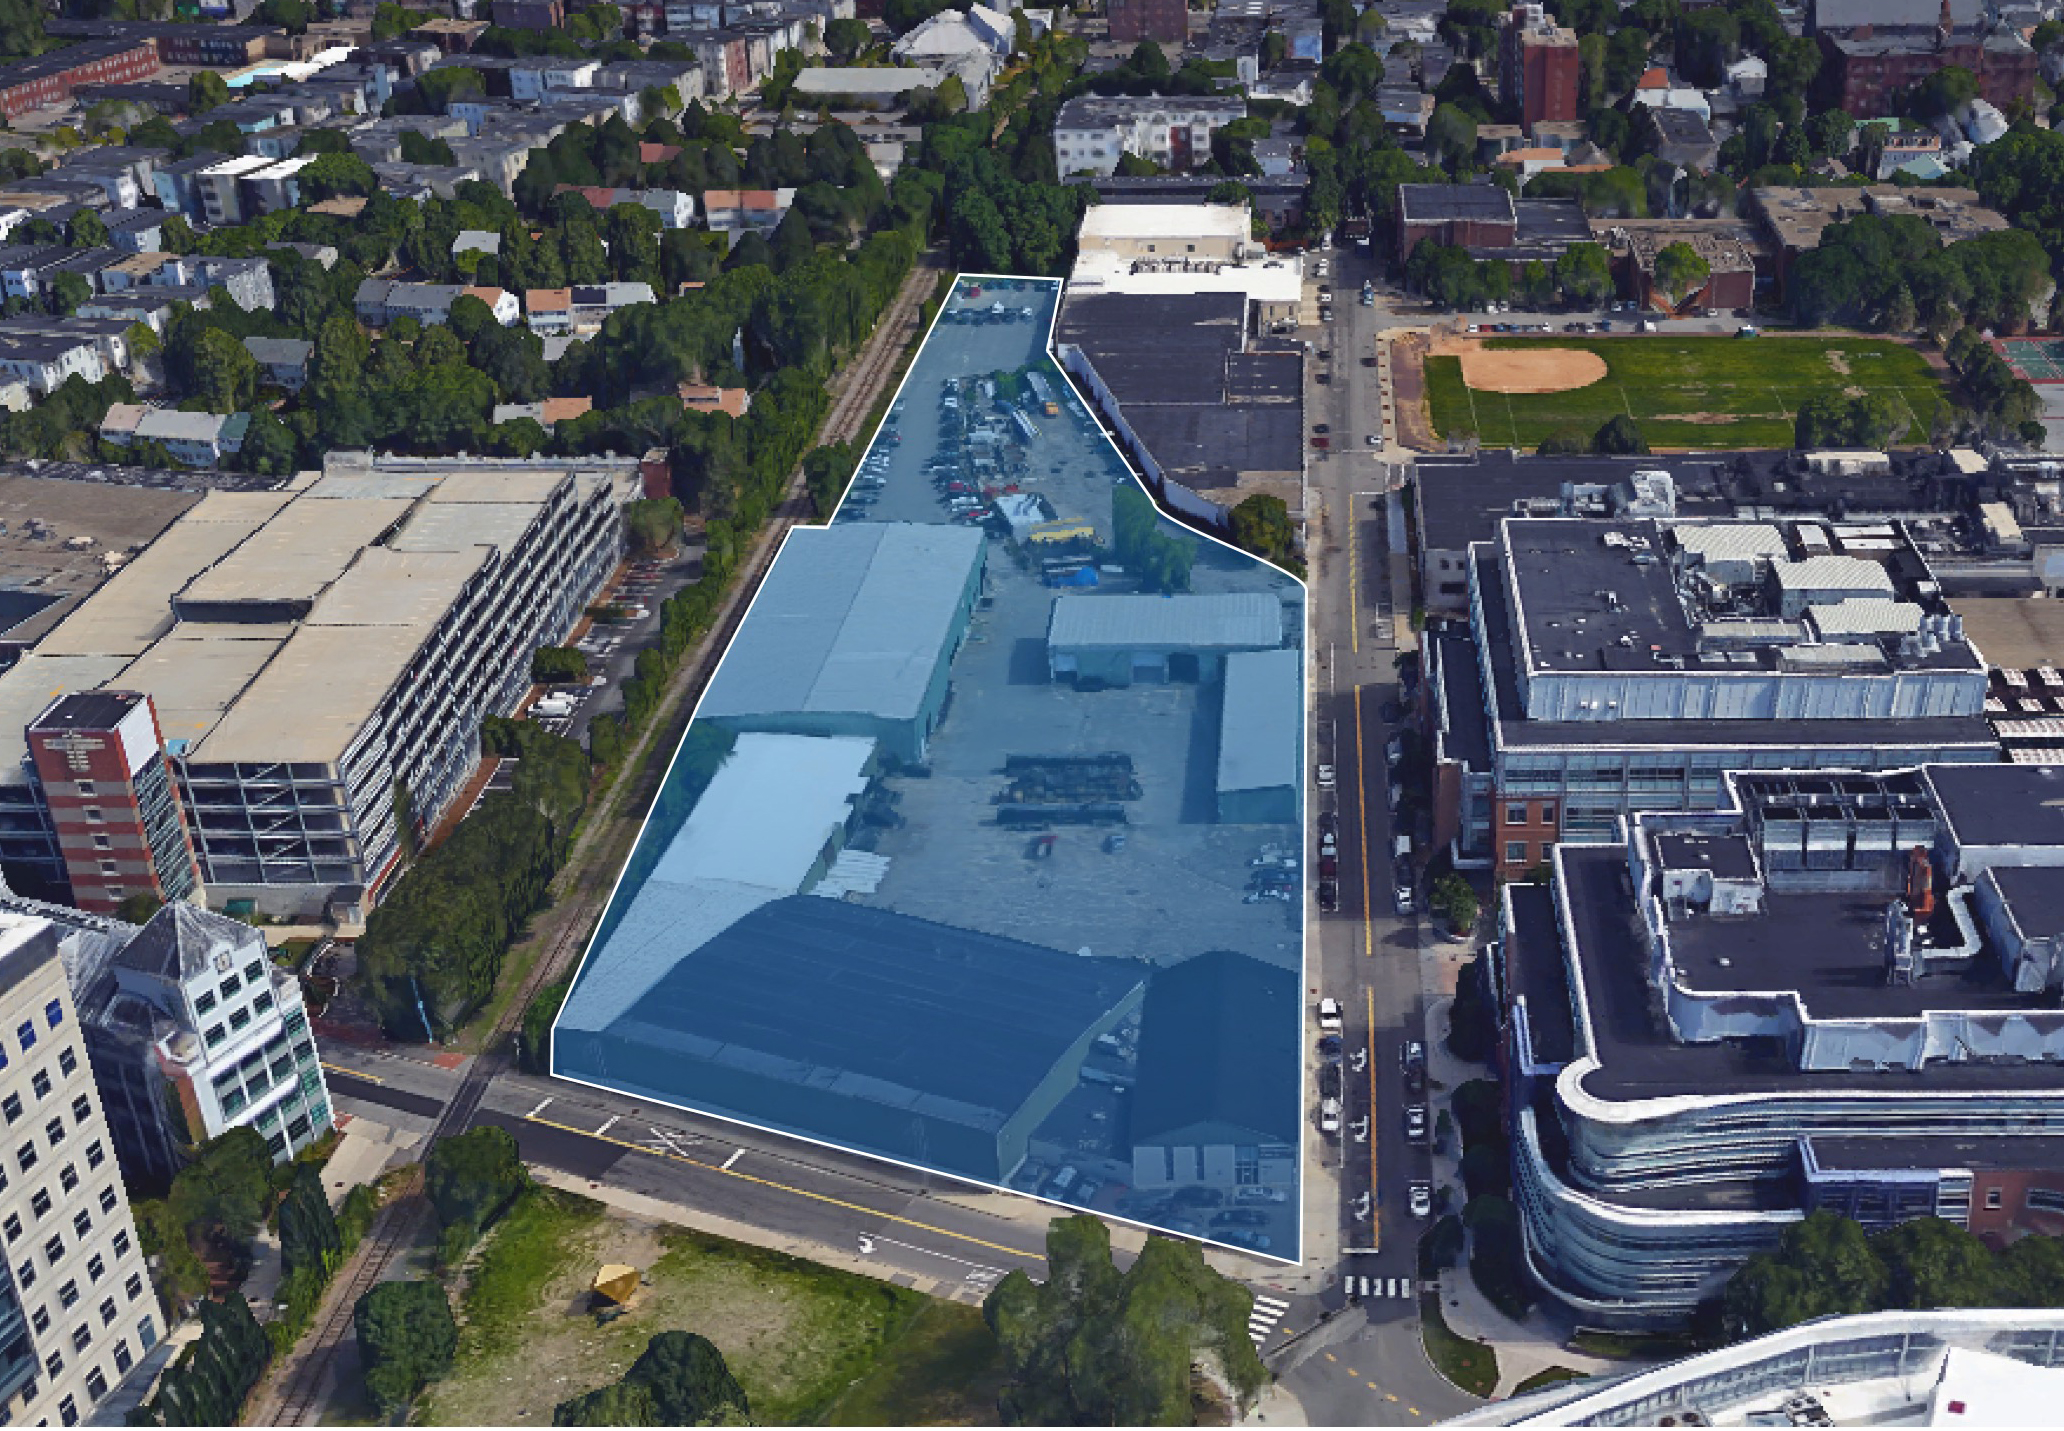 | 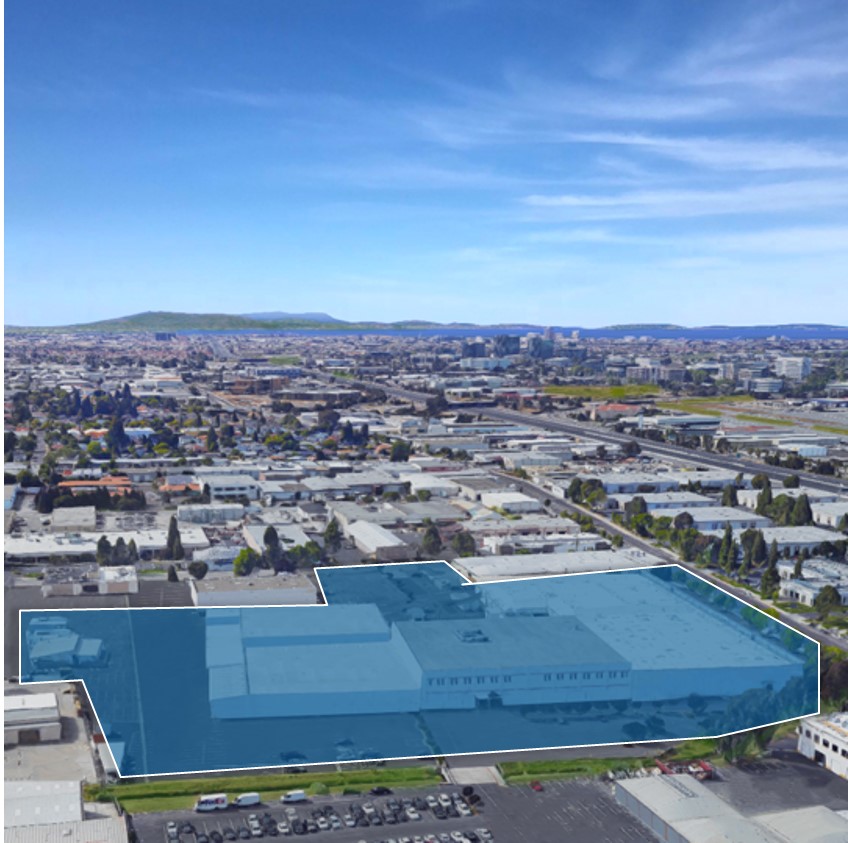 | 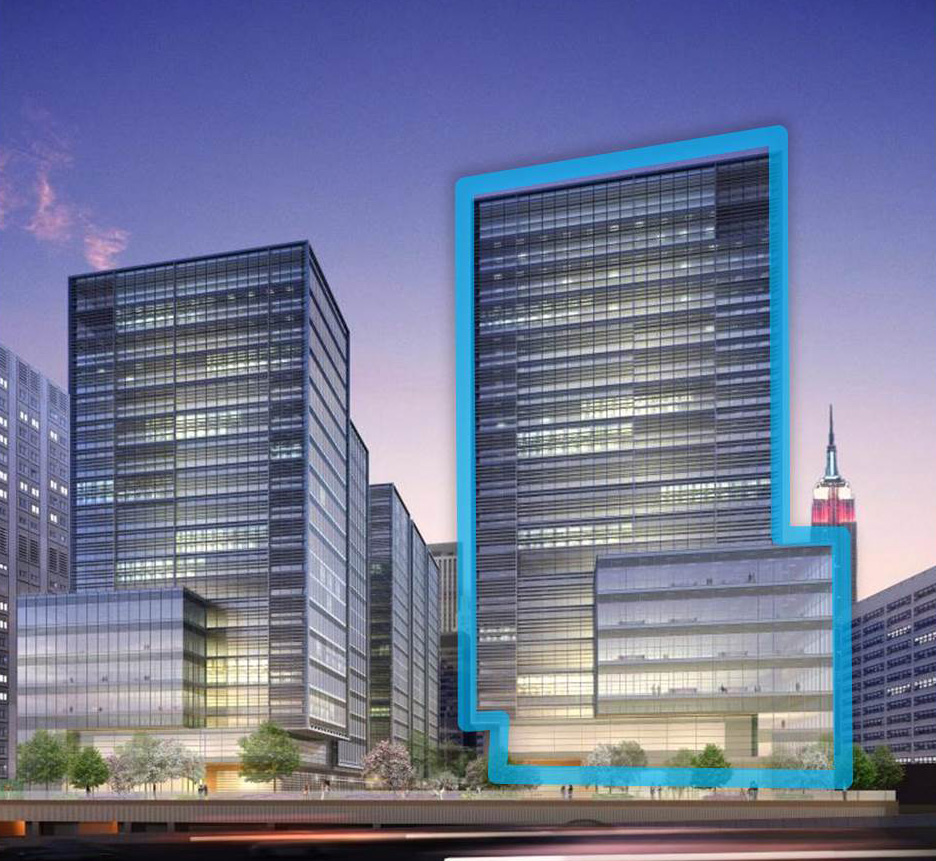 | ||
| 5200 Illumina Way | Campus Point Drive | 9800 Medical Center Drive | ||
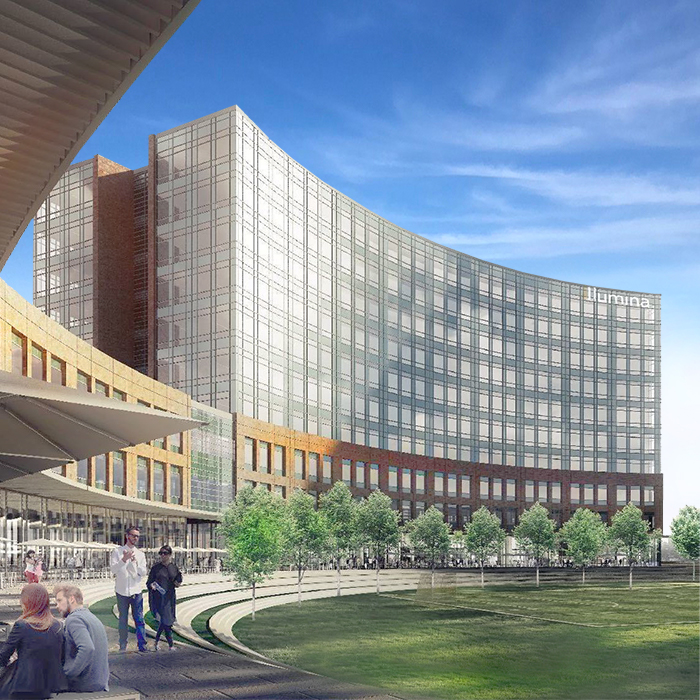 | 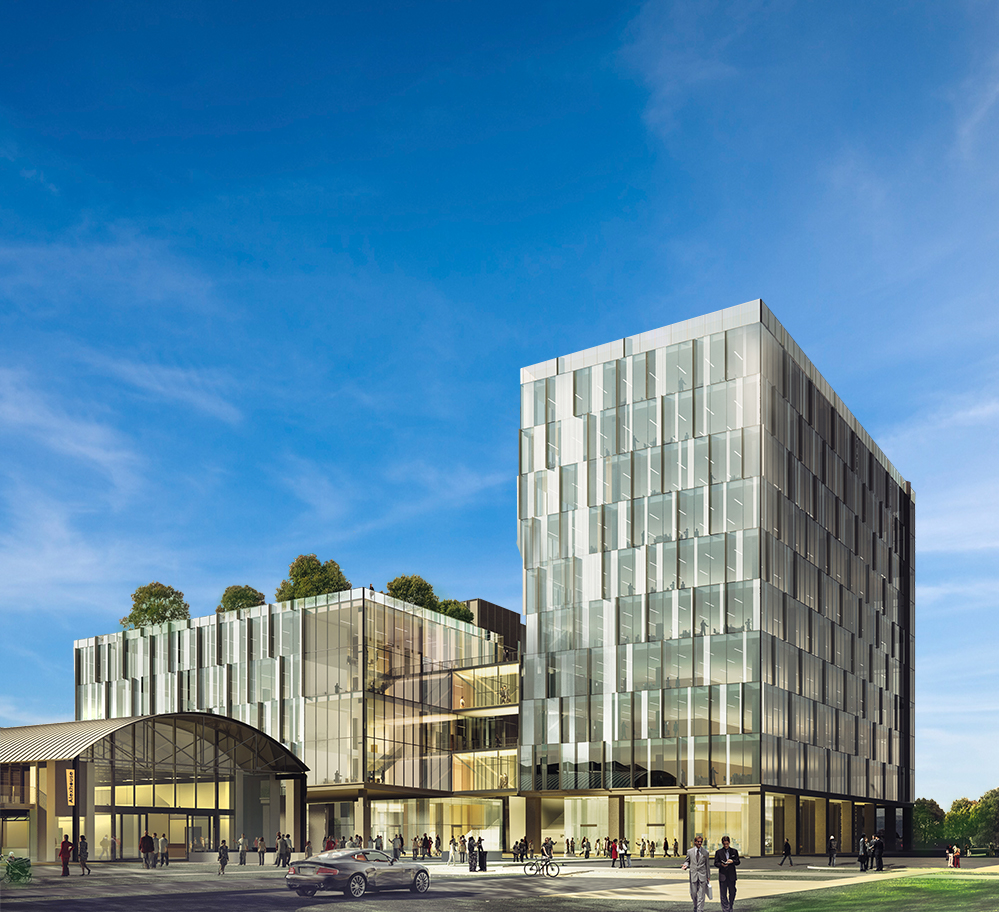 |  | ||
| Property/Submarket | Book Value | Project SF | Per SF | ||||||||||||
| Greater Boston | |||||||||||||||
| 303 Binney Street/Cambridge | $ | 82,882 | (1) | 208,965 | $ | 397 | |||||||||
| San Francisco | |||||||||||||||
| 960 Industrial Road/Greater Stanford | — | (1) | 500,000 | — | |||||||||||
| New York City | |||||||||||||||
| East 29th Street/Manhattan | — | 420,000 | — | ||||||||||||
| San Diego | |||||||||||||||
| 5200 Illumina Way/University Town Center | 10,846 | 386,044 | 28 | ||||||||||||
| Campus Point Drive/University Town Center | 11,653 | 315,000 | 37 | ||||||||||||
| Maryland | |||||||||||||||
| 9800 Medical Center Drive/Rockville | 5,732 | 180,000 | 32 | ||||||||||||
| Total near-term value-creation projects | $ | 111,113 | 2,010,009 | $ | 55 | ||||||||||
| (1) | See page 4 of our Earnings Press Release for additional information on our completed and pending acquisitions. |
| Development and Redevelopment of New Class A Properties: Summary of Pipeline | |
| March 31, 2017 | |
| (Dollars in thousands, except per SF amounts) | |
| Property/Submarket | Our Ownership Interest | Book Value | Square Feet | ||||||||||||||||||||||||
Undergoing Construction | Near-Term Developments | Future Development | Total | ||||||||||||||||||||||||
Marketing and Pre-construction | 2019 and Beyond | ||||||||||||||||||||||||||
| Greater Boston | |||||||||||||||||||||||||||
| Various near-term deliveries | 100% | $ | 450,521 | 431,483 | 356,144 | 208,965 | — | 996,592 | |||||||||||||||||||
Alexandria Technology Square®/Cambridge | 100% | 7,787 | — | — | — | 100,000 | 100,000 | ||||||||||||||||||||
| Other future projects | 100% | 5,614 | — | — | — | 221,955 | 221,955 | ||||||||||||||||||||
| 463,922 | 431,483 | 356,144 | 208,965 | 321,955 | 1,318,547 | ||||||||||||||||||||||
| San Francisco | |||||||||||||||||||||||||||
| Various near-term deliveries | Various | 261,043 | 747,355 | 779,000 | 500,000 | — | 2,026,355 | ||||||||||||||||||||
| 88 Bluxome Street/Mission Bay/SoMa | 100% | 155,977 | — | — | — | 1,070,925 | 1,070,925 | ||||||||||||||||||||
| 505 Brannan Street, Phase II/Mission Bay/SoMa | 99.6% | 13,996 | — | — | — | 165,000 | 165,000 | ||||||||||||||||||||
| East Grand Avenue/South San Francisco | 100% | 5,805 | — | — | — | 90,000 | 90,000 | ||||||||||||||||||||
| Other future projects | 100% | — | — | — | — | 95,620 | 95,620 | ||||||||||||||||||||
| 436,821 | 747,355 | 779,000 | 500,000 | 1,421,545 | 3,447,900 | ||||||||||||||||||||||
| New York City | |||||||||||||||||||||||||||
| East 29th Street/Manhattan | 100% | — | — | — | 420,000 | — | 420,000 | ||||||||||||||||||||
| — | — | — | 420,000 | — | 420,000 | ||||||||||||||||||||||
| San Diego | |||||||||||||||||||||||||||
| Various near-term deliveries | 100% | 190,306 | 364,343 | — | 701,044 | — | 1,065,387 | ||||||||||||||||||||
| Vista Wateridge/Sorrento Mesa | 100% | 3,752 | — | — | — | 163,000 | 163,000 | ||||||||||||||||||||
| Other future projects | 100% | 31,894 | — | — | — | 259,895 | 259,895 | ||||||||||||||||||||
| 225,952 | 364,343 | — | 701,044 | 422,895 | 1,488,282 | ||||||||||||||||||||||
| Seattle | |||||||||||||||||||||||||||
| Various near-term deliveries | 100% | 39,604 | 48,835 | 188,490 | — | — | 237,325 | ||||||||||||||||||||
| 1150/1165/1166 Eastlake Avenue East/Lake Union | 100% | 36,633 | — | — | — | 366,000 | 366,000 | ||||||||||||||||||||
| 76,237 | 48,835 | 188,490 | — | 366,000 | 603,325 | ||||||||||||||||||||||
| Maryland | |||||||||||||||||||||||||||
| Various near-term deliveries | 100% | 5,732 | — | — | 180,000 | — | 180,000 | ||||||||||||||||||||
| Other future projects | 100% | 15,376 | — | — | — | 408,000 | 408,000 | ||||||||||||||||||||
| 21,108 | — | — | 180,000 | 408,000 | 588,000 | ||||||||||||||||||||||
| Research Triangle Park | |||||||||||||||||||||||||||
| Various near-term deliveries | 100% | — | — | 150,000 | — | — | 150,000 | ||||||||||||||||||||
| 6 Davis Drive/Research Triangle Park | 100% | 16,568 | — | — | — | 1,000,000 | 1,000,000 | ||||||||||||||||||||
| Other future projects | 100% | 4,150 | — | — | — | 76,262 | 76,262 | ||||||||||||||||||||
| 20,718 | — | 150,000 | — | 1,076,262 | 1,226,262 | ||||||||||||||||||||||
| Non-cluster markets – other future projects | 100% | 11,791 | — | — | — | 592,285 | 592,285 | ||||||||||||||||||||
| $ | 1,256,549 | 1,592,016 | 1,473,634 | 2,010,009 | 4,608,942 | 9,684,601 | |||||||||||||||||||||
| Construction Spending | |
| March 31, 2017 | |
| (Dollars in thousands, except per RSF amounts) | |
| Construction Spending | Three Months Ended March 31, 2017 | |||||
Construction spending (cash basis) (3) | $ | 218,473 | ||||
| Decrease in accrued construction | (1,693 | ) | ||||
| Construction spending | $ | 216,780 | ||||
Non-Revenue-Enhancing Capital Expenditures(1) | Three Months Ended March 31, 2017 | Recent Average per RSF (2) | ||||||||||
| Amount | Per RSF | |||||||||||
| Non-revenue-enhancing capital expenditures | $ | 1,138 | $ | 0.07 | $ | 0.39 | ||||||
| Tenant improvements and leasing costs: | ||||||||||||
| Re-tenanted space | $ | 4,582 | $ | 25.79 | $ | 17.86 | ||||||
| Renewal space | 13,795 | 19.67 | 11.79 | |||||||||
| Total tenant improvements and leasing costs/weighted average | $ | 18,377 | (4) | $ | 20.91 | (4) | $ | 13.42 | ||||
| Projected Construction Spending | Year Ending December 31, 2017 | |||||
| Development and redevelopment projects | $ | 552,000 | ||||
| Contributions from noncontrolling interests (consolidated joint ventures) | (9,000 | ) | ||||
| Generic laboratory infrastructure/building improvement projects | 95,000 | |||||
| Non-revenue-enhancing capital expenditures and tenant improvements | 10,000 | |||||
| Projected construction spending for nine months ending December 31, 2017 | 648,000 | |||||
| Actual construction spend for three months ended March 31, 2017 | 216,780 | |||||
| Guidance range | $ | 815,000 | – | 915,000 | ||
2017 Disciplined Allocation of Capital (5) |
| 93% to Urban Innovation Submarkets |
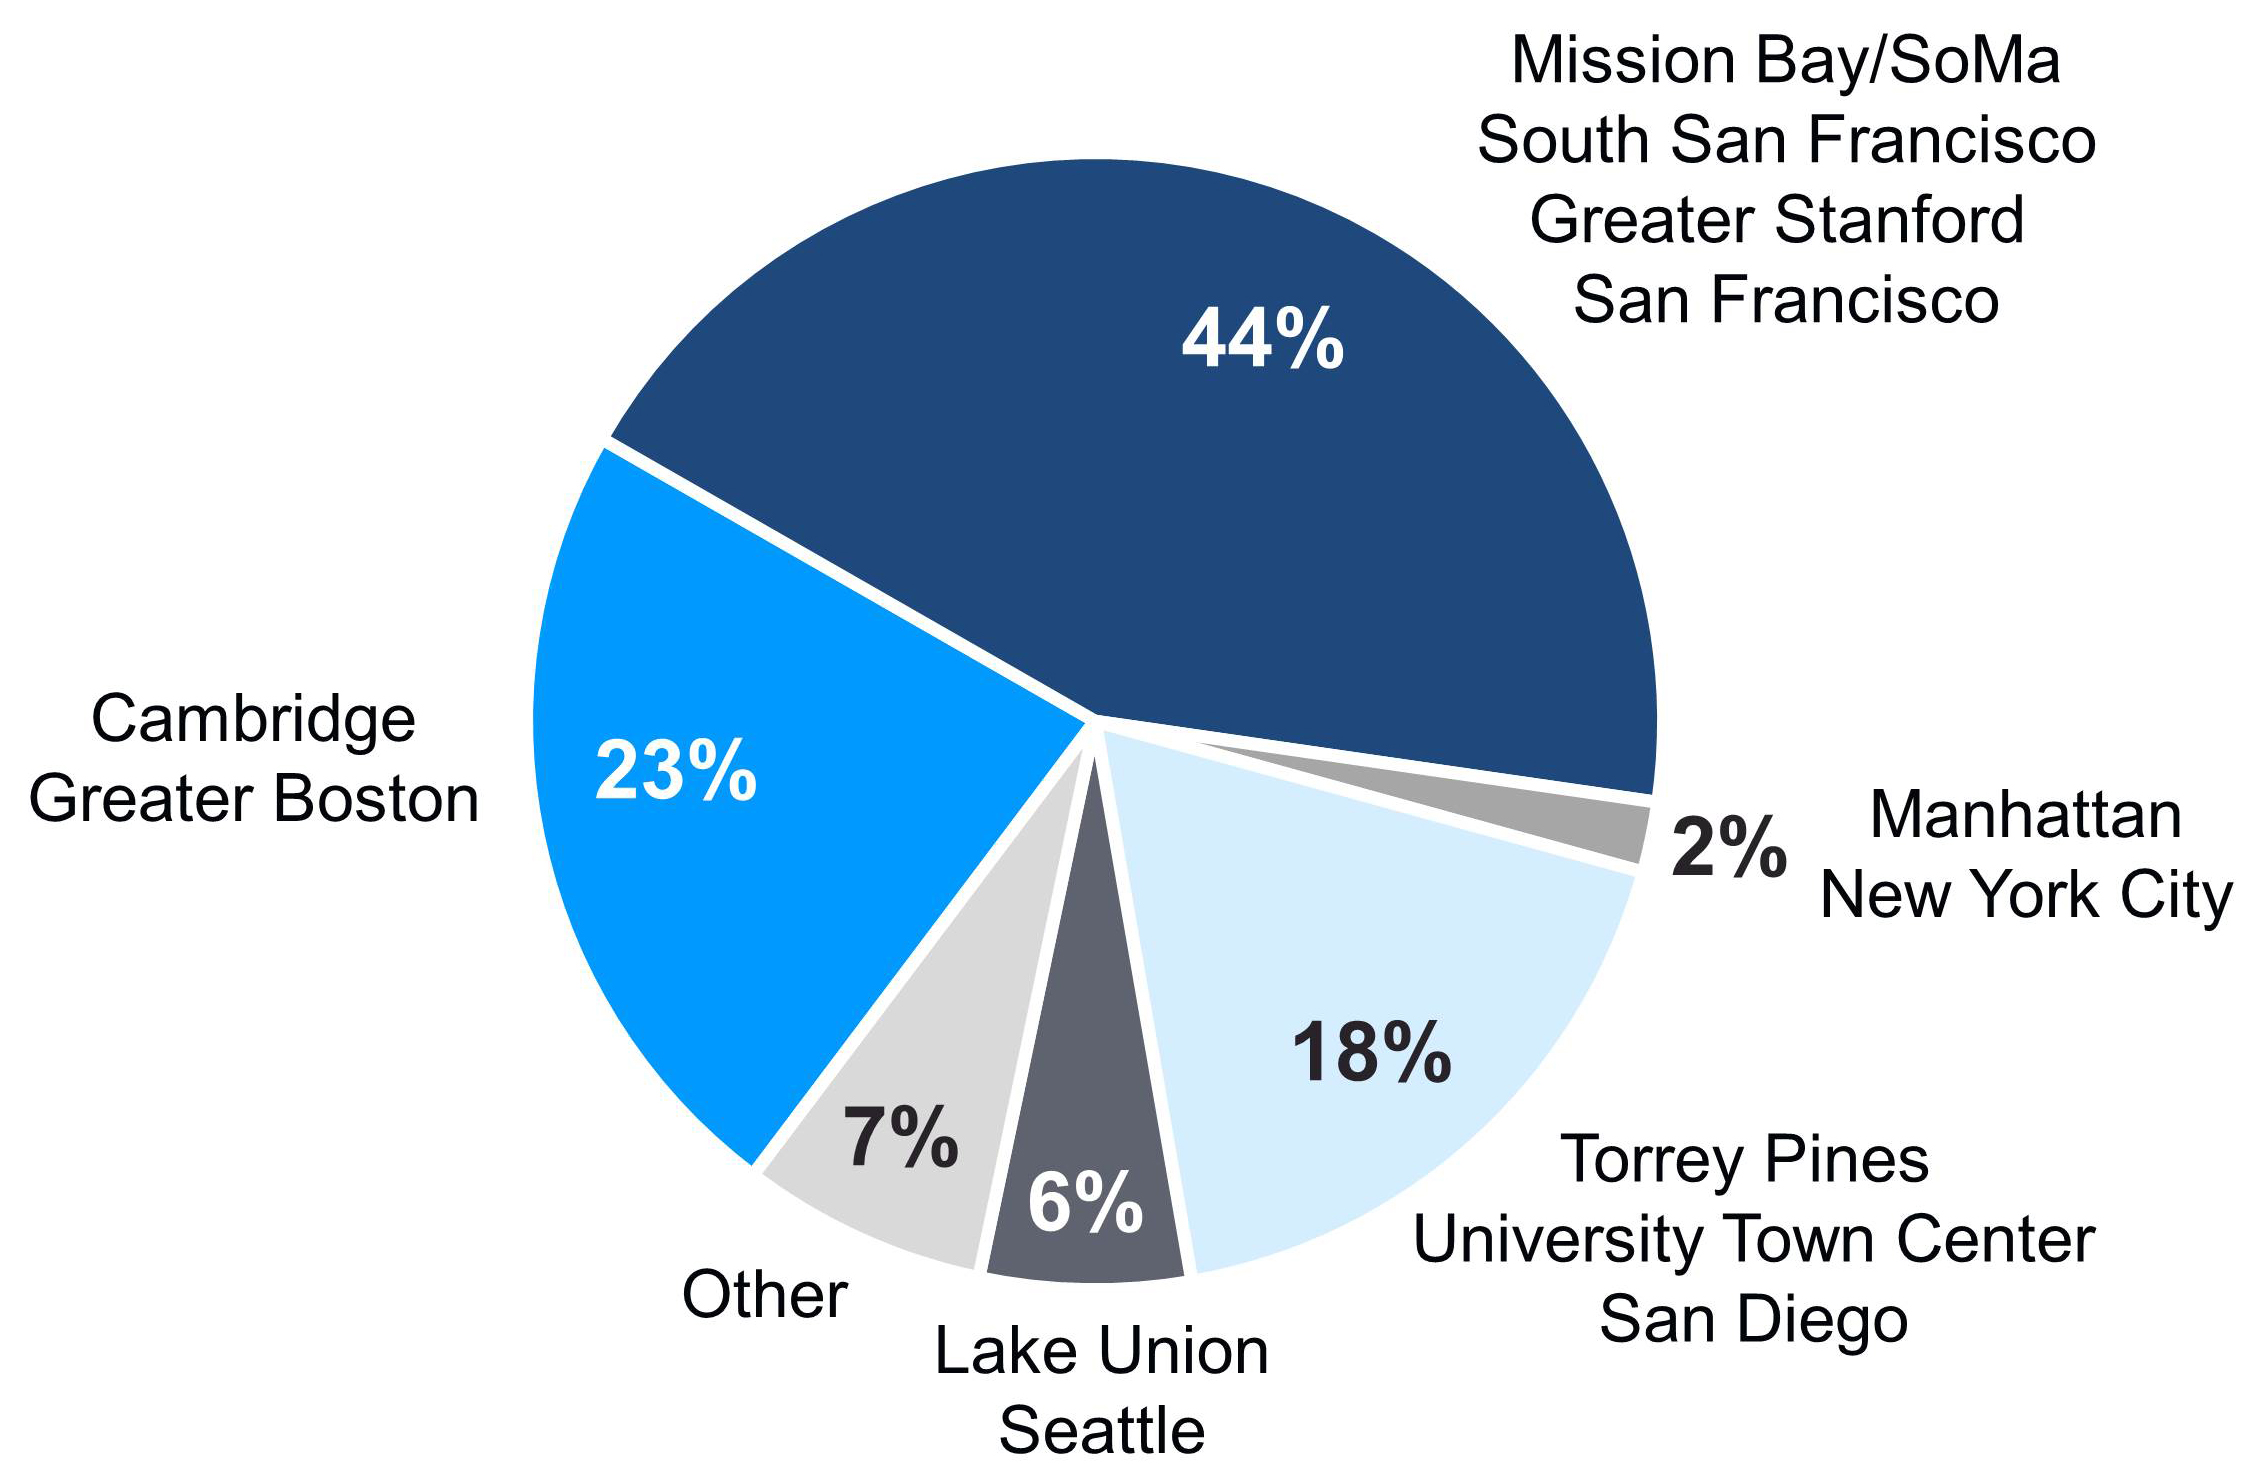 |
| (1) | Excludes amounts that are recoverable from tenants, revenue-enhancing, or related to properties that have undergone redevelopment. |
| (2) | Represents the average of the five years ended December 31, 2016, and the three months ended March 31, 2017. |
| (3) | Includes revenue-enhancing projects and non-revenue-enhancing capital expenditures. |
| (4) | Increase from 4Q16 primarily relates to tenant improvement commitments and leasing commissions incurred for leases executed that generated average increases in rental rates of 25.9% and 17.4% (cash basis). Includes approximately $3.8 million, or $4.30 per square foot, related to base building work to be performed by tenants for enhancements to common areas and building energy efficiency projects at two of our properties in Cambridge. |
| (5) | Represents the percentage of projected spending by submarket, including projected acquisitions expected in our sources and uses of capital guidance ranging from $380 million to $480 million. |
| Dispositions | |
| March 31, 2017 | |
| (Dollars in thousands) | |
| Property/Market/Submarket | Date of Sale | RSF | Net Operating Income (1) | Net Operating Income (Cash) (1) | Contractual Sale Price | |||||||||||||
| Dispositions completed and under contract: | ||||||||||||||||||
| 6146 Nancy Ridge Drive/San Diego/Sorrento Mesa | 1/6/17 | 21,940 | N/A | N/A | $ | 3,000 | ||||||||||||
| 360 Longwood Avenue/Greater Boston/Longwood Medical Area | July 2017 | 203,090 | (2) | $ | 4,134 | (2) | $ | 3,990 | (2) | 65,701 | (2) | |||||||
| $ | 68,701 | |||||||||||||||||
| (1) | Represents annualized amounts for the quarter ended prior to the date of sale. Cash net operating income excludes straight-line rent and amortization of acquired below-market leases. |
| (2) | Represents the sale of a condominium interest for approximately 49% of the building RSF, or 203,090 RSF, in our unconsolidated real estate joint venture property. Net operating income, net operating income (cash basis), and contractual sales price represent our 27.5% share related to the sale of the condominium interest. In March 2017, the unconsolidated real estate joint venture extended the maturity date of the existing secured construction loan to July 5, 2017. We expect to refinance the secured construction loan in connection with the condominium sale and to receive a net distribution from the joint venture. RSF represents 100% of the property. |
| Joint Venture Financial Information | |
| March 31, 2017 | |
| (Dollars in thousands) | |
We present components of operating results and balance sheet information for our share of the consolidated real estate joint ventures attributable to noncontrolling interests and for our share of investment in an unconsolidated real estate joint venture to help investors estimate operating results and balance sheet information related to our partially owned entities. These amounts are estimated by computing, for each joint venture that we consolidate in our financial statements, the noncontrolling interest percentage of each financial item to arrive at the cumulative noncontrolling interest share of each component presented. In addition, for our real estate joint venture that we do not control and do not consolidate, we apply our economic ownership percentage to the unconsolidated real estate joint venture to arrive at our proportionate share of each component presented.
| March 31, 2017 | |||||||||
| Noncontrolling Interest Share of Consolidated Real Estate JVs | Our Share of Unconsolidated Real Estate JV | ||||||||
| Investments in real estate | $ | 476,969 | $ | 92,542 | |||||
| Cash and cash equivalents | 12,797 | 3,477 | |||||||
| Other assets | 29,328 | 8,545 | |||||||
| Secured notes payable | — | (51,233 | ) | ||||||
| Other liabilities | (25,198 | ) | (2,874 | ) | |||||
| Redeemable noncontrolling interests | (11,320 | ) | (1) | — | |||||
| $ | 482,576 | $ | 50,457 | ||||||
| Three Months Ended March 31, 2017 | |||||||||
| Noncontrolling Interest Share of Consolidated Real Estate JVs | Our Share of Unconsolidated Real Estate JV | ||||||||
| Total revenues | $ | 13,020 | $ | 2,348 | |||||
| Rental operations | (3,740 | ) | (848 | ) | |||||
| 9,280 | 1,500 | ||||||||
| General and administrative | (20 | ) | (23 | ) | |||||
| Interest | — | (704 | ) | ||||||
| Depreciation and amortization | (3,642 | ) | (412 | ) | |||||
Net income (1) | $ | 5,618 | $ | 361 | |||||
| Consolidated Real Estate Joint Ventures | |||
| Property/Market/Submarket | Noncontrolling (2) Interest Share | ||
| 225 Binney Street/Greater Boston/Cambridge | 70% | ||
| 1500 Owens Street/San Francisco/Mission Bay/SoMa | 49.9% | ||
| 409 and 499 Illinois Street/San Francisco/Mission Bay/SoMa | 40% | ||
10290 and 10300 Campus Point Drive/San Diego/ University Town Center | 45% | ||
| Unconsolidated Real Estate Joint Venture | |||
| Property/Market/Submarket | Our Share | ||
| 360 Longwood Avenue/Greater Boston/Longwood Medical Area | 27.5% | ||
| Our unconsolidated real estate joint venture at 360 Longwood Avenue has a non-recourse, secured construction loan that includes the following key terms (amounts represent 100% at the joint venture level): | ||||||||||||||||||||
| Tranche | Maturity Date | Stated Rate | Outstanding Balance | Remaining Commitments | Total | |||||||||||||||
| Fixed rate | July 5, 2017 | (3) | 5.25 | % | $ | 173,226 | $ | 2,015 | $ | 175,241 | ||||||||||
Floating rate (4) | July 5, 2017 | (3) | L+3.75 | % | 13,075 | 24,884 | 37,959 | |||||||||||||
| $ | 186,301 | $ | 26,899 | $ | 213,200 | |||||||||||||||
| (1) | Represents a redeemable noncontrolling interest in our consolidated real estate project at 213 East Grand Avenue, located in our South San Francisco submarket, aggregating 297,355 RSF. The noncontrolling interests in the real estate joint venture commenced in August 2005 and earn a fixed preferred return of 8.4%, which is excluded from our net income calculation. |
| (2) | In addition to the consolidated real estate joint ventures listed, various partners hold insignificant interests in three other properties. |
| (3) | In March 2017, the unconsolidated real estate joint venture extended the maturity date of the existing secured construction loan to July 5, 2017. We expect to refinance the secured construction loan in connection with the sale of a condominium interest in 203,090 RSF of 360 Longwood Avenue and to receive a net distribution from the joint venture. See page 6 of our Earnings Press Release for additional discussion. |
| (4) | Borrowings under the floating rate tranche have an interest rate floor equal to 5.25% and are subject to an interest rate cap on LIBOR of 3.50%. |
| Investments | |
| March 31, 2017 | |
| (Dollars in thousands) | |
| Public/Private Mix (Cost) | Tenant/Non-Tenant Mix (Cost) | |||||||||||||
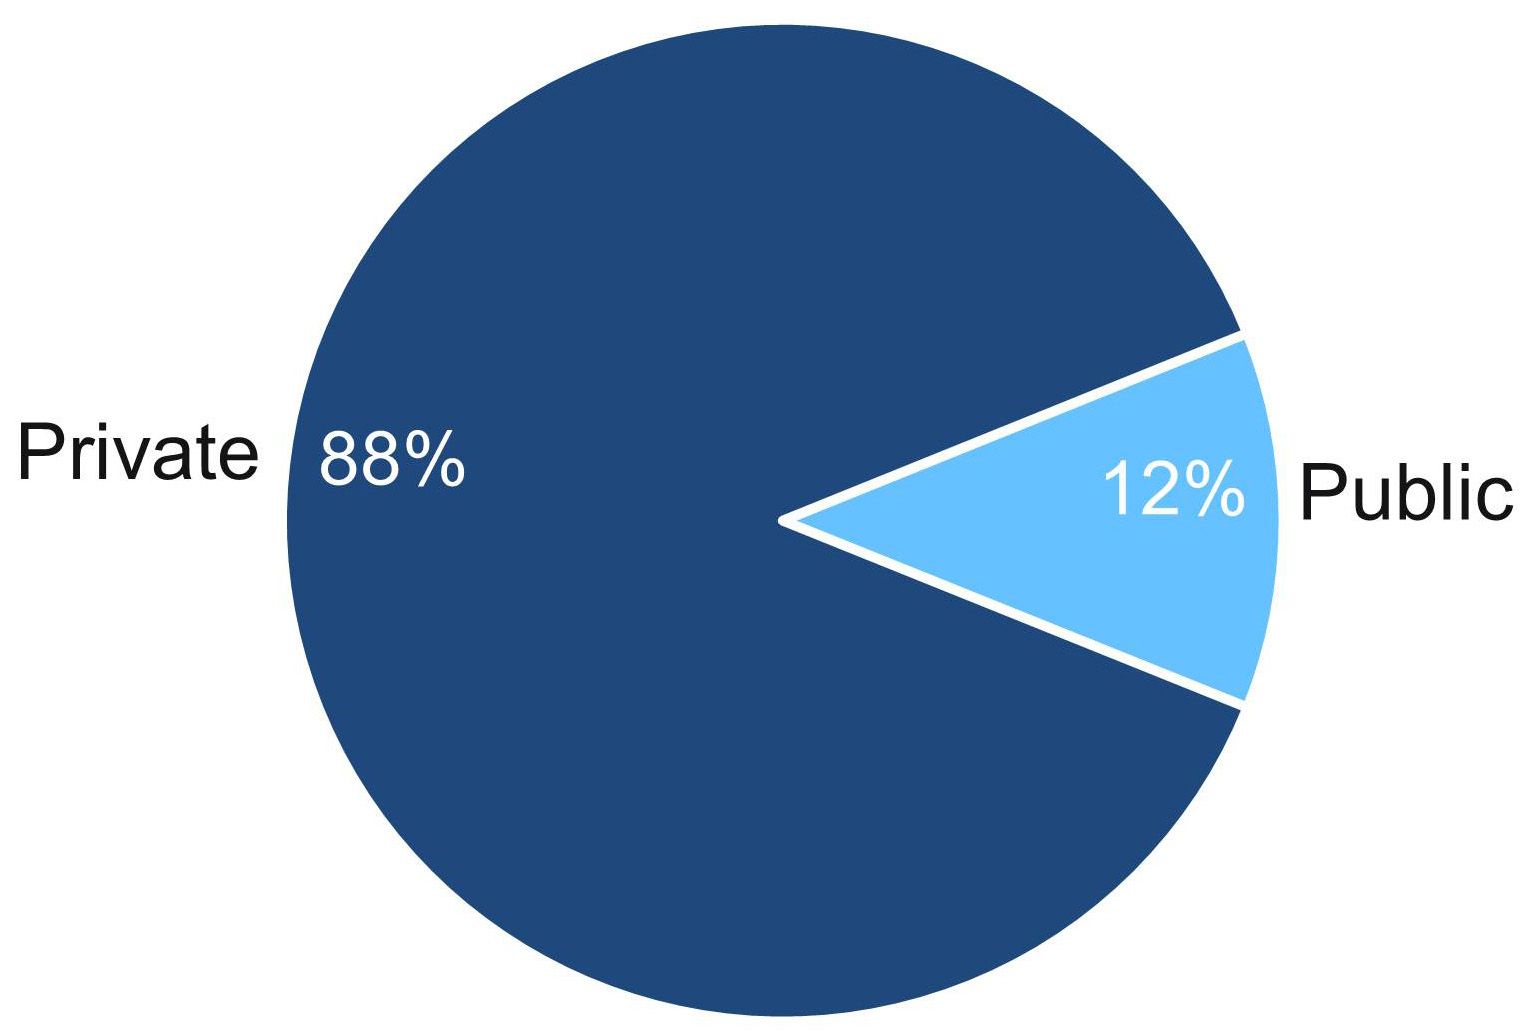 | 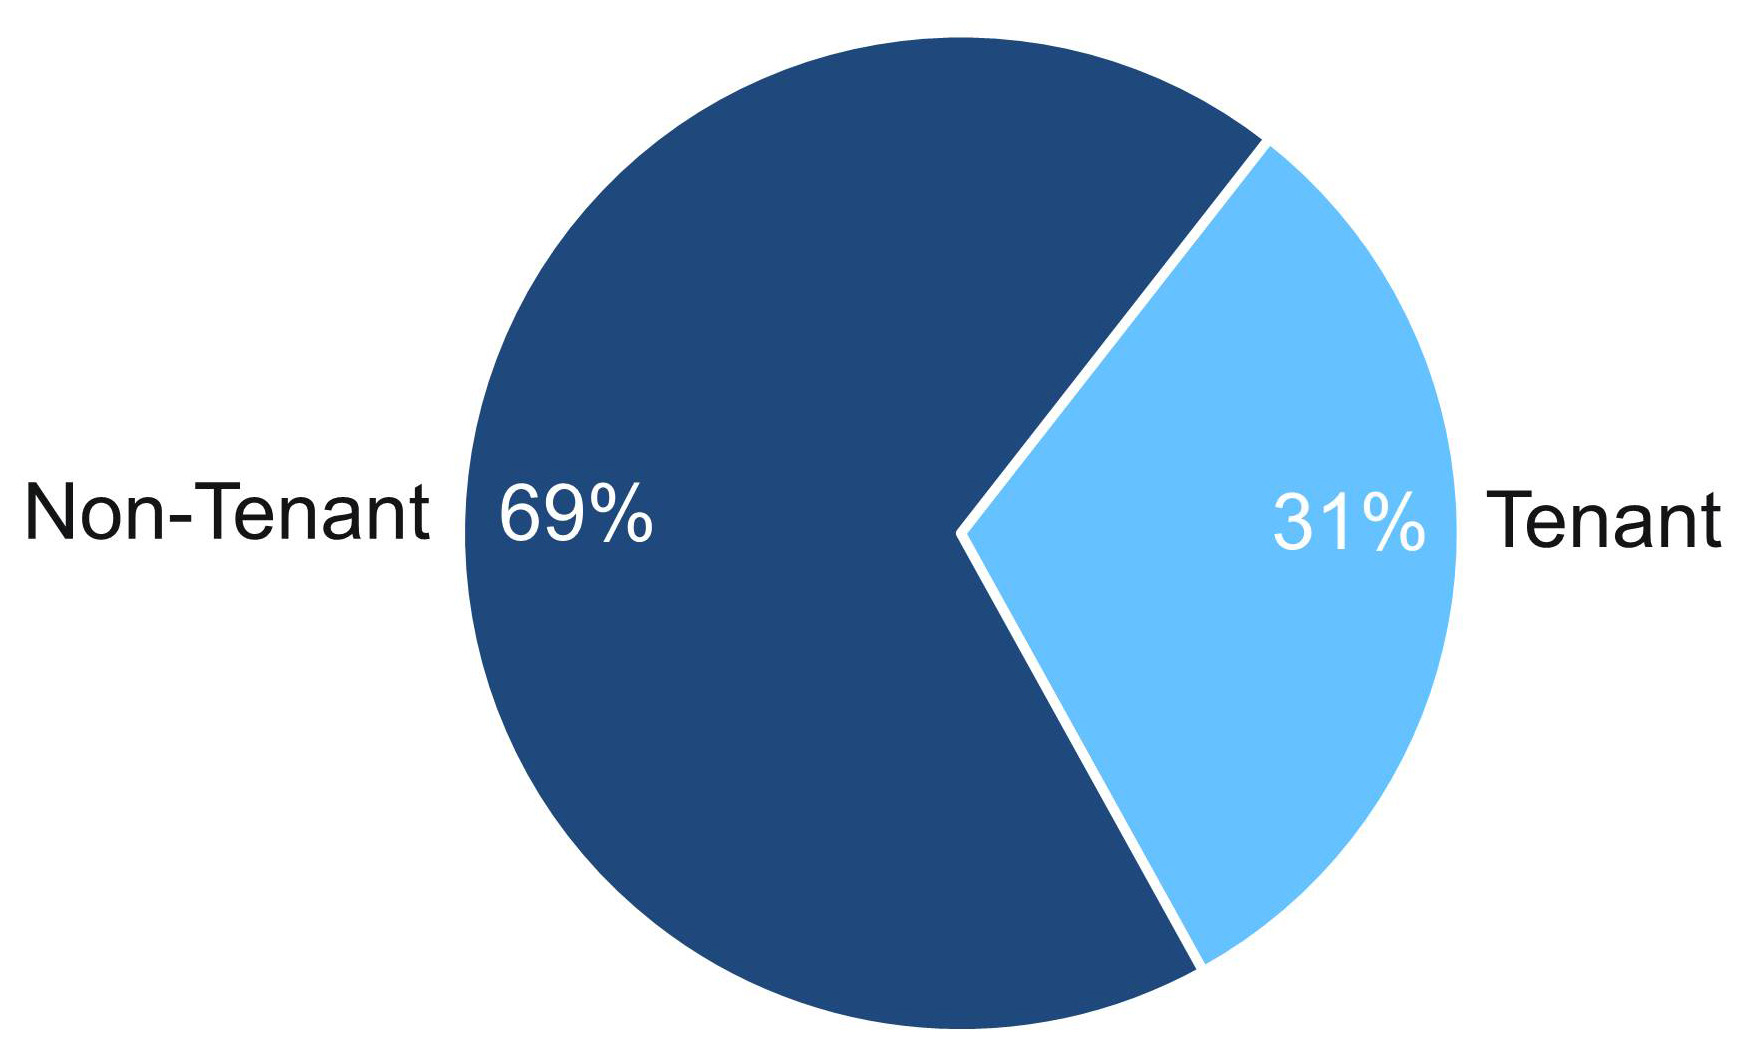 | |||||||||||||
Investment Type | Cost | Net Unrealized Gains | Total | Number of Investments | ||||||||||
| 235 | ||||||||||||||
| Public | $ | 44,383 | $ | 29,847 | $ | 74,230 | ||||||||
| Private | 320,241 | — | 320,241 | Average Cost | ||||||||||
| $1.6M | ||||||||||||||
| Total | $ | 364,624 | $ | 29,847 | $ | 394,471 | ||||||||
| Key Credit Metrics | |
| March 31, 2017 | |
| (Dollars in millions) | |
Net Debt to Adjusted EBITDA (1) | Net Debt and Preferred Stock to Adjusted EBITDA (1) | |||||
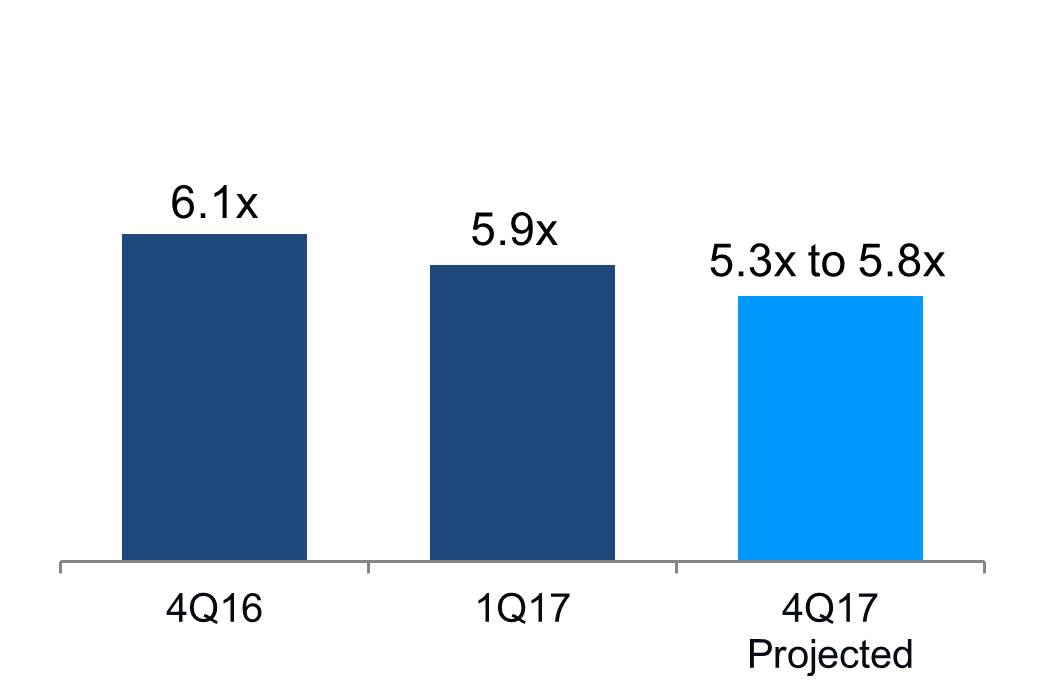 | ||||||
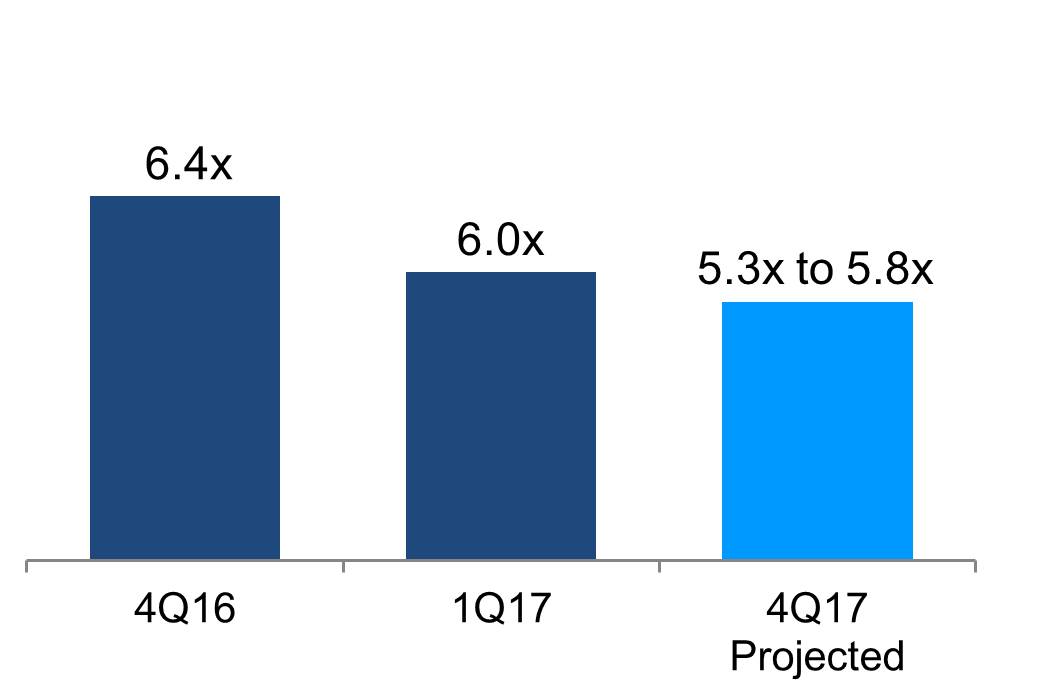 | ||||||
Fixed-Charge Coverage Ratio (1) | Liquidity | |||||
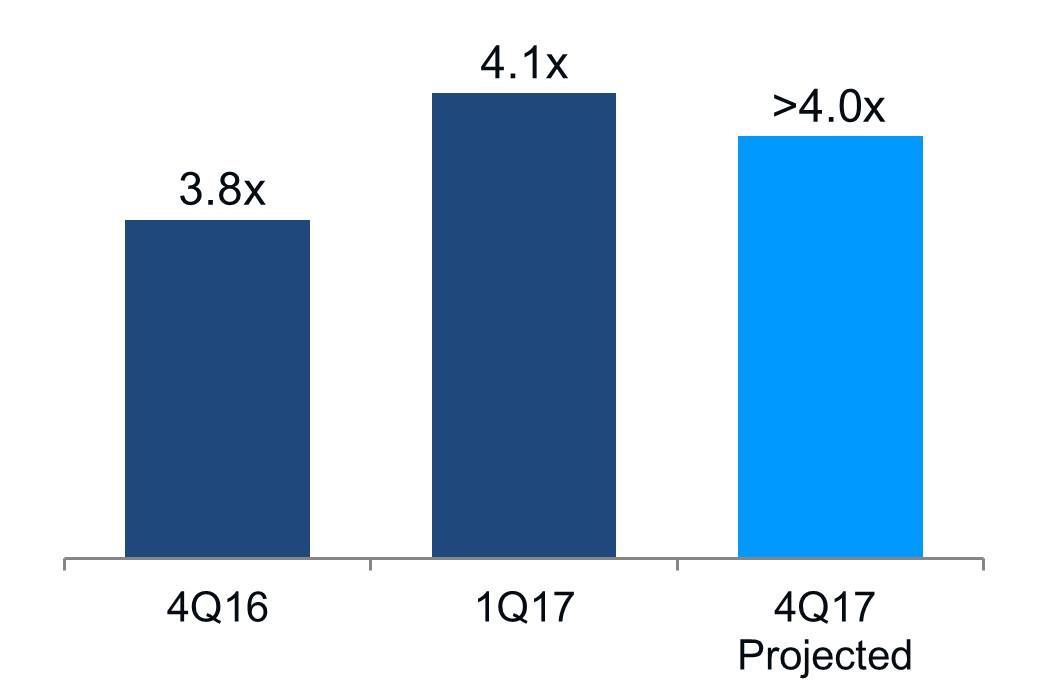 | ||||||
| $2.2B | ||||||
| Availability under our $1.65 billion unsecured senior line of credit | $ | 1,650 | ||||
| Remaining construction loan commitments | 267 | |||||
| Available-for-sale equity securities, at fair value | 74 | |||||
| Cash, cash equivalents, and restricted cash | 170 | |||||
| $ | 2,161 | |||||
| (1) | Quarter annualized. |
| |
| Summary of Debt | |
| March 31, 2017 | |
Debt maturities chart
(Dollars in millions)
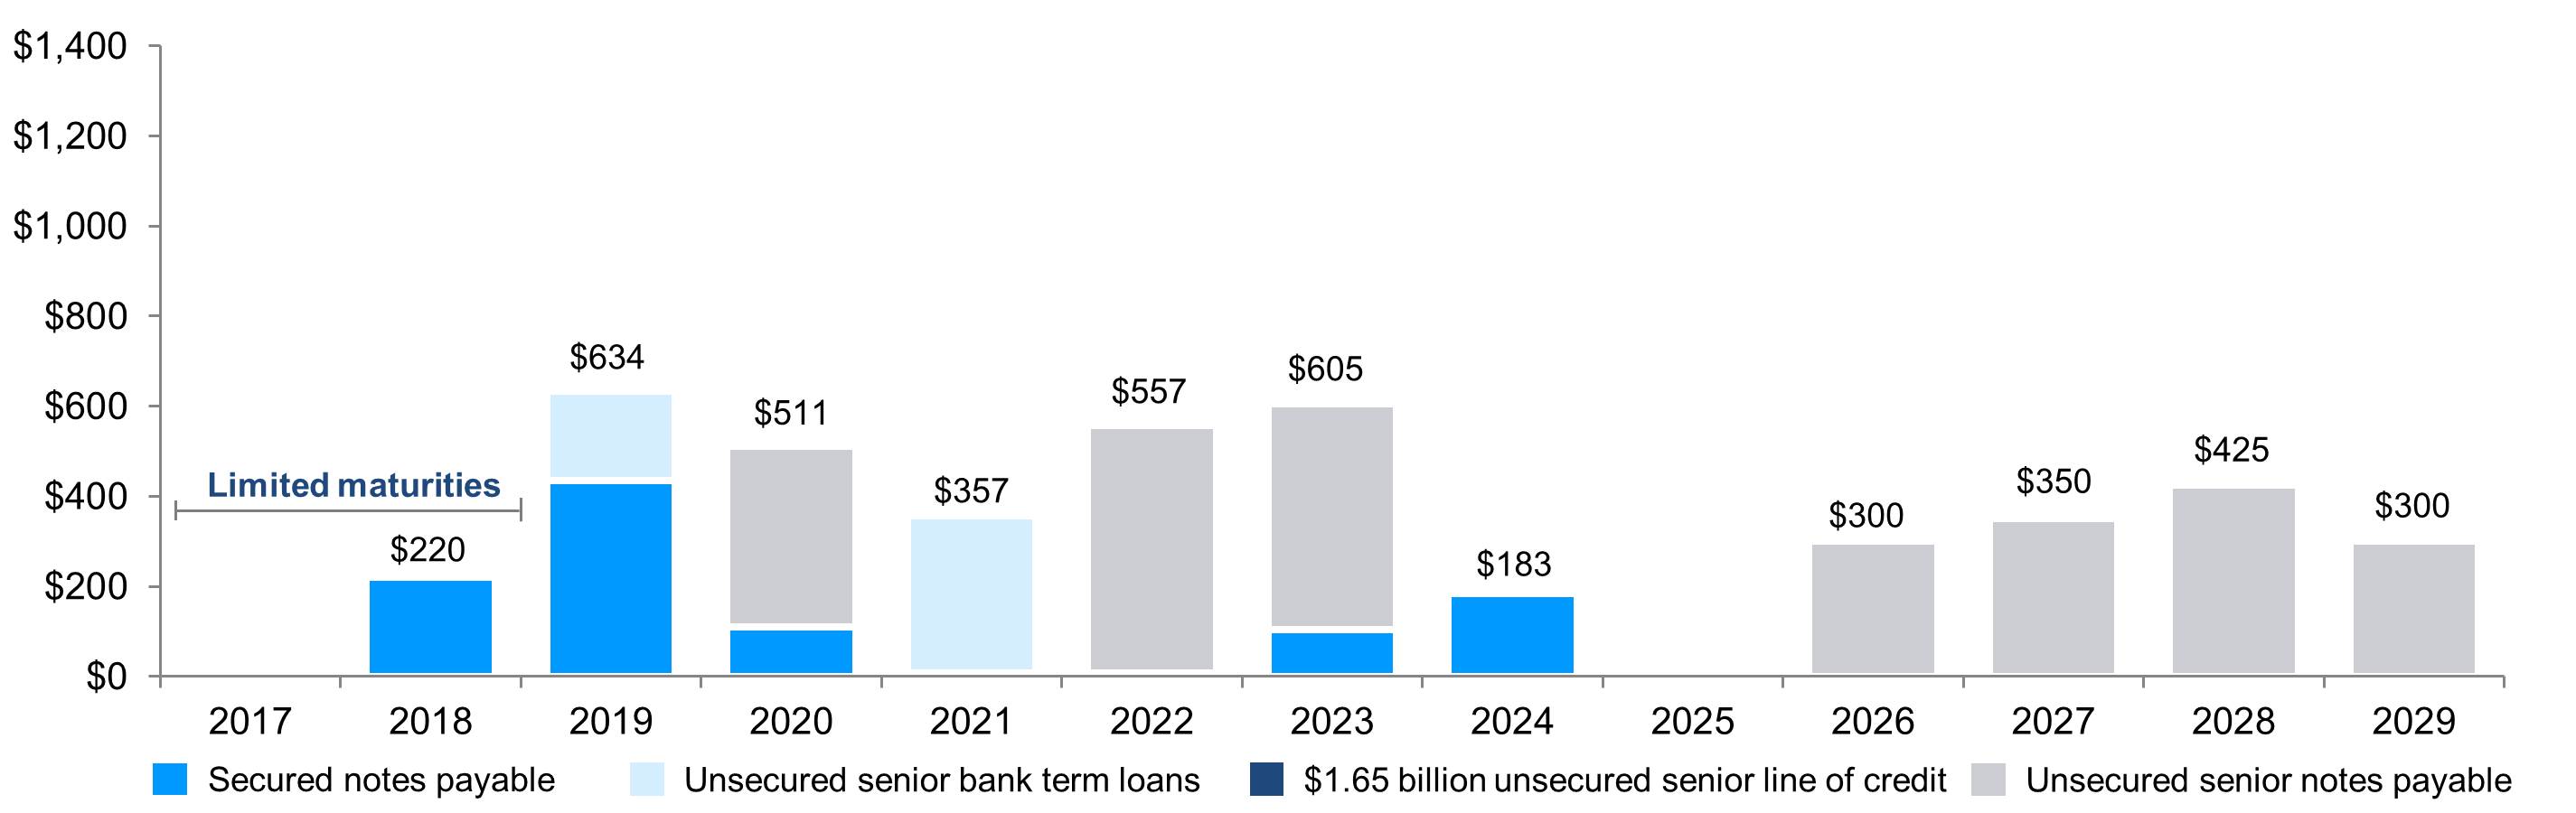 | ||
Fixed-rate/hedged and unhedged variable-rate debt
(Dollars in thousands)
Fixed-Rate/Hedged Variable-Rate Debt | Unhedged Variable-Rate Debt | Total | Percentage | Weighted-Average | ||||||||||||||||
Interest Rate (1) | Remaining Term (in years) | |||||||||||||||||||
| Secured notes payable | $ | 868,597 | $ | 215,161 | $ | 1,083,758 | 24.5 | % | 3.64 | % | 3.3 | |||||||||
| Unsecured senior notes payable | 2,799,508 | — | 2,799,508 | 63.1 | 4.16 | 7.5 | ||||||||||||||
| $1.65 Billion unsecured senior line of credit | — | — | — | — | N/A | 4.6 | ||||||||||||||
| 2019 Unsecured Senior Bank Term Loan | 199,361 | — | 199,361 | 4.5 | 3.00 | 1.8 | ||||||||||||||
| 2021 Unsecured Senior Bank Term Loan | 348,059 | — | 348,059 | 7.9 | 2.44 | 3.8 | ||||||||||||||
| Total/weighted average | $ | 4,215,525 | $ | 215,161 | $ | 4,430,686 | 100.0 | % | 3.84 | % | 6.0 | |||||||||
| Percentage of total debt | 95% | 5% | 100% | |||||||||||||||||
| (1) | Represents the weighted-average interest rate as of the end of the applicable period, including expense/income related to our interest rate hedge agreements, amortization of debt premiums (discounts), amortization of loan fees, and other bank fees. |
| Summary of Debt (continued) | |
| March 31, 2017 | |
| (Dollars in thousands) | |
| Debt | Stated Rate | Weighted-Average Interest Rate (1) | Maturity Date (2) | Principal Payments Remaining for the Periods Ending December 31, | Principal | Unamortized (Deferred Financing Cost), (Discount)/Premium | Total | |||||||||||||||||||||||||||||||||||||||
| 2017 | 2018 | 2019 | 2020 | 2021 | Thereafter | |||||||||||||||||||||||||||||||||||||||||
| Secured notes payable | ||||||||||||||||||||||||||||||||||||||||||||||
| Greater Boston | L+1.35% | 2.93 | % | 8/23/18 | $ | — | $ | 212,289 | $ | — | $ | — | $ | — | $ | — | $ | 212,289 | $ | (1,020 | ) | $ | 211,269 | |||||||||||||||||||||||
| Greater Boston | L+1.50% | 2.77 | 1/28/19 | (3) | — | — | 288,269 | — | — | — | 288,269 | (2,188 | ) | 286,081 | ||||||||||||||||||||||||||||||||
| Greater Boston | L+2.00% | 3.34 | 4/20/19 | (3) | — | — | 137,603 | — | — | — | 137,603 | (2,764 | ) | 134,839 | ||||||||||||||||||||||||||||||||
| Greater Boston, San Diego, Seattle, and Maryland | 7.75 | % | 8.15 | 4/1/20 | 1,387 | 1,979 | 2,138 | 104,352 | — | — | 109,856 | (1,002 | ) | 108,854 | ||||||||||||||||||||||||||||||||
| San Diego | 4.66 | % | 4.93 | 1/1/23 | 1,026 | 1,608 | 1,687 | 1,762 | 1,852 | 28,201 | 36,136 | (378 | ) | 35,758 | ||||||||||||||||||||||||||||||||
| Greater Boston | 3.93 | % | 3.19 | 3/10/23 | — | 1,091 | 1,505 | 1,566 | 1,628 | 76,210 | 82,000 | 3,212 | 85,212 | |||||||||||||||||||||||||||||||||
| Greater Boston | 4.82 | % | 3.36 | 2/6/24 | — | 2,720 | 3,090 | 3,217 | 3,406 | 190,567 | 203,000 | 17,952 | 220,952 | |||||||||||||||||||||||||||||||||
| San Francisco | 6.50 | % | 6.66 | 7/1/36 | 20 | 22 | 23 | 25 | 26 | 677 | 793 | — | 793 | |||||||||||||||||||||||||||||||||
| Secured debt weighted-average interest rate/subtotal | 3.95 | % | 3.64 | 2,433 | 219,709 | 434,315 | 110,922 | 6,912 | 295,655 | 1,069,946 | 13,812 | 1,083,758 | ||||||||||||||||||||||||||||||||||
| 2019 Unsecured Senior Bank Term Loan | L+1.20 | % | 3.00 | 1/3/19 | — | — | 200,000 | — | — | — | 200,000 | (639 | ) | 199,361 | ||||||||||||||||||||||||||||||||
| 2021 Unsecured Senior Bank Term Loan | L+1.10 | % | 2.44 | 1/15/21 | — | — | — | — | 350,000 | — | 350,000 | (1,941 | ) | 348,059 | ||||||||||||||||||||||||||||||||
| $1.65 billion unsecured senior line of credit | L+1.00 | % | (4) | N/A | 10/29/21 | — | — | — | — | — | — | — | — | — | ||||||||||||||||||||||||||||||||
| Unsecured senior notes payable | 2.75 | % | 2.96 | 1/15/20 | — | — | — | 400,000 | — | — | 400,000 | (2,211 | ) | 397,789 | ||||||||||||||||||||||||||||||||
| Unsecured senior notes payable | 4.60 | % | 4.75 | 4/1/22 | — | — | — | — | — | 550,000 | 550,000 | (3,244 | ) | 546,756 | ||||||||||||||||||||||||||||||||
| Unsecured senior notes payable | 3.90 | % | 4.04 | 6/15/23 | — | — | — | — | — | 500,000 | 500,000 | (3,669 | ) | 496,331 | ||||||||||||||||||||||||||||||||
| Unsecured senior notes payable | 4.30 | % | 4.52 | 1/15/26 | — | — | — | — | — | 300,000 | 300,000 | (4,229 | ) | 295,771 | ||||||||||||||||||||||||||||||||
| Unsecured senior notes payable | 3.95 | % | 4.14 | 1/15/27 | — | — | — | — | — | 350,000 | 350,000 | (4,876 | ) | 345,124 | ||||||||||||||||||||||||||||||||
| Unsecured senior notes payable | 3.95 | % | 4.10 | 1/15/28 | — | — | — | — | — | 425,000 | 425,000 | (4,539 | ) | 420,461 | ||||||||||||||||||||||||||||||||
| Unsecured senior notes payable | 4.50 | % | 4.62 | 7/30/29 | — | — | — | — | — | 300,000 | 300,000 | (2,724 | ) | 297,276 | ||||||||||||||||||||||||||||||||
| Unsecured debt weighted average/subtotal | 3.91 | — | — | 200,000 | 400,000 | 350,000 | 2,425,000 | 3,375,000 | (28,072 | ) | 3,346,928 | |||||||||||||||||||||||||||||||||||
| Weighted-average interest rate/total | 3.84 | % | $ | 2,433 | $ | 219,709 | $ | 634,315 | $ | 510,922 | $ | 356,912 | $ | 2,720,655 | $ | 4,444,946 | $ | (14,260 | ) | $ | 4,430,686 | |||||||||||||||||||||||||
| Balloon payments | $ | — | $ | 212,289 | $ | 625,872 | $ | 503,979 | $ | 350,000 | $ | 2,708,417 | $ | 4,400,557 | $ | — | $ | 4,400,557 | ||||||||||||||||||||||||||||
| Principal amortization | 2,433 | 7,420 | 8,443 | 6,943 | 6,912 | 12,238 | 44,389 | (14,260 | ) | 30,129 | ||||||||||||||||||||||||||||||||||||
| Total debt | $ | 2,433 | $ | 219,709 | $ | 634,315 | $ | 510,922 | $ | 356,912 | $ | 2,720,655 | $ | 4,444,946 | $ | (14,260 | ) | $ | 4,430,686 | |||||||||||||||||||||||||||
| Fixed-rate/hedged variable-rate debt | $ | 2,433 | $ | 157,420 | $ | 481,443 | $ | 510,922 | $ | 356,912 | $ | 2,720,655 | $ | 4,229,785 | $ | (14,260 | ) | $ | 4,215,525 | |||||||||||||||||||||||||||
| Unhedged variable-rate debt | — | 62,289 | 152,872 | — | — | — | 215,161 | — | 215,161 | |||||||||||||||||||||||||||||||||||||
| Total debt | $ | 2,433 | $ | 219,709 | $ | 634,315 | $ | 510,922 | $ | 356,912 | $ | 2,720,655 | $ | 4,444,946 | $ | (14,260 | ) | $ | 4,430,686 | |||||||||||||||||||||||||||
| (1) | Represents the weighted-average interest rate as of the end of the applicable period, including expense/income related to our interest rate hedge agreements, amortization of debt premiums (discounts), amortization of loan fees, and other bank fees. |
| (2) | Reflects any extension options that we control. |
| (3) | See our table of secured construction loans on the following page regarding options to extend maturity dates. |
| (4) | Our $1.65 billion unsecured senior line of credit contains a feature that allows lenders to competitively bid on the interest rate for borrowings under the facility. This may result in an interest rate that is below the stated rate. In addition to the cost of borrowing, the facility is subject to an annual facility fee of 0.20%, based on the aggregate commitments. Unamortized deferred financing costs related to our unsecured senior line of credit are classified in other assets and are excluded from the calculation of the weighted-average interest rate. |
| Summary of Debt (continued) | |
| March 31, 2017 | |
| (Dollars in thousands) | |
Secured construction loans
| Property/Market/Submarket | Stated Rate | Maturity Date | Outstanding Balance | Remaining Commitments | Aggregate Commitments | ||||||||||||||||
| 75/125 Binney Street/Greater Boston/Cambridge | L+1.35 | % | 8/23/18 | $ | 212,289 | $ | 38,111 | $ | 250,400 | ||||||||||||
| 50 and 60 Binney Street/Greater Boston/Cambridge | L+1.50 | % | 1/28/19 | (1) | 288,269 | 61,731 | 350,000 | ||||||||||||||
| 100 Binney Street/Greater Boston/Cambridge | L+2.00 | % | (2) | 4/20/19 | (3) | 137,603 | 166,678 | 304,281 | |||||||||||||
| $ | 638,161 | $ | 266,520 | $ | 904,681 | ||||||||||||||||
| (1) | We have two, one-year options to extend the stated maturity date to January 28, 2021, subject to certain conditions. |
| (2) | See the interest rate cap agreements in table at the bottom of this page. |
| (3) | We have two, one-year options to extend the stated maturity date to April 20, 2021, subject to certain conditions. |
Debt covenants
Debt Covenant Ratios (1) | Unsecured Senior Notes Payable | $1.65 Billion Unsecured Senior Line of Credit and Unsecured Senior Bank Term Loans | ||||||
| Requirement | Actual | Requirement | Actual | |||||
| Total Debt to Total Assets | ≤ 60% | 36% | ≤ 60.0% | 31.6% | ||||
| Secured Debt to Total Assets | ≤ 40% | 9% | ≤ 45.0% | 7.3% | ||||
| Consolidated EBITDA to Interest Expense | ≥ 1.5x | 5.8x | ≥ 1.50x | 3.58x | ||||
| Unencumbered Total Asset Value to Unsecured Debt | ≥ 150% | 279% | N/A | N/A | ||||
| Unsecured Leverage Ratio | N/A | N/A | ≤ 60.0% | 30.3% | ||||
| Unsecured Interest Coverage Ratio | N/A | N/A | ≥ 1.50x | 6.37x | ||||
| (1) | All covenant ratio titles utilize terms as defined in the respective debt agreements; therefore, EBITDA is not calculated under the definition set forth by the SEC in Exchange Act Release No. 47226. |
Interest rate hedge agreements
| Interest Rate Hedge Type | Effective Date | Maturity Date | Number of Contracts | Weighted-Average Interest Pay Rate/ Cap Rate (1) | Fair Value as of 3/31/17 | Notional Amount in Effect as of | |||||||||||||||||||||||
| 3/31/17 | 12/31/17 | 12/31/18 | 12/31/19 | ||||||||||||||||||||||||||
| Swap | March 31, 2017 | March 31, 2018 | 15 | 1.31% | $ | (682 | ) | $ | 900,000 | $ | 900,000 | $ | — | $ | — | ||||||||||||||
| Cap | July 29, 2016 | April 20, 2019 | 2 | 2.00% | 231 | 73,000 | 126,000 | 150,000 | — | ||||||||||||||||||||
| Swap | March 29, 2018 | March 31, 2019 | 6 | 1.01% | 3,101 | — | — | 450,000 | — | ||||||||||||||||||||
| Swap | March 29, 2018 | March 31, 2019 | 2 | 1.60% | N/A | (2) | — | — | 150,000 | — | |||||||||||||||||||
| Swap | March 29, 2019 | March 31, 2020 | 1 | 1.89% | N/A | (2) | — | — | — | 100,000 | |||||||||||||||||||
| Total | $ | 2,650 | (3) | $ | 973,000 | $ | 1,026,000 | $ | 750,000 | $ | 100,000 | ||||||||||||||||||
| (1) | In addition to the interest pay rate for each swap agreement, interest is payable at an applicable margin over LIBOR for borrowings outstanding as of March 31, 2017, as listed under the column heading “Stated Rate” in our summary table of outstanding indebtedness and respective principal payments on page 47. |
| (2) | These interest rate swap agreements were executed in April 2017. |
| (3) | This total represents the net of the fair value of interest rate hedges in an asset position of $4.5 million and fair value of interest rate hedges in a liability position of $1.8 million. |
| |
| Definitions and Reconciliations | |
| March 31, 2017 | |
This section contains additional information for sections throughout this supplemental information package as well as explanations of certain non-GAAP financial measures and the reasons why we use these supplemental measures of performance and believe they provide useful information to investors. Additional detail can be found in our most recent annual report on Form 10-K and subsequent quarterly reports on Form 10-Q, as well as other documents filed with or furnished to the SEC from time to time.
Adjusted EBITDA and Adjusted EBITDA margins
The following table reconciles net income (loss), the most directly comparable financial measure calculated and presented in accordance with GAAP, to Adjusted EBITDA:
| Three Months Ended | |||||||||||||||||||
| (Dollars in thousands) | 3/31/17 | 12/31/16 | 9/30/16 | 6/30/16 | 3/31/16 | ||||||||||||||
| Net income (loss) | $ | 47,555 | $ | 19,792 | $ | 28,559 | $ | (108,116 | ) | $ | 9,966 | ||||||||
| Interest expense | 29,784 | 31,223 | 25,850 | 25,025 | 24,855 | ||||||||||||||
| Income taxes | 767 | 737 | 355 | 924 | 1,095 | ||||||||||||||
| Depreciation and amortization | 97,183 | 95,222 | 77,133 | 70,169 | 70,866 | ||||||||||||||
| Stock compensation expense | 5,252 | 6,426 | 7,451 | 6,117 | 5,439 | ||||||||||||||
| Loss on early extinguishment of debt | 670 | — | 3,230 | — | — | ||||||||||||||
| Gain on sales of real estate – rental properties | (270 | ) | (3,715 | ) | — | — | — | ||||||||||||
| Gain on sales of real estate – land parcels | — | — | (90 | ) | — | — | |||||||||||||
| Impairment of real estate and non-real estate investments | — | 16,024 | 11,179 | 156,143 | 28,980 | ||||||||||||||
| Adjusted EBITDA | $ | 180,941 | $ | 165,709 | $ | 153,667 | $ | 150,262 | $ | 141,201 | |||||||||
| Revenues | $ | 270,877 | $ | 249,162 | $ | 230,379 | $ | 226,076 | $ | 216,089 | |||||||||
| Adjusted EBITDA margins | 67% | 67% | 67% | 66% | 65% | ||||||||||||||
We use Adjusted EBITDA as a supplemental performance measure of our core operations for financial and operational decision making, and as a supplemental or additional means of evaluating period-to-period comparisons on a consistent basis. Adjusted EBITDA is calculated as earnings before interest, taxes, depreciation, and amortization (“EBITDA”), excluding stock compensation expense, gains or losses on early extinguishment of debt, gains or losses on sales of real estate, and impairments. We believe Adjusted EBITDA provides investors relevant and useful information because it allows investors to view income from our operations on an unleveraged basis before the effects of interest, taxes, depreciation and amortization, stock compensation expense, gains or losses on early extinguishment of debt, gains or losses on sales of real estate, and impairments.
By excluding interest expense and gains or losses on early extinguishment of debt, Adjusted EBITDA allows investors to measure our performance independent of our capital structure and indebtedness. We believe that excluding charges related to share-based compensation facilitates a comparison of our operations across periods without the variances caused by the volatility of the expense (which depends on market forces outside our control). We believe that adjusting for the effects of impairments and gains or losses on sales of real estate allows investors to evaluate performance from period to period on a consistent basis without having to account for differences recognized because of investment and disposition decisions. Adjusted EBITDA has limitations as a measure of our performance. Adjusted EBITDA does not reflect our historical cash expenditures or future cash requirements for capital expenditures or contractual commitments. While Adjusted EBITDA is a relevant measure of performance, it does not represent net income or cash flows from operations calculated and
presented in accordance with GAAP, and it should not be considered as an alternative to those indicators in evaluating performance or liquidity.
Annual rental revenue
Annual rental revenue represents the annualized fixed base rental amount in effect as of the end of the period, related to our operating RSF (using rental revenue, including straight-line rent adjustments). Annual rental revenue and measures computed using annual rental revenue are presented at 100% for all properties under our management, including properties held by our consolidated and unconsolidated real estate joint ventures. As of March 31, 2017, approximately 97% of our leases (on an RSF basis) were triple net leases, requiring tenants to pay substantially all real estate taxes, insurance, utilities, common area expenses, and other operating expenses (including increases thereto) in addition to base rent. Annual rental revenue excludes these operating expenses recovered from our tenants. Amounts recovered from our tenants related to these operating expenses are classified in tenant recoveries in our consolidated statements of income.
Average cash yield
See definition of initial stabilized yield (unlevered).
Cash interest
Cash interest is equal to interest expense calculated in accordance with GAAP plus capitalized interest, less amortization of loan fees and amortization of debt premiums (discounts). See definition of fixed-charge coverage ratio for a reconciliation of interest expense, the most directly comparable financial measure calculated and presented in accordance with GAAP, to cash interest.
Class A properties and AAA locations
Class A properties are properties clustered in AAA locations that provide innovative tenants with highly dynamic and collaborative environments that enhance their ability to successfully recruit and retain world-class talent and inspire productivity, efficiency, creativity, and success. Class A properties generally command higher annual rental revenue than other classes of similar properties.
AAA locations are in close proximity to concentrations of specialized skills, knowledge, institutions, and related businesses. Such locations are generally characterized by high barriers to entry for new landlords, high barriers to exit for tenants, and a limited supply of available space.
Dividend payout ratio (common stock)
Dividend payout ratio (common stock) is the ratio of the absolute dollar amount of dividends on our common stock (shares of common stock outstanding on the respective record dates multiplied by the related dividend per share) to funds from operations attributable to Alexandria’s common stockholders – diluted, as adjusted.
Dividend yield
Dividend yield for the quarter represents the annualized quarter dividend divided by the closing common stock price at the end of the quarter.
| |
| Definitions and Reconciliations (continued) | |
| March 31, 2017 | |
Fixed-charge coverage ratio
Fixed-charge coverage ratio is a non-GAAP financial measure representing the ratio of Adjusted EBITDA to fixed charges. This ratio is useful to investors as a supplemental measure of our ability to satisfy fixed financing obligations and preferred stock dividends. Cash interest is equal to interest expense calculated in accordance with GAAP, plus capitalized interest, less amortization of loan fees and amortization of debt (premiums) discounts. The fixed-charge coverage ratio calculation below is not directly comparable to the computation of ratio of earnings to fixed charges as defined in Item
503(d) of Regulation S-K and to the computation of “Consolidated Ratio of Earnings to Fixed Charges and Consolidated Ratio of Earnings to Combined Fixed Charges and Preferred Stock Dividends” included in Exhibit 12.1 to our annual report on Form 10-K.
The following table reconciles interest expense, the most directly comparable financial measure calculated and presented in accordance with GAAP, to cash interest and fixed charges:
| Three Months Ended | |||||||||||||||||||
| (Dollars in thousands) | 3/31/17 | 12/31/16 | 9/30/16 | 6/30/16 | 3/31/16 | ||||||||||||||
| Adjusted EBITDA | $ | 180,941 | $ | 165,709 | $ | 153,667 | $ | 150,262 | $ | 141,201 | |||||||||
| Interest expense | $ | 29,784 | $ | 31,223 | $ | 25,850 | $ | 25,025 | $ | 24,855 | |||||||||
| Capitalized interest | 13,164 | 11,659 | 14,903 | 13,788 | 12,099 | ||||||||||||||
| Amortization of loan fees | (2,895 | ) | (3,080 | ) | (3,080 | ) | (2,953 | ) | (2,759 | ) | |||||||||
| Amortization of debt premiums | 596 | 383 | 5 | 26 | 86 | ||||||||||||||
| Cash interest | 40,649 | 40,185 | 37,678 | 35,886 | 34,281 | ||||||||||||||
| Dividends on preferred stock | 3,784 | 3,835 | 5,007 | 5,474 | 5,907 | ||||||||||||||
| Fixed charges | $ | 44,433 | $ | 44,020 | $ | 42,685 | $ | 41,360 | $ | 40,188 | |||||||||
| Fixed-charge coverage ratio: | |||||||||||||||||||
| – quarter annualized | 4.1x | 3.8x | 3.6x | 3.6x | 3.5x | ||||||||||||||
| – trailing 12 months | 3.8x | 3.6x | 3.6x | 3.6x | 3.5x | ||||||||||||||
Funds from operations and funds from operations, as adjusted (attributable to Alexandria’s common stockholders)
GAAP-basis accounting for real estate assets utilizes historical cost accounting and assumes that real estate values diminish over time. In an effort to overcome the difference between real estate values and historical cost accounting for real estate assets, the NAREIT Board of Governors established the measurement tool of funds from operations. Since its introduction, funds from operations has become a widely used non-GAAP financial measure among equity REITs. We believe that funds from operations is helpful to investors as an additional measure of the performance of an equity REIT. Moreover, we believe that funds from operations, as adjusted, allows investors to compare our performance to the performance of other real estate companies on a consistent basis, without having to account for differences recognized because of investment and disposition decisions, financing decisions, capital structures, and capital market transactions. We compute funds from operations in accordance with standards established by the NAREIT Board of Governors in its April 2002 White Paper and related implementation guidance (the “NAREIT White Paper”). The NAREIT White Paper defines funds from operations as net income (computed in accordance with GAAP), excluding gains (losses) from sales of depreciable real estate and land parcels, and impairments of depreciable real estate (excluding land parcels) plus real estate-related depreciation and amortization, and after adjustments for our share of consolidated and unconsolidated partnerships and real estate joint ventures. Impairments represent the write-down of assets when fair value over the recoverability period is less than the carrying value due to changes in general market conditions and do not necessarily reflect the operating performance of the properties during the corresponding period.
We compute funds from operations, as adjusted, as funds from operations calculated in accordance with the NAREIT White Paper less/plus significant gains/losses on the sale of investments, plus losses on early extinguishment of debt, preferred stock redemption charges, impairments of non-depreciable real estate and land parcels, impairments of non-real estate investments, and deal costs, and the amount of such items that is allocable to our unvested restricted stock awards. Neither funds from operations nor funds from operations, as adjusted, should be considered as alternatives to net income (determined in accordance with GAAP) as indications of financial performance, or to cash flows from operating activities (determined in accordance with GAAP) as measures of liquidity, nor are they indicative of the availability of funds for our cash needs, including our ability to make distributions.
Initial stabilized yield (unlevered)
Initial stabilized yield is calculated as the quotient of the estimated amounts of net operating income at stabilization and our investment in the property. Our initial stabilized yield excludes the benefit of leverage. Our cash rents related to our value-creation projects are expected to increase over time due to contractual annual rent escalations, and our average cash yields are generally expected to be greater than our initial stabilized yields (cash basis). Our estimates for initial stabilized yields, initial stabilized yields (cash basis), and total costs at completion represent our initial estimates at the commencement of the project. We expect to update this information upon completion of the project, or sooner, if there are significant changes to the expected project yields or costs.
| • | Initial stabilized yield reflects rental income, including contractual rent escalations and any rent concessions over the term(s) of the lease(s), calculated on a straight-line basis. |
| • | Initial stabilized yield (cash basis) reflects cash rents at the stabilization date after initial rental concessions, if any, have elapsed and our total cash investment in the property. |
Average cash yield reflects cash rents, including contractual rent escalations after initial rental concessions have elapsed, calculated on a straight-line basis, and our total cash investment in the property.
| |
| Definitions and Reconciliations (continued) | |
| March 31, 2017 | |
Joint venture financial information
We present components of operating results and balance sheet information related to our joint ventures, which are not in accordance with or intended to be presentations in accordance with GAAP. We present the proportionate share of certain financial line items as follows: (i) for each real estate joint venture that we consolidate in our financial statements, but of which we own less than 100%, we apply the noncontrolling interest economic ownership percentage to each financial item to arrive at the amount of such noncontrolling interest share of each component presented; and (ii) for each real estate joint venture that we do not control, and do not consolidate, we apply our economic ownership percentage to each financial item to arrive at our proportionate share of each component presented.
The components of operating results and balance sheet information related to joint ventures do not represent our legal claim to those items. The joint venture agreement for each entity that we do not wholly own generally determines what equity holders can receive upon capital events, such as sales or refinancing, or in the event of a liquidation. Equity holders are normally entitled to their respective legal ownership of any residual cash from a joint venture only after all liabilities, priority distributions, and claims have been repaid or satisfied.
We believe this information can help investors estimate the operating results and balance sheet information related to partially owned entities. Presenting this information provides a perspective not immediately available from consolidated financial statements and one that can supplement an understanding of joint venture assets, liabilities, revenues, and expenses included in our consolidated results.
The components of operating results and balance sheet information related to joint ventures are limited as an analytical tool, as the overall economic ownership interest does not represent our legal claim to each of our joint ventures’ assets, liabilities, or results of operations. In addition, joint venture financial information may include financial information related to the unconsolidated real estate joint ventures that we do not control. We believe that in order to facilitate a clear understanding of our operating results and our total assets and liabilities, joint venture financial information should be examined in conjunction with our consolidated statements of income and balance sheets. Joint venture financial information should not be considered an alternative to our consolidated financial statements, which are prepared in accordance with GAAP.
Net cash provided by operating activities after dividends
Net cash provided by operating activities after dividends includes the deduction for distributions to noncontrolling interests. For purposes of this calculation, changes in operating assets and liabilities are excluded as they represent timing differences.
Net debt to Adjusted EBITDA and net debt and preferred stock to Adjusted EBITDA
Net debt to Adjusted EBITDA is a non-GAAP financial measure that we believe is useful to investors as a supplemental measure in evaluating our balance sheet leverage. Net debt is equal to the sum of total consolidated debt less cash, cash equivalents, and restricted cash. Net debt and preferred stock is equal to the sum of net debt, as discussed above, plus preferred stock outstanding as of period end. Refer to “Adjusted EBITDA” for further information on the calculation of Adjusted EBITDA.
The following table reconciles debt to net debt, and to net debt and preferred stock, and computes the ratio of each to Adjusted EBITDA:
| (Dollars in thousands) | 3/31/17 | 12/31/16 | 9/30/16 | 6/30/16 | 3/31/16 | |||||||||||||||
| Secured notes payable | $ | 1,083,758 | $ | 1,011,292 | $ | 789,450 | $ | 722,794 | $ | 816,578 | ||||||||||
| Unsecured senior notes payable | 2,799,508 | 2,378,262 | 2,377,482 | 2,376,713 | 2,031,284 | |||||||||||||||
| Unsecured senior line of credit | — | 28,000 | 416,000 | 72,000 | 299,000 | |||||||||||||||
| Unsecured senior bank term loans | 547,420 | 746,471 | 746,162 | 945,030 | 944,637 | |||||||||||||||
| Unamortized deferred financing costs | 31,616 | 29,917 | 31,420 | 34,302 | 28,474 | |||||||||||||||
| Cash and cash equivalents | (151,209 | ) | (125,032 | ) | (157,928 | ) | (256,000 | ) | (146,197 | ) | ||||||||||
| Restricted cash | (18,320 | ) | (16,334 | ) | (16,406 | ) | (13,131 | ) | (14,885 | ) | ||||||||||
| Net debt | $ | 4,292,773 | $ | 4,052,576 | $ | 4,186,180 | $ | 3,881,708 | $ | 3,958,891 | ||||||||||
| Net debt | $ | 4,292,773 | $ | 4,052,576 | $ | 4,186,180 | $ | 3,881,708 | $ | 3,958,891 | ||||||||||
| 7.00% Series D convertible preferred stock | 74,386 | 86,914 | 161,792 | 188,864 | 213,864 | |||||||||||||||
| 6.45% Series E redeemable preferred stock | — | 130,000 | 130,000 | 130,000 | 130,000 | |||||||||||||||
| Net debt and preferred stock | $ | 4,367,159 | $ | 4,269,490 | $ | 4,477,972 | $ | 4,200,572 | $ | 4,302,755 | ||||||||||
| Adjusted EBITDA: | ||||||||||||||||||||
| – quarter annualized | $ | 723,764 | $ | 662,836 | $ | 614,668 | $ | 601,048 | $ | 564,804 | ||||||||||
| – trailing 12 months | $ | 650,579 | $ | 610,839 | $ | 591,646 | $ | 579,880 | $ | 562,454 | ||||||||||
| Net debt to Adjusted EBITDA: | ||||||||||||||||||||
| – quarter annualized | 5.9 | x | 6.1 | x | 6.8 | x | 6.5 | x | 7.0 | x | ||||||||||
| – trailing 12 months | 6.6 | x | 6.6 | x | 7.1 | x | 6.7 | x | 7.0 | x | ||||||||||
| Net debt and preferred stock to Adjusted EBITDA: | ||||||||||||||||||||
| – quarter annualized | 6.0 | x | 6.4 | x | 7.3 | x | 7.0 | x | 7.6 | x | ||||||||||
| – trailing 12 months | 6.7 | x | 7.0 | x | 7.6 | x | 7.2 | x | 7.6 | x | ||||||||||
| |
| Definitions and Reconciliations (continued) | |
| March 31, 2017 | |
Net operating income
The following table reconciles net income to total net operating income:
| Three Months Ended | ||||||||
| (Dollars in thousands) | 3/31/17 | 3/31/16 | ||||||
| Net Income | $ | 47,555 | $ | 9,966 | ||||
| Equity in (earnings) losses of unconsolidated real estate joint venture | (361 | ) | 397 | |||||
| General and administrative expenses | 19,229 | 15,188 | ||||||
| Interest expense | 29,784 | 24,855 | ||||||
| Depreciation and amortization | 97,183 | 70,866 | ||||||
| Impairment of real estate | — | 28,980 | ||||||
| Loss on early extinguishment of debt | 670 | — | ||||||
| Gain on sales of real estate – rental properties | (270 | ) | — | |||||
| Total net operating income | $ | 193,790 | $ | 150,252 | ||||
Net operating income is a non-GAAP financial measure calculated as net income, the most directly comparable financial measure calculated and presented in accordance with GAAP, excluding our equity in the earnings (losses) of our unconsolidated joint ventures, general and administrative expenses, interest expense, depreciation and amortization, impairment of real estate, gain or loss on early extinguishment of debt, and gain or loss on sales of real estate. We believe net operating income provides useful information to investors regarding our financial condition and results of operations because it primarily reflects those income and expense items that are incurred at the property level. Therefore, we believe net operating income is a useful measure for evaluating the operating performance of our real estate assets. Net operating income on a cash basis is net operating income adjusted to exclude the effect of straight-line rent and amortization of acquired above- and below-market lease revenue adjustments required by GAAP. We believe that net operating income on a cash basis is helpful to investors as an additional measure of operating performance because it eliminates the timing differences between the recognition of revenue in accordance with GAAP and the receipt of payments reflected in our consolidated results.
Further, we believe net operating income is useful to investors as a performance measure because, when compared across periods, net operating income reflects trends in occupancy rates, rental rates, and operating costs, which provide a perspective not immediately apparent from net income. Net operating income can be used to measure the initial stabilized yields of our properties by calculating the quotient of net operating income generated by a property on a straight-line basis, and our investment in the property. Net operating income excludes certain components from net income in order to provide results that are more closely related to the results of operations of our properties. For example, interest expense is not necessarily linked to the operating performance of a real estate asset and is often incurred at the corporate level rather than at the property level. In addition, depreciation and amortization, because of historical cost accounting and useful life estimates, may distort comparability of operating performance at the property level. Impairments of real estate have been excluded in deriving net operating income because we do not consider impairments of real estate to be property-level operating expenses. Impairments of real estate relate to changes in the values of our assets and do not reflect the current operating performance with respect to related revenues or expenses. Our impairments of real estate represent the write-down in the value of the assets to the estimated fair value less cost to sell. These impairments result from investing decisions and deterioration in market conditions. Our calculation of net operating income also excludes charges incurred from changes in certain financing decisions, such as loss on early extinguishment of debt, as these charges often relate
to corporate strategy. Property operating expenses that are included in determining net operating income primarily consist of costs that are related to our operating properties, such as utilities, repairs, and maintenance; rental expense related to ground leases; contracted services, such as janitorial, engineering, and landscaping; property taxes and insurance; and property-level salaries. General and administrative expenses consist primarily of accounting and corporate compensation, corporate insurance, professional fees, office rent, and office supplies that are incurred as part of corporate office management.
We believe that in order to facilitate a clear understanding of our operating results, net operating income should be examined in conjunction with net income as presented in our consolidated statements of income. Net operating income should not be considered as an alternative to net income as an indication of our performance, nor as an alternative to cash flows as a measure either of liquidity or our ability to make distributions.
Operating statistics
We present certain operating statistics related to our properties, including number of properties, annual rental revenue, annual rental revenue per occupied RSF, occupancy percentage, RSF, leasing activity, rental rates, and contractual lease expirations as of the end of the period. We believe these measures are useful to investors because they facilitate an understanding of certain trends for our properties. We compute operating statistics at 100% for all properties managed by us, including properties owned by our consolidated and unconsolidated real estate joint ventures.
Stabilized occupancy date
The stabilized occupancy date represents the estimated date on which the project is expected to reach occupancy of 95% or greater.
Same property comparisons
As a result of changes within our total property portfolio during the comparative periods presented, including changes from assets acquired or sold, properties placed into development or redevelopment, and development and/or redevelopment properties recently placed into service, the consolidated total rental revenues, tenant recoveries, and rental operating expenses in our operating results can show significant changes from period to period. In order to supplement an evaluation of our results of operations over a given period, we analyze the operating performance for all properties, referred to as same properties, that were fully operating for the entirety of the comparative periods presented. These properties are analyzed separately from properties acquired subsequent to the first day in the earliest comparable period presented, properties that underwent development or redevelopment at any time during the comparative periods, and corporate entities (legal entities performing general and administrative functions) that have been excluded from same property results. Additionally, rental revenues from lease termination fees, if any, are excluded from the results of same properties.
| |
| Definitions and Reconciliations (continued) | |
| March 31, 2017 | |
The following table reconciles the number of same properties to total properties:
| Development – under construction | Properties | |||
| 100 Binney Street | 1 | |||
| 510 Townsend Street | 1 | |||
| 505 Brannan Street | 1 | |||
| ARE Spectrum | 3 | |||
| 213 East Grand Avenue | 1 | |||
| 400 Dexter Avenue North | 1 | |||
| 8 | ||||
| Development – placed into service after January 1, 2016 | Properties | |||
| 50 and 60 Binney Street | 2 | |||
| 430 East 29th Street | 1 | |||
| 5200 Illumina Way, Building 6 | 1 | |||
| 4796 Executive Drive | 1 | |||
360 Longwood Avenue (unconsolidated joint venture) | 1 | |||
| 1455 and 1515 Third Street | 2 | (1) | ||
| 8 | ||||
| Redevelopment – under construction | Properties | |||
| 9625 Towne Centre Drive | 1 | |||
| 1 | ||||
| Redevelopment – placed into service after January 1, 2016 | Properties | ||
| 10151 Barnes Canyon Road | 1 | ||
| 11 Hurley Street | 1 | ||
| 10290 Campus Point Drive | 1 | ||
| 3 | |||
| Acquisitions after January 1, 2016 | Properties | ||
| Torrey Ridge Science Center | 3 | ||
Alexandria Center® at One Kendall Square | 9 | ||
| 88 Bluxome Street | 1 | ||
| 13 | |||
| Total properties excluded from same properties | 33 | ||
| Same properties | 166 | ||
| Total properties in North America as of March 31, 2017 | 199 | ||
| (1) | Represents two land parcels and a parking garage 100% leased to Uber. |
Total equity market capitalization
Total equity market capitalization is equal to the sum of outstanding shares of 7.00% Series D cumulative convertible preferred stock and common stock multiplied by the related closing price of each class of security at the end of each period presented.
Total market capitalization
Total market capitalization is equal to the sum of total equity market capitalization and total debt.
Unencumbered net operating income as a percentage of total net operating income
Unencumbered net operating income as a percentage of total net operating income is a non-GAAP financial measure that we believe is useful to investors as a performance measure of the results of operations of our unencumbered real estate assets, as it reflects those income and expense items that are incurred at the unencumbered property level. We use unencumbered net operating income as a percentage of total net operating income in order to assess our compliance with our financial covenants under our debt obligations because the measure serves as a proxy for a financial measure under such debt obligations. Unencumbered net operating income is derived from assets classified in continuing operations, which are not subject to any mortgage, deed of trust, lien, or other security interest, as of the period for which income is presented.
The following table summarizes unencumbered net operating income as a percentage of total net operating income:
| Three Months Ended | |||||||||||||||||||
| (Dollars in thousands) | 3/31/17 | 12/31/16 | 9/30/16 | 6/30/16 | 3/31/16 | ||||||||||||||
| Unencumbered net operating income | $ | 157,391 | $ | 143,570 | $ | 137,943 | $ | 138,283 | $ | 123,801 | |||||||||
| Encumbered net operating income | 36,399 | 32,348 | 20,434 | 20,468 | 26,451 | ||||||||||||||
| Total net operating income | $ | 193,790 | $ | 175,918 | $ | 158,377 | $ | 158,751 | $ | 150,252 | |||||||||
| Unencumbered net operating income as a percentage of total net operating income | 81% | 82% | 87% | 87% | 82% | ||||||||||||||
Weighted-average interest rate for capitalization of interest
The weighted-average interest rate required for calculating capitalization of interest pursuant to GAAP represents a weighted-average rate based on the rates applicable to borrowings outstanding during the period, including expense/income related to our interest rate hedge agreements, amortization of debt premiums (discounts), amortization of loan fees, and other bank fees. A separate calculation is performed to determine our weighted-average interest rate for capitalization for each month. The rate will vary each month due to changes in variable interest rates, outstanding debt balances, the proportion of variable-rate debt to fixed-rate debt, the amount and terms of interest rate hedge agreements, and the amount of loan fee amortization.
The following table presents the weighted-average interest rate for capitalization of interest:
| Three Months Ended | |||||||||
| 3/31/17 | 12/31/16 | 9/30/16 | 6/30/16 | 3/31/16 | |||||
| Weighted-average interest rate for capitalization of interest | 3.95% | 3.72% | 3.78% | 3.70% | 3.60% | ||||
| |
| Definitions and Reconciliations (continued) | |
| March 31, 2017 | |
Weighted-average shares of common stock outstanding – diluted
In March 2017, we entered into agreements to sell an aggregate of 6.9 million shares of our common stock, consisting of an initial issuance of 2.1 million shares and the remaining 4.8 million shares subject to forward equity sales agreements, at a public offering price of $108.55 per share, less underwriters’ discount. We issued the initial 2.1 million shares at closing in March 2017 for net proceeds, after underwriters’ discount and issuance costs, of $217.8 million and expect to settle the forward equity sales agreements on the remaining 4.8 million shares of common stock no later than March 2018.
Weighted-average shares of common stock outstanding – diluted for 1Q17 used in the computation of earnings per share – diluted, and funds from operations per share – diluted for 1Q17, include a portion of the shares related to the forward equity sales agreements using the treasury method of accounting for these 4.8 million shares (assumed an issuance of 4.8 million shares at the contractual price less the assumed repurchase of common shares at the average market price by using the net proceeds of $495.5 million from the forward equity sales agreements). In July 2016, we entered into similar forward equity sales agreements that were settled in December 2016. The weighted-average shares of common stock outstanding – diluted during each period includes the following shares related to our forward equity sales agreements pursuant to the treasury stock method:
| (In thousands) | 1Q17 | 4Q16 (1) | 3Q16 (1) | ||||||
| Earnings per share – diluted | 53 | — | (2) | 751 | |||||
| Funds from operations – diluted | 53 | 480 | 751 | ||||||
(1) Amounts represent the dilutive impact of our forward equity sales agreements settled in December 2016 within each period.(2) Antidilutive for period. | |||||||||