| Alexandria Real Estate Equities, Inc. All Rights Reserved. © 2018 | ||
| Alexandria Real Estate Equities, Inc. All Rights Reserved. © 2018 | i | |
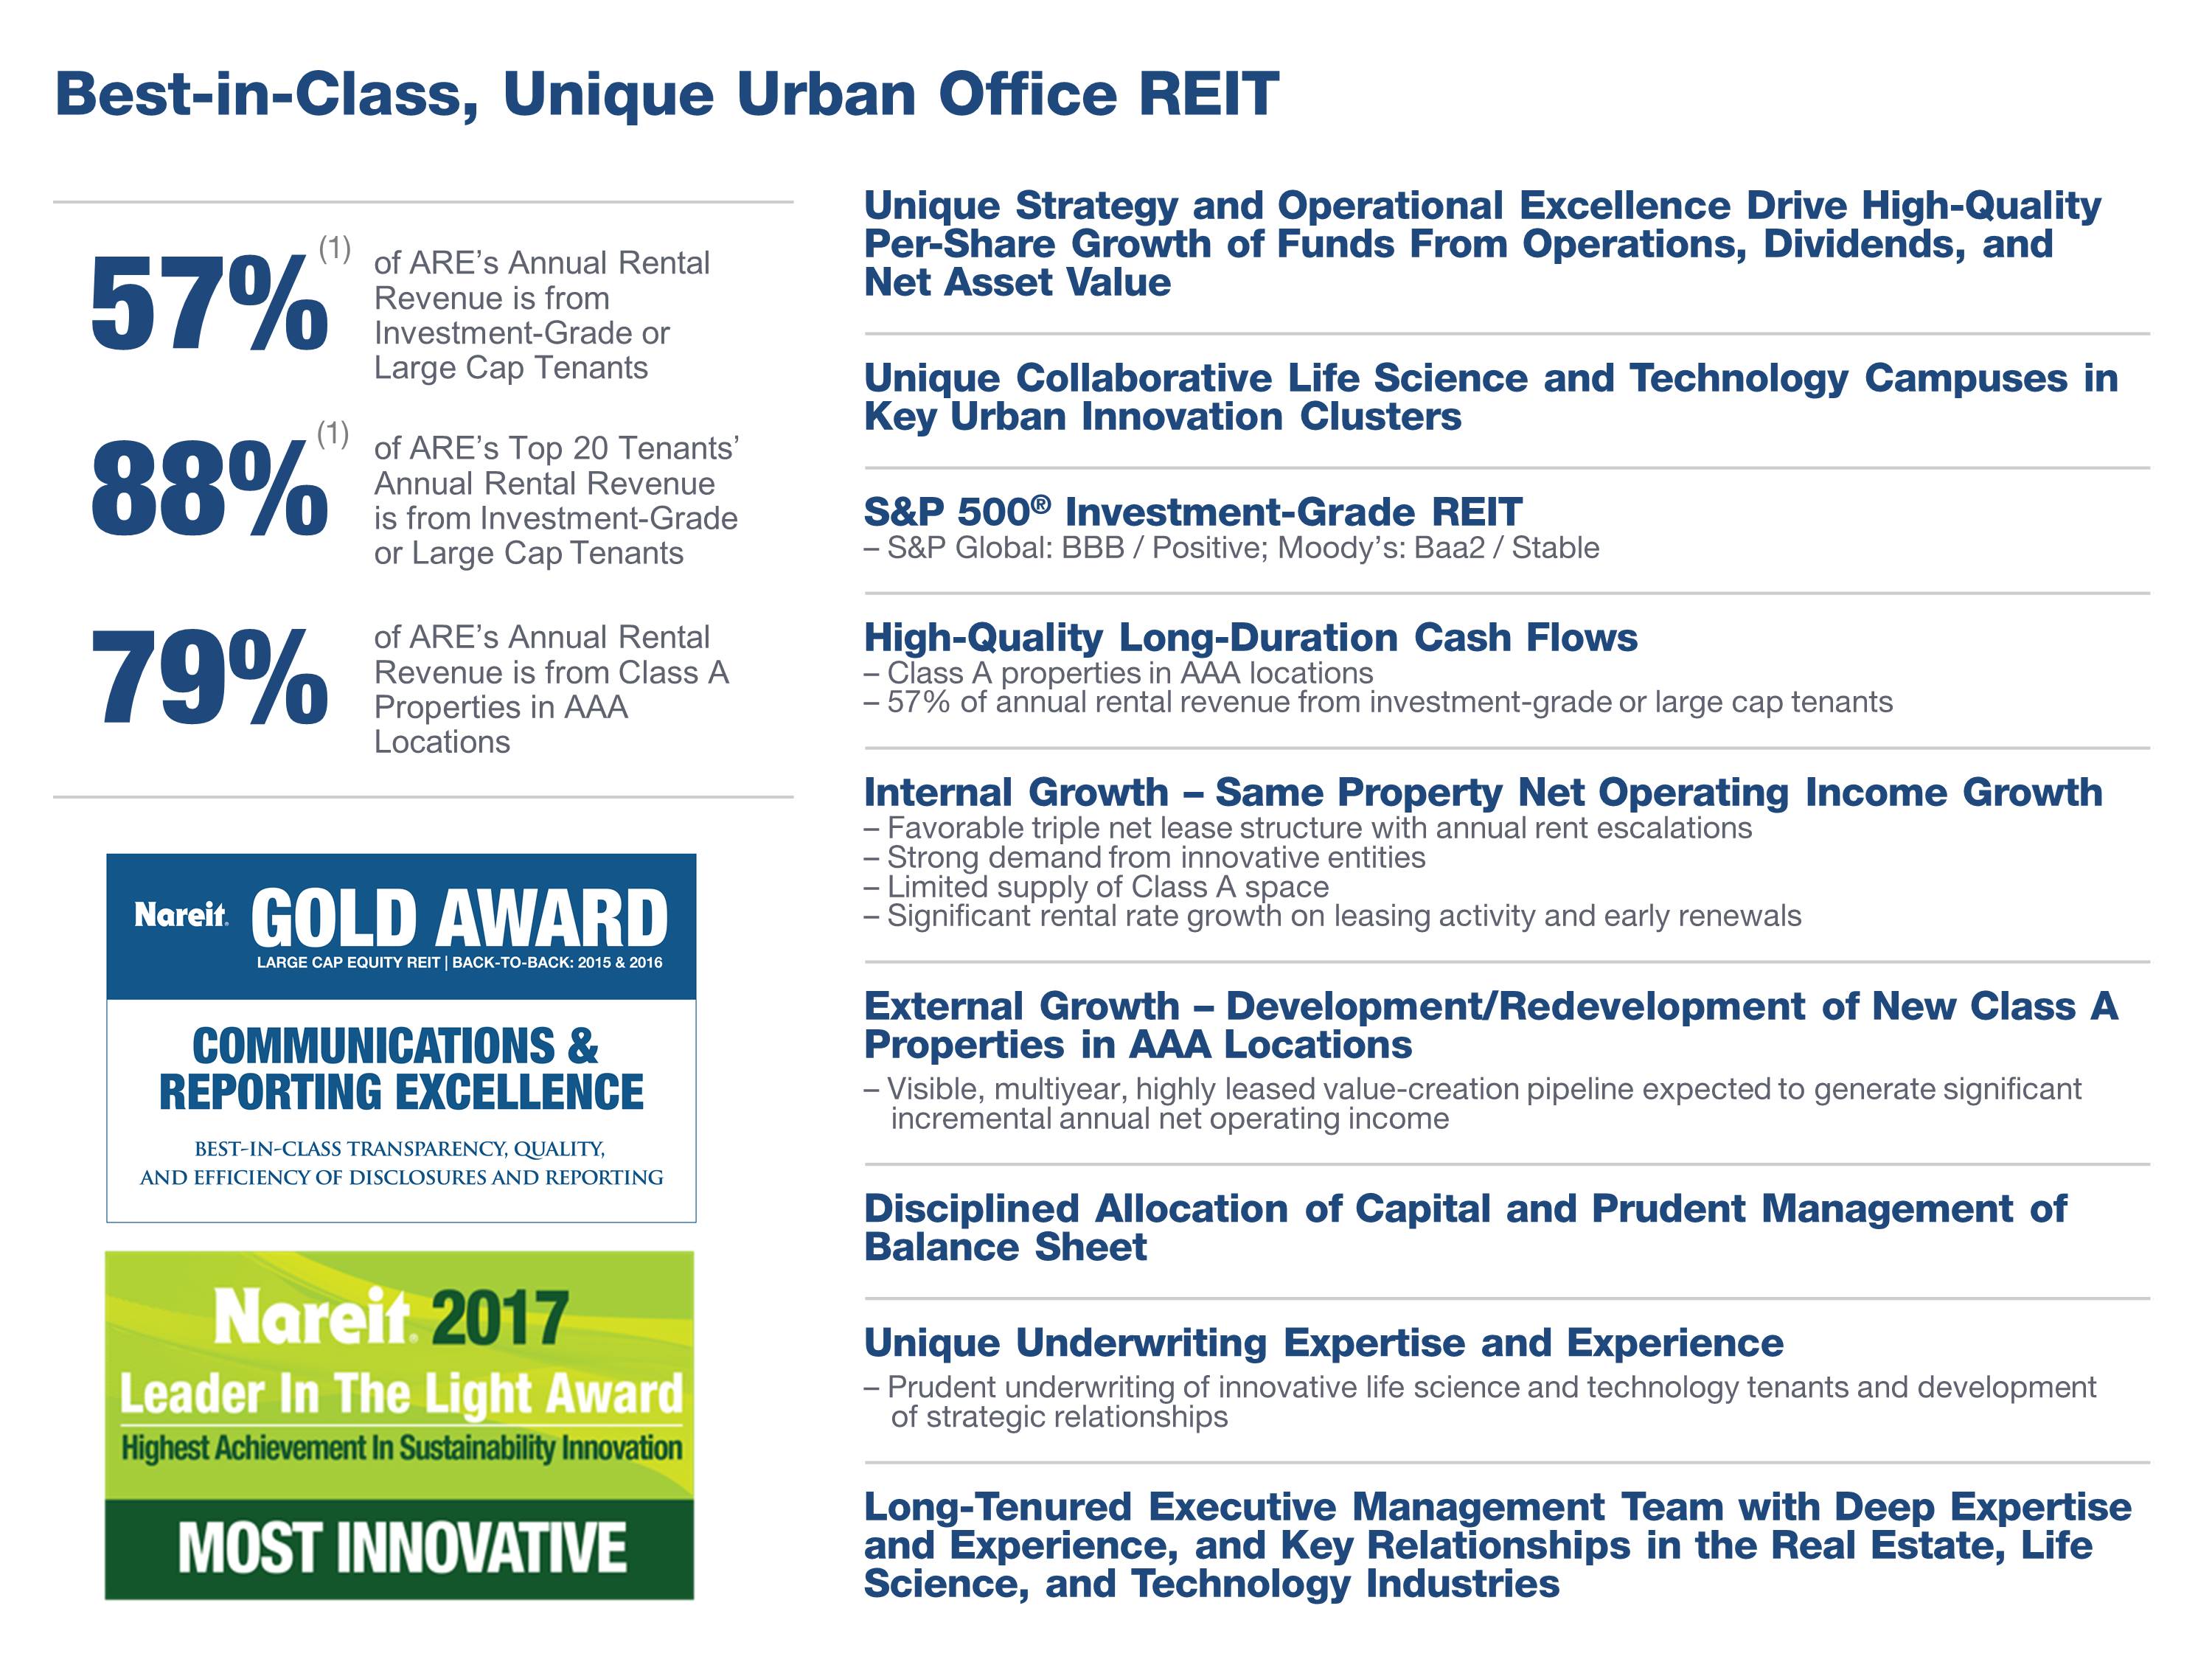
| (1) See “Definitions and Reconciliations” in our Supplemental Information. As of 1Q18, annual rental revenue from investment-grade tenants within our overall tenant base and investment-grade tenants within our top 20 tenants were 47% and 74%, respectively. | ||||
 | |
| Table of Contents | |
| March 31, 2018 | |
| EARNINGS PRESS RELEASE | Page |
| Sustainability | |
| SUPPLEMENTAL INFORMATION | Page |
| Internal Growth | |
| SUPPLEMENTAL INFORMATION (CONTINUED) | Page |
| External Growth / Investments in Real Estate | |
| New Class A Development and Redevelopment Properties: | |
| Balance Sheet Management | |
| Definitions and Reconciliations | |
This document includes “forward-looking statements” within the meaning of Section 27A of the Securities Act of 1933, as amended, and Section 21E of the Securities Exchange Act of 1934, as amended. Please see page 6 of this Earnings Press Release and Supplemental Information for further information. |
| This document is not an offer to sell or a solicitation to buy securities of Alexandria Real Estate Equities, Inc. Any offers to sell or solicitations to buy our securities shall be made only by means of a prospectus approved for that purpose. Unless otherwise indicated, the “Company,” “Alexandria,” “ARE,” “we,” “us,” and “our” refer to Alexandria Real Estate Equities, Inc. and its consolidated subsidiaries. |
| Alexandria Real Estate Equities, Inc. All Rights Reserved. © 2018 | iii | |

Alexandria Real Estate Equities, Inc.
Reports
First Quarter Ended March 31, 2018, Financial and Operating Results
Strong Internal and External Growth,
Operational Excellence, and Growing Dividends
PASADENA, Calif. – April 30, 2018 – Alexandria Real Estate Equities, Inc. (NYSE:ARE)
announced financial and operating results for the first quarter ended March 31, 2018.
Key highlights
Increased common stock dividend
Common stock dividend for 1Q18 of $0.90 per common share, up 7 cents, or 8%, over 1Q17; continuation of our strategy to share growth in cash flows from operating activities with our stockholders while also retaining a significant portion for reinvestment.
Improvement in credit rating outlook
In February 2018, S&P Global Ratings raised its credit outlook for our corporate credit rating to BBB/Positive from BBB/Stable. The positive outlook reflects S&P’s belief that “there is further ratings upside over the next couple of years stemming from the company’s high quality operating portfolio and projects under development, combined with a prudent financial policy.”
Strong internal growth
| • | Total revenues of $320.1 million, up 18.2%, for 1Q18, compared to $270.9 million for 1Q17; |
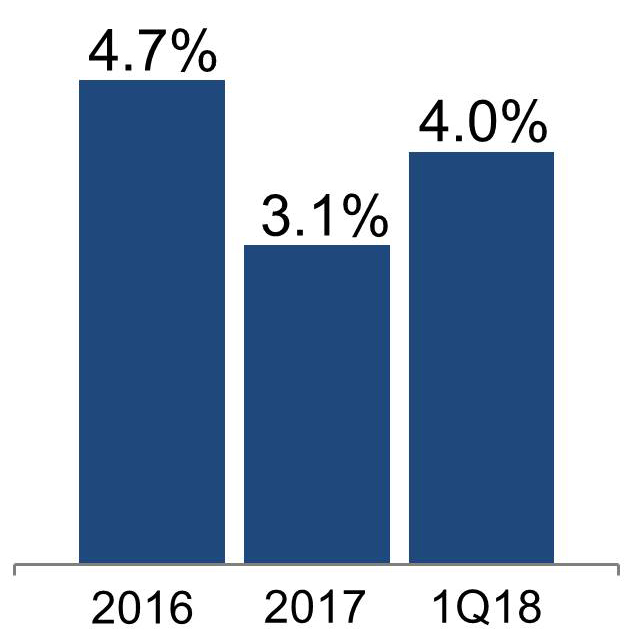
| • | Same property net operating income growth: |
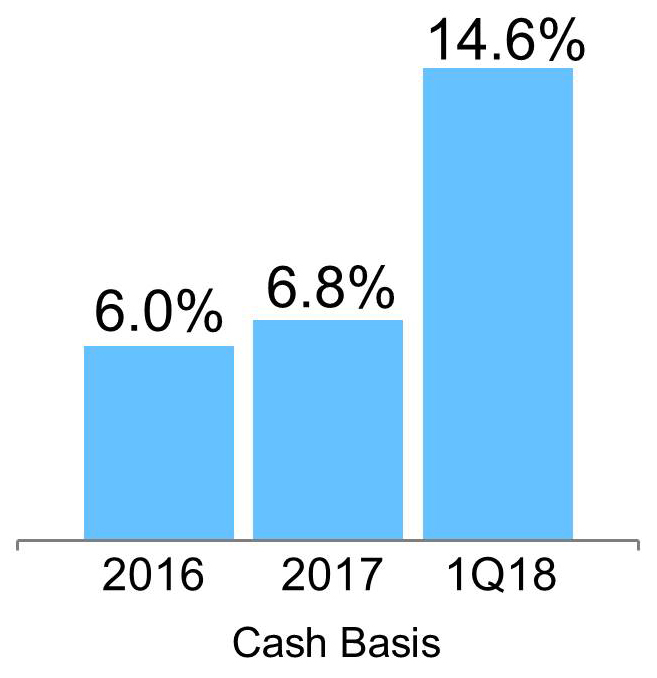
| • | 4.0% and 14.6% (cash basis) for 1Q18, compared to 1Q17; |
| • | Continued solid leasing activity and strong rental rate growth, in light of modest contractual lease expirations at the beginning of 2018 and a highly leased value-creation pipeline: |
| 1Q18 | |||
| Total leasing activity – RSF | 1,481,164 | ||
| Lease renewals and re-leasing of space: | |||
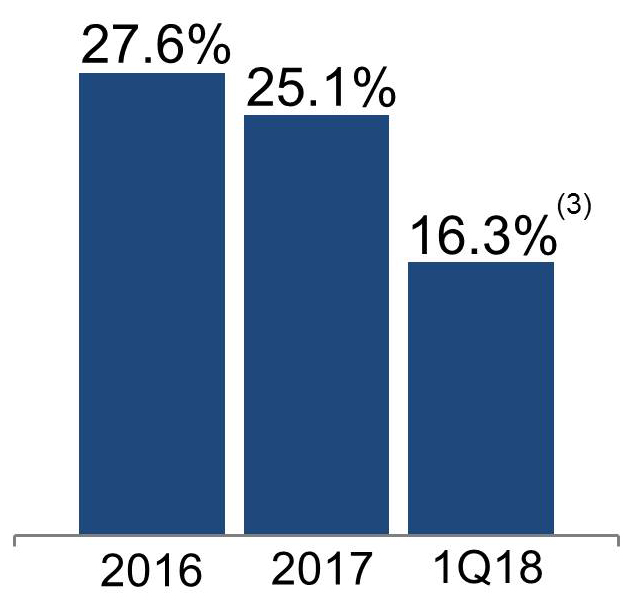
| Rental rate increases | 16.3% | ||
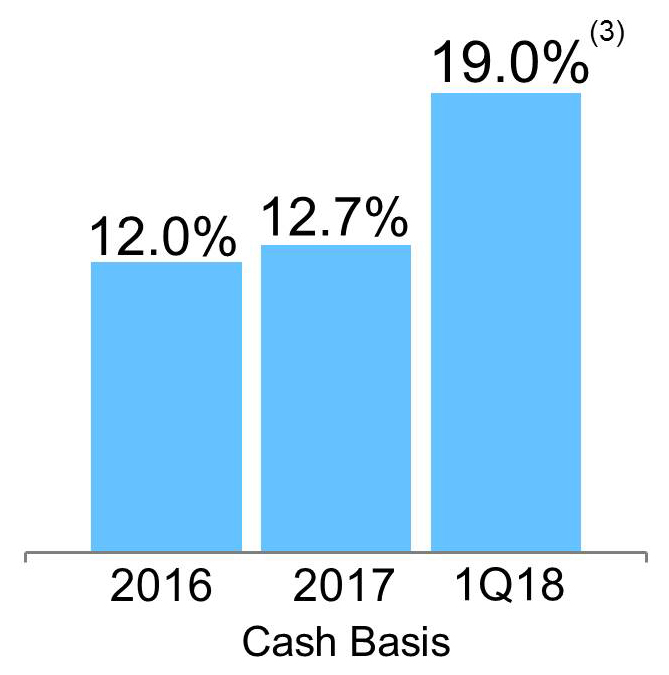
| Rental rate increases (cash basis) | 19.0% | ||
| RSF (included in total leasing activity above) | 234,548 | ||
| • | Key leases executed during 1Q18 (included in total leasing activity above): |
| Property | Submarket | RSF | Tenant | |||||
| 1655 and 1725 Third Street | Mission Bay/SoMa | 593,765 | Uber Technologies, Inc. | |||||
| Summers Ridge Science Park | Sorrento Mesa | 192,070 | Quidel Corporation | |||||
| 399 Binney Street | Cambridge | 123,403 | Three life science entities | |||||
| 279 East Grand Avenue | South San Francisco | 104,013 | Verily Life Sciences, LLC | |||||
| 681 Gateway Boulevard | South San Francisco | 60,963 | Twist Bioscience Corp. | |||||
Strong external growth; disciplined allocation of capital to visible, multiyear, highly leased
value-creation pipeline
| • | Development and redevelopment projects placed into service in 1Q18: |
| • | 91,155 RSF at our development project at 100 Binney Street in our Cambridge submarket, 100% leased to four high-quality biotechnology entities; and |
| • | 27,315 RSF at our redevelopment project at 266 and 275 Second Avenue in our Route 128 submarket, leased to Visterra, Inc. |
| • | Significant contractual near-term growth in annual cash rents of $76 million, of which $60 million will commence through 4Q18 ($35 million in 2Q18, $13 million in 3Q18, and $12 million in 4Q18). This is related to initial free rent granted on development and redevelopment projects recently placed into service (and no longer included in our value-creation pipeline) that are currently generating rental revenue. |
| • | 1Q18 commencements of development and redevelopment projects aggregating 651,951 RSF, including: |
| • | 593,765 RSF at 1655 and 1725 Third Street in our Mission Bay/SoMa submarket; and |
| • | 58,186 RSF at 704 Quince Orchard Road in our Gaithersburg submarket. |
| • | 81% leased on 2.3 million RSF of development and redevelopment projects undergoing construction (excludes RSF in service). |
Completed strategic acquisitions
Acquisitions completed or under contract:
| • | In 1Q18, we acquired 11 properties in four transactions for an aggregate purchase price of $320.5 million with current and future value-creation development and redevelopment opportunities. |
Operating results
| • | On January 1, 2018, we adopted a new accounting standard which requires us, on a prospective basis, to generally present our equity investments at fair value with changes in fair value reflected in earnings. In 1Q18, we recognized $72.2 million of unrealized gains from changes in fair value of our equity investments. |
| 1Q18 | 1Q17 | Change | ||||||||
Net income attributable to Alexandria’s common stockholders – diluted: | ||||||||||
| In millions | $ | 132.4 | $ | 25.7 | N/A | |||||
| Per share | $ | 1.32 | $ | 0.29 | N/A | |||||
Funds from operations attributable to Alexandria’s common stockholders – diluted, as adjusted: | ||||||||||
| In millions | $ | 162.5 | $ | 130.6 | 24.4 | % | ||||
| Per share | $ | 1.62 | $ | 1.48 | 9.5 | % | ||||
| See “Items Included in Net Income Attributable to Alexandria’s Common Stockholders” on the next page of this Earnings Press Release for additional information. | ||||||||||
| |
| First Quarter Ended March 31, 2018, Financial and Operating Results (continued) | |
| March 31, 2018 | |
Items included in net income attributable to Alexandria’s common stockholders: | |||||||||||||||
| (In millions, except per share amounts) | Amount | Per Share – Diluted | |||||||||||||
| 1Q18 | 1Q17 | 1Q18 | 1Q17 | ||||||||||||
Realized gain on non-real estate investment(1) | $ | 8.3 | $ | — | $ | 0.08 | $ | — | |||||||
Unrealized gains on non-real estate investments(2) | 72.2 | — | 0.70 | — | |||||||||||
| Loss on early extinguishment of debt | — | (0.7 | ) | — | (0.01 | ) | |||||||||
| Preferred stock redemption charge | — | (11.3 | ) | — | (0.12 | ) | |||||||||
| Total | $ | 80.5 | $ | (12.0 | ) | $ | 0.78 | $ | (0.13 | ) | |||||
| Weighted-average shares of common stock outstanding for calculation of earnings per share – diluted | 100.1 | 88.2 | |||||||||||||
(1) Relates to one publicly traded non-real estate investment in a life science entity. Excluding this gain, our realized investment gains were $5.1 million for 1Q18. (2) See “Investments” on page 43 of our Supplemental Information for additional information. | |||||||||||||||
Per share amounts above are shown net of the per share amounts allocable to unvested restricted stock awards.
Core operating metrics for 1Q18
High-quality revenue and cash flows and operational excellence
| • | Percentage of annual rental revenue in effect from: |
| • | Investment-grade or large cap tenants: 57% |
| • | Class A properties in AAA locations: 79% |
| • | Occupancy of operating properties in North America: 96.6% |
| • | Operating margin: 71% |
| • | Adjusted EBITDA margin: 69% |
| • | Weighted-average remaining lease term: |
| • | Total tenants: 8.7 years |
| • | Top 20 tenants: 13.2 years |
| • | See “Strong internal growth” in the key highlights section on the previous page for information on our total revenues, same property net operating income growth, leasing activity, and rental rate growth. |
Balance sheet management
Key metrics
| • | $17.9 billion of total market capitalization as of 1Q18 |
| • | $2.3 billion of liquidity as of 1Q18 |
| 1Q18 | Trailing 12 | 4Q18 | ||||
| Annualized | Months | Goal | ||||
| Net debt to Adjusted EBITDA | 5.4x | 6.1x | Less than 5.5x | |||
| Fixed-charge coverage ratio | 4.6x | 4.3x | Greater than 4.0x | |||
| Unhedged variable-rate debt as a percentage of total debt | 15% | N/A | 5% | |||
| Current and future value-creation pipeline as a percentage of gross investments in real estate in North America | 9% | N/A | 8% to 12% | |||
Key capital events
| • | In January 2018, we entered into forward equity sales agreements to sell an aggregate 6.9 million shares of our common stock (including the exercise of underwriters’ option) at a public offering price of $123.50 per share, before underwriting discounts. In March 2018, we settled 843,600 shares from our forward equity sales agreements and received proceeds of $100.2 million, net of underwriting discounts and adjustments provided in the forward equity sales agreements. We expect to receive proceeds of $713.7 million upon settlement of the remaining outstanding forward equity sales agreements, to be further adjusted as provided in the sales agreements, which will fund current and near-term value-creation projects and acquisitions in 2018. |
Corporate responsibility and industry leadership
| • | 50% of annual rental revenue expected from LEED® certified projects upon completion of nine in-process projects. Two of our properties recently received LEED certifications, demonstrating our commitment to sustainability: |
| • | In March 2018, 505 Brannan Street in our Mission Bay/SoMa submarket received LEED Platinum certification; and |
| • | In April 2018, 100 Binney Street in our Cambridge submarket received LEED Gold certification. |
| • | In January 2018, we were awarded a 2017 Governor’s Environmental and Economic Leadership Award, California’s highest environmental honor recognizing entities that have demonstrated exceptional leadership and made notable contributions to conserving precious natural resources while promoting economic growth. |
| • | In January 2018, Alexandria Venture Investments launched the Alexandria Seed Capital Platform, an innovative seed-stage life science funding model and extension of Alexandria LaunchLabs®, which provides seed-stage financing to transformative life science companies. Alexandria Seed Capital Platform drives the growth of seed- and early-stage companies in New York City and across the country. |
| • | In February 2018, Joel S. Marcus, Executive Chairman and Founder, was appointed to the Navy SEAL Foundation board of directors. |
| • | In February 2018, Menlo Gateway in our Greater Stanford submarket was awarded “Development of the Year” by NAIOP San Francisco at its “Best of the Bay” awards event. |
| • | In March 2018, we announced elevations of key executive officers, effective in April 2018. |
Subsequent events
| • | During April 2018, we sold 782,967 shares of common stock under our at-the-market common stock offering program (“ATM program”) for $122.20 per share and received net proceeds of $94.2 million. |
| • | In April 2018, our real estate joint venture at Menlo Gateway in our Greater Stanford submarket closed a secured construction loan with commitments available for borrowing of $157.3 million, for the development of Phase II of the project. The loan matures on May 1, 2035, and bears interest at a fixed rate of 4.53%. |
| |
| Sustainability | |
| March 31, 2018 | |
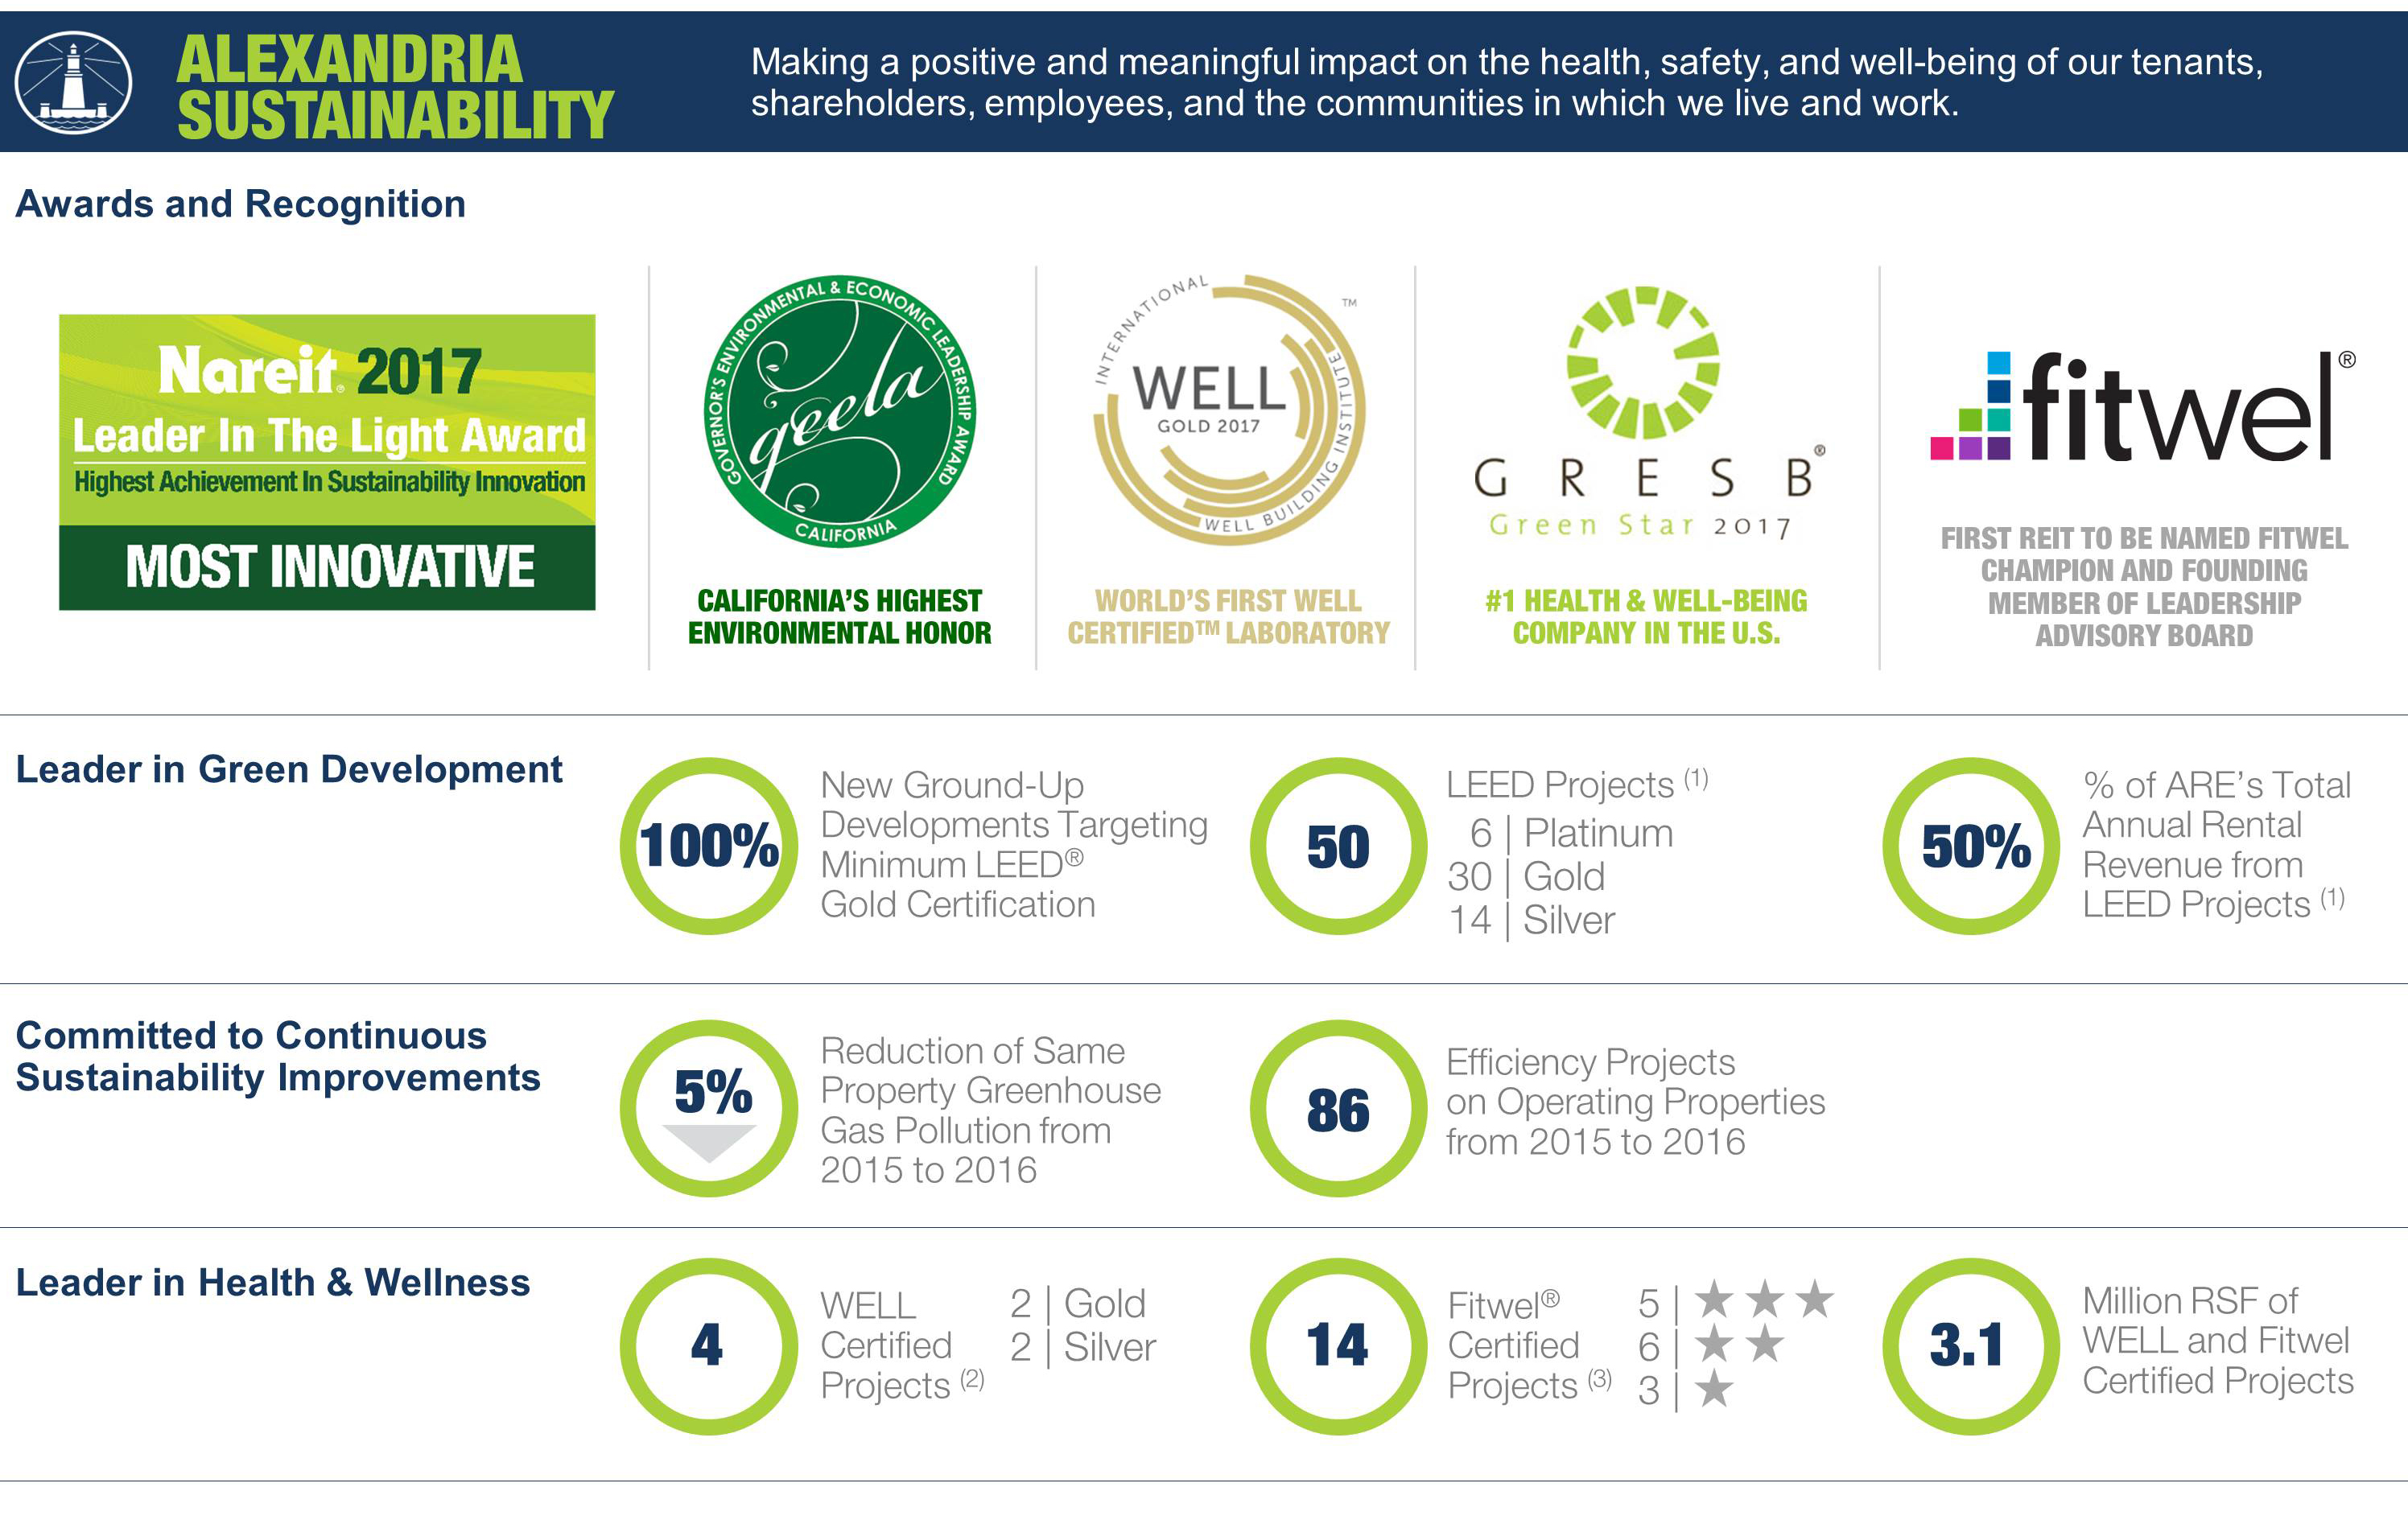
| (1) | Upon completion of nine LEED certification projects in process. |
| (2) | Upon completion of three WELL certification projects in process. |
| (3) | Upon completion of eight Fitwel certification projects in process. |
| Acquisitions | |
| March 31, 2018 | |
| (Dollars in thousands) | |
| Property | Submarket/Market | Date of Purchase | Number of Properties | Anticipated Use | Operating Occupancy | Square Footage | Unlevered Yields | Purchase Price | |||||||||||||||||||||
| Operating | Development/Redevelopment | Future Development | Initial Stabilized | Initial Stabilized (Cash) | |||||||||||||||||||||||||
| 1Q18 Acquisitions | |||||||||||||||||||||||||||||
1655 and 1725 Third Street (10% interest in unconsolidated JV) | Mission Bay/SoMa/ San Francisco | 3/2/18 | 2 | Office | N/A | — | 593,765 | — | 7.8% | 6.0% | $ | 31,950 | |||||||||||||||||
| Alexandria PARC | Greater Stanford/San Francisco | 1/25/18 | 4 | Office/lab | 100% | 152,383 | 45,115 | — | TBD | 136,000 | |||||||||||||||||||
| Summers Ridge Science Park | Sorrento Mesa/ San Diego | 1/5/18 | 4 | Office/lab | 100% | 316,531 | — | 50,000 | 8.2% | 6.3% | 148,650 | ||||||||||||||||||
704 Quince Orchard Road (56.8% interest in unconsolidated JV) | Gaithersburg/Maryland | 3/16/18 | 1 | Office/lab | 100% | 21,745 | 58,186 | — | TBD | 3,900 | |||||||||||||||||||
| 11 | 490,659 | 697,066 | 50,000 | 320,500 | |||||||||||||||||||||||||
1455 and 1515 Third Street (acquisition of remaining 49% interest)(1) | Mission Bay/SoMa/ San Francisco | N/A | N/A | Office | 100% | N/A | — | — | N/A | N/A | 18,900 | ||||||||||||||||||
| 339,400 | |||||||||||||||||||||||||||||
| 2Q18 Acquisitions completed or under purchase agreements/letters of intent | |||||||||||||||||||||||||||||
| 100 Tech Drive | Route 128/ Greater Boston | 4/13/18 | 1 | Office/lab | 100% | 200,431 | — | 300,000 | 8.7% | 7.3% | 87,250 | ||||||||||||||||||
1455 and 1515 Third Street (acquisition of remaining 49% interest)(1) | Mission Bay/SoMa/ San Francisco | N/A | N/A | Office | 100% | N/A | — | — | N/A | N/A | 18,900 | ||||||||||||||||||
| Pending | Various | 612,747 | — | 253,000 | TBD | 268,050 | |||||||||||||||||||||||
| 813,178 | — | 553,000 | 374,200 | ||||||||||||||||||||||||||
| Total acquisitions | $ | 713,600 | |||||||||||||||||||||||||||
| 2018 Guidance range | $670,000 – $770,000 | ||||||||||||||||||||||||||||
We expect to provide total estimated costs at completion and related yields of development and redevelopment projects in the future.
| (1) | The first installment of $18.9 million related to our November 2016 acquisition of 1455 and 1515 Third Street was paid in 2Q17, and the second installment of $18.9 million was paid in January 2018. We expect to pay the third and final installment during 2Q18. |
| Guidance | | |
| March 31, 2018 | ||
| (Dollars in millions, except per share amounts) | ||
The following updated guidance is based on our current view of existing market conditions and assumptions for the year ending December 31, 2018. Updates to guidance include: a) two cent increases to the midpoints, and reduction of the ranges from 20 cents to 10 cents for EPS - diluted, FFO per share - diluted, and FFO per share - diluted, as adjusted, and b) updating the EPS and FFO per share - diluted guidance ranges to include an investment gain of $8.3 million related to one non-real estate investment in a life science entity and unrealized gains of $72.2 million related to non-real estate investments in 1Q18. There can be no assurance that actual amounts will be materially higher or lower than these expectations. See our discussion of “forward-looking statements” on page 6 of this Earnings Press Release.
Earnings per Share and Funds From Operations per Share Attributable to Alexandria’s Common Stockholders – Diluted | |||||
| Earnings per share | $2.88 to $2.98 | ||||
| Depreciation and amortization | 4.45 | ||||
| Allocation to unvested restricted stock awards | (0.05) | ||||
| Funds from operations per share | $7.28 to $7.38 | ||||
| Realized gain on non-real estate investment in 1Q18 | (0.08) | (1) | |||
| Unrealized gains on non-real estate investments in 1Q18 | (0.70) | (2) | |||
| Allocation to unvested restricted stock awards | 0.02 | ||||
| Funds from operations per share, as adjusted | $6.52 to $6.62 | ||||
| Key Assumptions | Low | High | |||||||
| Occupancy percentage in North America as of December 31, 2018 | 96.9% | 97.5% | |||||||
| Lease renewals and re-leasing of space: | |||||||||
| Rental rate increases | 13.0% | 16.0% | |||||||
| Rental rate increases (cash basis) | 7.5% | 10.5% | |||||||
| Same property performance: | |||||||||
| Net operating income increase | 2.5% | 4.5% | |||||||
| Net operating income increase (cash basis) | 9.0% | 11.0% | |||||||
| Straight-line rent revenue | $ | 92 | $ | 102 | (4) | ||||
| General and administrative expenses | $ | 85 | $ | 90 | |||||
| Capitalization of interest | $ | 55 | $ | 65 | |||||
| Interest expense | $ | 155 | $ | 165 | |||||
| Key Credit Metrics | 2018 Guidance | ||
| Net debt to Adjusted EBITDA – 4Q18 annualized | Less than 5.5x | ||
| Net debt and preferred stock to Adjusted EBITDA – 4Q18 annualized | Less than 5.5x | ||
| Fixed-charge coverage ratio – 4Q18 annualized | Greater than 4.0x | ||
| Unhedged variable-rate debt as a percentage of total debt | 5% | ||
Value-creation pipeline as a percentage of gross real estate as of December 31, 2018 | 8% to 12% | ||
| Key Sources and Uses of Capital | Range | Midpoint | Certain Completed Items | |||||||||||||||
| Sources of capital: | ||||||||||||||||||
| Net cash provided by operating activities after dividends | $ | 140 | $ | 180 | $ | 160 | ||||||||||||
| Incremental debt | 470 | 430 | 450 | |||||||||||||||
| Real estate dispositions, partial interest sales, and common equity | 1,110 | 1,310 | 1,210 | $ | 908 | (3) | ||||||||||||
| Total sources of capital | $ | 1,720 | $ | 1,920 | $ | 1,820 | ||||||||||||
| Uses of capital: | ||||||||||||||||||
| Construction | $ | 1,050 | $ | 1,150 | $ | 1,100 | ||||||||||||
| Acquisitions | 670 | 770 | 720 | (5) | ||||||||||||||
| Total uses of capital | $ | 1,720 | $ | 1,920 | $ | 1,820 | ||||||||||||
| Incremental debt (included above): | ||||||||||||||||||
| Issuance of unsecured senior notes payable | $ | 550 | $ | 650 | $ | 600 | ||||||||||||
| Repayments of secured notes payable | (10 | ) | (15 | ) | (13 | ) | ||||||||||||
| Repayment of unsecured senior bank term loan | (200 | ) | (200 | ) | (200 | ) | ||||||||||||
| $1.65 billion unsecured senior line of credit/other | 130 | (5 | ) | 63 | ||||||||||||||
| Incremental debt | $ | 470 | $ | 430 | $ | 450 | ||||||||||||
| (1) | Represents an investment gain of $8.3 million related to one non-real estate investment in a life science entity recognized in 1Q18. |
| (2) | Per share amounts of unrealized gains on non-real estate investments in 1Q18 may be different for the full year ended December 31, 2018, depending on the weighted-average shares outstanding for the year ended December 31, 2018. Excludes future changes in fair value for equity investments pursuant to a new accounting standard effective January 1, 2018. See page 43 of our Supplemental Information for additional information. |
| (3) | We have completed transactions aggregating $908 million through April 2018. This includes completed and projected settlement of our forward equity sales agreements and completed sales under our ATM program, including 6.9 million shares of our common stock subject to forward equity sales agreements executed in January 2018. Additionally, in March 2018, we settled 843,600 shares from the forward equity sales agreements and received proceeds of $100.2 million, net of underwriting discounts and adjustments provided in the forward equity sales agreements. We expect to receive proceeds of $713.7 million upon settlement of the remaining outstanding forward equity sales agreements, to be further adjusted as provided in the sales agreements, in 2018. Also, includes 782,967 shares of common stock sold in April 2018 under our ATM program at $122.20 per share, with net proceeds of $94.2 million. |
| (4) | Approximately 50% of straight-line rent revenue represents initial free rent on recently delivered and expected 2018 deliveries of new Class A properties from our development and redevelopment pipeline. |
| (5) | See “Acquisitions” on page 4 of this Earnings Press Release. |
| |
| Earnings Call Information and About the Company | |
| March 31, 2018 | |
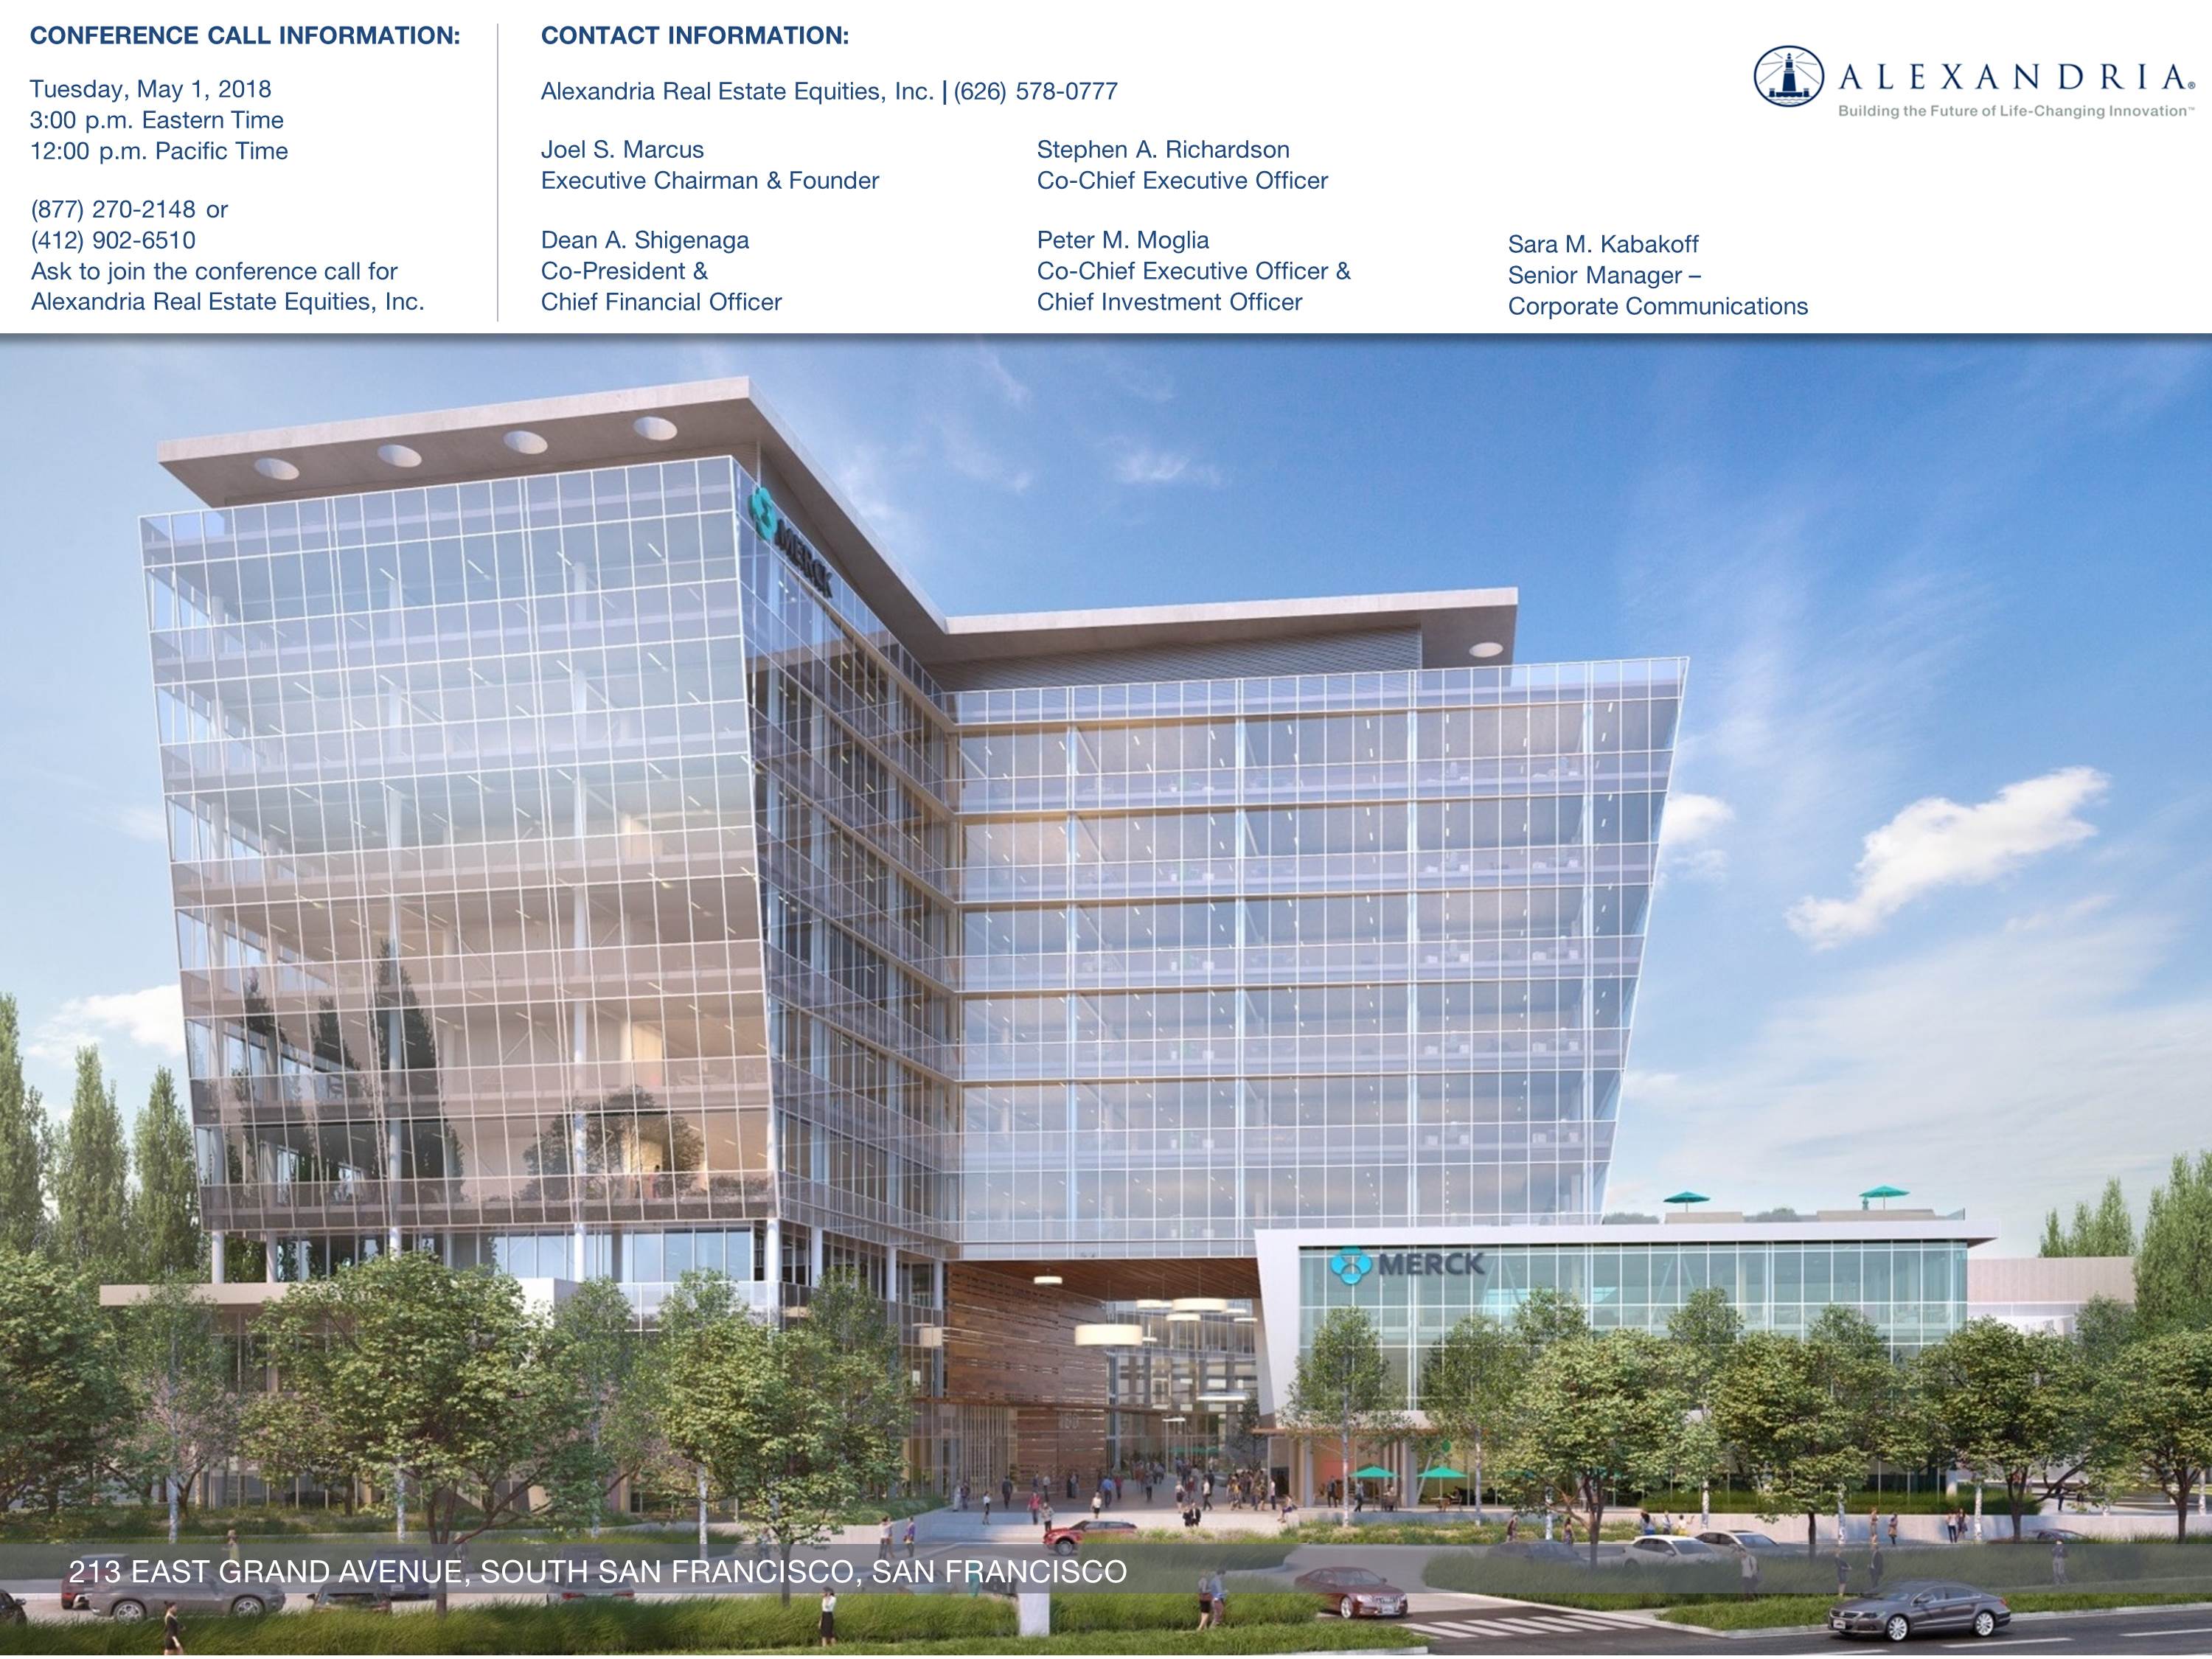
We will host a conference call on Tuesday, May 1, 2018, at 3:00 p.m. Eastern Time (“ET”)/noon Pacific Time (“PT”), which is open to the general public to discuss our financial and operating results for the first quarter ended March 31, 2018. To participate in this conference call, dial (877) 270-2148 or (412) 902-6510 shortly before 3:00 p.m. ET/noon PT and ask the operator to join the Alexandria Real Estate Equities, Inc. call. The audio webcast can be accessed at www.are.com in the “For Investors” section. A replay of the call will be available for a limited time from 5:00 p.m. ET/2:00 p.m. PT on Tuesday, May 1, 2018. The replay number is (877) 344-7529 or (412) 317-0088, and the confirmation code is 10117375.
Additionally, a copy of this Earnings Press Release and Supplemental Information for the first quarter ended March 31, 2018, is available in the “For Investors” section of our website at www.are.com or by following this link: http://www.are.com/fs/2018q1.pdf.
For any questions, please contact Joel S. Marcus, executive chairman and founder; Stephen A. Richardson, co-chief executive officer; Peter M. Moglia, co-chief executive officer and chief investment officer; Dean A. Shigenaga, co-president and chief financial officer; or Sara M. Kabakoff, senior manager – corporate communications, at (626) 578-0777.
About the Company
Alexandria Real Estate Equities, Inc. (NYSE:ARE), an S&P 500® company, is an urban office real estate investment trust (“REIT”) uniquely focused on collaborative life science and technology campuses in AAA innovation cluster locations, with a total market capitalization of $17.9 billion and an asset base in North America of 30.2 million SF as of March 31, 2018. The asset base in North America includes 20.8 million RSF of operating properties and 3.5 million RSF of development and redevelopment of new Class A properties currently undergoing construction and pre-construction activities with target delivery dates ranging from 2018 through 2020. Additionally, the asset base in North America includes 5.9 million SF of intermediate-term and future development projects, including 3.6 million SF of intermediate-term development projects. Founded in 1994, Alexandria pioneered this niche and has since established a significant market presence in key locations, including Greater Boston, San Francisco, New York City, San Diego, Seattle, Maryland, and Research Triangle Park. Alexandria has a longstanding and proven track record of developing Class A properties clustered in urban life science and technology campuses that provide its innovative tenants with highly dynamic and collaborative environments that enhance their ability to successfully recruit and retain world-class talent and inspire productivity, efficiency, creativity, and success. Alexandria also provides strategic capital to transformative life science and technology companies through its venture capital arm. We believe our unique business model and diligent underwriting ensure a high-quality and diverse tenant base that results in higher occupancy levels, longer lease terms, higher rental income, higher returns, and greater long-term asset value. For additional information on Alexandria, please visit www.are.com.
***********
This document includes “forward-looking statements” within the meaning of Section 27A of the Securities Act of 1933, as amended, and Section 21E of the Securities Exchange Act of 1934, as amended. Such forward-looking statements include, without limitation, statements regarding our 2018 earnings per share attributable to Alexandria’s common stockholders – diluted, 2018 funds from operations per share attributable to Alexandria’s common stockholders – diluted, net operating income, and our projected sources and uses of capital. You can identify the forward-looking statements by their use of forward-looking words, such as “forecast,” “guidance,” “projects,” “estimates,” “anticipates,” “believes,” “expects,” “intends,” “may,” “plans,” “seeks,” “should,” or “will,” or the negative of those words or similar words. These forward-looking statements are based on our current expectations, beliefs, projections, future plans and strategies, anticipated events or trends, and similar expressions concerning matters that are not historical facts, as well as a number of assumptions concerning future events. There can be no assurance that actual results will not be materially higher or lower than these expectations. These statements are subject to risks, uncertainties, assumptions, and other important factors that could cause actual results to differ materially from the results discussed in the forward-looking statements. Factors that might cause such a difference include, without limitation, our failure to obtain capital (debt, construction financing, and/or equity) or refinance debt maturities, increased interest rates and operating costs, adverse economic or real estate developments in our markets, our failure to successfully place into service and lease any properties undergoing development or redevelopment and our existing space held for future development or redevelopment (including new properties acquired for that purpose), our failure to successfully operate or lease acquired properties, decreased rental rates, increased vacancy rates or failure to renew or replace expiring leases, defaults on or non-renewal of leases by tenants, adverse general and local economic conditions, an unfavorable capital market environment, decreased leasing activity or lease renewals, and other risks and uncertainties detailed in our filings with the Securities and Exchange Commission (“SEC”). Accordingly, you are cautioned not to place undue reliance on such forward-looking statements. All forward-looking statements are made as of the date of this Earnings Press Release, and unless otherwise stated, we assume no obligation to update this information and expressly disclaim any obligation to update or revise any forward-looking statements, whether as a result of new information, future events, or otherwise. For more discussion relating to risks and uncertainties that could cause actual results to differ materially from those anticipated in our forward-looking statements, and risks to our business in general, please refer to our SEC filings, including our most recent annual report on Form 10-K and any subsequent quarterly reports on Form 10-Q.
| Consolidated Statements of Income | |
| March 31, 2018 | |
| (In thousands, except per share amounts) | |
| Three Months Ended | ||||||||||||||||||||
| 3/31/18 | 12/31/17 | 9/30/17 | 6/30/17 | 3/31/17 | ||||||||||||||||
| Revenues: | ||||||||||||||||||||
| Rental | $ | 244,485 | $ | 228,025 | $ | 216,021 | $ | 211,942 | $ | 207,193 | ||||||||||
| Tenant recoveries | 73,170 | 70,270 | 67,058 | 60,470 | 61,346 | |||||||||||||||
| Other income | 2,484 | 496 | 2,291 | 647 | 2,338 | |||||||||||||||
| Total revenues | 320,139 | 298,791 | 285,370 | 273,059 | 270,877 | |||||||||||||||
| Expenses: | ||||||||||||||||||||
| Rental operations | 91,771 | 88,073 | 83,469 | 76,980 | 77,087 | |||||||||||||||
| General and administrative | 22,421 | 18,910 | 17,636 | 19,234 | 19,229 | |||||||||||||||
| Interest | 36,915 | 36,082 | 31,031 | 31,748 | 29,784 | |||||||||||||||
| Depreciation and amortization | 114,219 | 107,714 | 107,788 | 104,098 | 97,183 | |||||||||||||||
| Impairment of real estate | — | — | — | 203 | — | |||||||||||||||
| Loss on early extinguishment of debt | — | 2,781 | — | — | 670 | |||||||||||||||
| Total expenses | 265,326 | 253,560 | 239,924 | 232,263 | 223,953 | |||||||||||||||
| Equity in earnings of unconsolidated real estate joint ventures | 1,144 | 376 | 14,100 | 589 | 361 | |||||||||||||||
| Investment income | 85,561 | (1) | — | — | — | — | ||||||||||||||
| Gain on sales of real estate – rental properties | — | — | — | — | 270 | |||||||||||||||
| Gain on sales of real estate – land parcels | — | — | — | 111 | — | |||||||||||||||
| Net income | 141,518 | 45,607 | 59,546 | 41,496 | 47,555 | |||||||||||||||
| Net income attributable to noncontrolling interests | (5,888 | ) | (6,219 | ) | (5,773 | ) | (7,275 | ) | (5,844 | ) | ||||||||||
| Net income attributable to Alexandria Real Estate Equities, Inc.’s stockholders | 135,630 | 39,388 | 53,773 | 34,221 | 41,711 | |||||||||||||||
| Dividends on preferred stock | (1,302 | ) | (1,302 | ) | (1,302 | ) | (1,278 | ) | (3,784 | ) | ||||||||||
| Preferred stock redemption charge | — | — | — | — | (11,279 | ) | ||||||||||||||
| Net income attributable to unvested restricted stock awards | (1,941 | ) | (1,255 | ) | (1,198 | ) | (1,313 | ) | (987 | ) | ||||||||||
| Net income attributable to Alexandria Real Estate Equities, Inc.’s common stockholders | $ | 132,387 | $ | 36,831 | $ | 51,273 | $ | 31,630 | $ | 25,661 | ||||||||||
| Net income per share attributable to Alexandria Real Estate Equities, Inc.’s common stockholders: | ||||||||||||||||||||
| Basic | $ | 1.33 | $ | 0.39 | $ | 0.55 | $ | 0.35 | $ | 0.29 | ||||||||||
| Diluted | $ | 1.32 | $ | 0.38 | $ | 0.55 | $ | 0.35 | $ | 0.29 | ||||||||||
| Weighted-average shares of common stock outstanding: | ||||||||||||||||||||
| Basic | 99,855 | 95,138 | 92,598 | 90,215 | 88,147 | |||||||||||||||
| Diluted | 100,125 | 95,914 | 93,296 | 90,745 | 88,200 | |||||||||||||||
| Dividends declared per share of common stock | $ | 0.90 | $ | 0.90 | $ | 0.86 | $ | 0.86 | $ | 0.83 | ||||||||||
| (1) | See “Investments” on page 43 of our Supplemental Information for additional information. |
| Consolidated Balance Sheets | |
| March 31, 2018 | |
| (In thousands) | |
| 3/31/18 | 12/31/17 | 9/30/17 | 6/30/17 | 3/31/17 | ||||||||||||||||
| Assets | ||||||||||||||||||||
| Investments in real estate | $ | 10,671,227 | $ | 10,298,019 | $ | 10,046,521 | $ | 9,819,413 | $ | 9,470,667 | ||||||||||
| Investments in unconsolidated real estate joint ventures | 169,865 | 110,618 | 33,692 | 58,083 | 50,457 | |||||||||||||||
| Cash and cash equivalents | 221,645 | 254,381 | 118,562 | 124,877 | 151,209 | |||||||||||||||
| Restricted cash | 37,337 | 22,805 | 27,713 | 20,002 | 18,320 | |||||||||||||||
| Tenant receivables | 11,258 | 10,262 | 9,899 | 8,393 | 9,979 | |||||||||||||||
| Deferred rent | 467,112 | 434,731 | 402,353 | 383,062 | 364,348 | |||||||||||||||
| Deferred leasing costs | 226,803 | 221,430 | 208,265 | 201,908 | 202,613 | |||||||||||||||
| Investments | 724,310 | (1) | 523,254 | 485,262 | 424,920 | 394,471 | ||||||||||||||
| Other assets | 291,639 | 228,453 | 213,056 | 205,009 | 206,562 | |||||||||||||||
| Total assets | $ | 12,821,196 | $ | 12,103,953 | $ | 11,545,323 | $ | 11,245,667 | $ | 10,868,626 | ||||||||||
| Liabilities, Noncontrolling Interests, and Equity | ||||||||||||||||||||
| Secured notes payable | $ | 775,689 | $ | 771,061 | $ | 1,153,890 | $ | 1,127,348 | $ | 1,083,758 | ||||||||||
| Unsecured senior notes payable | 3,396,912 | 3,395,804 | 2,801,290 | 2,800,398 | 2,799,508 | |||||||||||||||
| Unsecured senior line of credit | 490,000 | 50,000 | 314,000 | 300,000 | — | |||||||||||||||
| Unsecured senior bank term loans | 548,197 | 547,942 | 547,860 | 547,639 | 547,420 | |||||||||||||||
| Accounts payable, accrued expenses, and tenant security deposits | 783,986 | 763,832 | 740,070 | 734,189 | 782,637 | |||||||||||||||
| Dividends payable | 93,065 | 92,145 | 83,402 | 81,602 | 78,976 | |||||||||||||||
| Preferred stock redemption liability | — | — | — | — | 130,000 | |||||||||||||||
| Total liabilities | 6,087,849 | 5,620,784 | 5,640,512 | 5,591,176 | 5,422,299 | |||||||||||||||
| Commitments and contingencies | ||||||||||||||||||||
| Redeemable noncontrolling interests | 10,212 | 11,509 | 11,418 | 11,410 | 11,320 | |||||||||||||||
| Alexandria Real Estate Equities, Inc.’s stockholders’ equity: | ||||||||||||||||||||
| 7.00% Series D cumulative convertible preferred stock | 74,386 | 74,386 | 74,386 | 74,386 | 74,386 | |||||||||||||||
| Common stock | 1,007 | 998 | 943 | 921 | 899 | |||||||||||||||
| Additional paid-in capital | 6,117,976 | (1) | 5,824,258 | 5,287,777 | 5,059,180 | 4,855,686 | ||||||||||||||
| Accumulated other comprehensive income | 1,228 | 50,024 | 43,864 | 22,677 | 21,460 | |||||||||||||||
| Alexandria Real Estate Equities, Inc.’s stockholders’ equity | 6,194,597 | 5,949,666 | 5,406,970 | 5,157,164 | 4,952,431 | |||||||||||||||
| Noncontrolling interests | 528,538 | 521,994 | 486,423 | 485,917 | 482,576 | |||||||||||||||
| Total equity | 6,723,135 | 6,471,660 | 5,893,393 | 5,643,081 | 5,435,007 | |||||||||||||||
| Total liabilities, noncontrolling interests, and equity | $ | 12,821,196 | $ | 12,103,953 | $ | 11,545,323 | $ | 11,245,667 | $ | 10,868,626 | ||||||||||
| (1) | Includes unrealized gains aggregating $213.1 million. See “Investments” on page 43 of our Supplemental Information for additional information. |
| Funds From Operations and Funds From Operations per Share | |
| March 31, 2018 | |
| (In thousands) | |
The following table presents a reconciliation of net income attributable to Alexandria’s common stockholders, the most directly comparable financial measure presented in accordance with generally accepted accounting principles (“GAAP”), including our share of amounts from consolidated and unconsolidated real estate joint ventures, to funds from operations attributable to Alexandria’s common stockholders – diluted, and funds from operations attributable to Alexandria’s common stockholders – diluted, as adjusted, for the periods below:
| Three Months Ended | ||||||||||||||||||||
| 3/31/18 | 12/31/17 | 9/30/17 | 6/30/17 | 3/31/17 | ||||||||||||||||
| Net income attributable to Alexandria’s common stockholders | $ | 132,387 | $ | 36,831 | $ | 51,273 | $ | 31,630 | $ | 25,661 | ||||||||||
| Depreciation and amortization | 114,219 | 107,714 | 107,788 | 104,098 | 97,183 | |||||||||||||||
| Noncontrolling share of depreciation and amortization from consolidated real estate JVs | (3,867 | ) | (3,777 | ) | (3,608 | ) | (3,735 | ) | (3,642 | ) | ||||||||||
| Our share of depreciation and amortization from unconsolidated real estate JVs | 644 | 432 | 383 | 324 | 412 | |||||||||||||||
| Gain on sales of real estate – rental properties | — | — | — | — | (270 | ) | ||||||||||||||
| Our share of gain on sales of real estate from unconsolidated real estate JVs | — | — | (14,106 | ) | — | — | ||||||||||||||
| Gain on sales of real estate – land parcels | — | — | — | (111 | ) | — | ||||||||||||||
| Impairment of real estate – rental properties | — | — | — | 203 | — | |||||||||||||||
| Allocation to unvested restricted stock awards | (1,548 | ) | (734 | ) | (957 | ) | (685 | ) | (561 | ) | ||||||||||
Add: effect of assumed conversion of 7.00% Series D cumulative convertible preferred stock(1) | 1,302 | — | — | — | — | |||||||||||||||
Funds from operations attributable to Alexandria’s common stockholders – diluted(2) | 243,137 | 140,466 | 140,773 | 131,724 | 118,783 | |||||||||||||||
Less: effect of assumed conversion of 7.00% Series D cumulative convertible preferred stock(1) | (1,302 | ) | — | — | — | — | ||||||||||||||
| Realized gain on non-real estate investment | (8,252 | ) | (3) | — | — | — | — | |||||||||||||
Unrealized gains on non-real estate investments(4) | (72,229 | ) | — | — | — | — | ||||||||||||||
| Impairment of land parcels and non-real estate investments | — | 3,805 | — | 4,491 | — | |||||||||||||||
| Loss on early extinguishment of debt | — | 2,781 | — | — | 670 | |||||||||||||||
| Preferred stock redemption charge | — | — | — | — | 11,279 | |||||||||||||||
| Allocation to unvested restricted stock awards | 1,125 | (94 | ) | — | (58 | ) | (150 | ) | ||||||||||||
| Funds from operations attributable to Alexandria’s common stockholders – diluted, as adjusted | $ | 162,479 | $ | 146,958 | $ | 140,773 | $ | 136,157 | $ | 130,582 | ||||||||||
| (1) | See definition for “Weighted-Average Shares of Common Stock Outstanding – Diluted” on page 54 of our Supplemental Information for additional information. |
| (2) | Calculated in accordance with standards established by the Advisory Board of Governors of the National Association of Real Estate Investment Trusts (the “Nareit Board of Governors”) in its April 2002 White Paper and related implementation guidance. |
| (3) | Relates to one publicly traded non-real estate investment in a life science entity. Excluding this gain, our realized non-real estate investment gains were $5.1 million for 1Q18. |
| (4) | See “Investments” on page 43 of our Supplemental Information for additional information. |
| Funds From Operations and Funds From Operations per Share (continued) | |
| March 31, 2018 | |
| (In thousands, except per share amounts) | |
The following table presents a reconciliation of net income per share attributable to Alexandria’s common stockholders, the most directly comparable financial measure presented in accordance with GAAP, including our share of amounts from consolidated and unconsolidated real estate joint ventures, to funds from operations per share attributable to Alexandria’s common stockholders – diluted, and funds from operations per share attributable to Alexandria’s common stockholders – diluted, as adjusted, for the periods below. Amounts allocable to unvested restricted stock awards are not material and are not presented separately within the per share table below. Per share amounts may not add due to rounding.
| Three Months Ended | ||||||||||||||||||||
| 3/31/18 | 12/31/17 | 9/30/17 | 6/30/17 | 3/31/17 | ||||||||||||||||
| Net income per share attributable to Alexandria’s common stockholders | $ | 1.32 | $ | 0.38 | $ | 0.55 | $ | 0.35 | $ | 0.29 | ||||||||||
Depreciation and amortization | 1.08 | 1.08 | 1.11 | 1.10 | 1.06 | |||||||||||||||
| Our share of gain on sales of real estate from unconsolidated real estate JVs | — | — | (0.15 | ) | — | — | ||||||||||||||
Add: effect of assumed conversion of 7.00% Series D cumulative convertible preferred stock(1) | 0.01 | — | — | — | — | |||||||||||||||
Funds from operations per share attributable to Alexandria’s common stockholders – diluted(2) | 2.41 | 1.46 | 1.51 | 1.45 | 1.35 | |||||||||||||||
Less: effect of assumed conversion of 7.00% Series D cumulative convertible preferred stock(1) | (0.01 | ) | — | — | — | — | ||||||||||||||
| Realized gain on non-real estate investment | (0.08 | ) | (3) | — | — | — | — | |||||||||||||
Unrealized gains on non-real estate investments(4) | (0.70 | ) | — | — | — | — | ||||||||||||||
| Impairment of land parcels and non-real estate investments | — | 0.04 | — | 0.05 | — | |||||||||||||||
| Loss on early extinguishment of debt | — | 0.03 | — | — | 0.01 | |||||||||||||||
| Preferred stock redemption charge | — | — | — | — | 0.12 | |||||||||||||||
| Funds from operations per share attributable to Alexandria’s common stockholders – diluted, as adjusted | $ | 1.62 | $ | 1.53 | $ | 1.51 | $ | 1.50 | $ | 1.48 | ||||||||||
Weighted-average shares of common stock outstanding(1) for calculations of: | ||||||||||||||||||||
| Earnings per share – diluted and funds from operations, as adjusted – diluted, per share | 100,125 | 95,914 | 93,296 | 90,745 | 88,200 | |||||||||||||||
| Funds from operations – diluted, per share | 100,866 | 95,914 | 93,296 | 90,745 | 88,200 | |||||||||||||||
| (1) | See definition for “Weighted-Average Shares of Common Stock Outstanding – Diluted” on page 54 of our Supplemental Information for additional information. |
| (2) | Calculated in accordance with standards established by the Nareit Board of Governors in its April 2002 White Paper and related implementation guidance. |
| (3) | Relates to one publicly traded non-real estate investment in a life science entity. Excluding this gain, our realized non-real estate investment gains were $5.1 million for 1Q18. |
| (4) | See “Investments” on page 43 of our Supplemental Information for additional information. |
SUPPLEMENTAL
INFORMATION
| |
| Company Profile | |
| March 31, 2018 | |
Alexandria Real Estate Equities, Inc. (NYSE:ARE), an S&P 500® company, is an urban office REIT uniquely focused on collaborative life science and technology campuses in AAA innovation cluster locations, with a total market capitalization of $17.9 billion and an asset base in North America of 30.2 million SF as of March 31, 2018. The asset base in North America includes 20.8 million RSF of operating properties and 3.5 million RSF of development and redevelopment of new Class A properties currently undergoing construction and pre-construction activities with target delivery dates ranging from 2018 through 2020. Additionally, the asset base in North America includes 5.9 million SF of intermediate-term and future development projects, including 3.6 million SF of intermediate-term development projects. Founded in 1994, Alexandria pioneered this niche and has since established a significant market presence in key locations, including Greater Boston, San Francisco, New York City, San Diego, Seattle, Maryland, and Research Triangle Park. Alexandria has a longstanding and proven track record of developing Class A properties clustered in urban life science and technology campuses that provide its innovative tenants with highly dynamic and collaborative environments that enhance their ability to successfully recruit and retain world-class talent and inspire productivity, efficiency, creativity, and success. Alexandria also provides strategic capital to transformative life science and technology companies through its venture capital arm. We believe our unique business model and diligent underwriting ensure a high-quality and diverse tenant base that results in higher occupancy levels, longer lease terms, higher rental income, higher returns, and greater long-term asset value. For additional information on Alexandria, please visit www.are.com.
Tenant base
Alexandria is known for our high-quality and diverse tenant base, with 57% of our annual rental revenue generated from investment-grade or large cap tenants. The impressive quality, diversity, breadth, and depth of our significant relationships with our tenants provide Alexandria with high-quality and stable cash flows. Alexandria’s underwriting team and long-term industry relationships positively distinguish us from all other publicly traded REITs and real estate companies.
Executive and senior management team
Alexandria’s executive and senior management team has unique experience and expertise in creating highly dynamic and collaborative campuses in key urban life science and technology cluster locations that inspire innovation. From the development of high-quality, sustainable real estate, to the ongoing cultivation of collaborative environments with unique amenities and events, the Alexandria team has a first-in-class reputation of excellence in its niche. Alexandria’s highly experienced management team also includes regional market directors with leading reputations and longstanding relationships within the life science and technology communities in their respective urban innovation clusters. We believe that our expertise, experience, reputation, and key relationships in the real estate, life science, and technology industries provide Alexandria significant competitive advantages in attracting new business opportunities.
Alexandria’s executive and senior management team consists of 37 individuals, averaging 23 years of real estate experience, including 12 years with Alexandria. Our executive management team alone averages 18 years of experience with Alexandria.
| EXECUTIVE MANAGEMENT TEAM |
| Joel S. Marcus |
| Executive Chairman & Founder |
| Stephen A. Richardson |
| Co-Chief Executive Officer |
| Peter M. Moglia |
| Co-Chief Executive Officer & Chief Investment Officer |
| Dean A. Shigenaga |
| Co-President & Chief Financial Officer |
| Thomas J. Andrews |
| Co-President & Regional Market Director – Greater Boston |
| Jennifer J. Banks |
| Co-Chief Operating Officer, General Counsel & Corporate Secretary |
| Lawrence J. Diamond |
| Co-Chief Operating Officer & Regional Market Director – Maryland |
| Daniel J. Ryan |
| Executive Vice President, Regional Market Director – San Diego & Strategic Operations |
| Vincent R. Ciruzzi |
| Chief Development Officer |
| John H. Cunningham |
| Executive Vice President & Regional Market Director – New York City |
| |
| Investor Information | |
| March 31, 2018 | |
| Corporate Headquarters | New York Stock Exchange Trading Symbols | Information Requests | |||
| 385 East Colorado Boulevard, Suite 299 | Common stock: ARE | Phone: | (626) 578-0777 | ||
| Pasadena, California 91101 | 7.00% Series D preferred stock: ARE PRD | Email: | corporateinformation@are.com | ||
| Web: | www.are.com | ||||
| Equity Research Coverage |
| Alexandria is currently covered by the following research analysts. This list may be incomplete and is subject to change as firms initiate or discontinue coverage of our company. Please note that any opinions, estimates, or forecasts regarding our historical or predicted performance made by these analysts are theirs alone and do not represent opinions, estimates, or forecasts of Alexandria or its management. Alexandria does not by its reference or distribution of the information below imply its endorsement of or concurrence with any opinions, estimates, or forecasts of these analysts. Interested persons may obtain copies of analysts’ reports on their own as we do not distribute these reports. Several of these firms may, from time to time, own our stock and/or hold other long or short positions in our stock and may provide compensated services to us. |
| Bank of America Merrill Lynch | Citigroup Global Markets Inc. | J.P. Morgan Securities LLC | RBC Capital Markets | |||
| Jamie Feldman / Jeffrey Spector | Michael Bilerman / Emmanuel Korchman | Anthony Paolone / Patrice Chen | Michael Carroll / Brian Hawthorne | |||
| (646) 855-5808 / (646) 855-1363 | (212) 816-1383 / (212) 816-1382 | (212) 622-6682 / (212) 622-1893 | (440) 715-2649 / (440) 715-2653 | |||
| Barclays Capital Inc. | Evercore ISI | Mitsubishi UFJ Securities (USA), Inc. | Robert W. Baird & Co. Incorporated | |||
| Ross Smotrich / Trevor Young | Sheila McGrath / Wendy Ma | Karin Ford / Jason Twizell | David Rodgers / Richard Schiller | |||
| (212) 526-2306 / (212) 526-3098 | (212) 497-0882 / (212) 497-0870 | (212) 405-7349 / (212) 405-7160 | (216) 737-7341 / (312) 609-5485 | |||
| BTIG, LLC | Green Street Advisors, Inc. | Mizuho Securities USA Inc. | UBS Securities LLC | |||
| Tom Catherwood / James Sullivan | Jed Reagan / Daniel Ismail | Richard Anderson / Zachary Silverberg | Nick Yulico / Frank Lee | |||
| (212) 738-6140 / (212) 738-6139 | (949) 640-8780 / (949) 640-8780 | (212) 205-8445 / (212) 205-7855 | (212) 713-3402 / (415) 352-5679 | |||
| CFRA | JMP Securities – JMP Group, Inc. | |||||
| Kenneth Leon | Peter Martin / Brian Riley | |||||
| (212) 438-4638 | (415) 835-8904 / (415) 835-8908 | |||||
| Fixed Income Coverage | Rating Agencies | |||||
| J.P. Morgan Securities LLC | Wells Fargo & Company | Moody’s Investors Service | S&P Global Ratings | |||
| Mark Streeter / Jonathan Rau | Thierry Perrein / Kevin McClure | Thuy Nguyen / Reed Valutas | Fernanda Hernandez / Anita Ogbara | |||
| (212) 834-5086 / (212) 834-5237 | (704) 410-3262 / (704) 410-3252 | (212) 553-7168 / (212) 553-4169 | (212) 438-1347 / (212) 438-5077 | |||
| |
| High-Quality, Diverse, and Innovative Tenants | |
| March 31, 2018 | |
Cash Flows from High-Quality, Diverse, and Innovative Tenants
| Investment-Grade or Large Cap Tenants | Tenant Mix | |||
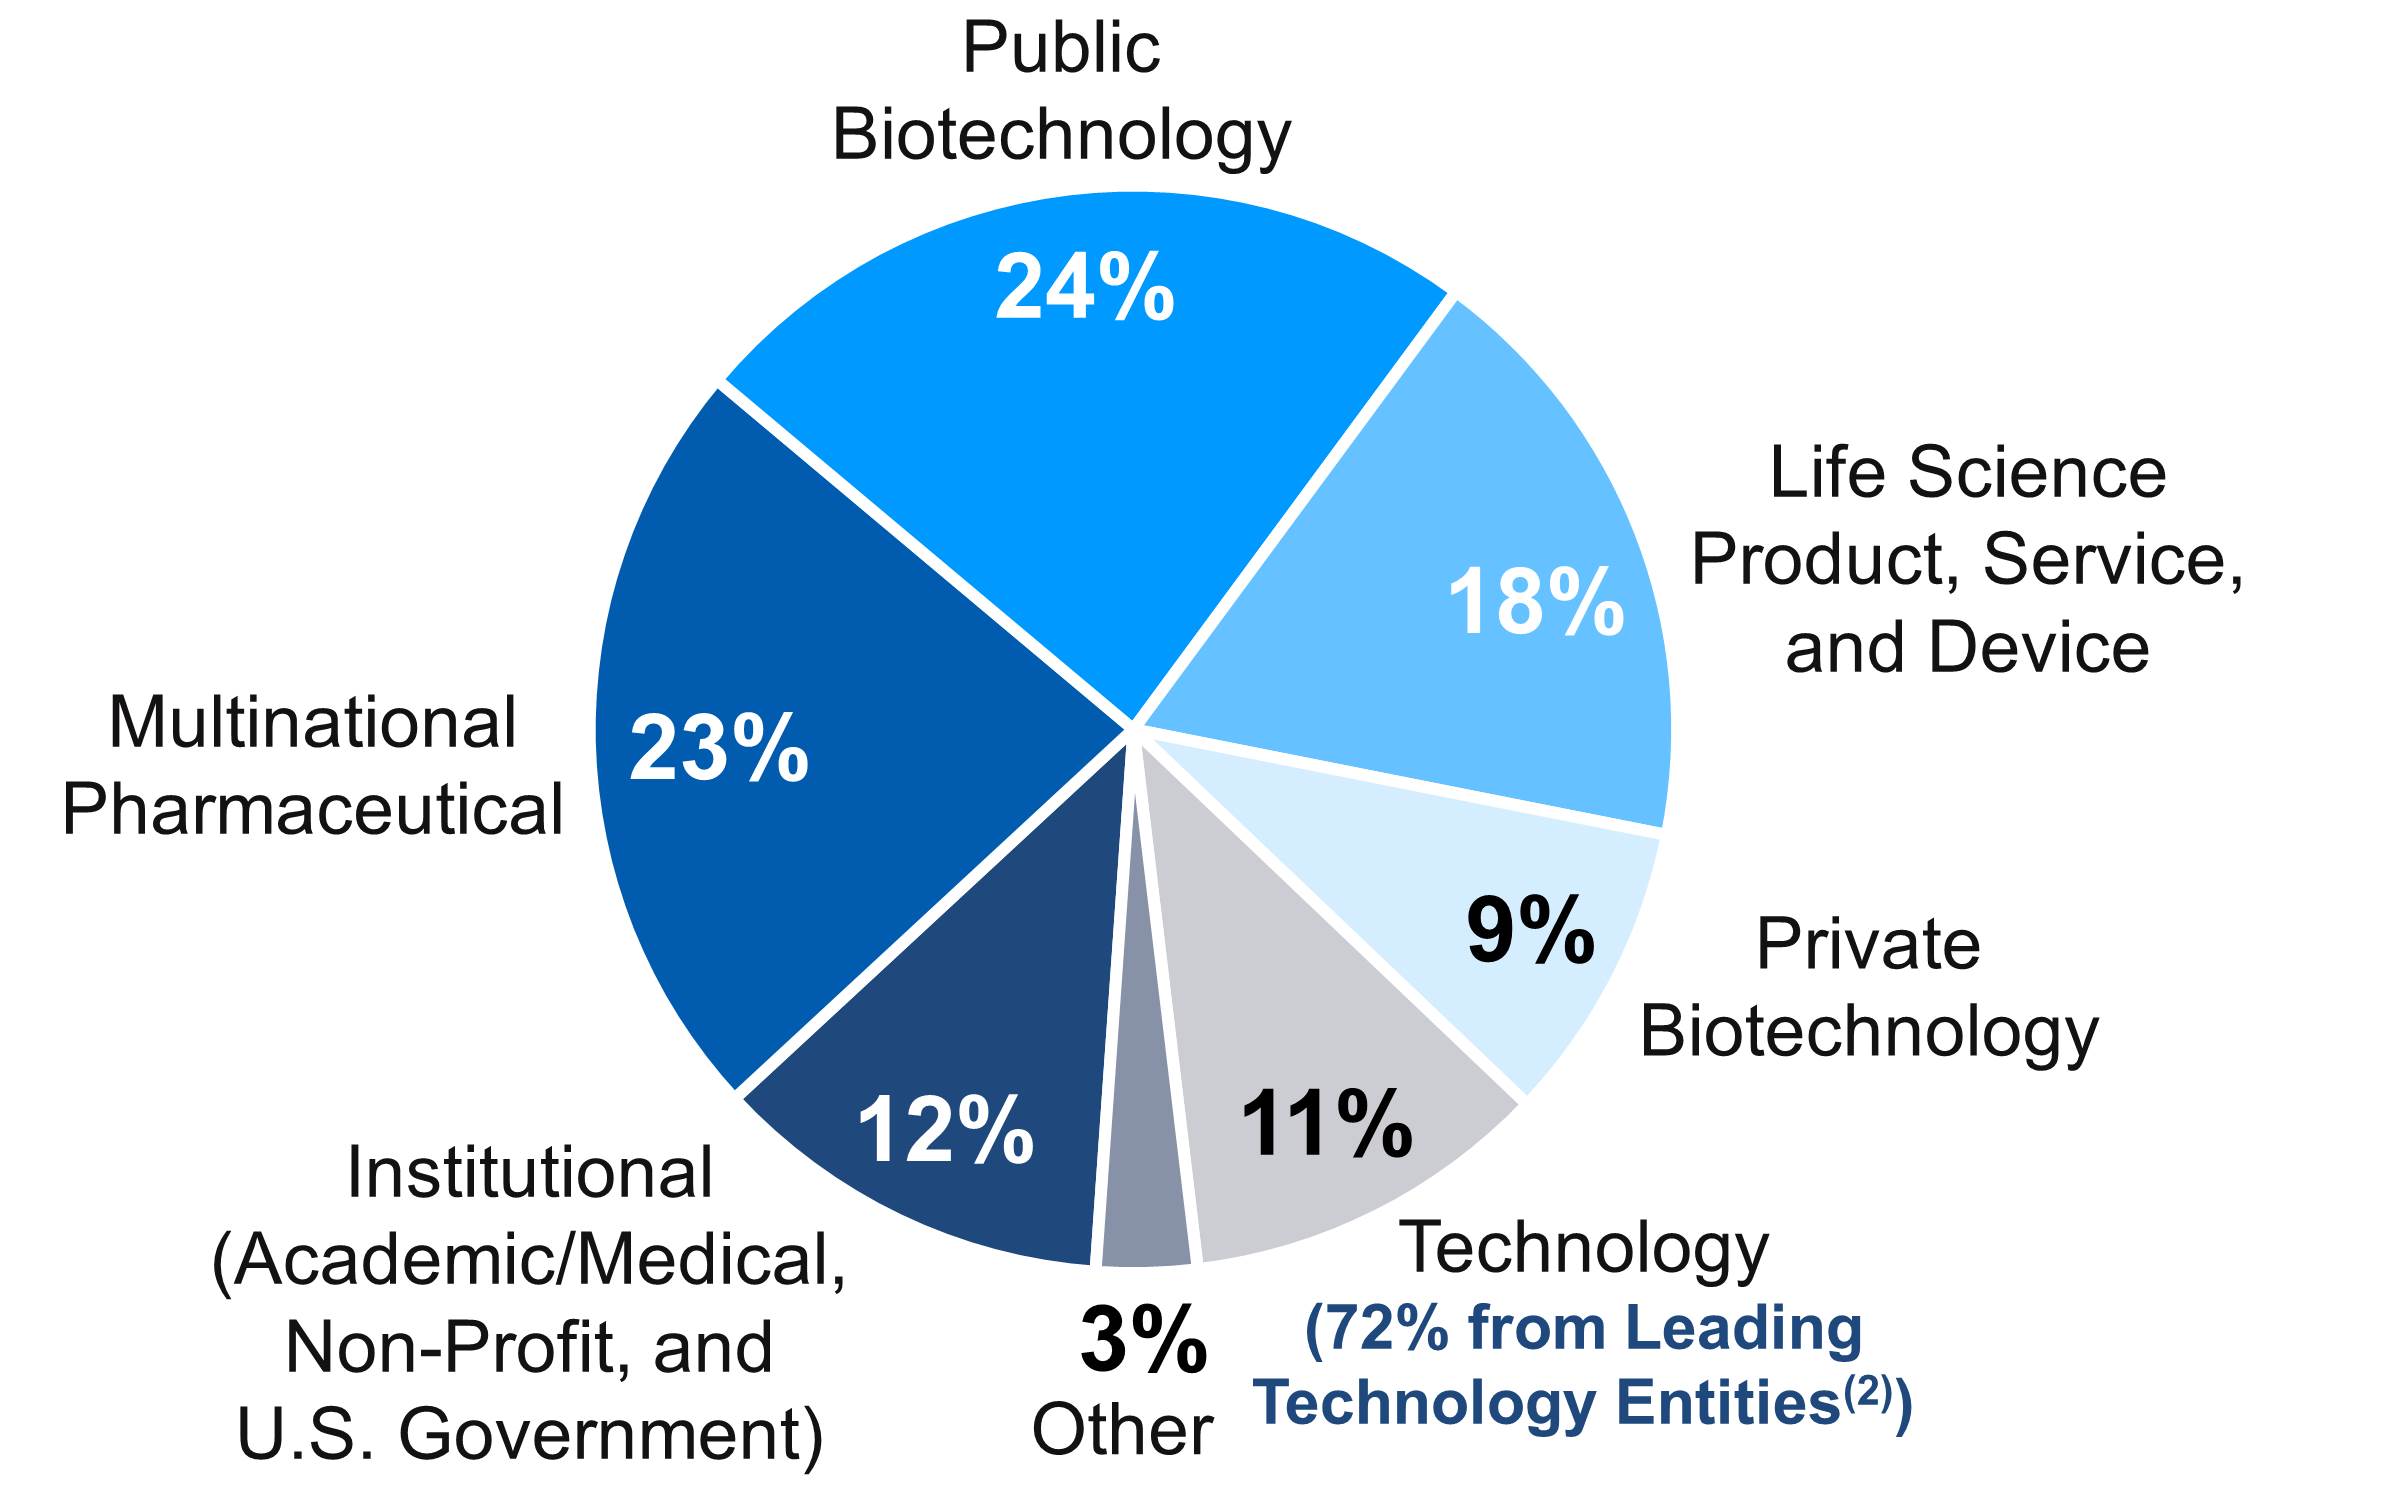 | ||||
| 57% | ||||
| of ARE’s Total | ||||
Annual Rental Revenue(1) | ||||
| A REIT Industry-Leading Tenant Roster | Percentage of ARE’s Annual Rental Revenue(1) | |||
| (1) | Represents annual rental revenue in effect as of 1Q18. |
| (2) | Leading technology entities represent investment-grade or companies with a market capitalization or private valuation greater than $10 billion as of 1Q18. |
| |
| Class A Properties in AAA Locations | |
| March 31, 2018 | |
High-Quality Cash Flows from Class A Properties in AAA Locations
Class A Properties in AAA Locations | AAA Locations | |||
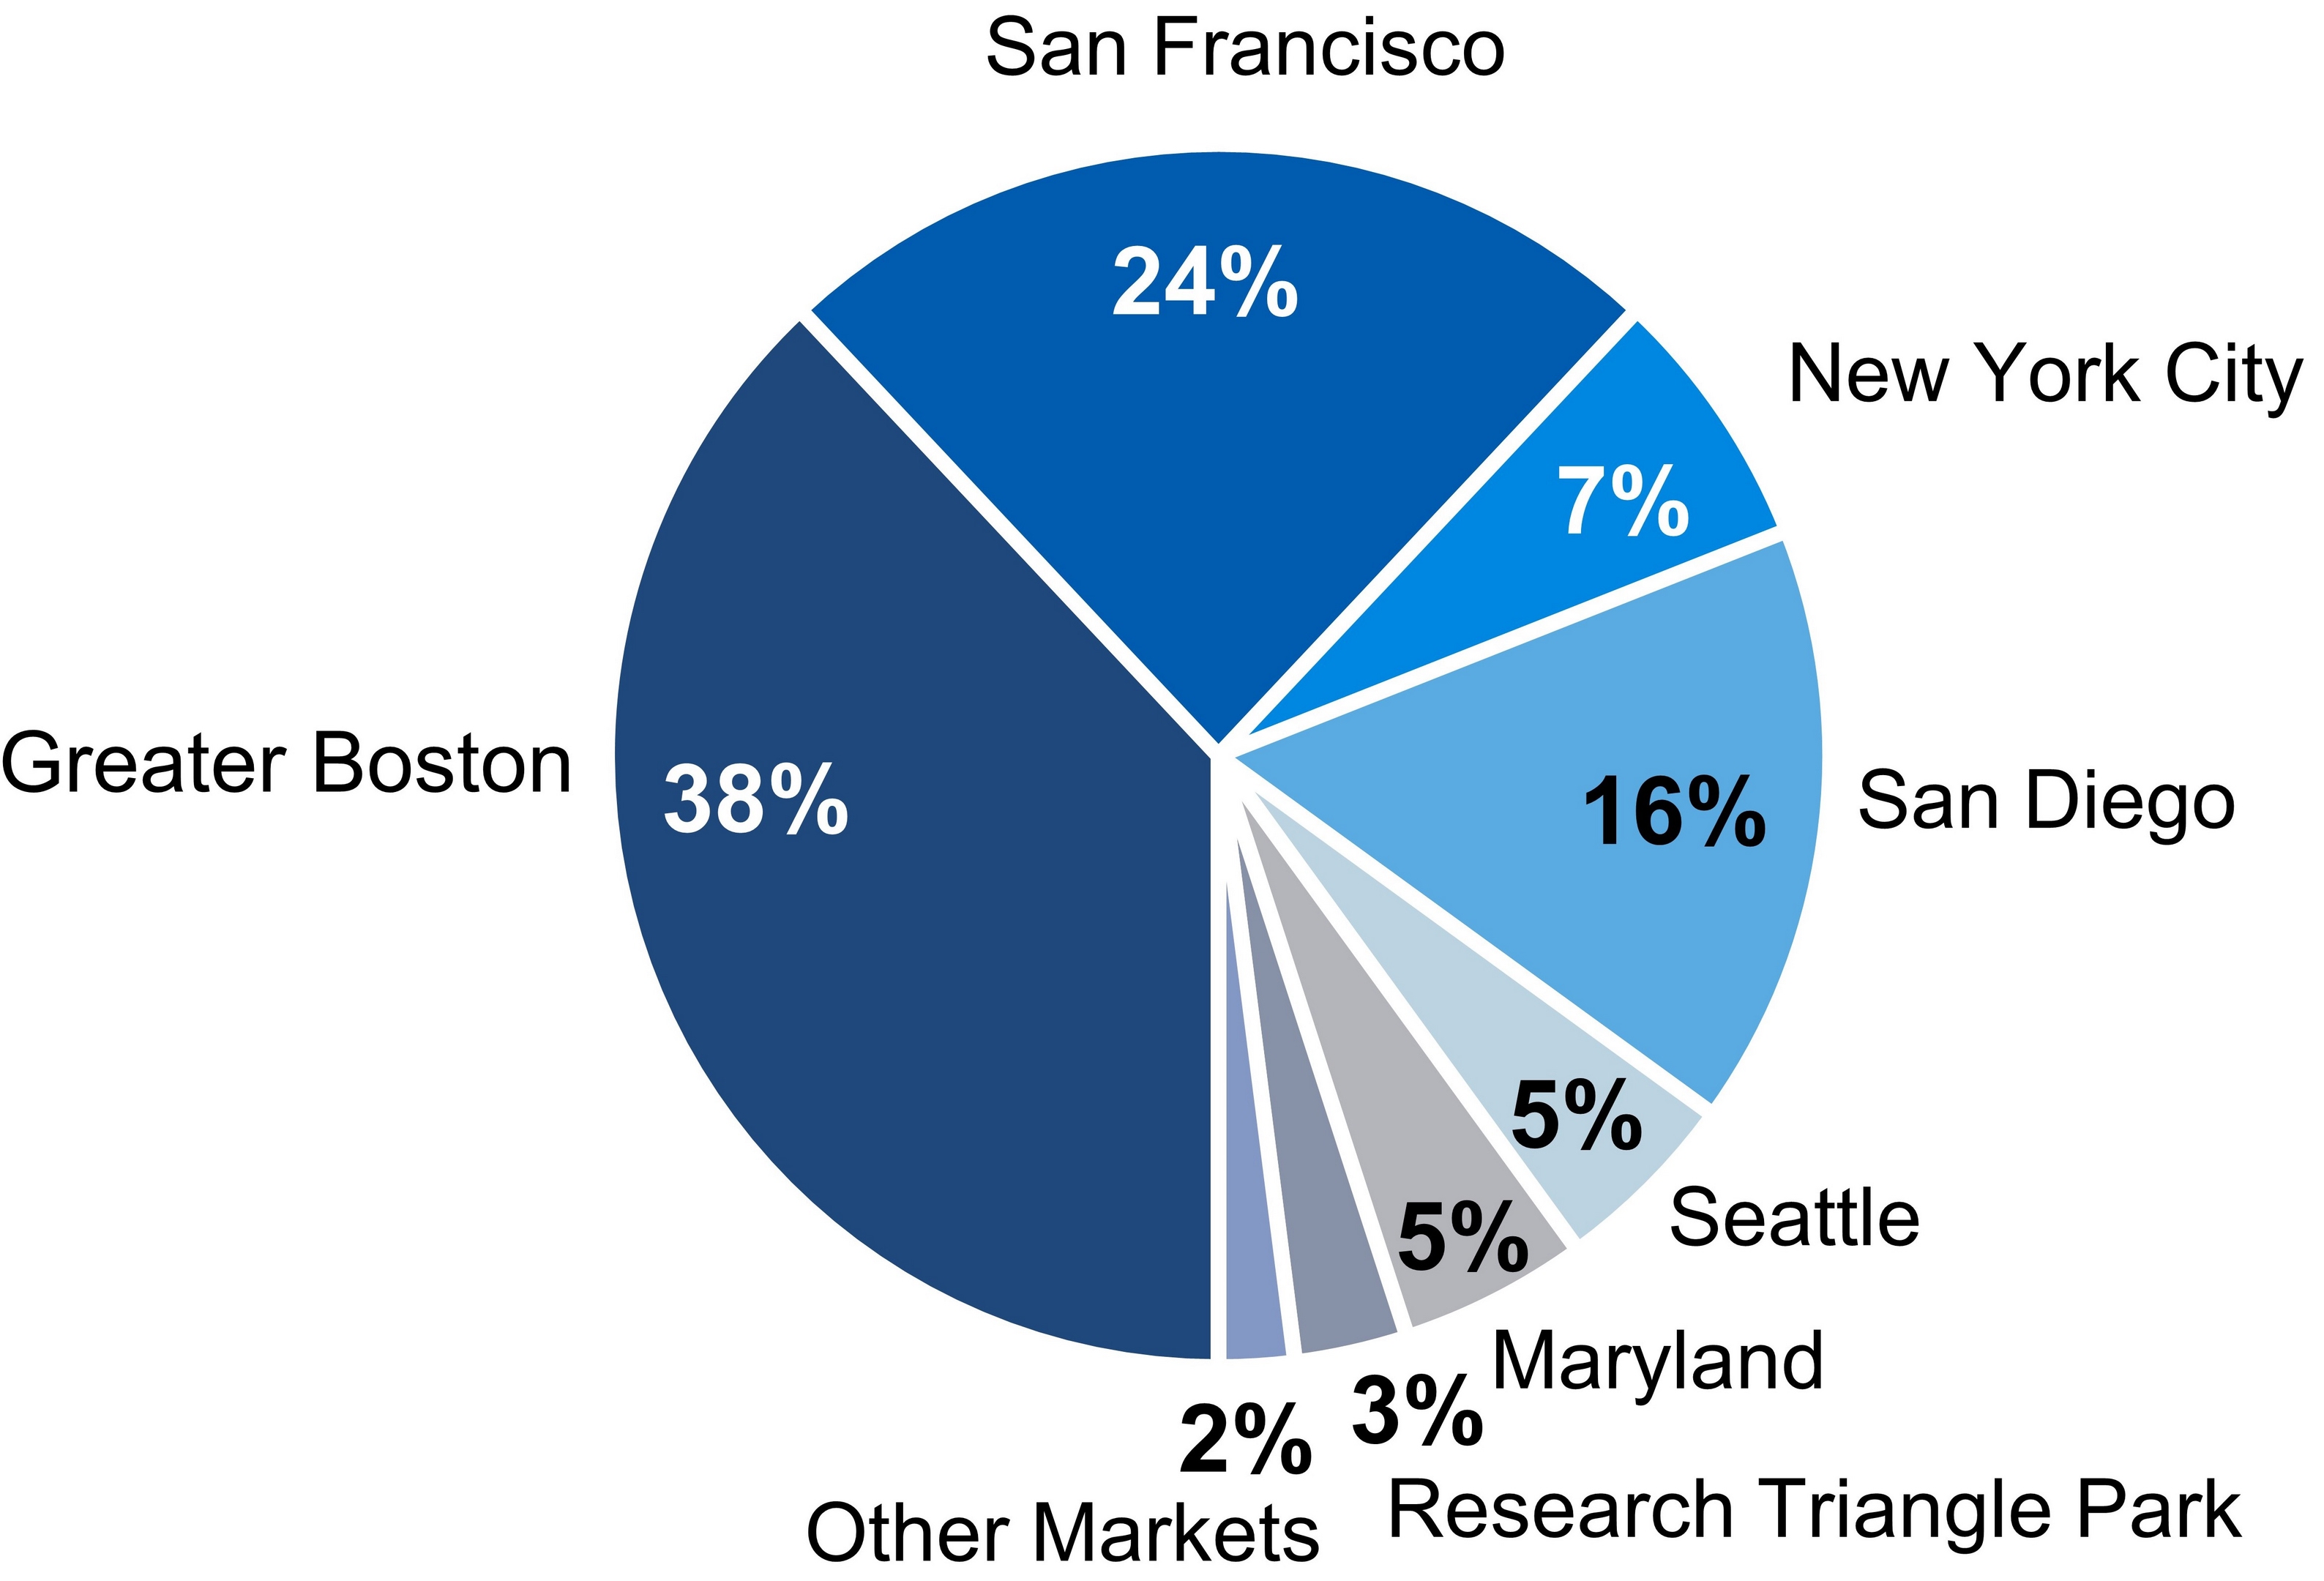 | ||||
| 79% | ||||
| of ARE’s | ||||
Annual Rental Revenue(1) | ||||
Percentage of ARE’s Annual Rental Revenue(1) | ||||
| (1) | Represents annual rental revenue in effect as of 1Q18. |
| |
| Occupancy | |
| March 31, 2018 | |
Solid Demand for Class A Properties in AAA Locations
Drives Solid Occupancy
Solid Historical Occupancy(1) | Occupancy across Key Locations | |||
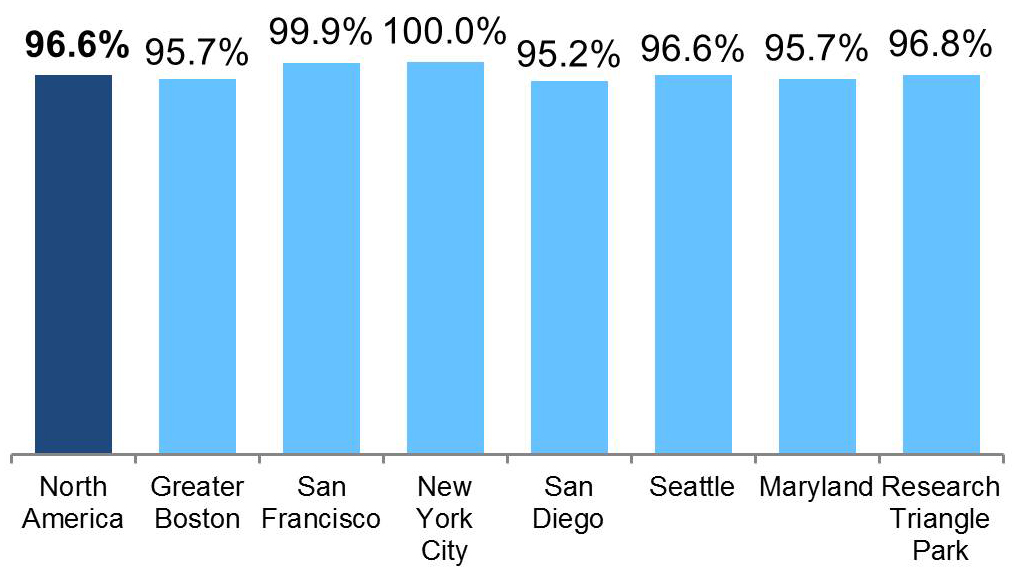 | ||||
| 96% | ||||
| Over 10 Years | ||||
| Occupancy of Operating Properties | ||||
| as of March 31, 2018 | ||||
| (1) | Average occupancy of operating properties in North America as of each December 31 for the last 10 years and as of 1Q18. |
| Financial and Asset Base Highlights | |
| March 31, 2018 | |
| (Dollars in thousands, except per share amounts) | |
| Three Months Ended (unless stated otherwise) | ||||||||||||||||||||
| 3/31/18 | 12/31/17 | 9/30/17 | 6/30/17 | 3/31/17 | ||||||||||||||||
| Selected financial data from consolidated financial statements and related information | ||||||||||||||||||||
| Adjusted EBITDA – quarter annualized | $ | 914,444 | $ | 817,392 | $ | 773,828 | $ | 755,048 | $ | 723,764 | ||||||||||
| Adjusted EBITDA – trailing 12 months | $ | 815,178 | $ | 767,508 | $ | 728,869 | $ | 689,079 | $ | 650,579 | ||||||||||
| Adjusted EBITDA margins | 69% | 68% | 68% | 68% | 67% | |||||||||||||||
| Operating margins | 71% | 71% | 71% | 72% | 72% | |||||||||||||||
| Net debt at end of period | $ | 4,979,254 | $ | 4,516,672 | $ | 4,698,568 | $ | 4,660,216 | $ | 4,292,773 | ||||||||||
| Net debt to Adjusted EBITDA – quarter annualized | 5.4x | 5.5x | 6.1x | 6.2x | 5.9x | |||||||||||||||
| Net debt to Adjusted EBITDA – trailing 12 months | 6.1x | 5.9x | 6.4x | 6.8x | 6.6x | |||||||||||||||
| Net debt and preferred stock to Adjusted EBITDA – quarter annualized | 5.5x | 5.6x | 6.2x | 6.3x | 6.0x | |||||||||||||||
| Net debt and preferred stock to Adjusted EBITDA – trailing 12 months | 6.2x | 6.0x | 6.5x | 6.9x | 6.7x | |||||||||||||||
| Fixed-charge coverage ratio – quarter annualized | 4.6x | 4.2x | 4.1x | 4.1x | 4.1x | |||||||||||||||
| Fixed-charge coverage ratio – trailing 12 months | 4.3x | 4.1x | 4.0x | 3.9x | 3.8x | |||||||||||||||
| Unencumbered net operating income as a percentage of total net operating income | 87% | 86% | 81% | 81% | 81% | |||||||||||||||
| Closing stock price at end of period | $ | 124.89 | $ | 130.59 | $ | 118.97 | $ | 120.47 | $ | 110.52 | ||||||||||
| Common shares outstanding (in thousands) at end of period | 100,696 | 99,784 | 94,325 | 92,098 | 89,884 | |||||||||||||||
| Total equity capitalization at end of period | $ | 12,682,876 | $ | 13,140,843 | $ | 11,328,163 | $ | 11,202,668 | $ | 10,037,702 | ||||||||||
| Total market capitalization at end of period | $ | 17,893,674 | $ | 17,905,650 | $ | 16,145,203 | $ | 15,978,053 | $ | 14,468,388 | ||||||||||
| Dividend per share – quarter/annualized | $0.90/$3.60 | $0.90/$3.60 | $0.86/$3.44 | $0.86/$3.44 | $0.83/$3.32 | |||||||||||||||
| Dividend payout ratio for the quarter | 56% | 61% | 58% | 58% | 57% | |||||||||||||||
| Dividend yield – annualized | 2.9% | 2.8% | 2.9% | 2.9% | 3.0% | |||||||||||||||
| General and administrative expenses as a percentage of total assets – trailing 12 months | 0.6% | 0.6% | 0.6% | 0.6% | 0.6% | |||||||||||||||
| General and administrative expenses as a percentage of total revenues – trailing 12 months | 6.6% | 6.6% | 6.8% | 7.0% | 7.0% | |||||||||||||||
| Capitalized interest | $ | 13,360 | $ | 12,897 | $ | 17,092 | $ | 15,069 | $ | 13,164 | ||||||||||
| Weighted-average interest rate for capitalization of interest during period | 3.91% | 3.89% | 3.96% | 3.98% | 3.95% | |||||||||||||||
| Financial and Asset Base Highlights (continued) | |
| March 31, 2018 | |
| (Dollars in thousands, except annual rental revenue per occupied RSF amounts) | |
| Three Months Ended (unless stated otherwise) | ||||||||||||||||||||
| 3/31/18 | 12/31/17 | 9/30/17 | 6/30/17 | 3/31/17 | ||||||||||||||||
| Amounts included in funds from operations and non-revenue-enhancing capital expenditures | ||||||||||||||||||||
| Straight-line rent revenue | $ | 32,631 | $ | 33,281 | $ | 20,865 | $ | 17,905 | $ | 35,592 | ||||||||||
| Amortization of acquired below-market leases | $ | 6,170 | $ | 4,147 | $ | 4,545 | $ | 5,004 | $ | 5,359 | ||||||||||
| Straight-line rent expense on ground leases | $ | 240 | $ | 205 | $ | 206 | $ | 201 | $ | 198 | ||||||||||
| Stock compensation expense | $ | 7,248 | $ | 6,961 | $ | 7,893 | $ | 5,504 | $ | 5,252 | ||||||||||
| Amortization of loan fees | $ | 2,543 | $ | 2,571 | $ | 2,840 | $ | 2,843 | $ | 2,895 | ||||||||||
| Amortization of debt premiums | $ | 575 | $ | 639 | $ | 652 | $ | 625 | $ | 596 | ||||||||||
| Non-revenue-enhancing capital expenditures: | ||||||||||||||||||||
| Building improvements | $ | 2,625 | $ | 2,469 | $ | 2,453 | $ | 1,840 | $ | 1,138 | ||||||||||
| Tenant improvements and leasing commissions | $ | 2,836 | $ | 9,578 | $ | 9,976 | $ | 9,389 | $ | 18,377 | ||||||||||
| Operating statistics and related information (at end of period) | ||||||||||||||||||||
| Number of properties – North America | 222 | 213 | 206 | 202 | 199 | |||||||||||||||
| RSF (including development and redevelopment projects under construction) – North America | 23,066,089 | 21,981,133 | 20,642,042 | 20,567,473 | 20,084,195 | |||||||||||||||
| Total square feet – North America | 30,240,017 | 29,563,221 | 28,583,747 | 28,351,518 | 28,176,780 | |||||||||||||||
| Annual rental revenue per occupied RSF – North America | $ | 48.09 | $ | 48.01 | $ | 47.19 | $ | 46.55 | $ | 45.94 | ||||||||||
| Occupancy of operating properties – North America | 96.6% | 96.8% | 96.1% | 95.7% | 95.5% | |||||||||||||||
| Occupancy of operating and redevelopment properties – North America | 94.3% | 94.7% | 93.9% | 94.0% | 94.7% | |||||||||||||||
| Weighted average remaining lease term (in years) | 8.7 | 8.9 | 8.8 | 8.8 | 9.0 | |||||||||||||||
| Total leasing activity – RSF | 1,481,164 | 1,379,699 | 786,925 | 1,081,777 | 1,320,781 | |||||||||||||||
| Lease renewals and re-leasing of space – change in average new rental rates over expiring rates: | ||||||||||||||||||||
| Rental rate increases | 16.3% | 24.8% | 24.2% | 23.2% | 27.8% | |||||||||||||||
| Rental rate increases (cash basis) | 19.0% | 10.4% | 10.0% | 9.4% | 17.7% | |||||||||||||||
| RSF (included in total leasing activity above) | 234,548 | 593,622 | 448,472 | 604,142 | 878,863 | |||||||||||||||
| Same property – percentage change over comparable quarter from prior year: | ||||||||||||||||||||
| Net operating income increase | 4.0% | 4.5% | 2.2% | 1.8% | 2.6% | |||||||||||||||
| Net operating income increase (cash basis) | 14.6% | 12.5% | 7.8% | 7.0% | 5.5% | |||||||||||||||
| |
| Key Operating Metrics | |
| March 31, 2018 | |
Favorable Lease Structure(1) | Same Property Net Operating Income Growth | |||||||||
 |  | |||||||||
| Stable cash flows | ||||||||||
Percentage of triple net leases | 97% | |||||||||
| Increasing cash flows | ||||||||||
Percentage of leases containing annual rent escalations | 95% | |||||||||
| Lower capex burden | ||||||||||
Percentage of leases providing for the recapture of capital expenditures | 94% | |||||||||
Margins(2) | Rental Rate Growth: Renewed/Re-Leased Space | |||||||||
 |  | |||||||||
| Adjusted EBITDA | Operating | |||||||||
| 69% | 71% | |||||||||
| (1) | Percentages calculated based on RSF as of 1Q18. |
| (2) | Represents percentages for 1Q18. |
| (3) | Rental rate increase driven primarily by the successful execution of our strategy to re-lease significantly below-market leases at our Alexandria Center® at One Kendall Square campus in our Cambridge submarket. Since our acquisition of the campus in 4Q16, we have re-leased and renewed approximately 185,000 RSF of below-market space, or three times the volume we initially forecasted to be executed through 1Q18, at rental rate (cash basis) increases of approximately 26%. |
| Same Property Performance | |
| March 31, 2018 | |
| (Dollars in thousands) | |
| Same Property Financial Data | 1Q18 | Same Property Statistical Data | 1Q18 | ||||
| Percentage change over comparable period from prior year: | Number of same properties | 188 | |||||
| Net operating income increase | 4.0% | Rentable square feet | 17,618,620 | ||||
| Net operating income increase (cash basis) | 14.6% | Occupancy – current-period average | 96.2% | ||||
| Operating margin | 71% | Occupancy – same-period prior-year average | 96.1% | ||||
| Three Months Ended March 31, | ||||||||||||||||
| 2018 | 2017 | $ Change | % Change | |||||||||||||
| Same properties | $ | 204,378 | $ | 197,207 | $ | 7,171 | 3.6 | % | ||||||||
| Non-same properties | 40,107 | 9,986 | 30,121 | 301.6 | ||||||||||||
| Total rental | 244,485 | 207,193 | 37,292 | 18.0 | ||||||||||||
| Same properties | 66,398 | 60,186 | 6,212 | 10.3 | ||||||||||||
| Non-same properties | 6,772 | 1,160 | 5,612 | 483.8 | ||||||||||||
| Total tenant recoveries | 73,170 | 61,346 | 11,824 | 19.3 | ||||||||||||
| Same properties | 69 | 58 | 11 | 19.0 | ||||||||||||
| Non-same properties | 2,415 | 2,280 | 135 | 5.9 | ||||||||||||
| Total other income | 2,484 | 2,338 | 146 | 6.2 | ||||||||||||
| Same properties | 270,845 | 257,451 | 13,394 | 5.2 | ||||||||||||
| Non-same properties | 49,294 | 13,426 | 35,868 | 267.2 | ||||||||||||
| Total revenues | 320,139 | 270,877 | 49,262 | 18.2 | ||||||||||||
| Same properties | 77,523 | 71,509 | 6,014 | 8.4 | ||||||||||||
| Non-same properties | 14,248 | 5,578 | 8,670 | 155.4 | ||||||||||||
| Total rental operations | 91,771 | 77,087 | 14,684 | 19.0 | ||||||||||||
| Same properties | 193,322 | 185,942 | 7,380 | 4.0 | ||||||||||||
| Non-same properties | 35,046 | 7,848 | 27,198 | 346.6 | ||||||||||||
| Net operating income | $ | 228,368 | $ | 193,790 | $ | 34,578 | 17.8 | % | ||||||||
| Net operating income – same properties | $ | 193,322 | $ | 185,942 | $ | 7,380 | 4.0 | % | ||||||||
| Straight-line rent revenue and amortization of acquired below-market leases | (18,013 | ) | (32,940 | ) | 14,927 | (45.3 | ) | |||||||||
| Net operating income – same properties (cash basis) | $ | 175,309 | $ | 153,002 | $ | 22,307 | 14.6 | % | ||||||||
See definition for “Same Property Comparisons” on page 53 of our Supplemental Information for a reconciliation of same store properties to total properties.
| |
| Leasing Activity | |
| March 31, 2018 | |
| Three Months Ended | Year Ended | |||||||||||||||
| March 31, 2018 | December 31, 2017 | |||||||||||||||
| (Dollars per RSF) | Including Straight-Line Rent | Cash Basis | Including Straight-Line Rent | Cash Basis | ||||||||||||
| Leasing activity: | ||||||||||||||||
Renewed/re-leased space(1) | ||||||||||||||||
| Rental rate changes | 16.3% | (2) | 19.0% | (2) | 25.1% | 12.7% | ||||||||||
| New rates | $ | 50.90 | $ | 49.56 | $ | 51.05 | $ | 47.99 | ||||||||
| Expiring rates | $ | 43.77 | $ | 41.65 | $ | 40.80 | $ | 42.60 | ||||||||
| Rentable square footage | 234,548 | 2,525,099 | ||||||||||||||
| Tenant improvements/leasing commissions | $ | 12.09 | $ | 18.74 | ||||||||||||
| Weighted-average lease term | 3.8 years | 6.2 years | ||||||||||||||
| Developed/redeveloped/previously vacant space leased | ||||||||||||||||
| New rates | $ | 72.19 | $ | 58.75 | $ | 47.56 | $ | 42.93 | ||||||||
| Rentable square footage | 1,246,616 | (3) | 2,044,083 | |||||||||||||
| Tenant improvements/leasing commissions | $ | 10.55 | $ | 9.83 | ||||||||||||
| Weighted-average lease term | 15.2 years | 10.1 years | ||||||||||||||
| Leasing activity summary (totals): | ||||||||||||||||
| New rates | $ | 68.82 | $ | 57.30 | $ | 49.49 | $ | 45.72 | ||||||||
| Rentable square footage | 1,481,164 | (4) | 4,569,182 | |||||||||||||
| Tenant improvements/leasing commissions | $ | 10.79 | $ | 14.75 | ||||||||||||
| Weighted-average lease term | 13.4 years | 7.9 years | ||||||||||||||
Lease expirations:(1) | ||||||||||||||||
| Expiring rates | $ | 42.55 | $ | 43.71 | $ | 39.99 | $ | 41.71 | ||||||||
| Rentable square footage | 540,033 | 2,919,259 | ||||||||||||||
Leasing activity includes 100% of results for each property in which we have an investment in North America.
| (1) | Excludes 22 month-to-month leases aggregating 50,686 RSF and 25 month-to-month leases aggregating 37,006 RSF as of 1Q18, and 4Q17, respectively. |
| (2) | Rental rate increase driven primarily by the successful execution of our strategy to re-lease significantly below-market leases at our Alexandria Center® at One Kendall Square campus in our Cambridge submarket. Since our acquisition of the campus in 4Q16, we have re-leased and renewed approximately 185,000 RSF of below-market space, or three times the volume we initially forecasted to be executed through 1Q18, at rental rate (cash basis) increases of approximately 26%. |
| (3) | Includes 593,765 RSF at 1655 and 1725 Third Street in our Mission Bay/SoMa submarket, 192,070 RSF at Summers Ridge Science Park in our Sorrento Mesa submarket, 123,403 RSF at 399 Binney Street in our Cambridge submarket, 104,013 RSF at 279 East Grand Avenue, and 60,963 RSF at 681 Gateway Boulevard in our South San Francisco submarket aggregating 1,074,214 RSF of development, redevelopment, or previously vacant space leased in 1Q18. |
| (4) | During 1Q18, we granted tenant concessions/free rent averaging 2.7 months with respect to the 1,481,164 RSF leased. Approximately 59% of the leases executed during 1Q18 did not include concessions for free rent. |
| |
| Contractual Lease Expirations | |
| March 31, 2018 | |
| Year | Number of Leases | RSF | Percentage of Occupied RSF | Annual Rental Revenue (per RSF)(1) | Percentage of Total Annual Rental Revenue | ||||||||||||||||||||||||
| 2018 | (2) | 73 | 984,083 | 4.9 | % | $ | 41.91 | 4.4 | % | ||||||||||||||||||||
| 2019 | 90 | 1,395,878 | 7.0 | % | $ | 39.42 | 5.8 | % | |||||||||||||||||||||
| 2020 | 108 | 1,762,000 | 8.8 | % | $ | 37.95 | 7.1 | % | |||||||||||||||||||||
| 2021 | 89 | 1,694,342 | 8.5 | % | $ | 41.97 | 7.5 | % | |||||||||||||||||||||
| 2022 | 86 | 1,526,328 | 7.6 | % | $ | 44.93 | 7.2 | % | |||||||||||||||||||||
| 2023 | 62 | 1,983,398 | 9.9 | % | $ | 42.82 | 9.0 | % | |||||||||||||||||||||
| 2024 | 31 | 1,410,528 | 7.0 | % | $ | 48.61 | 7.2 | % | |||||||||||||||||||||
| 2025 | 28 | 814,573 | 4.1 | % | $ | 50.79 | 4.4 | % | |||||||||||||||||||||
| 2026 | 19 | 778,993 | 3.9 | % | $ | 45.61 | 3.7 | % | |||||||||||||||||||||
| 2027 | 25 | 1,845,581 | 9.2 | % | $ | 44.47 | 8.7 | % | |||||||||||||||||||||
| Thereafter | 47 | 5,811,887 | 29.1 | % | $ | 57.22 | 35.0 | % | |||||||||||||||||||||
| Market | 2018 Contractual Lease Expirations | Annual Rental Revenue (per RSF)(1) | 2019 Contractual Lease Expirations | Annual Rental Revenue (per RSF)(1) | |||||||||||||||||||||||||||||||||||||||
| Leased | Negotiating/ Anticipating | Targeted for Development/ Redevelopment | Remaining Expiring Leases | Total(2) | Leased | Negotiating/ Anticipating | Targeted for Development/ Redevelopment | Remaining Expiring Leases | Total | ||||||||||||||||||||||||||||||||||
| Greater Boston | 55,761 | 37,492 | — | 109,145 | 202,398 | $ | 53.23 | 16,188 | 72,396 | — | 260,651 | 349,235 | $ | 51.09 | |||||||||||||||||||||||||||||
| San Francisco | 19,988 | — | 321,971 | (3) | 65,637 | 407,596 | 35.26 | 22,882 | — | — | 183,814 | 206,696 | 45.01 | ||||||||||||||||||||||||||||||
| New York City | 15,517 | 577 | — | 42,015 | 58,109 | N/A | — | — | — | 7,601 | 7,601 | N/A | |||||||||||||||||||||||||||||||
| San Diego | — | — | — | 140,408 | 140,408 | 33.96 | 71,457 | 51,358 | 44,034 | (4) | 201,749 | 368,598 | 31.39 | ||||||||||||||||||||||||||||||
| Seattle | 2,468 | — | — | 6,272 | 8,740 | 52.56 | — | — | — | 212,010 | 212,010 | 43.91 | |||||||||||||||||||||||||||||||
| Maryland | 8,110 | 2,618 | — | 32,491 | 43,219 | 21.58 | — | — | — | 158,433 | 158,433 | 26.12 | |||||||||||||||||||||||||||||||
| Research Triangle Park | — | 15,800 | — | 33,203 | 49,003 | 23.77 | — | — | — | 40,604 | 40,604 | 20.66 | |||||||||||||||||||||||||||||||
| Canada | 12,450 | 5,952 | — | 45,063 | 63,465 | 19.83 | — | — | — | 2,238 | 2,238 | 17.01 | |||||||||||||||||||||||||||||||
| Non-cluster markets | — | 6,721 | — | 4,424 | 11,145 | 26.18 | — | — | — | 50,463 | 50,463 | 22.25 | |||||||||||||||||||||||||||||||
| Total | 114,294 | 69,160 | 321,971 | 478,658 | 984,083 | $ | 41.91 | 110,527 | 123,754 | 44,034 | 1,117,563 | 1,395,878 | $ | 39.42 | |||||||||||||||||||||||||||||
| Percentage of expiring leases | 12 | % | 7 | % | 33 | % | 48 | % | 100 | % | 8 | % | 9 | % | 3 | % | 80 | % | 100 | % | |||||||||||||||||||||||
| (1) | Represents amounts in effect as of 1Q18. |
| (2) | Excludes 22 month-to-month leases aggregating 50,686 RSF as of 1Q18. |
| (3) | Includes 195,000 RSF expiring at the beginning of 2Q18 at 960 Industrial Road, a recently acquired property located in our Greater Stanford submarket, where we are pursuing entitlements aggregating 500,000 RSF for a multi-building development. Also includes 126,971 RSF of office space targeted for redevelopment into office/laboratory space upon expiration of the existing lease at the end of 3Q18 at 681 Gateway Boulevard in our South San Francisco submarket, of which 60,963 RSF, or 48%, is pre-leased to another tenant. Concurrent with our redevelopment, we anticipate expanding 681 Gateway Boulevard by an additional 15,000 RSF to 30,000 RSF and expect initial occupancy in 2019. |
| (4) | Represents 44,034 RSF expiring in January 2019 at 4110 Campus Point Court, a recently acquired property in our University Town Center submarket, which we expect to redevelop into tech office or office/laboratory space. |
| Top 20 Tenants | |
| March 31, 2018 | |
| (Dollars in thousands, except market cap/private valuation) | |
88% of Top 20 Annual Rental Revenue from Investment-Grade or Large Cap Tenants
| Tenant | Remaining Lease Term in Years(1) | Aggregate RSF | Annual Rental Revenue(1) | Percentage of Aggregate Annual Rental Revenue(1) | Investment-Grade Ratings | Market Cap / Private Valuation (in billions) | ||||||||||||||||||||||||
| Moody’s | S&P | |||||||||||||||||||||||||||||
| 1 | Illumina, Inc. | 12.3 | 891,495 | $ | 34,859 | 3.7 | % | — | BBB | $ | 34.5 | |||||||||||||||||||
| 2 | Sanofi | 9.6 | 514,450 | 30,527 | 3.2 | A1 | AA | $ | 100.1 | |||||||||||||||||||||
| 3 | Takeda Pharmaceutical Company Ltd. | 12.0 | 386,111 | 30,522 | 3.2 | A1 | A- | $ | 41.0 | |||||||||||||||||||||
| 4 | Eli Lilly and Company | 11.6 | 469,266 | 29,334 | 3.1 | A2 | AA- | $ | 84.5 | |||||||||||||||||||||
| 5 | Bristol-Myers Squibb Company | 9.8 | 460,050 | 29,330 | 3.1 | A2 | A+ | $ | 103.4 | |||||||||||||||||||||
| 6 | Celgene Corporation | 8.3 | 614,082 | 28,881 | 3.0 | Baa2 | BBB+ | $ | 67.1 | |||||||||||||||||||||
| 7 | Novartis AG | 8.8 | 367,995 | 28,119 | 3.0 | Aa3 | AA- | $ | 190.8 | |||||||||||||||||||||
| 8 | Uber Technologies, Inc. | 74.7 | (2) | 422,980 | 22,162 | 2.3 | (3) | (3) | $ | 69.6 | (4) | |||||||||||||||||||
| 9 | New York University | 12.4 | 209,224 | 20,718 | 2.2 | Aa2 | AA- | $ | — | |||||||||||||||||||||
| 10 | bluebird bio, Inc. | 8.9 | 262,261 | 20,093 | 2.1 | — | — | $ | 8.6 | |||||||||||||||||||||
| 11 | Stripe, Inc. | 9.5 | 295,333 | 17,822 | 1.9 | — | — | $ | 9.2 | (4) | ||||||||||||||||||||
| 12 | Roche | 3.9 | 343,861 | 17,597 | 1.9 | Aa3 | AA | $ | 196.0 | |||||||||||||||||||||
| 13 | Amgen Inc. | 6.0 | 407,369 | 16,838 | 1.8 | Baa1 | A | $ | 122.8 | |||||||||||||||||||||
| 14 | Massachusetts Institute of Technology | 7.2 | 256,126 | 16,729 | 1.8 | Aaa | AAA | $ | — | |||||||||||||||||||||
| 15 | United States Government | 7.3 | 264,358 | 15,056 | 1.6 | Aaa | AA+ | $ | — | |||||||||||||||||||||
| 16 | FibroGen, Inc. | 5.6 | 234,249 | 14,198 | 1.5 | — | — | $ | 3.8 | |||||||||||||||||||||
| 17 | Facebook, Inc. | 11.7 | 382,883 | 13,785 | 1.5 | (3) | (3) | $ | 444.6 | |||||||||||||||||||||
| 18 | Biogen Inc. | 10.5 | 305,212 | 13,278 | 1.4 | Baa1 | A- | $ | 57.5 | |||||||||||||||||||||
| 19 | Pinterest, Inc. | 14.9 | 148,146 | 12,103 | 1.3 | (3) | (3) | $ | 12.3 | (4) | ||||||||||||||||||||
| 20 | Vertex Pharmaceuticals Incorporated | 14.5 | 231,440 | 11,034 | 1.2 | (3) | (3) | $ | 41.4 | |||||||||||||||||||||
| Total/weighted average | 13.2 | (3) | 7,466,891 | $ | 422,985 | 44.8 | % | |||||||||||||||||||||||
| (1) | Based on aggregate annual rental revenue in effect as of 1Q18. See “Definitions and Reconciliations” on page 48 for our methodology on annual rental revenue for unconsolidated properties. |
| (2) | Represents a ground lease with Uber Technologies, Inc. at 1455 and 1515 Third Street in our Mission Bay/SoMa submarket. Excluding the ground lease, the weighted-average remaining lease term for our top 20 tenants was 9.8 years as of March 31, 2018. |
| (3) | Tenant with market capitalization or private valuation greater than $10 billion as of 1Q18. |
| (4) | We obtained the most recently reported private valuations as of 1Q18 from PitchBook Data, Inc., a comprehensive database that provides data on private capital markets, including venture capital, private equity, and M&A transactions. |
| Summary of Properties and Occupancy | |
| March 31, 2018 | |
| (Dollars in thousands, except per RSF amounts) | |
Summary of properties
| Market | RSF | Number of Properties | Annual Rental Revenue | |||||||||||||||||||||||||||
| Operating | Development | Redevelopment | Total | % of Total | Total | % of Total | Per RSF | |||||||||||||||||||||||
| Greater Boston | 6,237,599 | 164,000 | 31,858 | 6,433,457 | 28 | % | 54 | $ | 359,063 | 38 | % | $ | 61.46 | |||||||||||||||||
| San Francisco | 4,733,279 | 1,627,088 | 45,115 | 6,405,482 | 28 | 44 | 226,241 | 24 | 49.84 | |||||||||||||||||||||
| New York City | 727,674 | — | — | 727,674 | 3 | 2 | 63,555 | 7 | 87.34 | |||||||||||||||||||||
| San Diego | 4,349,106 | — | 163,648 | 4,512,754 | 20 | 56 | 160,620 | 16 | 38.79 | |||||||||||||||||||||
| Seattle | 1,037,920 | — | — | 1,037,920 | 4 | 11 | 48,530 | 5 | 48.39 | |||||||||||||||||||||
| Maryland | 2,101,195 | — | 103,225 | 2,204,420 | 10 | 30 | 52,633 | 5 | 26.29 | |||||||||||||||||||||
| Research Triangle Park | 1,043,726 | — | 175,000 | 1,218,726 | 5 | 16 | 26,097 | 3 | 25.84 | |||||||||||||||||||||
| Canada | 256,967 | — | — | 256,967 | 1 | 3 | 6,824 | 1 | 26.68 | |||||||||||||||||||||
| Non-cluster markets | 268,689 | — | — | 268,689 | 1 | 6 | 5,455 | 1 | 25.73 | |||||||||||||||||||||
| North America | 20,756,155 | 1,791,088 | 518,846 | 23,066,089 | 100 | % | 222 | $ | 949,018 | 100 | % | $ | 48.09 | |||||||||||||||||
| 2,309,934 | ||||||||||||||||||||||||||||||
Summary of occupancy
| Operating Properties | Operating and Redevelopment Properties | |||||||||||||||||
| Market | 3/31/18 | 12/31/17 | 3/31/17 | 3/31/18 | 12/31/17 | 3/31/17 | ||||||||||||
| Greater Boston | 95.7 | % | 96.6 | % | 96.1 | % | 95.2 | % | 95.7 | % | 96.1 | % | ||||||
| San Francisco | 99.9 | 99.6 | 99.8 | 98.9 | 99.6 | 99.8 | ||||||||||||
| New York City | 100.0 | 99.8 | 97.8 | 100.0 | 99.8 | 97.8 | ||||||||||||
| San Diego | 95.2 | 94.5 | 91.0 | 91.7 | 90.9 | 87.3 | ||||||||||||
| Seattle | 96.6 | 97.7 | 98.2 | 96.6 | 97.7 | 98.2 | ||||||||||||
| Maryland | 95.7 | 95.2 | 92.6 | 91.2 | 93.2 | 92.6 | ||||||||||||
| Research Triangle Park | 96.8 | 98.1 | 97.5 | 82.9 | 84.0 | 97.5 | ||||||||||||
| Subtotal | 96.8 | 97.0 | 95.6 | 94.4 | 94.9 | 94.7 | ||||||||||||
| Canada | 99.6 | 99.6 | 99.2 | 99.6 | 99.6 | 99.2 | ||||||||||||
| Non-cluster markets | 78.9 | 78.4 | 88.4 | 78.9 | 78.4 | 88.4 | ||||||||||||
| North America | 96.6 | % | 96.8 | % | 95.5 | % | 94.3 | % | 94.7 | % | 94.7 | % | ||||||
See “Definitions and Reconciliations” in our Supplemental Information for additional information.
| Property Listing | |
| March 31, 2018 | |
| (Dollars in thousands) | |
Market / Submarket / Address | RSF | Number of Properties | Annual Rental Revenue | Occupancy Percentage | ||||||||||||||||||||||||
| Operating | Operating and Redevelopment | |||||||||||||||||||||||||||
| Operating | Development | Redevelopment | Total | |||||||||||||||||||||||||
| Greater Boston | ||||||||||||||||||||||||||||
| Cambridge/Inner Suburbs | ||||||||||||||||||||||||||||
Alexandria Center® at Kendall Square | ||||||||||||||||||||||||||||
| 50, 60, 75/125, and 100 Binney Street, 161 First Street, 215 First Street, 150 Second Street, 300 Third Street, and 11 Hurley Street | 2,060,275 | — | — | 2,060,275 | 9 | $ | 140,136 | 97.0 | % | 97.0 | % | |||||||||||||||||
225 Binney Street (consolidated joint venture – 30% ownership) | 305,212 | — | — | 305,212 | 1 | 13,278 | 100.0 | 100.0 | ||||||||||||||||||||
Alexandria Technology Square® | 1,181,635 | — | — | 1,181,635 | 7 | 86,245 | 98.9 | 98.9 | ||||||||||||||||||||
100, 200, 300, 400, 500, 600, and 700 Technology Square | ||||||||||||||||||||||||||||
Alexandria Center® at One Kendall Square | 649,705 | 164,000 | — | 813,705 | 10 | 43,235 | 83.5 | 83.5 | ||||||||||||||||||||
| One Kendall Square – Buildings 100, 200, 300, 400, 500, 600/700, 1400, 1800, 2000, and 399 Binney Street | ||||||||||||||||||||||||||||
| 480 and 500 Arsenal Street | 234,260 | — | — | 234,260 | 2 | 10,532 | 100.0 | 100.0 | ||||||||||||||||||||
| 640 Memorial Drive | 225,504 | — | — | 225,504 | 1 | 13,771 | 100.0 | 100.0 | ||||||||||||||||||||
| 780 and 790 Memorial Drive | 99,658 | — | — | 99,658 | 2 | 7,195 | 93.4 | 93.4 | ||||||||||||||||||||
| 167 Sidney Street and 99 Erie Street | 54,549 | — | — | 54,549 | 2 | 3,735 | 100.0 | 100.0 | ||||||||||||||||||||
| 79/96 13th Street (Charlestown Navy Yard) | 25,309 | — | — | 25,309 | 1 | 620 | 100.0 | 100.0 | ||||||||||||||||||||
| Cambridge/Inner Suburbs | 4,836,107 | 164,000 | — | 5,000,107 | 35 | 318,747 | 96.1 | 96.1 | ||||||||||||||||||||
| Longwood Medical Area | ||||||||||||||||||||||||||||
| 360 Longwood Avenue (unconsolidated joint venture – 27.5% ownership) | 210,709 | — | — | 210,709 | 1 | 3,942 | 83.8 | 83.8 | ||||||||||||||||||||
| Route 128 | ||||||||||||||||||||||||||||
| Alexandria Park at 128 | 343,882 | — | — | 343,882 | 8 | 10,478 | 95.6 | 95.6 | ||||||||||||||||||||
3 and 6/8 Preston Court, 29, 35, and 44 Hartwell Avenue, 35 and 45/47 Wiggins Avenue, and 60 Westview Street | ||||||||||||||||||||||||||||
| 225, 266, and 275 Second Avenue | 285,759 | — | 31,858 | 317,617 | 3 | 12,312 | 100.0 | 90.0 | ||||||||||||||||||||
| 19 Presidential Way | 144,892 | — | — | 144,892 | 1 | 4,311 | 80.5 | 80.5 | ||||||||||||||||||||
| 100 Beaver Street | 82,330 | — | — | 82,330 | 1 | 3,149 | 100.0 | 100.0 | ||||||||||||||||||||
| 285 Bear Hill Road | 26,270 | — | — | 26,270 | 1 | 1,167 | 100.0 | 100.0 | ||||||||||||||||||||
| Route 128 | 883,133 | — | 31,858 | 914,991 | 14 | 31,417 | 95.1 | 91.8 | ||||||||||||||||||||
| Route 495 | �� | |||||||||||||||||||||||||||
| 111 and 130 Forbes Boulevard | 155,846 | — | — | 155,846 | 2 | 1,543 | 100.0 | 100.0 | ||||||||||||||||||||
| 20 Walkup Drive | 91,045 | — | — | 91,045 | 1 | 649 | 100.0 | 100.0 | ||||||||||||||||||||
| 30 Bearfoot Road | 60,759 | — | — | 60,759 | 1 | 2,765 | 100.0 | 100.0 | ||||||||||||||||||||
| Route 495 | 307,650 | — | — | 307,650 | 4 | 4,957 | 100.0 | 100.0 | ||||||||||||||||||||
| Greater Boston | 6,237,599 | 164,000 | 31,858 | 6,433,457 | 54 | $ | 359,063 | 95.7 | % | 95.2 | % | |||||||||||||||||
| Property Listing (continued) | |
| March 31, 2018 | |
| (Dollars in thousands) | |
Market / Submarket / Address | RSF | Number of Properties | Annual Rental Revenue | Occupancy Percentage | ||||||||||||||||||||||||
| Operating | Operating and Redevelopment | |||||||||||||||||||||||||||
| Operating | Development | Redevelopment | Total | |||||||||||||||||||||||||
| San Francisco | ||||||||||||||||||||||||||||
| Mission Bay/SoMa | ||||||||||||||||||||||||||||
| 409 and 499 Illinois Street (consolidated joint venture – 60% ownership) | 455,069 | — | — | 455,069 | 2 | $ | 28,677 | 100.0 | % | 100.0 | % | |||||||||||||||||
| 1455 and 1515 Third Street | 422,980 | — | — | 422,980 | 2 | 22,162 | 100.0 | 100.0 | ||||||||||||||||||||
| 1655 and 1725 Third Street (unconsolidated joint venture – 10% ownership) | — | 593,765 | — | 593,765 | 2 | — | N/A | N/A | ||||||||||||||||||||
| 510 Townsend Street | 295,333 | — | — | 295,333 | 1 | 17,822 | 100.0 | 100.0 | ||||||||||||||||||||
| 88 Bluxome Street | 232,470 | — | — | 232,470 | 1 | 3,813 | 100.0 | 100.0 | ||||||||||||||||||||
| 455 Mission Bay Boulevard South | 210,398 | — | — | 210,398 | 1 | 12,678 | 100.0 | 100.0 | ||||||||||||||||||||
| 1500 Owens Street (consolidated joint venture – 50.1% ownership) | 158,267 | — | — | 158,267 | 1 | 7,681 | 100.0 | 100.0 | ||||||||||||||||||||
| 1700 Owens Street | 157,340 | — | — | 157,340 | 1 | 10,971 | 100.0 | 100.0 | ||||||||||||||||||||
| 505 Brannan Street (consolidated joint venture – 99.7% ownership) | 148,146 | — | — | 148,146 | 1 | 12,103 | 100.0 | 100.0 | ||||||||||||||||||||
| Mission Bay/SoMa | 2,080,003 | 593,765 | — | 2,673,768 | 12 | 115,907 | 100.0 | 100.0 | ||||||||||||||||||||
| South San Francisco | ||||||||||||||||||||||||||||
| 213, 249, 259, 269, and 279 East Grand Avenue | 407,369 | 512,335 | — | 919,704 | 5 | 16,838 | 100.0 | 100.0 | ||||||||||||||||||||
Alexandria Technology Center® – Gateway | 619,037 | — | — | 619,037 | 7 | 28,725 | 99.1 | 99.1 | ||||||||||||||||||||
| 600, 630, 650, 681, 701, 901, and 951 Gateway Boulevard | ||||||||||||||||||||||||||||
| 400 and 450 East Jamie Court | 163,035 | — | — | 163,035 | 2 | 6,519 | 100.0 | 100.0 | ||||||||||||||||||||
| 500 Forbes Boulevard | 155,685 | — | — | 155,685 | 1 | 6,619 | 100.0 | 100.0 | ||||||||||||||||||||
| 7000 Shoreline Court | 136,395 | — | — | 136,395 | 1 | 5,433 | 100.0 | 100.0 | ||||||||||||||||||||
| 341 and 343 Oyster Point Boulevard | 107,960 | — | — | 107,960 | 2 | 4,479 | 100.0 | 100.0 | ||||||||||||||||||||
| 849/863 Mitten Road/866 Malcolm Road | 103,857 | — | — | 103,857 | 1 | 3,601 | 100.0 | 100.0 | ||||||||||||||||||||
| South San Francisco | 1,693,338 | 512,335 | — | 2,205,673 | 19 | 72,214 | 99.7 | 99.7 | ||||||||||||||||||||
| Greater Stanford | ||||||||||||||||||||||||||||
Menlo Gateway (unconsolidated joint venture)(1) | 251,995 | 520,988 | — | 772,983 | 3 | 4,718 | 100.0 | 100.0 | ||||||||||||||||||||
| 100 Independence Drive and 125 and 135 Constitution Drive | ||||||||||||||||||||||||||||
| Alexandria PARC | 152,383 | — | 45,115 | 197,498 | 4 | 8,412 | 100.0 | 77.2 | ||||||||||||||||||||
| 2100, 2200, 2300, and 2400 Geng Road | ||||||||||||||||||||||||||||
| 960 Industrial Road | 195,000 | — | — | 195,000 | 1 | 4,875 | 100.0 | 100.0 | ||||||||||||||||||||
| 2425 Garcia Avenue/2400/2450 Bayshore Parkway | 99,208 | — | — | 99,208 | 1 | 4,257 | 100.0 | 100.0 | ||||||||||||||||||||
| 3165 Porter Drive | 91,644 | — | — | 91,644 | 1 | 3,885 | 100.0 | 100.0 | ||||||||||||||||||||
| 1450 Page Mill Road | 77,634 | — | — | 77,634 | 1 | 8,009 | 100.0 | 100.0 | ||||||||||||||||||||
| 3350 West Bayshore Road | 60,000 | — | — | 60,000 | 1 | 2,211 | 100.0 | 100.0 | ||||||||||||||||||||
| 2625/2627/2631 Hanover Street | 32,074 | — | — | 32,074 | 1 | 1,753 | 100.0 | 100.0 | ||||||||||||||||||||
| Greater Stanford | 959,938 | 520,988 | 45,115 | 1,526,041 | 13 | 38,120 | 100.0 | 95.5 | ||||||||||||||||||||
| San Francisco | 4,733,279 | 1,627,088 | 45,115 | 6,405,482 | 44 | 226,241 | 99.9 | 98.9 | ||||||||||||||||||||
| New York City | ||||||||||||||||||||||||||||
| Manhattan | ||||||||||||||||||||||||||||
Alexandria Center® for Life Science – New York City | 727,674 | — | — | 727,674 | 2 | 63,555 | 100.0 | 100.0 | ||||||||||||||||||||
| 430 and 450 East 29th Street | ||||||||||||||||||||||||||||
| New York City | 727,674 | — | — | 727,674 | 2 | $ | 63,555 | 100.0 | % | 100.0 | % | |||||||||||||||||
| (1) | See page 42 of our Supplemental Information for additional information. | |||||||||||||||||||||||||||
| Property Listing (continued) | |
| March 31, 2018 | |
| (Dollars in thousands) | |
Market / Submarket / Address | RSF | Number of Properties | Annual Rental Revenue | Occupancy Percentage | ||||||||||||||||||||||||
| Operating | Operating and Redevelopment | |||||||||||||||||||||||||||
| Operating | Development | Redevelopment | Total | |||||||||||||||||||||||||
| San Diego | ||||||||||||||||||||||||||||
| Torrey Pines | ||||||||||||||||||||||||||||
| ARE Spectrum | 336,461 | — | — | 336,461 | 3 | $ | 17,502 | 100.0 | % | 100.0 | % | |||||||||||||||||
| 3215 Merryfield Row and 3013 and 3033 Science Park Road | ||||||||||||||||||||||||||||
| ARE Torrey Ridge | 294,993 | — | — | 294,993 | 3 | 13,005 | 86.9 | 86.9 | ||||||||||||||||||||
| 10578, 10614, and 10628 Science Center Drive | ||||||||||||||||||||||||||||
| ARE Sunrise | 236,635 | — | — | 236,635 | 3 | 8,790 | 99.8 | 99.8 | ||||||||||||||||||||
10931/10933 and 10975 North Torrey Pines Road, 3010 Science Park Road, and 10996 Torreyana Road | ||||||||||||||||||||||||||||
| ARE Nautilus | 223,751 | — | — | 223,751 | 4 | 8,878 | 88.9 | 88.9 | ||||||||||||||||||||
| 3530 and 3550 John Hopkins Court and 3535 and 3565 General Atomics Court | ||||||||||||||||||||||||||||
| 3545 Cray Court | 116,556 | — | — | 116,556 | 1 | 4,827 | 100.0 | 100.0 | ||||||||||||||||||||
| 11119 North Torrey Pines Road | 72,506 | — | — | 72,506 | 1 | 3,409 | 100.0 | 100.0 | ||||||||||||||||||||
| Torrey Pines | 1,280,902 | — | — | 1,280,902 | 15 | 56,411 | 95.0 | 95.0 | ||||||||||||||||||||
| University Town Center | ||||||||||||||||||||||||||||
| Campus Pointe by Alexandria | ||||||||||||||||||||||||||||
| 10290 and 10300 Campus Point Drive and 4110 Campus Point Court (consolidated joint venture – 55% ownership) | 798,799 | — | — | 798,799 | 3 | 32,236 | 95.7 | 95.7 | ||||||||||||||||||||
| 5200 Illumina Way | 792,687 | — | — | 792,687 | 6 | 28,795 | 100.0 | 100.0 | ||||||||||||||||||||
| ARE Towne Centre | ||||||||||||||||||||||||||||
9625 Towne Centre Drive (consolidated joint venture)(1) | — | — | 163,648 | 163,648 | 1 | — | N/A | — | ||||||||||||||||||||
| 9363, 9373, and 9393 Towne Centre Drive | 140,398 | — | — | 140,398 | 3 | 3,164 | 90.9 | 90.9 | ||||||||||||||||||||
| ARE Esplanade | 241,963 | — | — | 241,963 | 4 | 10,036 | 100.0 | 100.0 | ||||||||||||||||||||
| 4755, 4757, and 4767 Nexus Center Drive and 4796 Executive Drive | ||||||||||||||||||||||||||||
| University Town Center | 1,973,847 | — | 163,648 | 2,137,495 | 17 | 74,231 | 97.6 | 90.1 | ||||||||||||||||||||
| Sorrento Mesa | ||||||||||||||||||||||||||||
| Summers Ridge Science Park | 316,531 | — | — | 316,531 | 4 | 10,843 | 100.0 | 100.0 | ||||||||||||||||||||
| 9965, 9975, 9985, and 9995 Summers Ridge Road | ||||||||||||||||||||||||||||
| 5810/5820 and 6138/6150 Nancy Ridge Drive | 138,970 | — | — | 138,970 | 2 | 3,950 | 100.0 | 100.0 | ||||||||||||||||||||
10121 and 10151 Barnes Canyon Road | 102,392 | — | — | 102,392 | 2 | 2,691 | 100.0 | 100.0 | ||||||||||||||||||||
| ARE Portola | 101,857 | — | — | 101,857 | 3 | 2,057 | 71.7 | 71.7 | ||||||||||||||||||||
| 6175, 6225, and 6275 Nancy Ridge Drive | ||||||||||||||||||||||||||||
| 7330 Carroll Road | 66,244 | — | — | 66,244 | 1 | 2,431 | 100.0 | 100.0 | ||||||||||||||||||||
| 5871 Oberlin Drive | 33,817 | — | — | 33,817 | 1 | 832 | 86.8 | 86.8 | ||||||||||||||||||||
| Sorrento Mesa | 759,811 | — | — | 759,811 | 13 | 22,804 | 95.6 | 95.6 | ||||||||||||||||||||
| Sorrento Valley | ||||||||||||||||||||||||||||
| 11025, 11035, 11045, 11055, 11065, and 11075 Roselle Street | 121,655 | — | — | 121,655 | 6 | 2,223 | 74.6 | 74.6 | ||||||||||||||||||||
| 3985, 4025, 4031, and 4045 Sorrento Valley Boulevard | 103,111 | �� | — | — | 103,111 | 4 | 1,979 | 68.0 | 68.0 | |||||||||||||||||||
| Sorrento Valley | 224,766 | — | — | 224,766 | 10 | 4,202 | 71.6 | 71.6 | ||||||||||||||||||||
| I-15 Corridor | ||||||||||||||||||||||||||||
| 13112 Evening Creek Drive | 109,780 | — | — | 109,780 | 1 | 2,972 | 100.0 | 100.0 | ||||||||||||||||||||
| San Diego | 4,349,106 | — | 163,648 | 4,512,754 | 56 | $ | 160,620 | 95.2 | % | 91.7 | % | |||||||||||||||||
| (1) | See page 42 of this Supplemental Information for additional information. | |||||||||||||||||||||||||||
| Property Listing (continued) | |
| March 31, 2018 | |
| (Dollars in thousands) | |
Market / Submarket / Address | RSF | Number of Properties | Annual Rental Revenue | Occupancy Percentage | ||||||||||||||||||||||||
| Operating | Operating and Redevelopment | |||||||||||||||||||||||||||
| Operating | Development | Redevelopment | Total | |||||||||||||||||||||||||
| Seattle | ||||||||||||||||||||||||||||
| Lake Union | ||||||||||||||||||||||||||||
| 400 Dexter Avenue North | 290,111 | — | — | 290,111 | 1 | $ | 15,195 | 100.0 | % | 100.0 | % | |||||||||||||||||
| 1201 and 1208 Eastlake Avenue East | 203,369 | — | — | 203,369 | 2 | 8,748 | 100.0 | 100.0 | ||||||||||||||||||||
| 1616 Eastlake Avenue East | 168,708 | — | — | 168,708 | 1 | 8,294 | 94.0 | 94.0 | ||||||||||||||||||||
| 1551 Eastlake Avenue East | 117,482 | — | — | 117,482 | 1 | 4,828 | 100.0 | 100.0 | ||||||||||||||||||||
| 199 East Blaine Street | 115,084 | — | — | 115,084 | 1 | 6,197 | 100.0 | 100.0 | ||||||||||||||||||||
| 219 Terry Avenue North | 30,705 | — | — | 30,705 | 1 | 1,856 | 100.0 | 100.0 | ||||||||||||||||||||
| 1600 Fairview Avenue East | 27,991 | — | — | 27,991 | 1 | 1,124 | 100.0 | 100.0 | ||||||||||||||||||||
| Lake Union | 953,450 | — | — | 953,450 | 8 | 46,242 | 98.9 | 98.9 | ||||||||||||||||||||
| Elliott Bay | ||||||||||||||||||||||||||||
| 3000/3018 Western Avenue | 47,746 | — | — | 47,746 | 1 | 1,839 | 100.0 | 100.0 | ||||||||||||||||||||
| 410 West Harrison Street and 410 Elliott Avenue West | 36,724 | — | — | 36,724 | 2 | 449 | 32.1 | 32.1 | ||||||||||||||||||||
| Elliott Bay | 84,470 | — | — | 84,470 | 3 | 2,288 | 70.5 | 70.5 | ||||||||||||||||||||
| Seattle | 1,037,920 | — | — | 1,037,920 | 11 | 48,530 | 96.6 | 96.6 | ||||||||||||||||||||
| Maryland | ||||||||||||||||||||||||||||
| Rockville | ||||||||||||||||||||||||||||
| 9800, 9900, and 9920 Medical Center Drive | 341,169 | — | 45,039 | 386,208 | 6 | 13,214 | 100.0 | 88.3 | ||||||||||||||||||||
| 1330 Piccard Drive | 131,511 | — | — | 131,511 | 1 | 3,537 | 100.0 | 100.0 | ||||||||||||||||||||
| 1500 and 1550 East Gude Drive | 90,489 | — | — | 90,489 | 2 | 1,681 | 100.0 | 100.0 | ||||||||||||||||||||
| 14920 and 15010 Broschart Road | 86,703 | — | — | 86,703 | 2 | 2,045 | 91.9 | 91.9 | ||||||||||||||||||||
| 1405 Research Boulevard | 71,669 | — | — | 71,669 | 1 | 2,310 | 100.0 | 100.0 | ||||||||||||||||||||
| 5 Research Place | 63,852 | — | — | 63,852 | 1 | 2,396 | 100.0 | 100.0 | ||||||||||||||||||||
| 12301 Parklawn Drive | 49,185 | — | — | 49,185 | 1 | 1,329 | 100.0 | 100.0 | ||||||||||||||||||||
| 5 Research Court | 49,160 | — | — | 49,160 | 1 | — | — | — | ||||||||||||||||||||
| Rockville | 883,738 | — | 45,039 | 928,777 | 15 | 26,512 | 93.6 | 89.1 | ||||||||||||||||||||
| Gaithersburg | ||||||||||||||||||||||||||||
Alexandria Technology Center® – Gaithersburg I | 377,401 | — | — | 377,401 | 4 | 8,093 | 91.1 | 91.1 | ||||||||||||||||||||
| 9 West Watkins Mill Road and 910, 930, and 940 Clopper Road | ||||||||||||||||||||||||||||
Alexandria Technology Center® – Gaithersburg II | ||||||||||||||||||||||||||||
708 Quince Orchard Road, 1300 Quince Orchard Boulevard, and 19, 20, and 22 Firstfield Road | 237,137 | — | — | 237,137 | 5 | 6,299 | 100.0 | 100.0 | ||||||||||||||||||||
| 704 Quince Orchard Road (unconsolidated joint venture – 56.8% ownership) | 21,745 | — | 58,186 | 79,931 | 1 | 306 | 100.0 | 27.2 | ||||||||||||||||||||
| 401 Professional Drive | 63,154 | — | — | 63,154 | 1 | 1,509 | 100.0 | 100.0 | ||||||||||||||||||||
| 950 Wind River Lane | 50,000 | — | — | 50,000 | 1 | 1,082 | 100.0 | 100.0 | ||||||||||||||||||||
| 620 Professional Drive | 27,950 | — | — | 27,950 | 1 | 1,191 | 100.0 | 100.0 | ||||||||||||||||||||
| Gaithersburg | 777,387 | — | 58,186 | 835,573 | 13 | 18,480 | 95.7 | 89.0 | ||||||||||||||||||||
| Beltsville | ||||||||||||||||||||||||||||
| 8000/9000/10000 Virginia Manor Road | 191,884 | — | — | 191,884 | 1 | 2,503 | 100.0 | 100.0 | ||||||||||||||||||||
| Northern Virginia | ||||||||||||||||||||||||||||
| 14225 Newbrook Drive | 248,186 | — | — | 248,186 | 1 | 5,138 | 100.0 | 100.0 | ||||||||||||||||||||
| Maryland | 2,101,195 | — | 103,225 | 2,204,420 | 30 | $ | 52,633 | 95.7 | % | 91.2 | % | |||||||||||||||||
| Property Listing (continued) | |
| March 31, 2018 | |
| (Dollars in thousands) | |
Market / Submarket / Address | RSF | Number of Properties | Annual Rental Revenue | Occupancy Percentage | ||||||||||||||||||||||||
| Operating | Operating and Redevelopment | |||||||||||||||||||||||||||
| Operating | Development | Redevelopment | Total | |||||||||||||||||||||||||
| Research Triangle Park | ||||||||||||||||||||||||||||
| Research Triangle Park | ||||||||||||||||||||||||||||
Alexandria Technology Center® – Alston | 186,870 | — | — | 186,870 | 3 | $ | 3,529 | 95.6 | % | 95.6 | % | |||||||||||||||||
| 100, 800, and 801 Capitola Drive | ||||||||||||||||||||||||||||
Alexandria Center® for AgTech – RTP | — | — | 175,000 | 175,000 | 1 | — | N/A | — | ||||||||||||||||||||
| 5 Laboratory Drive | ||||||||||||||||||||||||||||
| 108/110/112/114 TW Alexander Drive | 158,417 | — | — | 158,417 | 1 | 4,607 | 100.0 | 100.0 | ||||||||||||||||||||
Alexandria Innovation Center® – Research Triangle Park | 135,677 | — | — | 135,677 | 3 | 3,210 | 95.8 | 95.8 | ||||||||||||||||||||
| 7010, 7020, and 7030 Kit Creek Road | ||||||||||||||||||||||||||||
| 6 Davis Drive | 100,000 | — | — | 100,000 | 1 | 1,726 | 95.0 | 95.0 | ||||||||||||||||||||
| 7 Triangle Drive | 96,626 | — | — | 96,626 | 1 | 3,156 | 100.0 | 100.0 | ||||||||||||||||||||
| 2525 East NC Highway 54 | 82,996 | — | — | 82,996 | 1 | 3,680 | 100.0 | 100.0 | ||||||||||||||||||||
| 407 Davis Drive | 81,956 | — | — | 81,956 | 1 | 1,644 | 100.0 | 100.0 | ||||||||||||||||||||
| 601 Keystone Park Drive | 77,395 | — | — | 77,395 | 1 | 1,379 | 100.0 | 100.0 | ||||||||||||||||||||
| 6040 George Watts Hill Drive | 61,547 | — | — | 61,547 | 1 | 2,148 | 100.0 | 100.0 | ||||||||||||||||||||
| 5 Triangle Drive | 32,120 | — | — | 32,120 | 1 | 479 | 54.2 | 54.2 | ||||||||||||||||||||
| 6101 Quadrangle Drive | 30,122 | — | — | 30,122 | 1 | 539 | 100.0 | 100.0 | ||||||||||||||||||||
| Research Triangle Park | 1,043,726 | — | 175,000 | 1,218,726 | 16 | 26,097 | 96.8 | 82.9 | ||||||||||||||||||||
| Canada | 256,967 | — | — | 256,967 | 3 | 6,824 | 99.6 | 99.6 | ||||||||||||||||||||
| Non-cluster markets | 268,689 | — | — | 268,689 | 6 | 5,455 | 78.9 | 78.9 | ||||||||||||||||||||
| Total – North America | 20,756,155 | 1,791,088 | 518,846 | 23,066,089 | 222 | $ | 949,018 | 96.6 | % | 94.3 | % | |||||||||||||||||
| |
| Disciplined Management of Ground-Up Developments | |
| March 31, 2018 | |
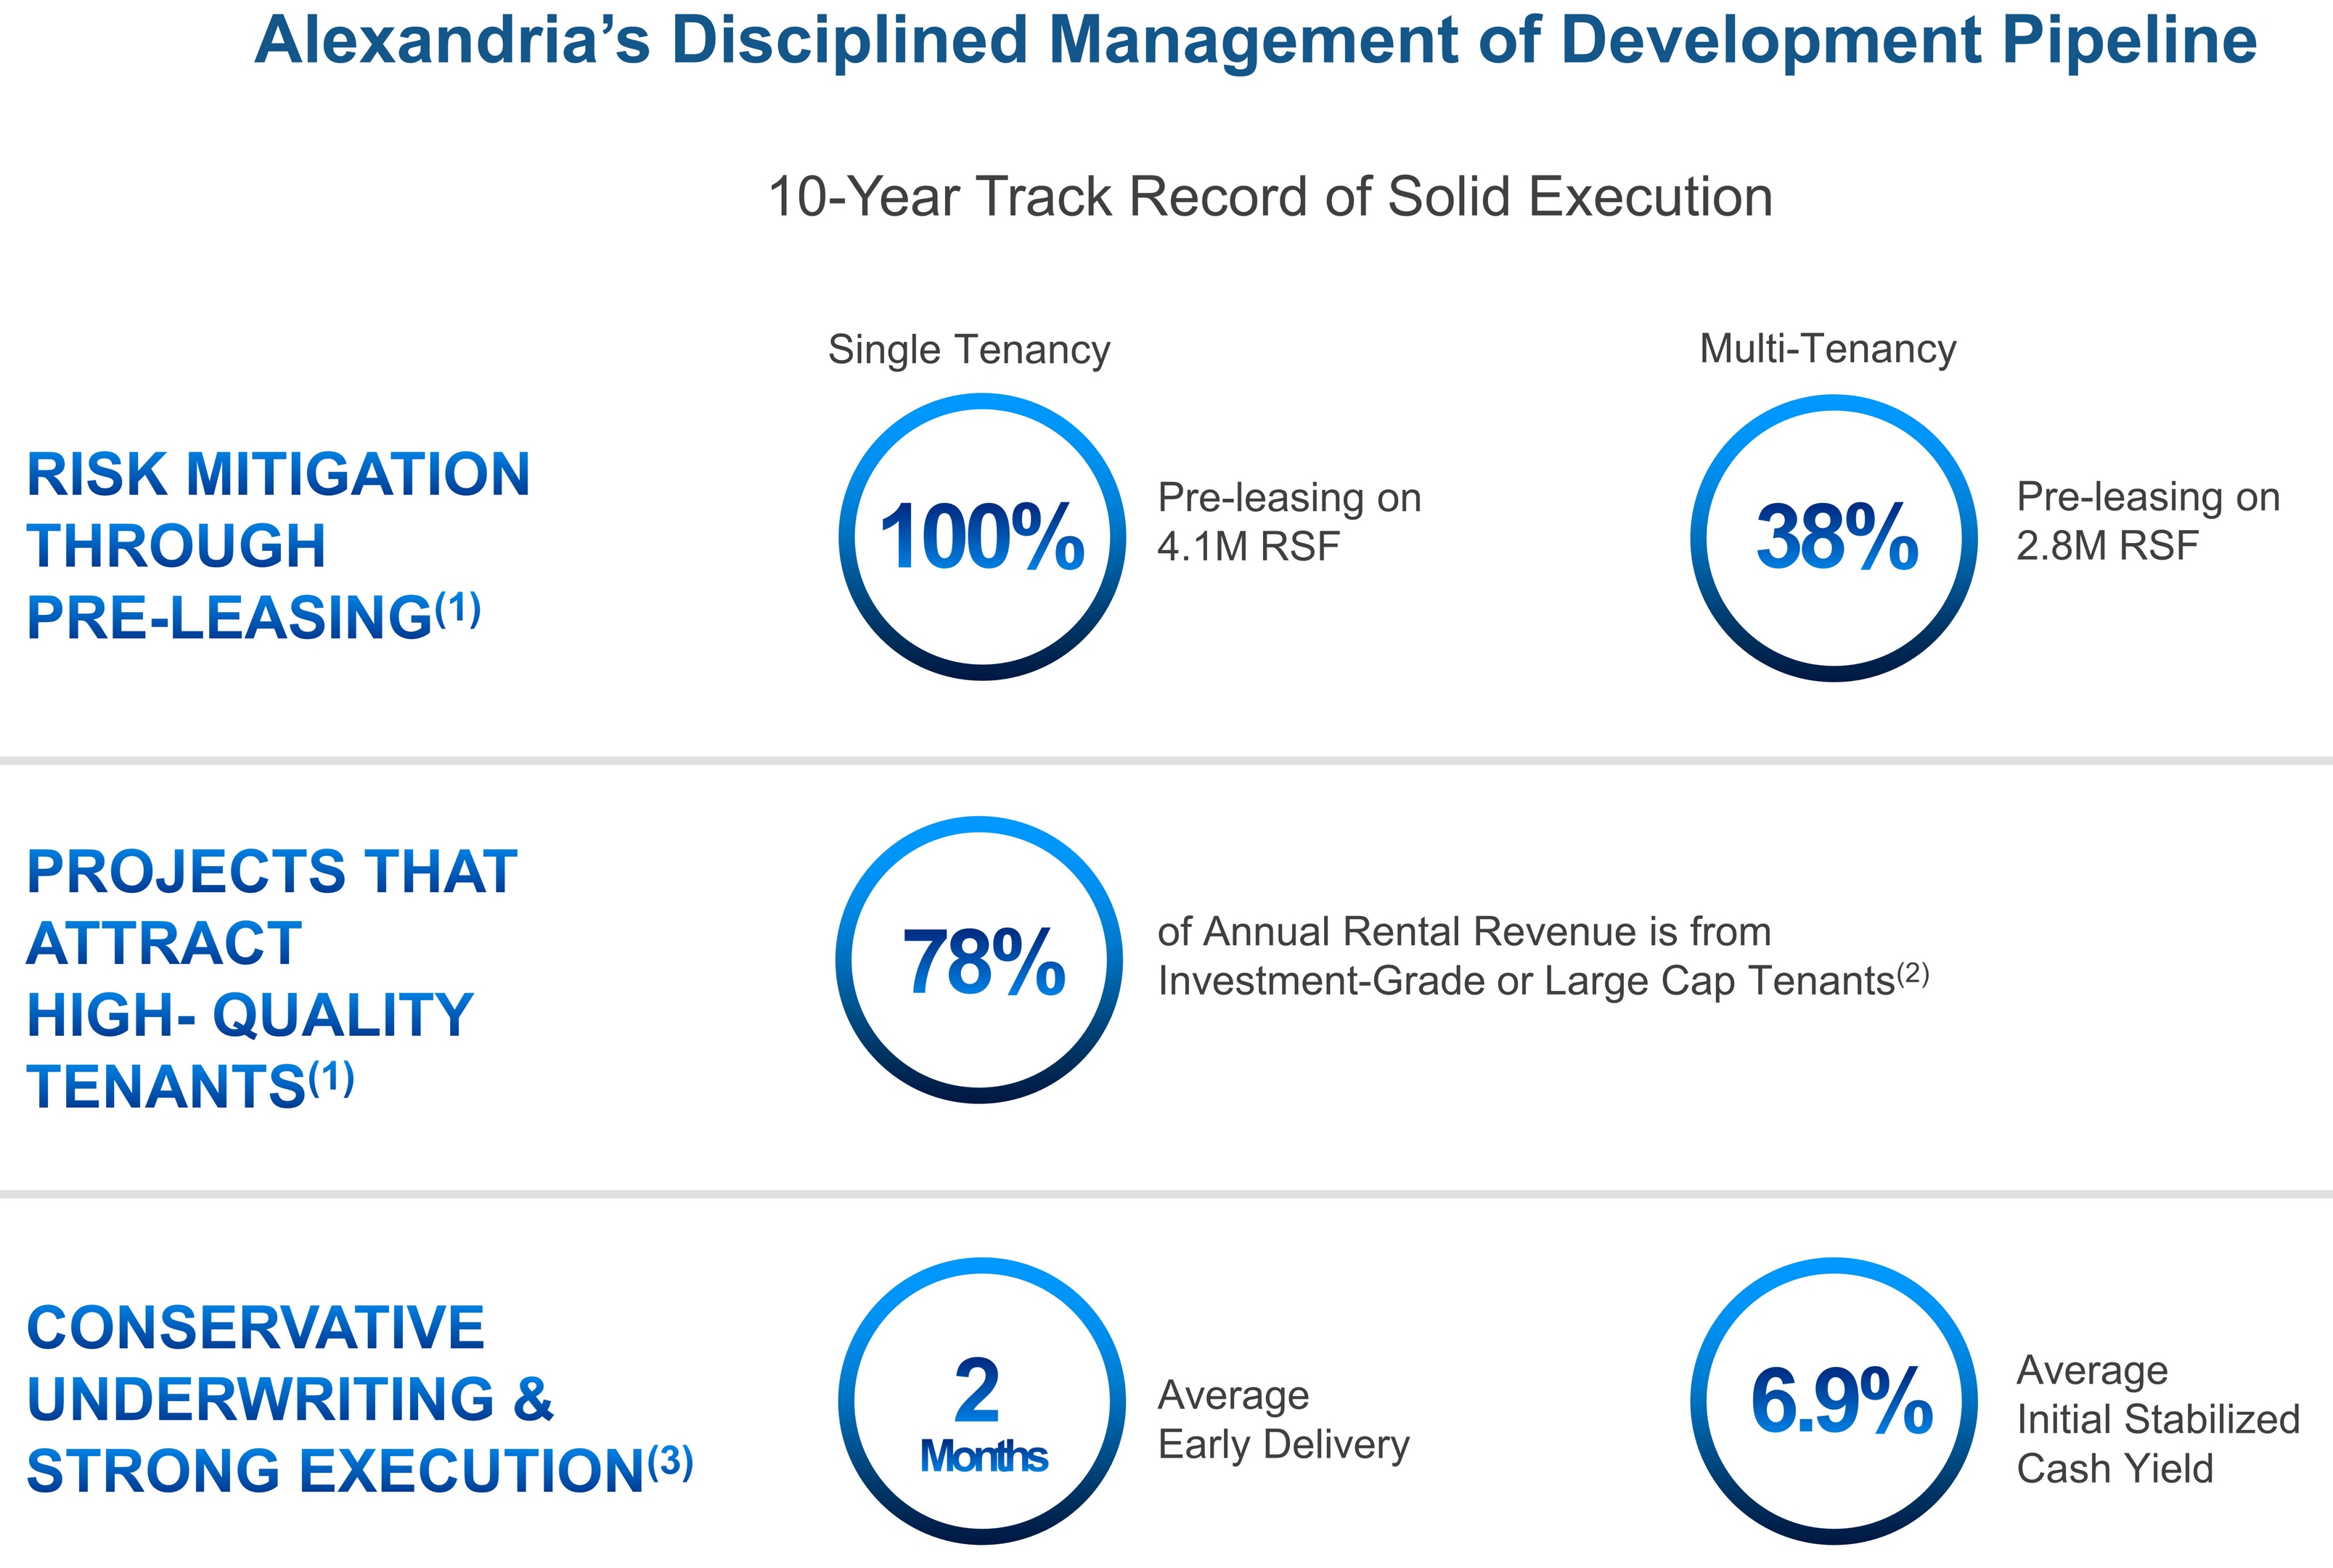
| (1) | Represents development commencements since January 1, 2008, comprised of 27 projects aggregating 6.9 million RSF. |
| (2) | Represents annualized rental revenue on ground-up developments commenced since January 1, 2008, from investment-grade rated tenants and/or tenants with market capitalization or private valuation greater than $10 billion as of 1Q18. See “Definitions and Reconciliations” in our Supplemental Information for additional information |
| (3) | Represents developments commenced and delivered since January 1, 2008, comprising 22 projects aggregating 5.2 million RSF. |
| Investments in Real Estate | |
| March 31, 2018 | |
| (Dollars in thousands) | |
| Investments in Real Estate | Square Feet | ||||||||||||
| Consolidated | Unconsolidated(1) | Total | |||||||||||
| Investments in real estate: | |||||||||||||
| Rental properties | $ | 11,468,444 | 20,293,451 | 462,704 | 20,756,155 | ||||||||
| New Class A development and redevelopment properties: | |||||||||||||
| 2018 deliveries undergoing construction | 172,956 | 534,506 | — | 534,506 | |||||||||
| 2019 deliveries: | |||||||||||||
| Undergoing construction | 235,120 | 602,489 | 1,172,939 | 1,775,428 | |||||||||
| Undergoing pre-construction | 45,946 | 331,971 | — | 331,971 | |||||||||
| 2019 deliveries | 934,460 | 1,172,939 | 2,107,399 | ||||||||||
| 2020 deliveries undergoing pre-construction | 178,090 | 908,000 | — | 908,000 | |||||||||
| New Class A development and redevelopment properties undergoing construction and pre-construction | 632,112 | 2,376,966 | 1,172,939 | 3,549,905 | |||||||||
| Intermediate-term and future development projects: | |||||||||||||
| Intermediate-term development projects | 412,265 | 3,615,317 | — | 3,615,317 | |||||||||
| Future development projects | 96,813 | 2,873,081 | — | 2,873,081 | |||||||||
Portion of developable square feet that will replace existing RSF included in rental properties(2) | N/A | (554,441 | ) | — | (554,441 | ) | |||||||
| Intermediate-term and future development projects | 5,933,957 | — | 5,933,957 | ||||||||||
| Gross investments in real estate | 12,609,634 | 28,604,374 | 1,635,643 | 30,240,017 | |||||||||
| Less: accumulated depreciation | (1,969,084 | ) | |||||||||||
| Net investments in real estate – North America | 10,640,550 | ||||||||||||
| Net investments in real estate – Asia | 30,677 | ||||||||||||
| Investments in real estate | $ | 10,671,227 | |||||||||||
| (1) | Our share of the cost basis associated with unconsolidated square feet is classified in investments in unconsolidated real estate joint ventures in our consolidated balance sheets. |
| (2) | See footnote 1 on page 39. |
| New Class A Development and Redevelopment Properties: Placed into Service in the Last 12 Months | | |
| March 31, 2018 | ||
| 100 Binney Street | 266 and 275 Second Avenue | 510 Townsend Street | ||
| Greater Boston/Cambridge | Greater Boston/Route 128 | San Francisco/Mission Bay/SoMa | ||
| 432,931 RSF | 27,315 RSF | 295,333 RSF | ||
Bristol-Myers Squibb Company Facebook, Inc. | Visterra, Inc. | Stripe, Inc. | ||
 |  |  | ||
| 505 Brannan Street, Phase I | ARE Spectrum | 5200 Illumina Way, Parking Structure | 400 Dexter Avenue North | |||
| San Francisco/Mission Bay/SoMa | San Diego/Torrey Pines | San Diego/University Town Center | Seattle/Lake Union | |||
| 148,146 RSF | 336,461 RSF | N/A | 290,111 RSF | |||
| Pinterest, Inc. | The Medicines Company Celgene Corporation Wellspring Biosciences LLC Vertex Pharmaceuticals Incorporated | Illumina, Inc. | Juno Therapeutics, Inc. ClubCorp Holdings, Inc. | |||
 |  | 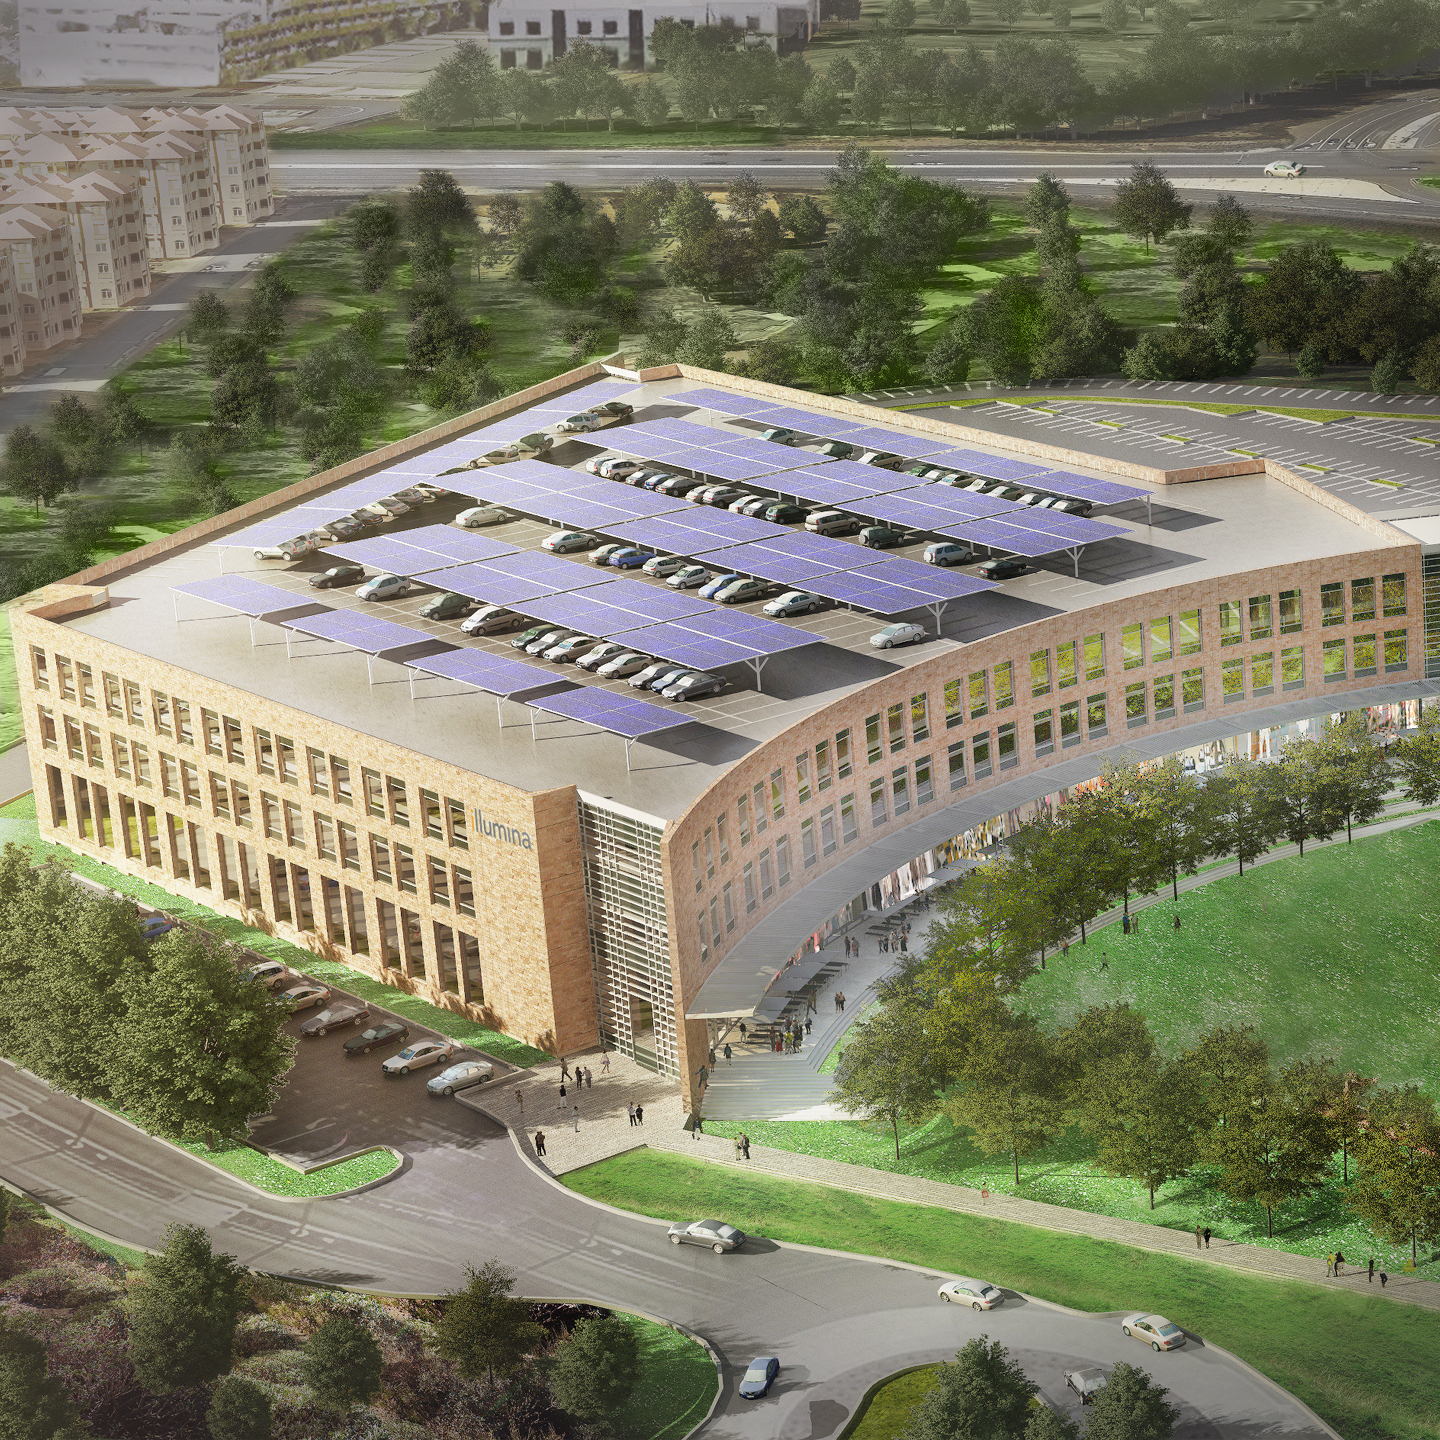 | 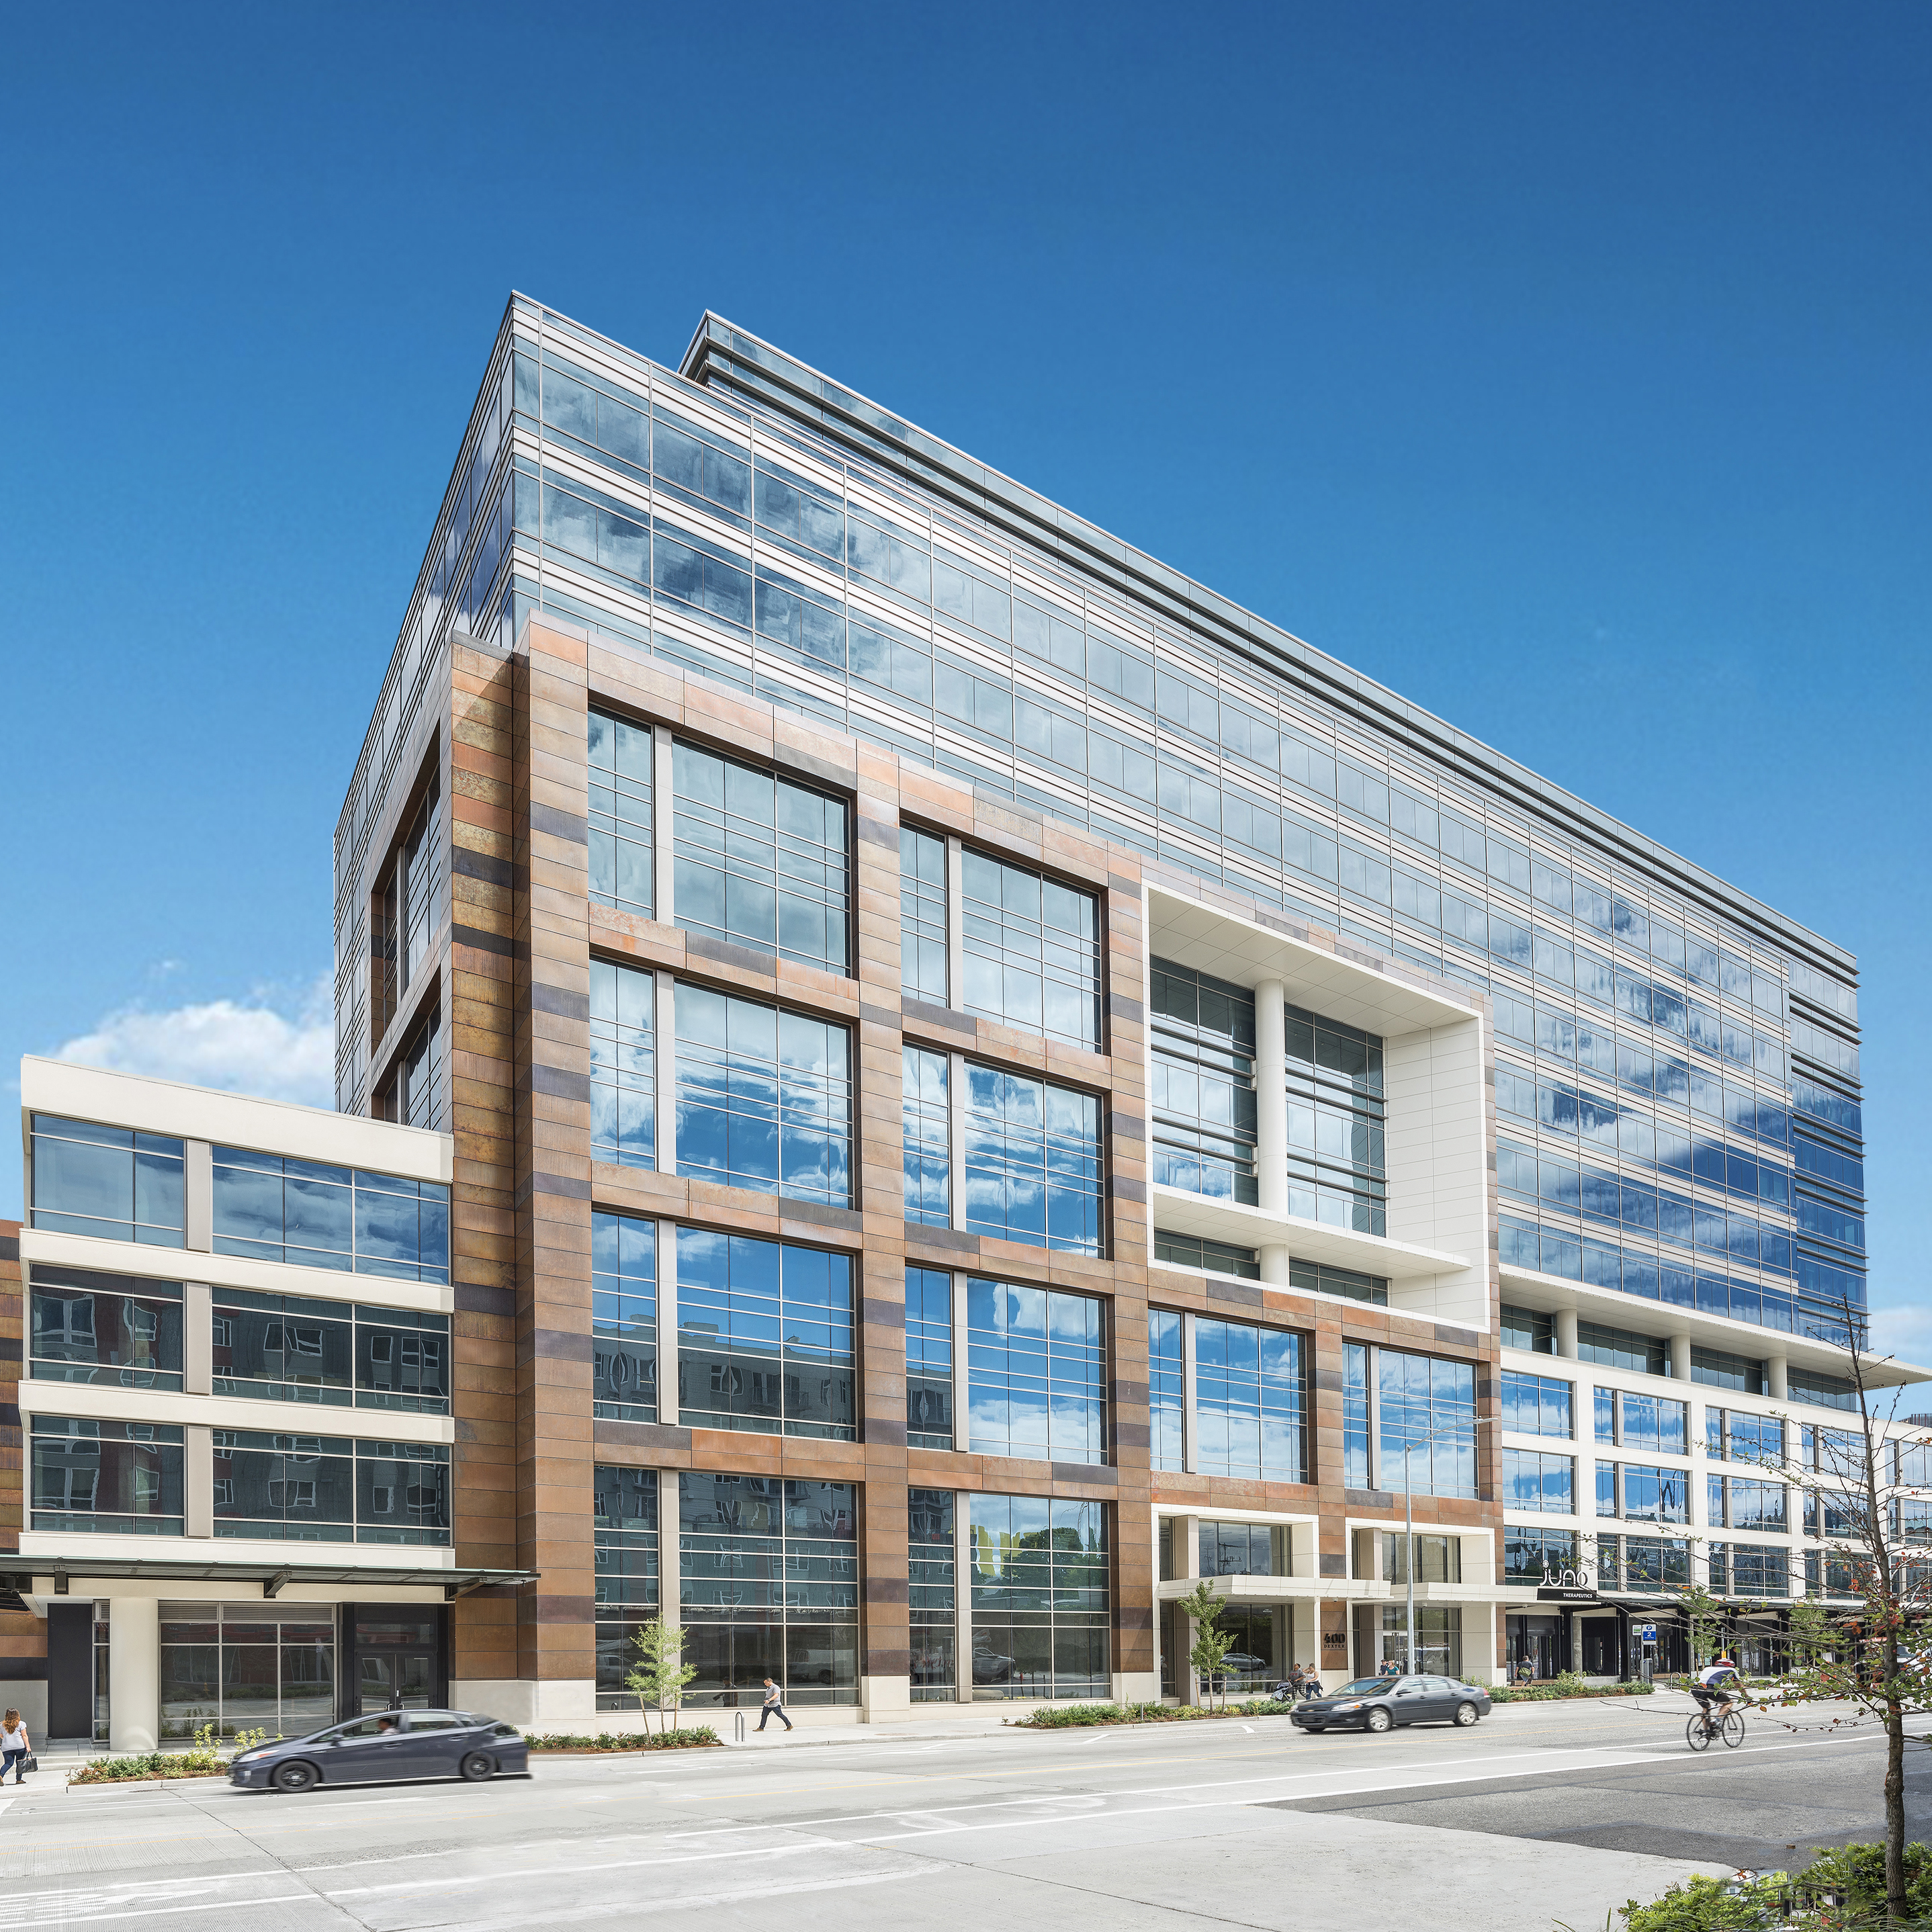 | |||
RSF represents the cumulative RSF placed into service in the last 12 months.
| New Class A Development and Redevelopment Properties: Placed into Service in the Last 12 Months (continued) | |
| March 31, 2018 | |
| (Dollars in thousands) | |
| Property/Market/Submarket | Our Ownership Interest | Date Delivered | RSF Placed into Service | Total Project | Unlevered Yields | |||||||||||||||||||||||||||||||||||||||
| Initial Stabilized | Initial Stabilized Cash Basis | |||||||||||||||||||||||||||||||||||||||||||
| Prior to 4/1/17 | 2Q17 | 3Q17 | 4Q17 | 1Q18 | Total | Leased | RSF | Investment | ||||||||||||||||||||||||||||||||||||
| Consolidated development projects | ||||||||||||||||||||||||||||||||||||||||||||
| 100 Binney Street/Greater Boston/Cambridge | 100% | Various | — | — | 341,776 | — | 91,155 | 432,931 | 100% | 432,931 | $ | 436,000 | 8.2 | % | 7.4 | % | ||||||||||||||||||||||||||||
510 Townsend Street/San Francisco/ Mission Bay/SoMa | 100% | 10/31/17 | — | — | — | 295,333 | — | 295,333 | 100% | 295,333 | $ | 226,000 | 7.9 | % | 7.5 | % | ||||||||||||||||||||||||||||
| 505 Brannan Street, Phase I/San Francisco/Mission Bay/SoMa | 99.7% | 10/10/17 | — | — | — | 148,146 | — | 148,146 | 100% | 148,146 | $ | 140,000 | 8.5 | % | 7.2 | % | ||||||||||||||||||||||||||||
| ARE Spectrum/San Diego/Torrey Pines | 100% | Various | 134,274 | 31,664 | — | 170,523 | — | 336,461 | 98% | 336,461 | $ | 277,000 | 6.4 | % | 6.2 | % | ||||||||||||||||||||||||||||
| 5200 Illumina Way, Parking Structure/San Diego/University Town Center | 100% | 5/15/17 | — | N/A | — | — | — | N/A | 100% | N/A | $ | 60,000 | 7.0 | % | 7.0 | % | ||||||||||||||||||||||||||||
| 400 Dexter Avenue North/Seattle/Lake Union | 100% | Various | 241,276 | — | 17,620 | 31,215 | — | 290,111 | 100% | 290,111 | $ | 223,000 | 7.0 | % | 7.1 | % | ||||||||||||||||||||||||||||
| Consolidated redevelopment project | ||||||||||||||||||||||||||||||||||||||||||||
| 266 and 275 Second Avenue/Greater Boston/Route 128 | 100% | 3/31/18 | — | — | — | — | 27,315 | 27,315 | 84% | 203,757 | $ | 89,000 | 8.4 | % | 7.1 | % | ||||||||||||||||||||||||||||
| Total | 375,550 | 31,664 | 359,396 | 645,217 | 118,470 | 1,530,297 | ||||||||||||||||||||||||||||||||||||||
| New Class A Development and Redevelopment Properties: 2018 – 2020 Deliveries | | |
| March 31, 2018 | ||
| 399 Binney Street | 266 and 275 Second Avenue | 1655 and 1725 Third Street | 213 East Grand Avenue | |||
| Greater Boston/Cambridge | Greater Boston/Route 128 | San Francisco/Mission Bay/SoMa | San Francisco/South San Francisco | |||
| 164,000 RSF | 31,858 RSF | 593,765 RSF | 300,930 RSF | |||
| Rubius Therapeutics, Inc. Relay Therapeutics, Inc. Celsius Therapeutics, Inc. Multi-Tenant/Negotiating | Marketing | Uber Technologies, Inc. | Merck & Co., Inc. | |||
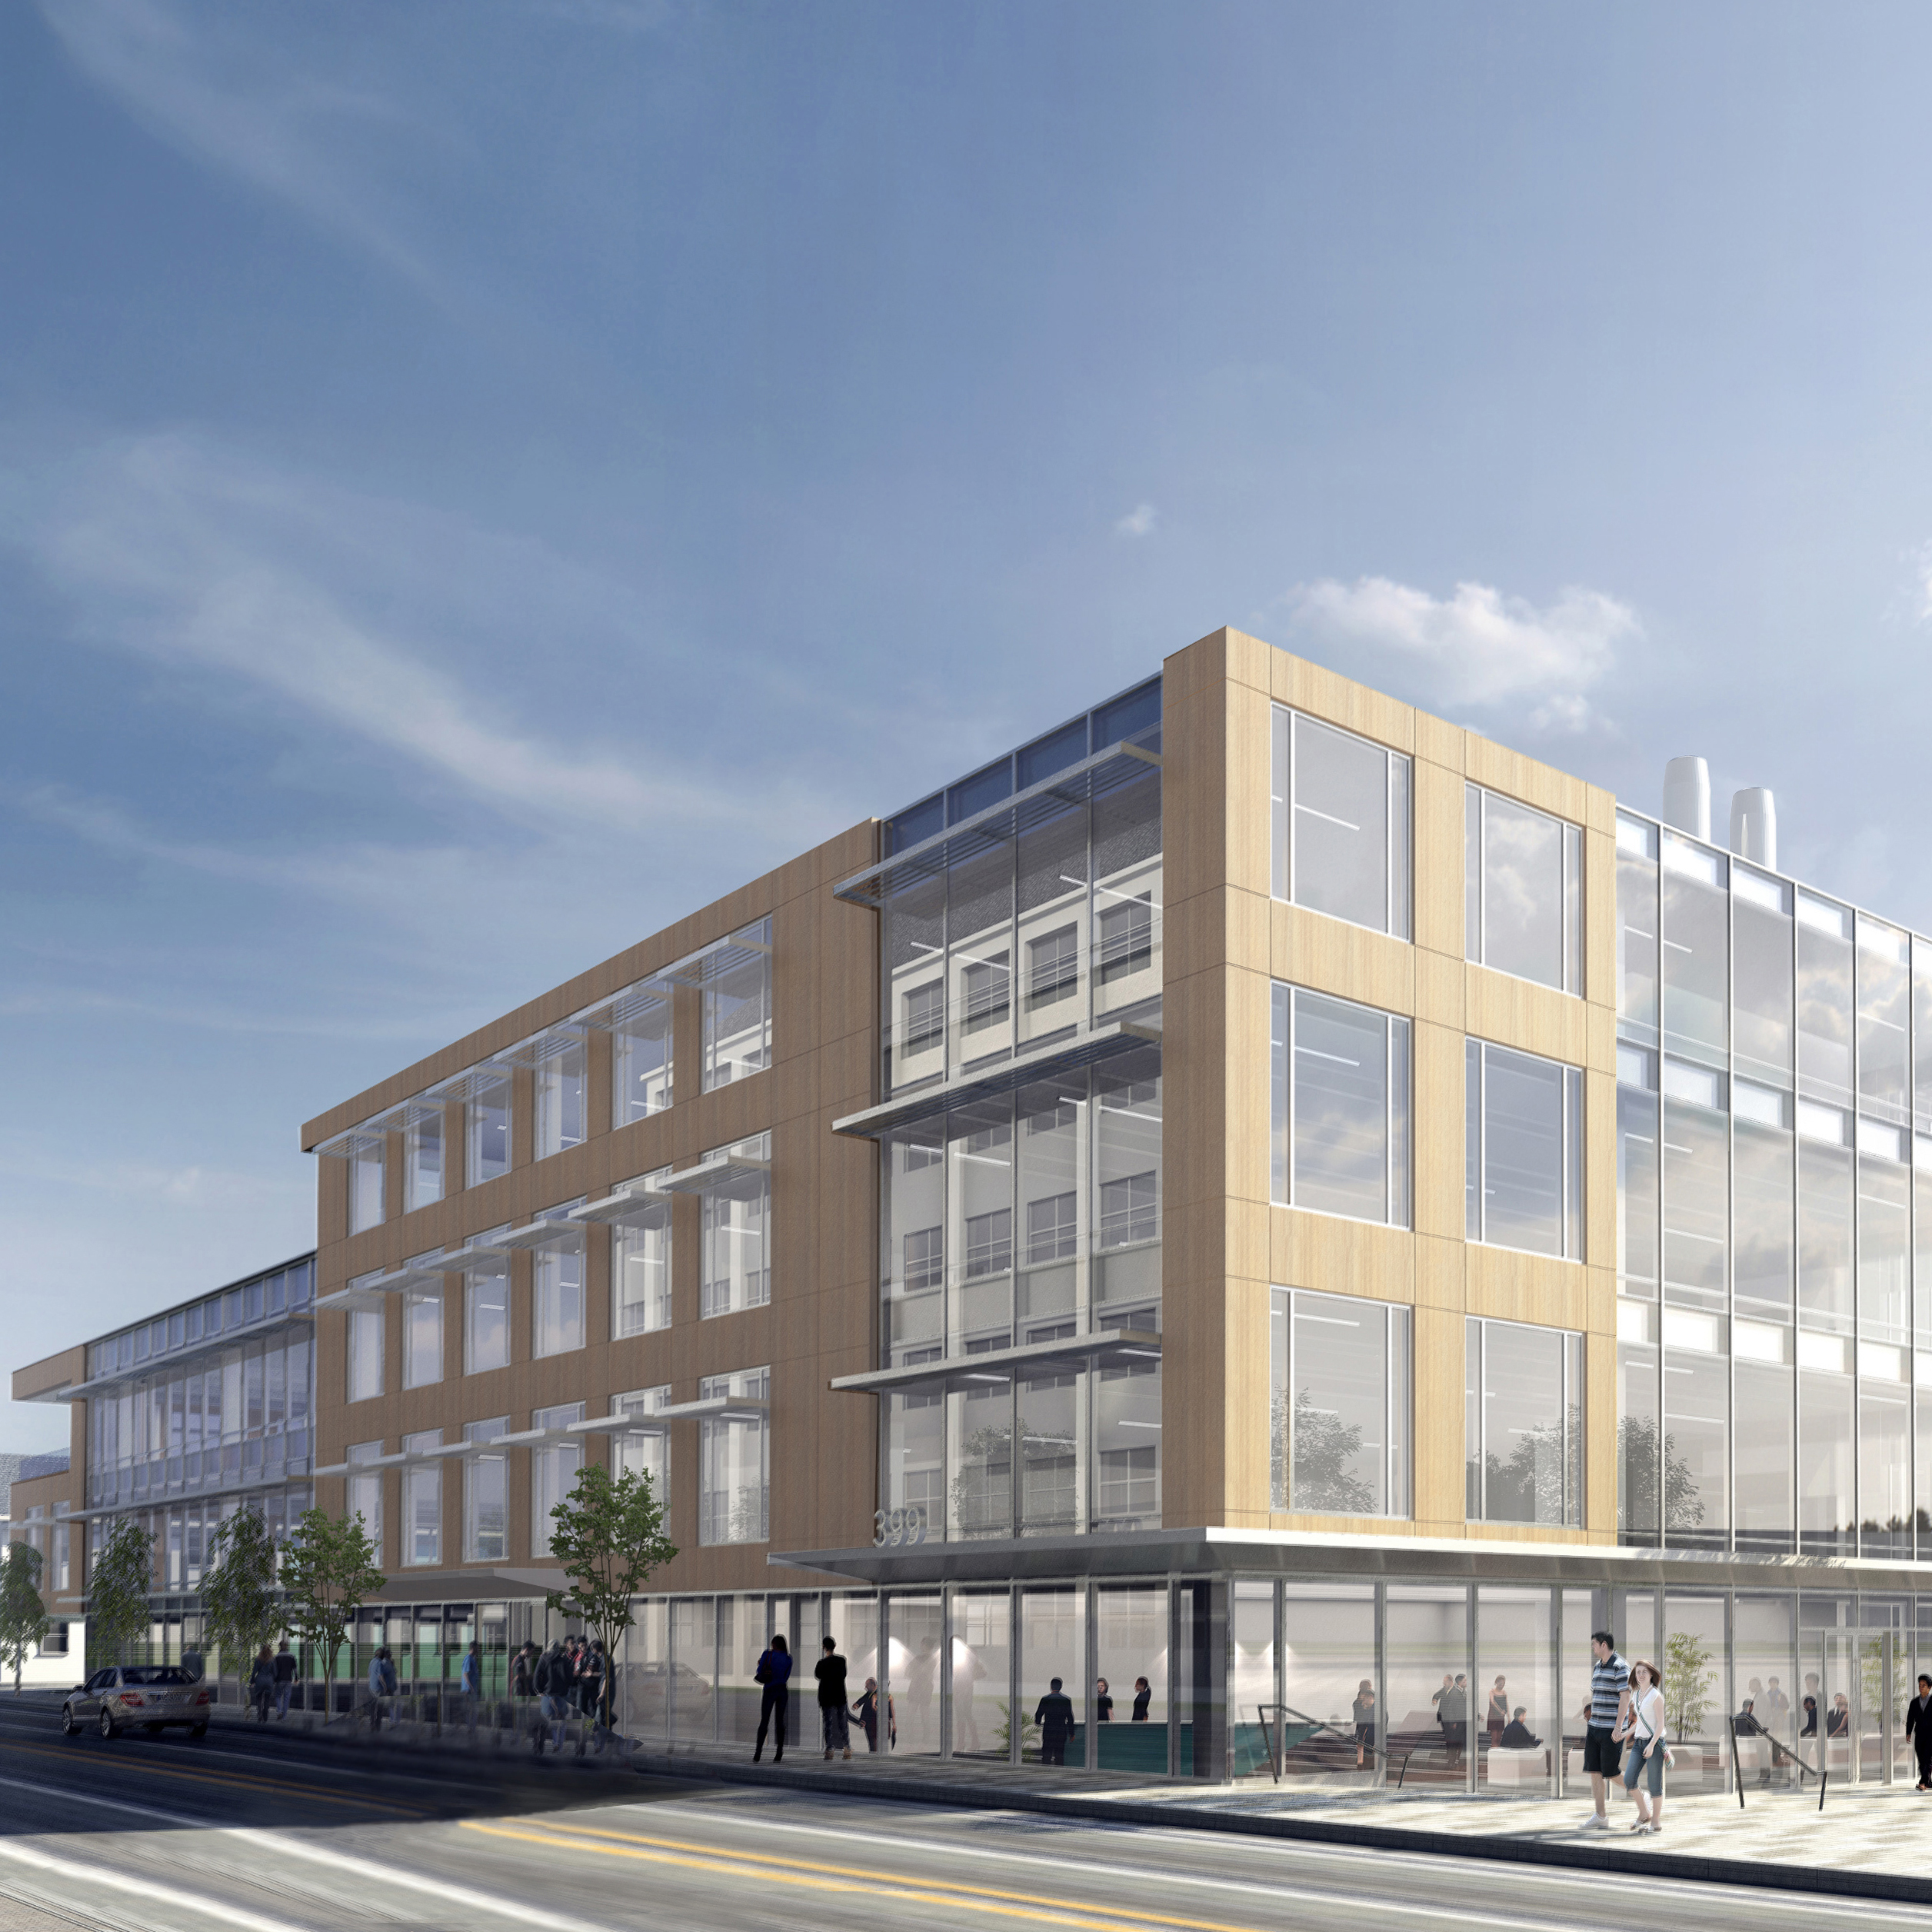 | | 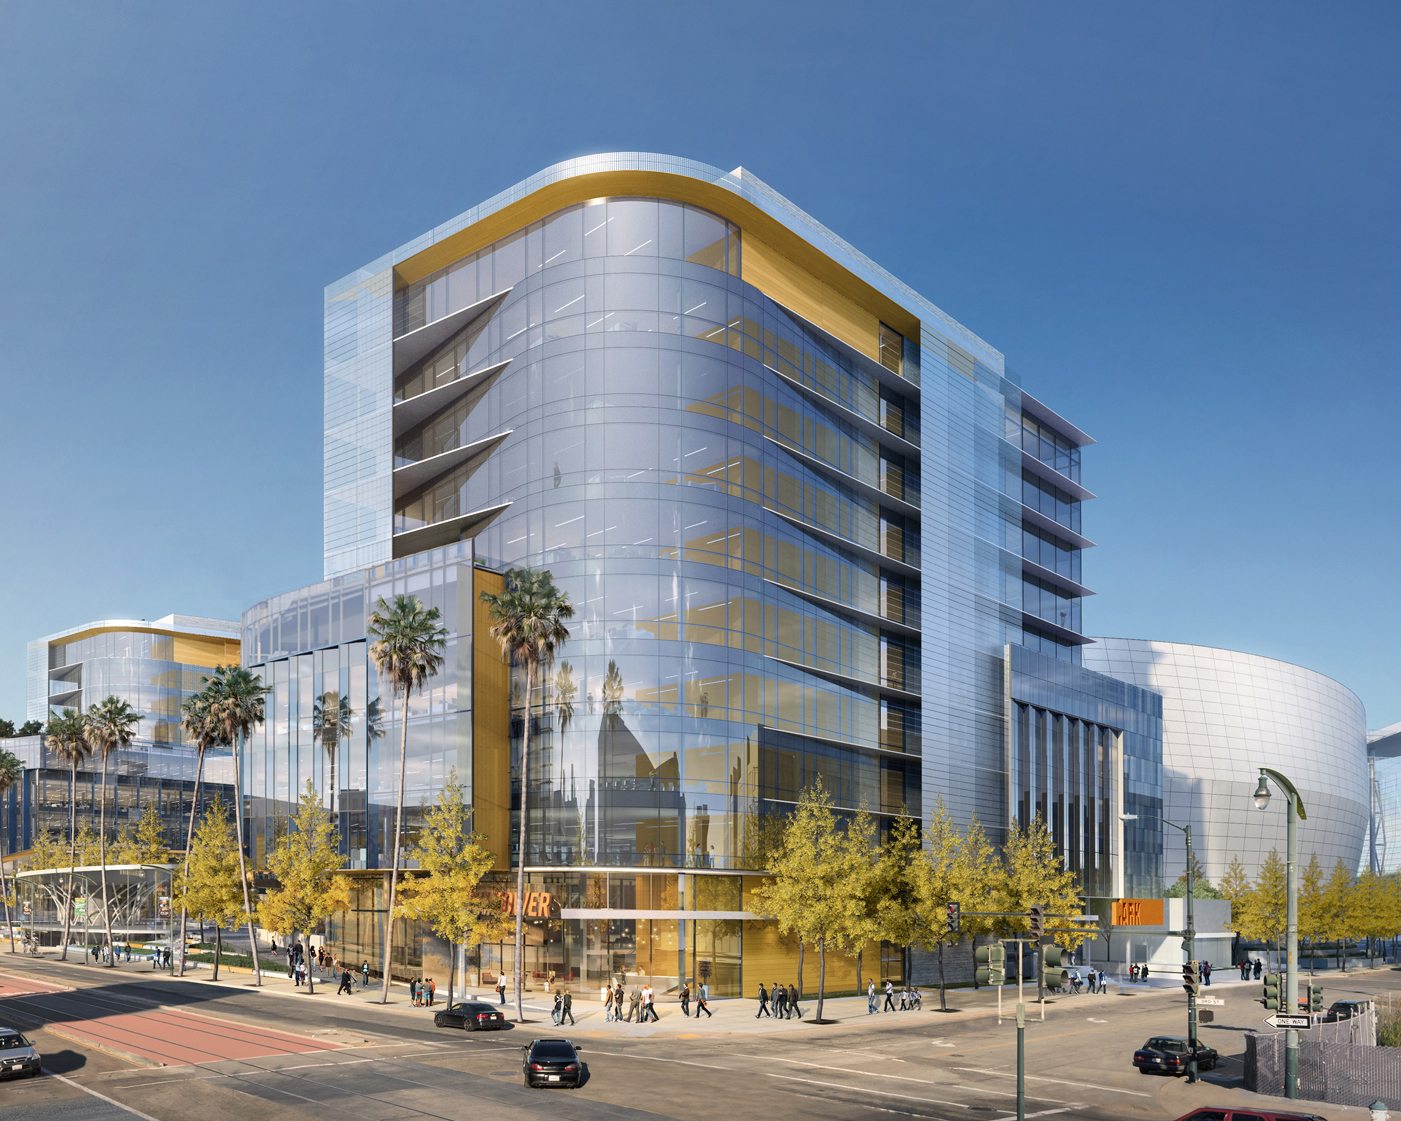 |  | |||
| 279 East Grand Avenue | 201 Haskins Way | 681 Gateway Boulevard | Menlo Gateway | |||
| San Francisco/South San Francisco | San Francisco/South San Francisco | San Francisco/South San Francisco | San Francisco/Greater Stanford | |||
| 211,405 RSF | 280,000 RSF | 126,971 RSF | 520,988 RSF | |||
| Verily Life Sciences, LLC Multi-Tenant/Marketing | Multi-Tenant/Marketing | Twist Bioscience Corporation Multi-Tenant/Marketing | Facebook, Inc. | |||
 |  |  |  | |||
| New Class A Development and Redevelopment Properties: 2018 – 2020 Deliveries (continued) | | |
| March 31, 2018 | ||
| 825 and 835 Industrial Road | Alexandria PARC | 9625 Towne Centre Drive | 9880 Campus Point Drive | |||
| San Francisco/Greater Stanford | San Francisco/Greater Stanford | San Diego/University Town Center | San Diego/University Town Center | |||
| 530,000 RSF | 45,115 RSF | 163,648 RSF | 98,000 RSF | |||
| Multi-Tenant/Marketing | Multi-Tenant/Negotiating | Takeda Pharmaceutical Company Ltd. | Multi-Tenant/Marketing | |||
 |  |  | 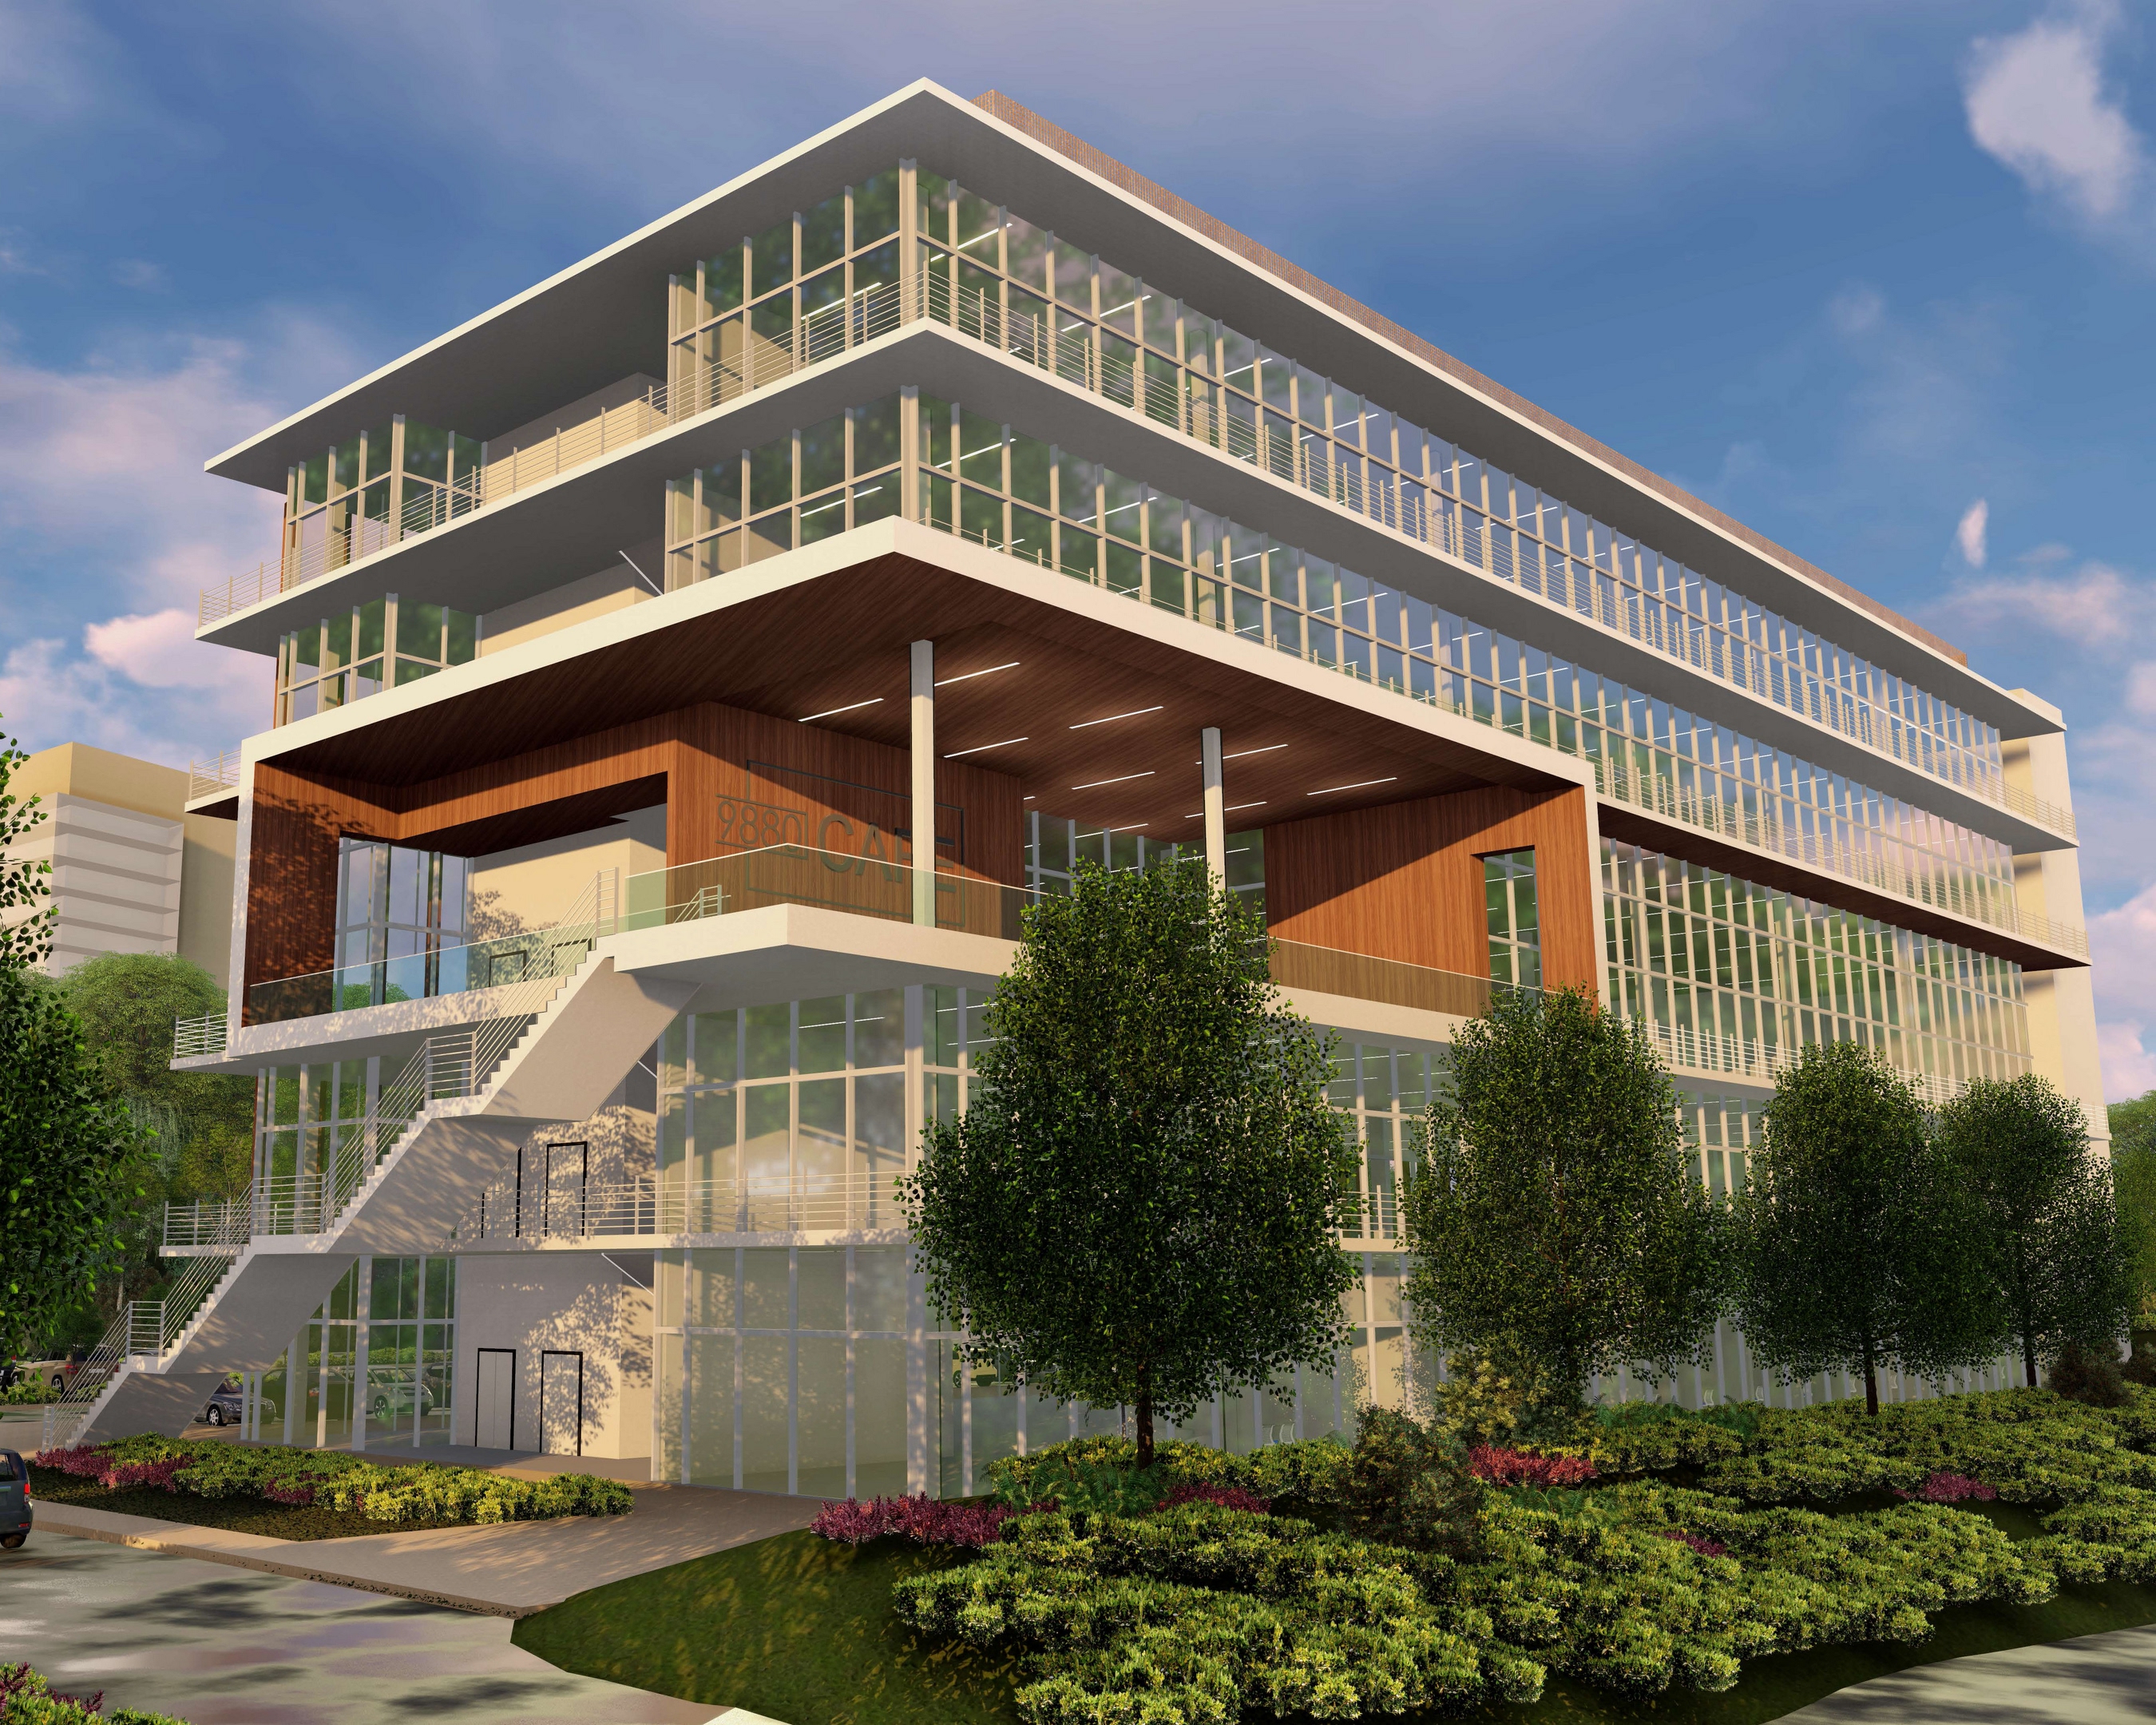 | |||
| 1818 Fairview Avenue East | 9900 Medical Center Drive | 704 Quince Orchard Road | 5 Laboratory Drive | |||
| Seattle/Lake Union | Maryland/Rockville | Maryland/Gaithersburg | Research Triangle Park/RTP | |||
| 205,000 RSF | 45,039 RSF | 58,186 RSF | 175,000 RSF | |||
| Multi-Tenant/Negotiating | Multi-Tenant/Negotiating | Multi-Tenant/Marketing | ELO Life Systems, Inc. Boragen, Inc. Indigo Ag, Inc. Multi-Tenant/Negotiating | |||
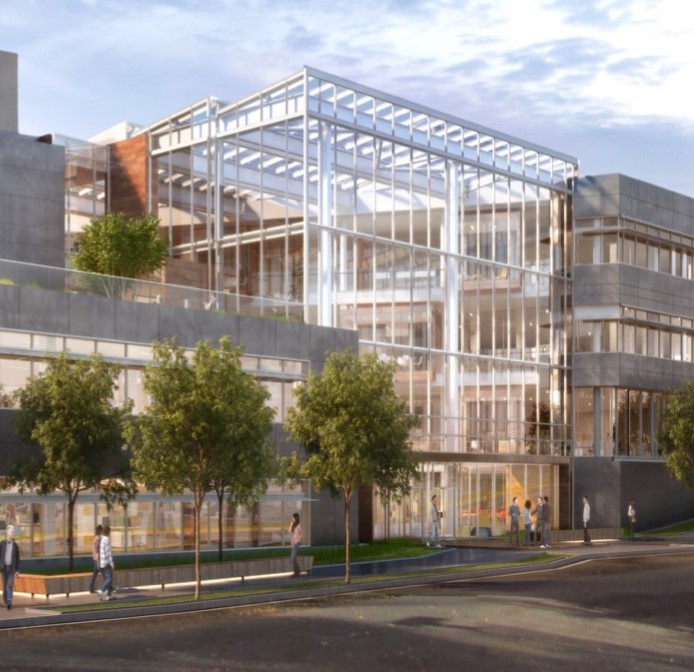 | 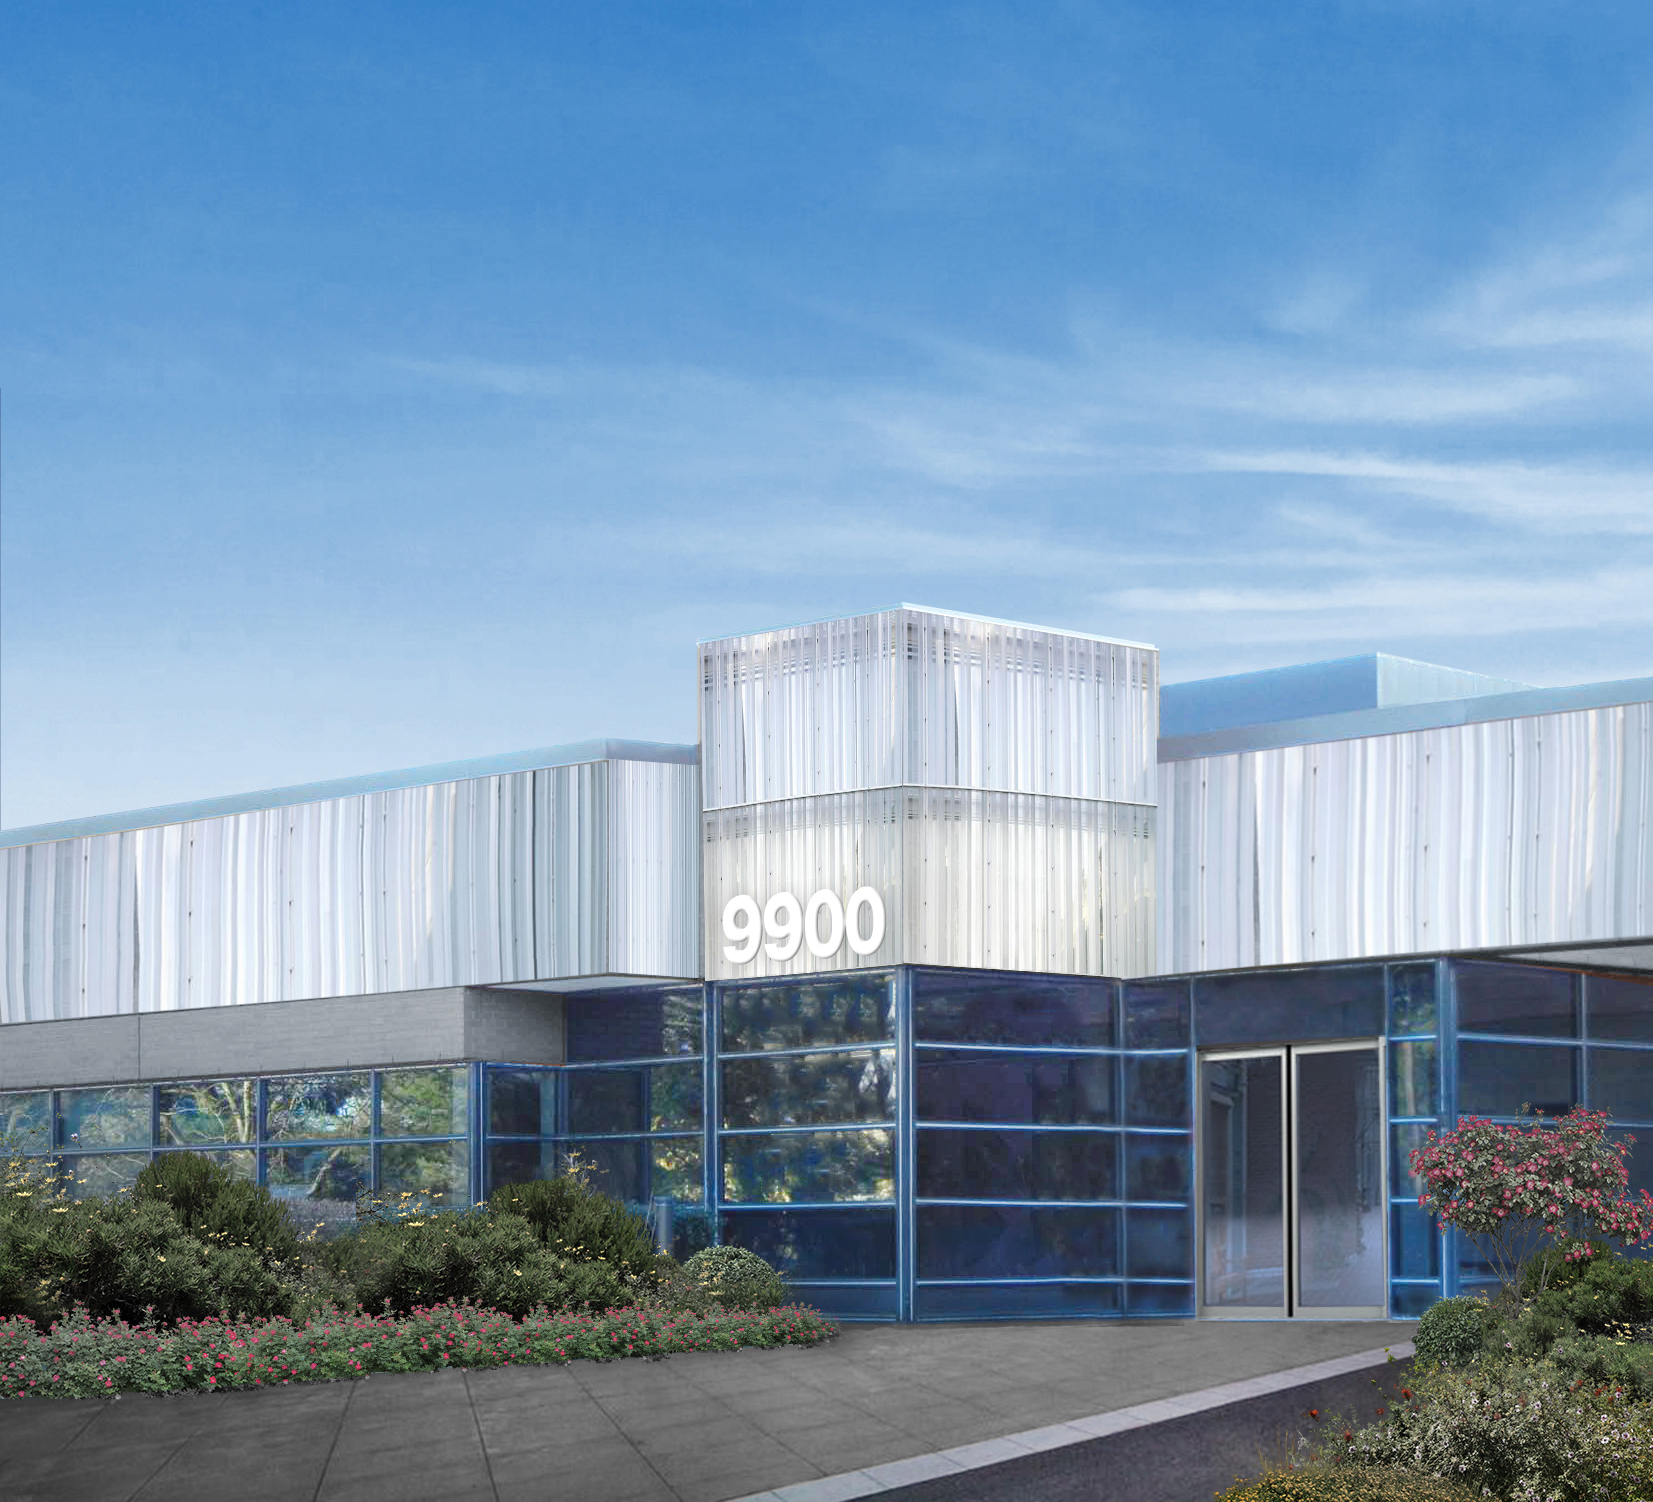 | 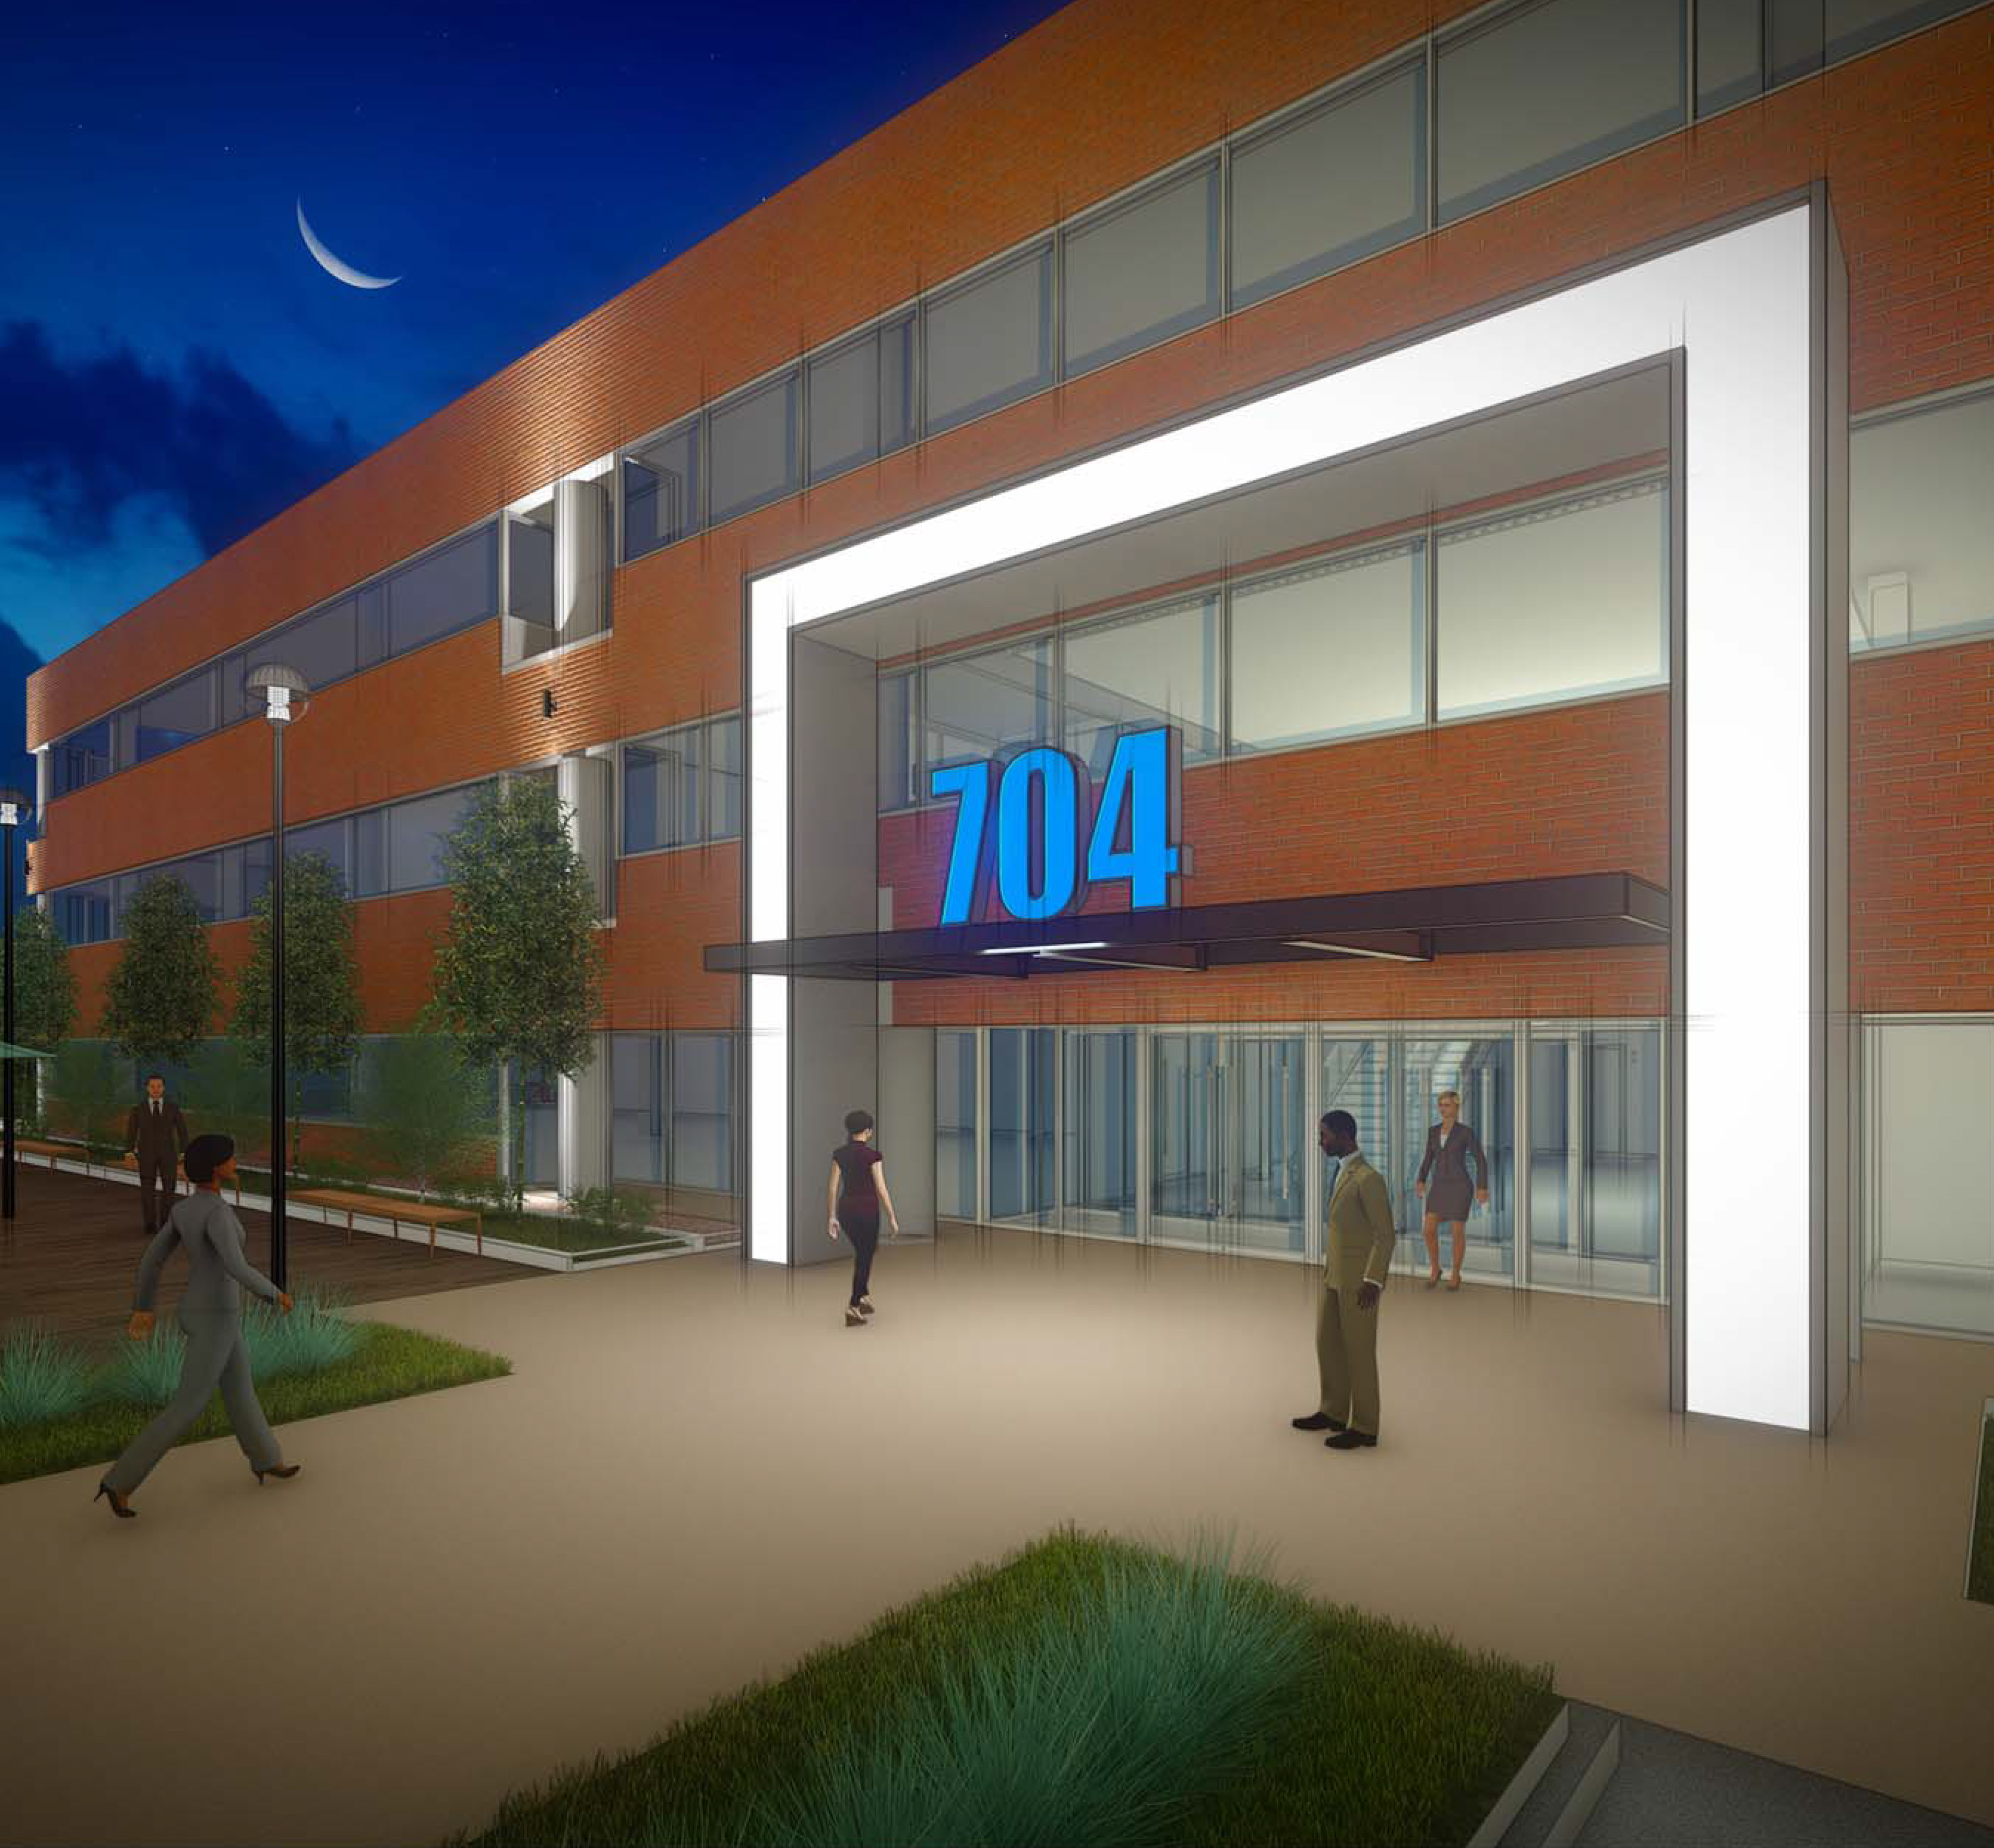 | 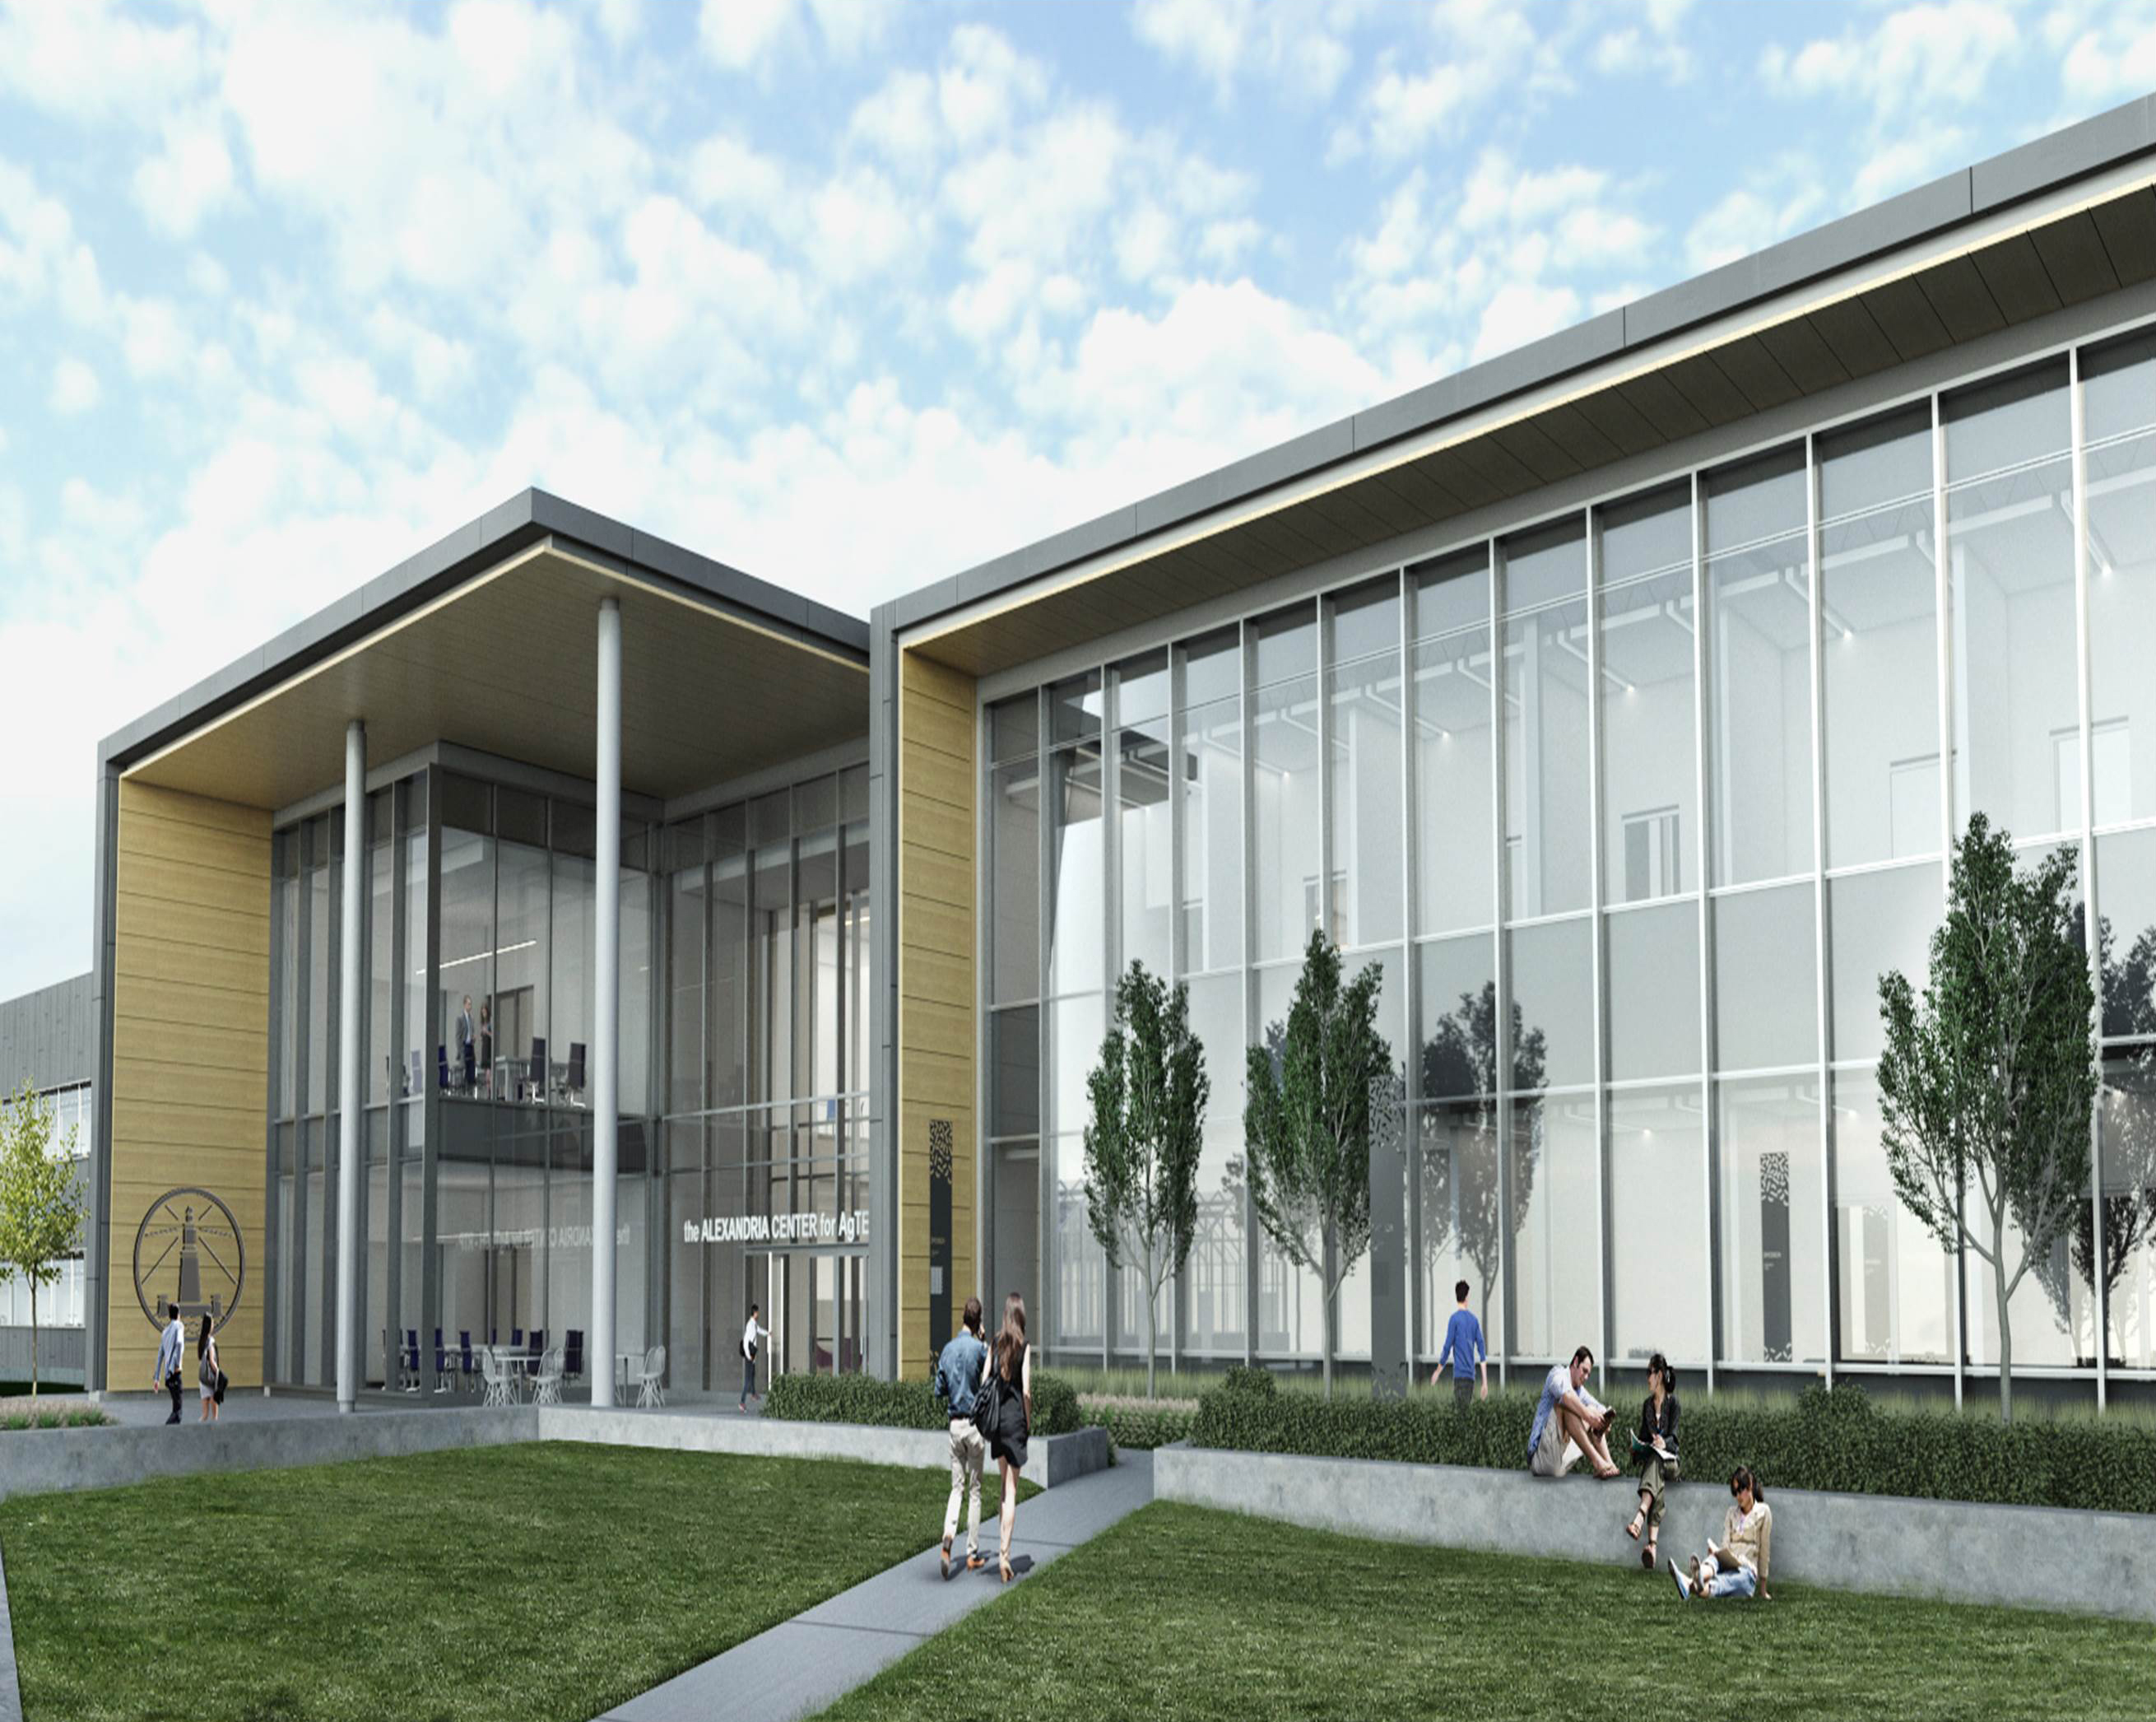 | |||
| New Class A Development and Redevelopment Properties: 2018 – 2020 Deliveries (continued) | | |
| March 31, 2018 | ||
| Property/Market/Submarket | Dev/Redev | Project RSF | Percentage | Project Start | Occupancy(1) | |||||||||||||||||||||||
| In Service | CIP | Total | Leased | Negotiating | Total | Initial | Stabilized | |||||||||||||||||||||
2018 deliveries: consolidated projects under construction | ||||||||||||||||||||||||||||
| 266 and 275 Second Avenue/Greater Boston/Route 128 | Redev | 171,899 | 31,858 | 203,757 | 84 | % | — | % | 84 | % | 3Q17 | 1Q18 | 2018 | |||||||||||||||
| 5 Laboratory Drive/Research Triangle Park/RTP | Redev | — | 175,000 | 175,000 | 34 | 6 | 40 | 2Q17 | 3Q18 | 2019 | ||||||||||||||||||
9625 Towne Centre Drive/San Diego/University Town Center(2) | Redev | — | 163,648 | 163,648 | 100 | — | 100 | 3Q15 | 4Q18 | 2018 | ||||||||||||||||||
| 399 Binney Street/Greater Boston/Cambridge | Dev | — | 164,000 | 164,000 | 75 | 14 | 89 | 4Q17 | 4Q18 | 2019 | ||||||||||||||||||
| 2018 deliveries undergoing construction | 171,899 | 534,506 | 706,405 | 73 | % | 5 | % | 78 | % | |||||||||||||||||||
2019 deliveries: consolidated projects under construction | ||||||||||||||||||||||||||||
| 213 East Grand Avenue/San Francisco/South San Francisco | Dev | — | 300,930 | 300,930 | 100 | % | — | % | 100 | % | 2Q17 | 1Q19 | 2019 | |||||||||||||||
| 9900 Medical Center Drive/Maryland/Rockville | Redev | — | 45,039 | 45,039 | — | 58 | 58 | 3Q17 | 1Q19 | 2019 | ||||||||||||||||||
| Alexandria PARC/San Francisco/Greater Stanford | Redev | 152,383 | 45,115 | 197,498 | 77 | 23 | 100 | 1Q18 | 2Q19 | 2019 | ||||||||||||||||||
| 279 East Grand Avenue/San Francisco/South San Francisco | Dev | — | 211,405 | 211,405 | 49 | — | 49 | 4Q17 | 2019 | 2020 | ||||||||||||||||||
| 152,383 | 602,489 | 754,872 | 74 | 9 | 83 | |||||||||||||||||||||||
2019 deliveries: unconsolidated joint venture projects under construction(2) | ||||||||||||||||||||||||||||
| 704 Quince Orchard Road/Maryland/Gaithersburg | Redev | 21,745 | 58,186 | 79,931 | 27 | 6 | 33 | 1Q18 | 1Q19 | 2020 | ||||||||||||||||||
| Menlo Gateway/San Francisco/Greater Stanford | Dev | 251,995 | 520,988 | 772,983 | 100 | — | 100 | 4Q17 | 4Q19 | 4Q19 | ||||||||||||||||||
| 1655 and 1725 Third Street/San Francisco/Mission Bay/SoMa | Dev | — | 593,765 | 593,765 | 100 | — | 100 | 1Q18 | 4Q19 | 2019 | ||||||||||||||||||
| 273,740 | 1,172,939 | 1,446,679 | 96 | — | 96 | |||||||||||||||||||||||
| Total development and redevelopment projects undergoing construction | 598,022 | 2,309,934 | 2,907,956 | |||||||||||||||||||||||||
| 2019 deliveries: consolidated projects under pre-construction | ||||||||||||||||||||||||||||
681 Gateway Boulevard/San Francisco/South San Francisco(3) | Redev | — | 126,971 | 126,971 | 48 | (3) | — | 48 | 4Q18 | 2019 | TBD | |||||||||||||||||
| 1818 Fairview Avenue East/Seattle/Lake Union | Dev | — | 205,000 | 205,000 | — | 26 | (4) | 26 | TBD | 2019 | TBD | |||||||||||||||||
| — | 331,971 | 331,971 | ||||||||||||||||||||||||||
| 2019 deliveries undergoing construction and pre-construction | 426,123 | 2,107,399 | 2,533,522 | 79 | % | 5 | % | 84 | % | |||||||||||||||||||
2020 deliveries: consolidated projects under pre-construction | ||||||||||||||||||||||||||||
| 825 and 835 Industrial Road/San Francisco/Greater Stanford | Dev | — | 530,000 | 530,000 | ||||||||||||||||||||||||
| 201 Haskins Way/San Francisco/South San Francisco | Dev | — | 280,000 | 280,000 | ||||||||||||||||||||||||
| 9880 Campus Point Drive/San Diego/University Town Center | Dev | — | 98,000 | 98,000 | ||||||||||||||||||||||||
| 2020 deliveries undergoing pre-construction | — | 908,000 | 908,000 | |||||||||||||||||||||||||
| Total | 598,022 | 3,549,905 | 4,147,927 | |||||||||||||||||||||||||
| (1) | Initial occupancy dates are subject to leasing and/or market conditions. Stabilized occupancy may vary depending on single tenancy versus multi-tenancy. |
| (2) | See page 42 of this Supplemental Information for additional information. |
| (3) | The building is 100% occupied through the end of 3Q18, after which we expect to redevelop the building from office to office/laboratory space and expand it by an additional 15,000 RSF to 30,000 RSF. We have executed a lease for 60,963 RSF, or 48% of the existing building RSF. |
| (4) | Represents an executed letter of intent with a high-quality public biotechnology tenant for 52,874 RSF, including an option to expand into 27,874 RSF. |
| New Class A Development and Redevelopment Properties: 2018 – 2020 Deliveries (continued) | |
| March 31, 2018 | |
| (Dollars in thousands) | |
| Our Ownership Interest | Cost to Complete | Unlevered Yields | |||||||||||||||||||||||||||||||
| Property/Market/Submarket | In Service | CIP | Construction Loan | ARE Funding | Total at Completion | Initial Stabilized | Initial Stabilized (Cash Basis) | ||||||||||||||||||||||||||
2018 deliveries: consolidated projects under construction | |||||||||||||||||||||||||||||||||
| 266 and 275 Second Avenue/Greater Boston/Route 128 | 100 | % | $ | 72,713 | $ | 9,336 | $ | — | $ | 6,951 | $ | 89,000 | 8.4% | 7.1% | |||||||||||||||||||
| 5 Laboratory Drive/Research Triangle Park/RTP | 100 | % | — | 18,926 | — | 43,574 | 62,500 | 7.7% | 7.6% | ||||||||||||||||||||||||
9625 Towne Centre Drive/San Diego/University Town Center(1) | 54.7 | % | — | 45,758 | — | 47,242 | 93,000 | 7.0% | 7.0% | ||||||||||||||||||||||||
| 399 Binney Street/Greater Boston/Cambridge | 100 | % | — | 98,936 | — | 75,064 | 174,000 | 7.3% | 6.7% | ||||||||||||||||||||||||
| 2018 deliveries undergoing construction | 72,713 | 172,956 | — | 172,831 | 418,500 | ||||||||||||||||||||||||||||
2019 deliveries: consolidated projects under construction | |||||||||||||||||||||||||||||||||
| 213 East Grand Avenue/San Francisco/South San Francisco | 100 | % | — | 136,977 | — | 123,023 | 260,000 | 7.2% | 6.4% | ||||||||||||||||||||||||
| 9900 Medical Center Drive/Maryland/Rockville | 100 | % | — | 8,040 | — | 6,260 | 14,300 | 8.4% | 8.4% | ||||||||||||||||||||||||
| Alexandria PARC/San Francisco/Greater Stanford | 100 | % | 97,550 | 29,216 | — | TBD | |||||||||||||||||||||||||||
| 279 East Grand Avenue/San Francisco/South San Francisco | 100 | % | — | 60,887 | — | ||||||||||||||||||||||||||||
| 97,550 | 235,120 | — | TBD | TBD | |||||||||||||||||||||||||||||
2019 deliveries: unconsolidated joint venture projects under construction(1) | |||||||||||||||||||||||||||||||||
| (Amounts represent our share) | |||||||||||||||||||||||||||||||||
| 704 Quince Orchard Road/Maryland/Gaithersburg | 56.8 | % | 1,393 | 3,085 | 7,938 | TBD | |||||||||||||||||||||||||||
| Menlo Gateway/San Francisco/Greater Stanford | 25.2 | % | 64,880 | 58,782 | 117,398 | 188,940 | 430,000 | 6.9% | 6.3% | ||||||||||||||||||||||||
| 1655 and 1725 Third Street/San Francisco/Mission Bay/SoMa | 10 | % | — | 36,060 | 33,280 | 8,660 | 78,000 | 7.8% | 6.0% | ||||||||||||||||||||||||
| 66,273 | 97,927 | 158,616 | TBD | TBD | |||||||||||||||||||||||||||||
| 2019 deliveries: consolidated projects under pre-construction | |||||||||||||||||||||||||||||||||
| 681 Gateway Boulevard/San Francisco/South San Francisco | 100 | % | — | — | TBD | ||||||||||||||||||||||||||||
| 1818 Fairview Avenue East/Seattle/Lake Union | 100 | % | — | 45,946 | |||||||||||||||||||||||||||||
| — | 45,946 | ||||||||||||||||||||||||||||||||
| 2019 deliveries undergoing construction and pre-construction | 163,823 | 378,993 | |||||||||||||||||||||||||||||||
2020 deliveries: consolidated projects under pre-construction | |||||||||||||||||||||||||||||||||
| 825 and 835 Industrial Road/San Francisco/Greater Stanford | 100 | % | — | 94,075 | TBD | ||||||||||||||||||||||||||||
| 201 Haskins Way/San Francisco/South San Francisco | 100 | % | — | 40,883 | |||||||||||||||||||||||||||||
| 9880 Campus Point Drive/San Diego/University Town Center | 100 | % | — | 43,132 | |||||||||||||||||||||||||||||
| 2020 deliveries undergoing pre-construction | — | 178,090 | |||||||||||||||||||||||||||||||
| Total | $ | 236,536 | $ | 730,039 | |||||||||||||||||||||||||||||
| (1) | See page 42 of this Supplemental Information for additional information. |
| New Class A Development and Redevelopment Properties: Intermediate-Term Development Projects | |
| March 31, 2018 | |
| 325 Binney Street | 88 Bluxome Street | 505 Brannan Street, Phase II | 960 Industrial Road | Alexandria Center® for Life Science | ||||
| Greater Boston/Cambridge | San Francisco/Mission Bay/SoMa | San Francisco/Mission Bay/SoMa | San Francisco/Greater Stanford | New York City/Manhattan | ||||
| 208,965 RSF | 1,070,925 RSF | 165,000 RSF | 500,000 RSF | 420,000 RSF | ||||
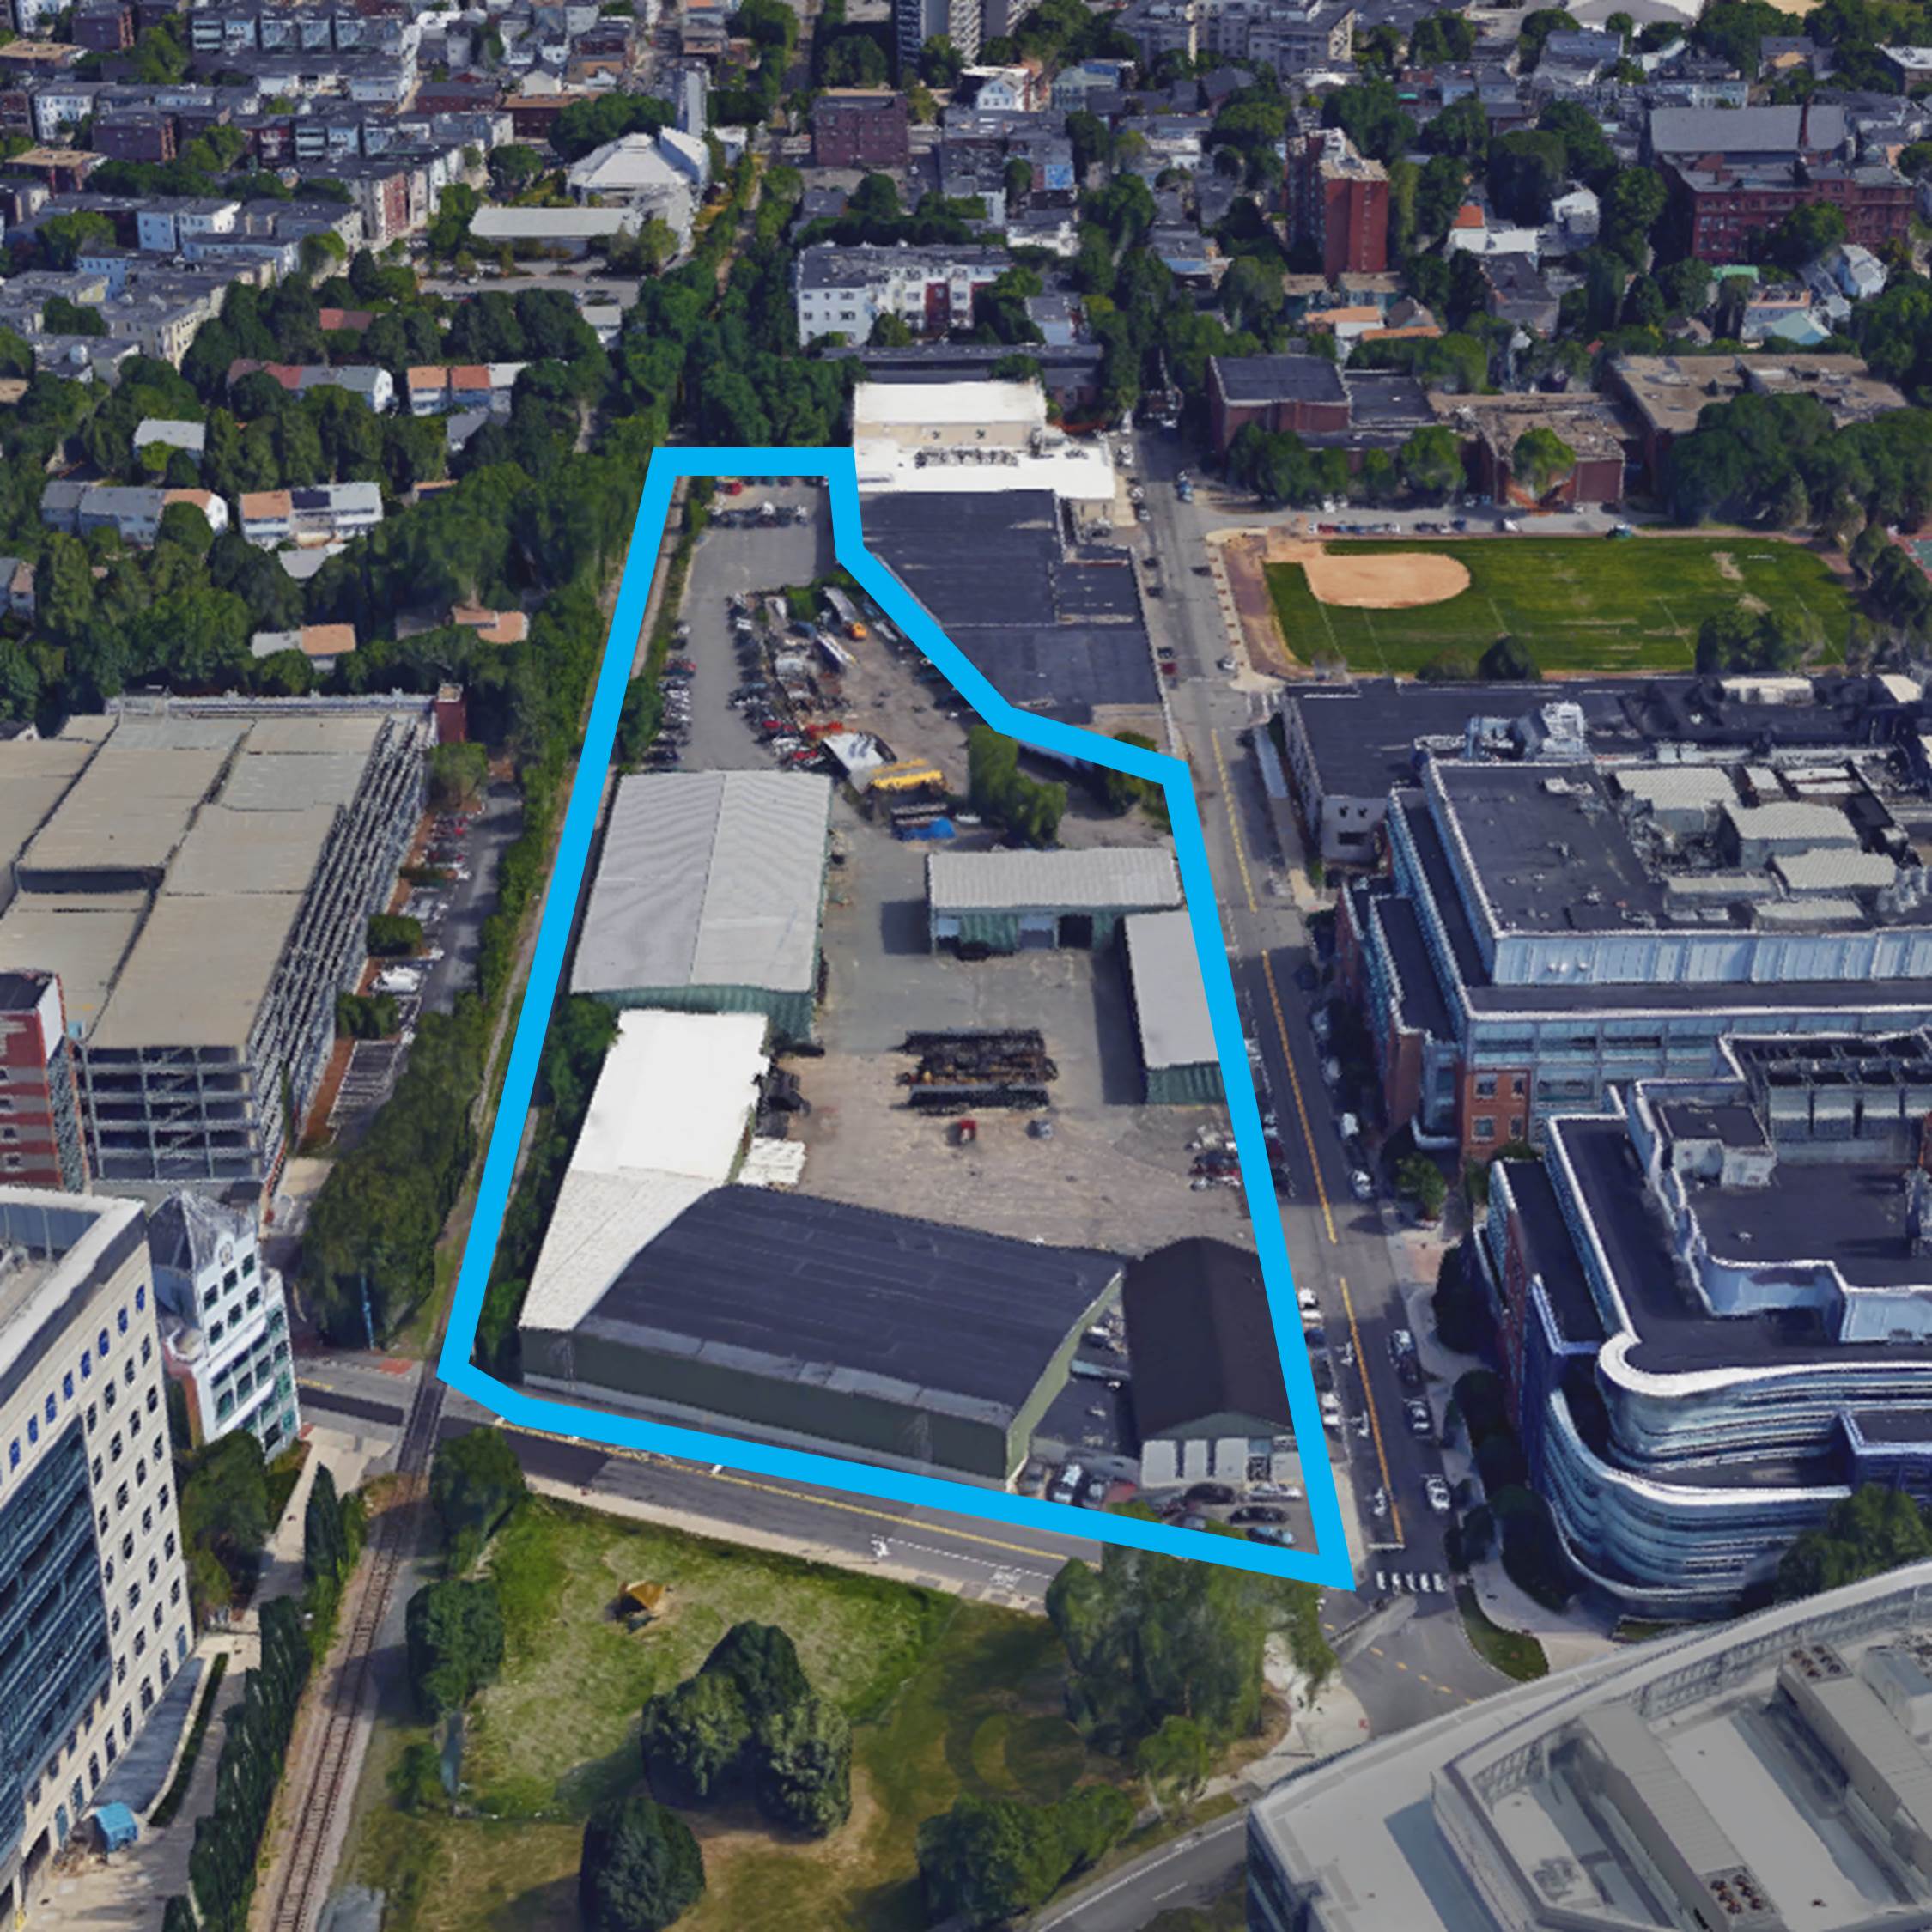 | 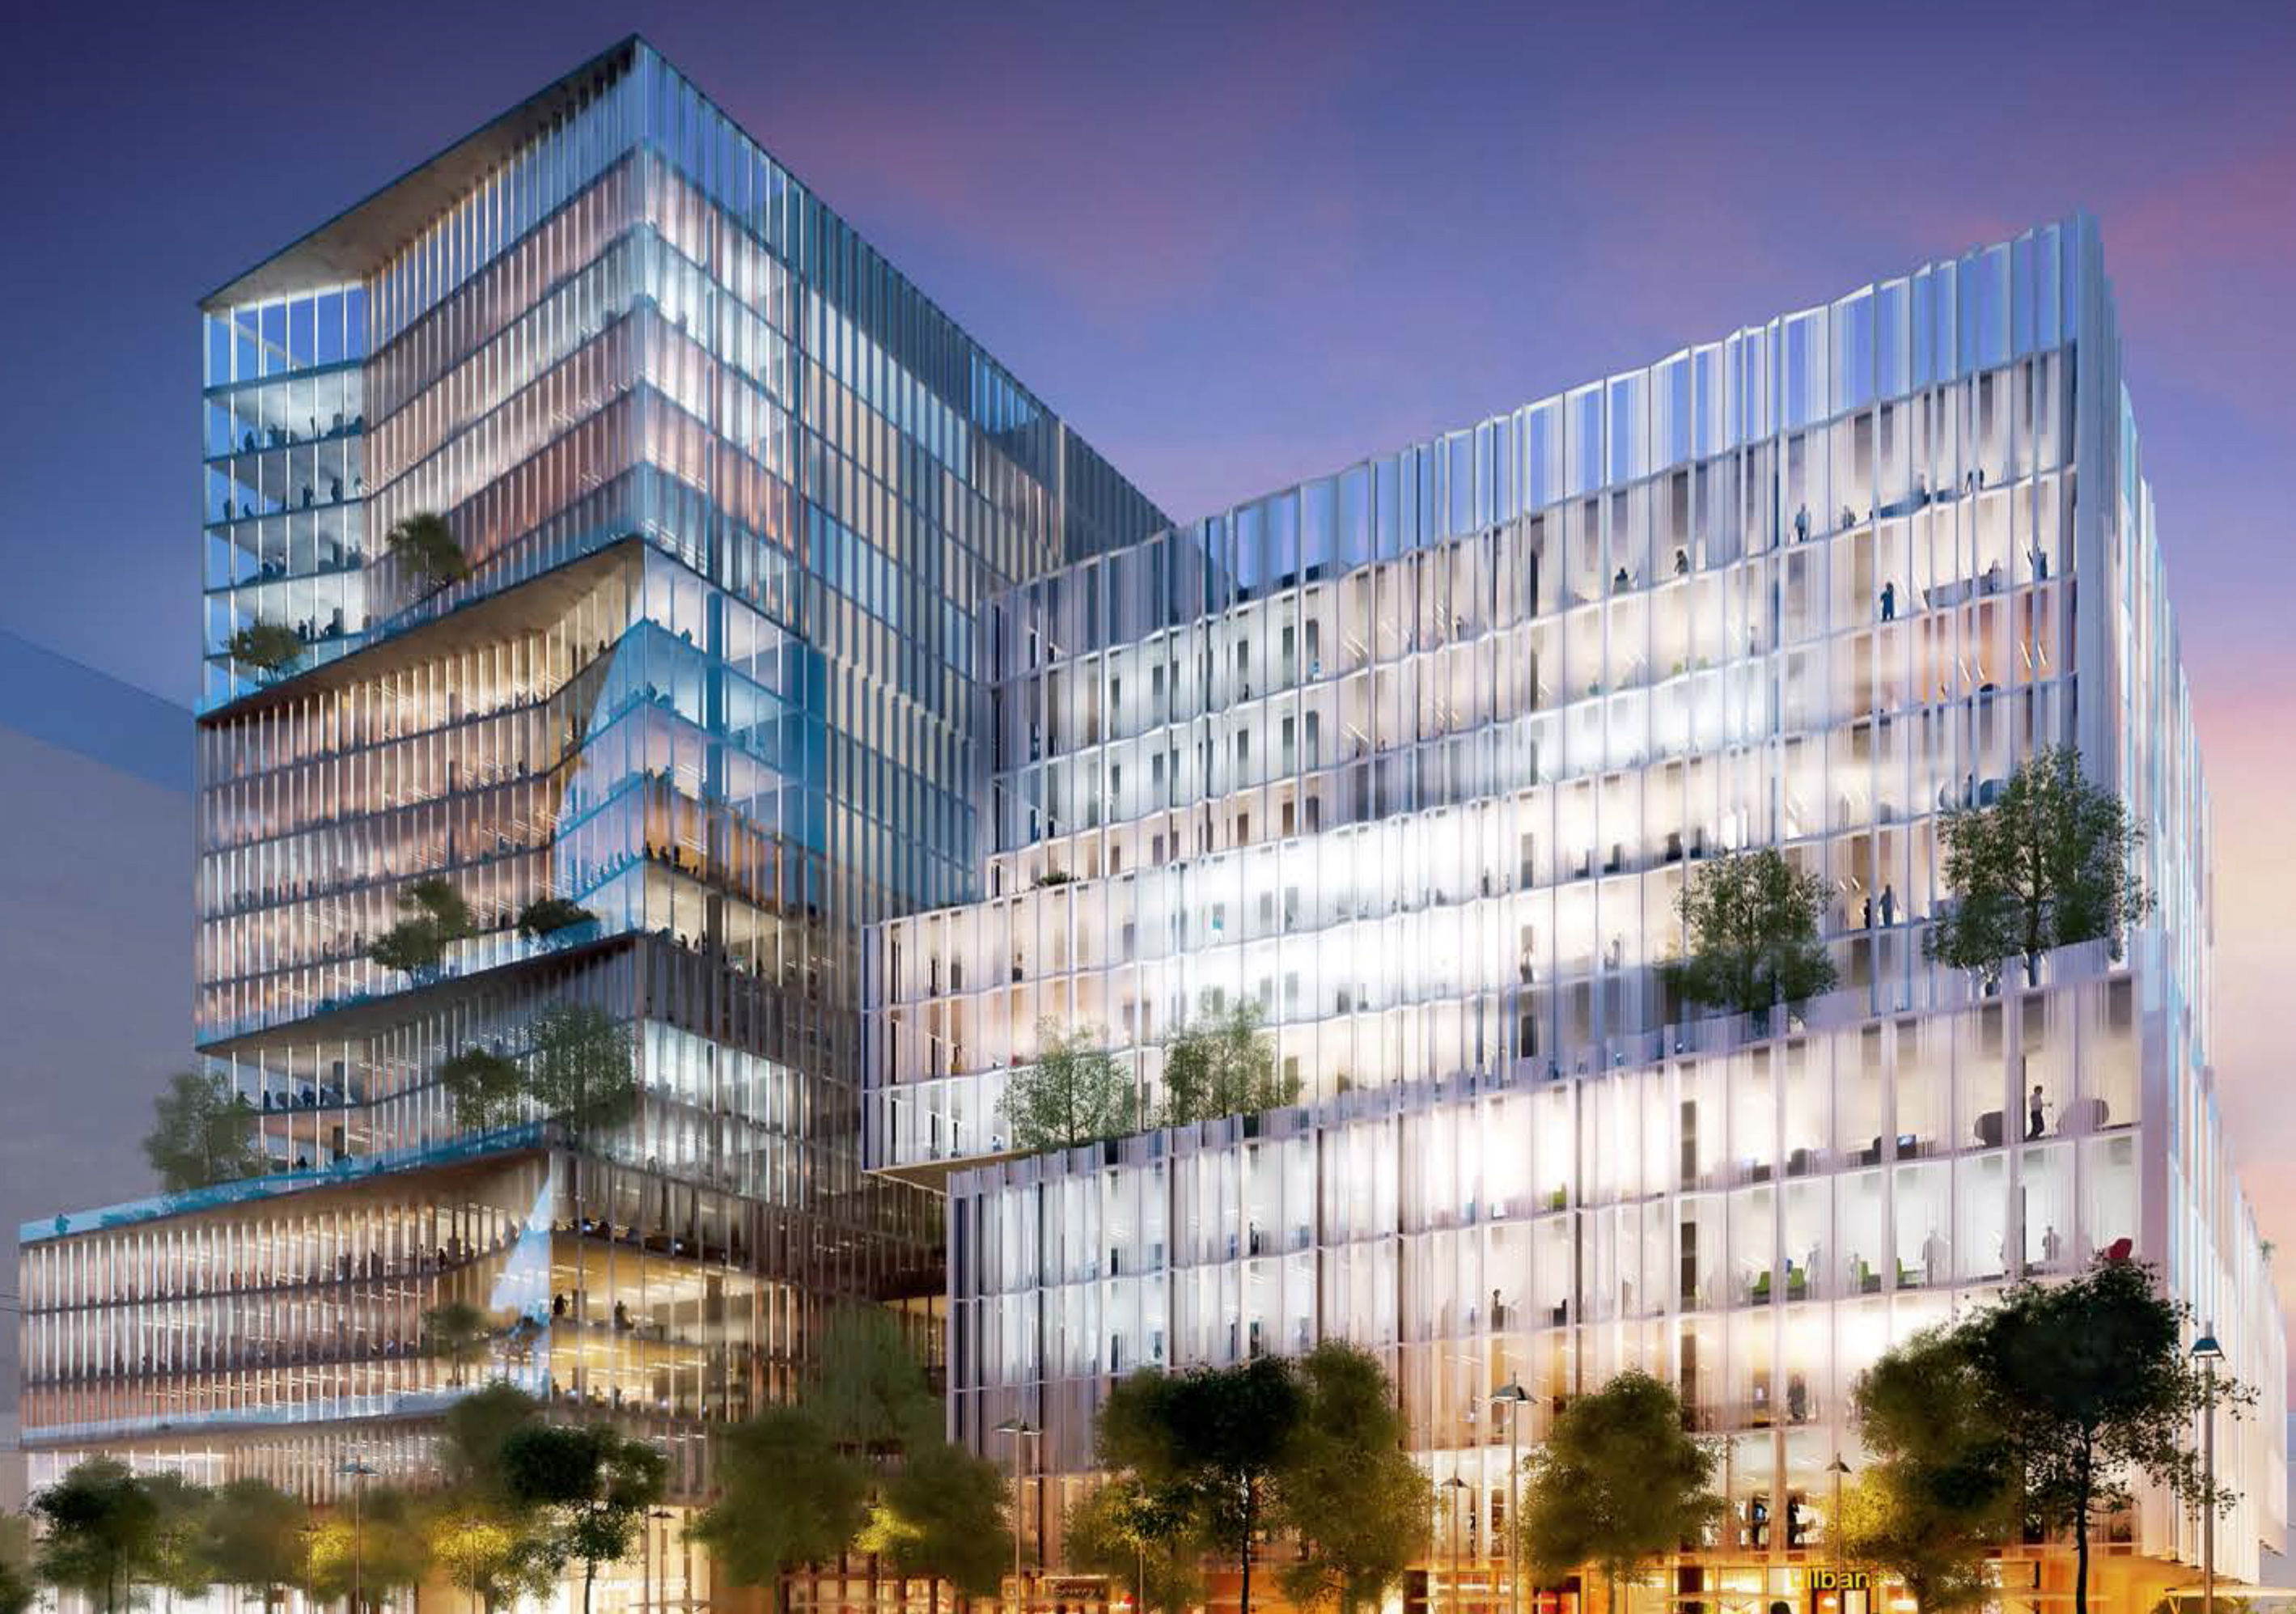 | 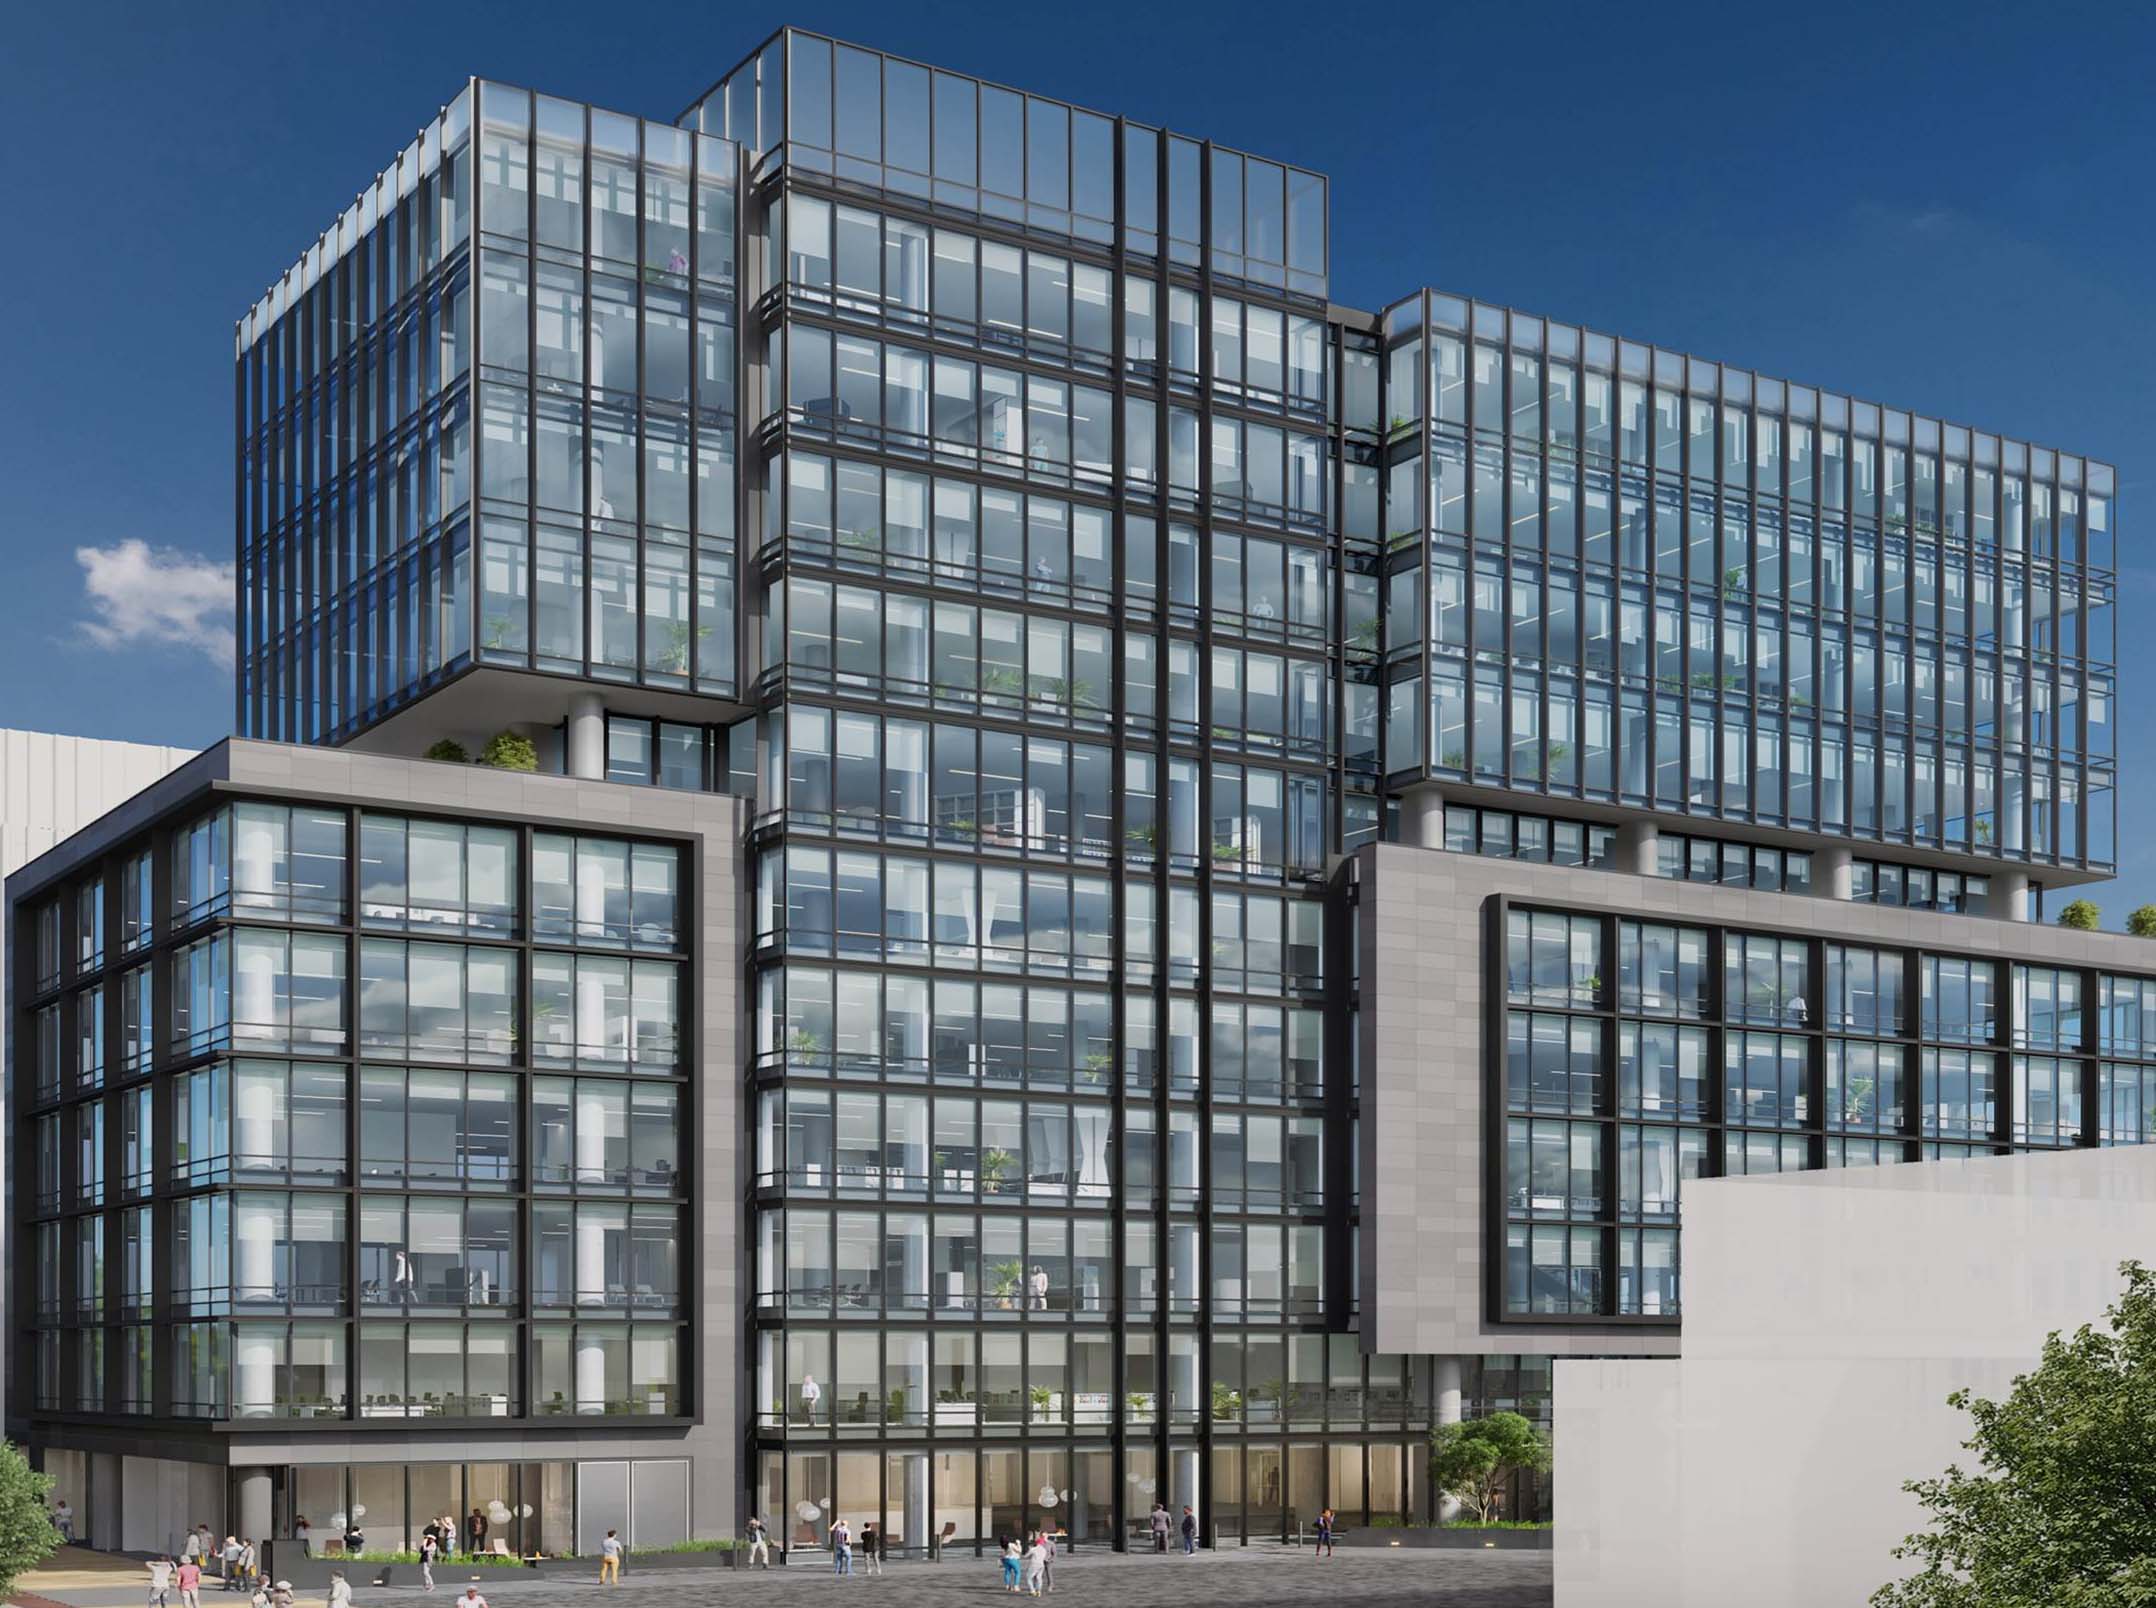 | 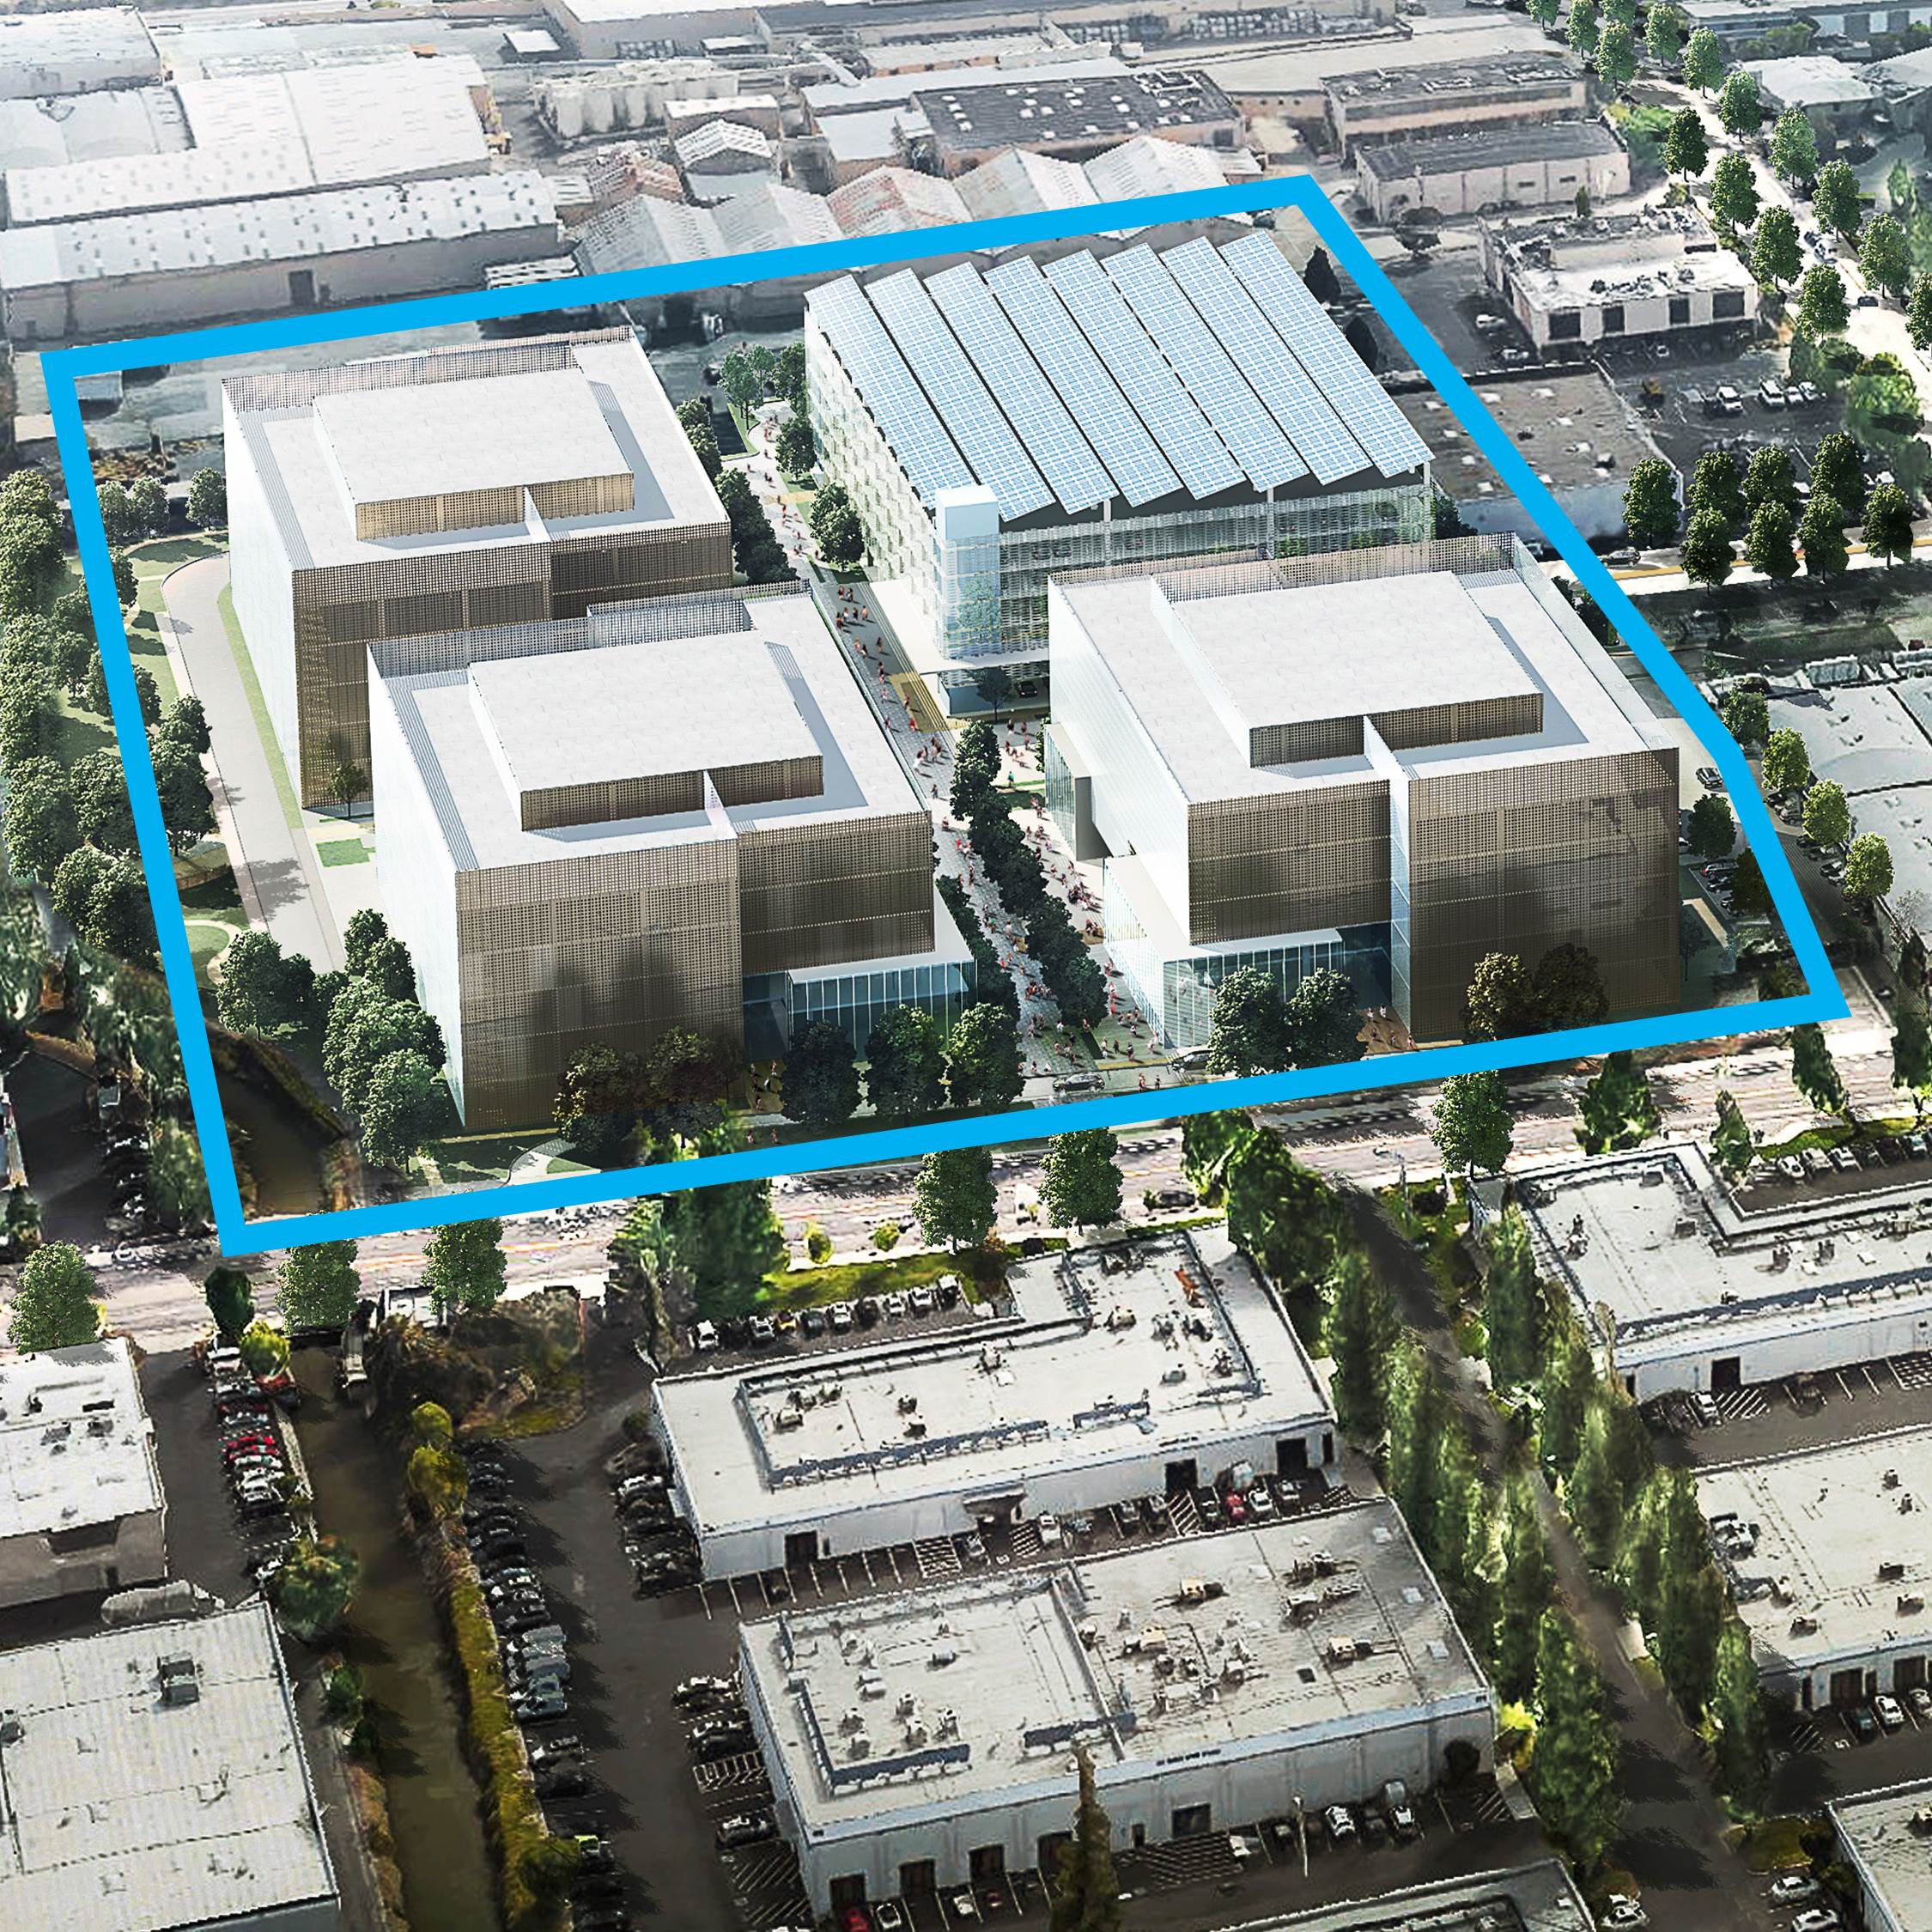 | 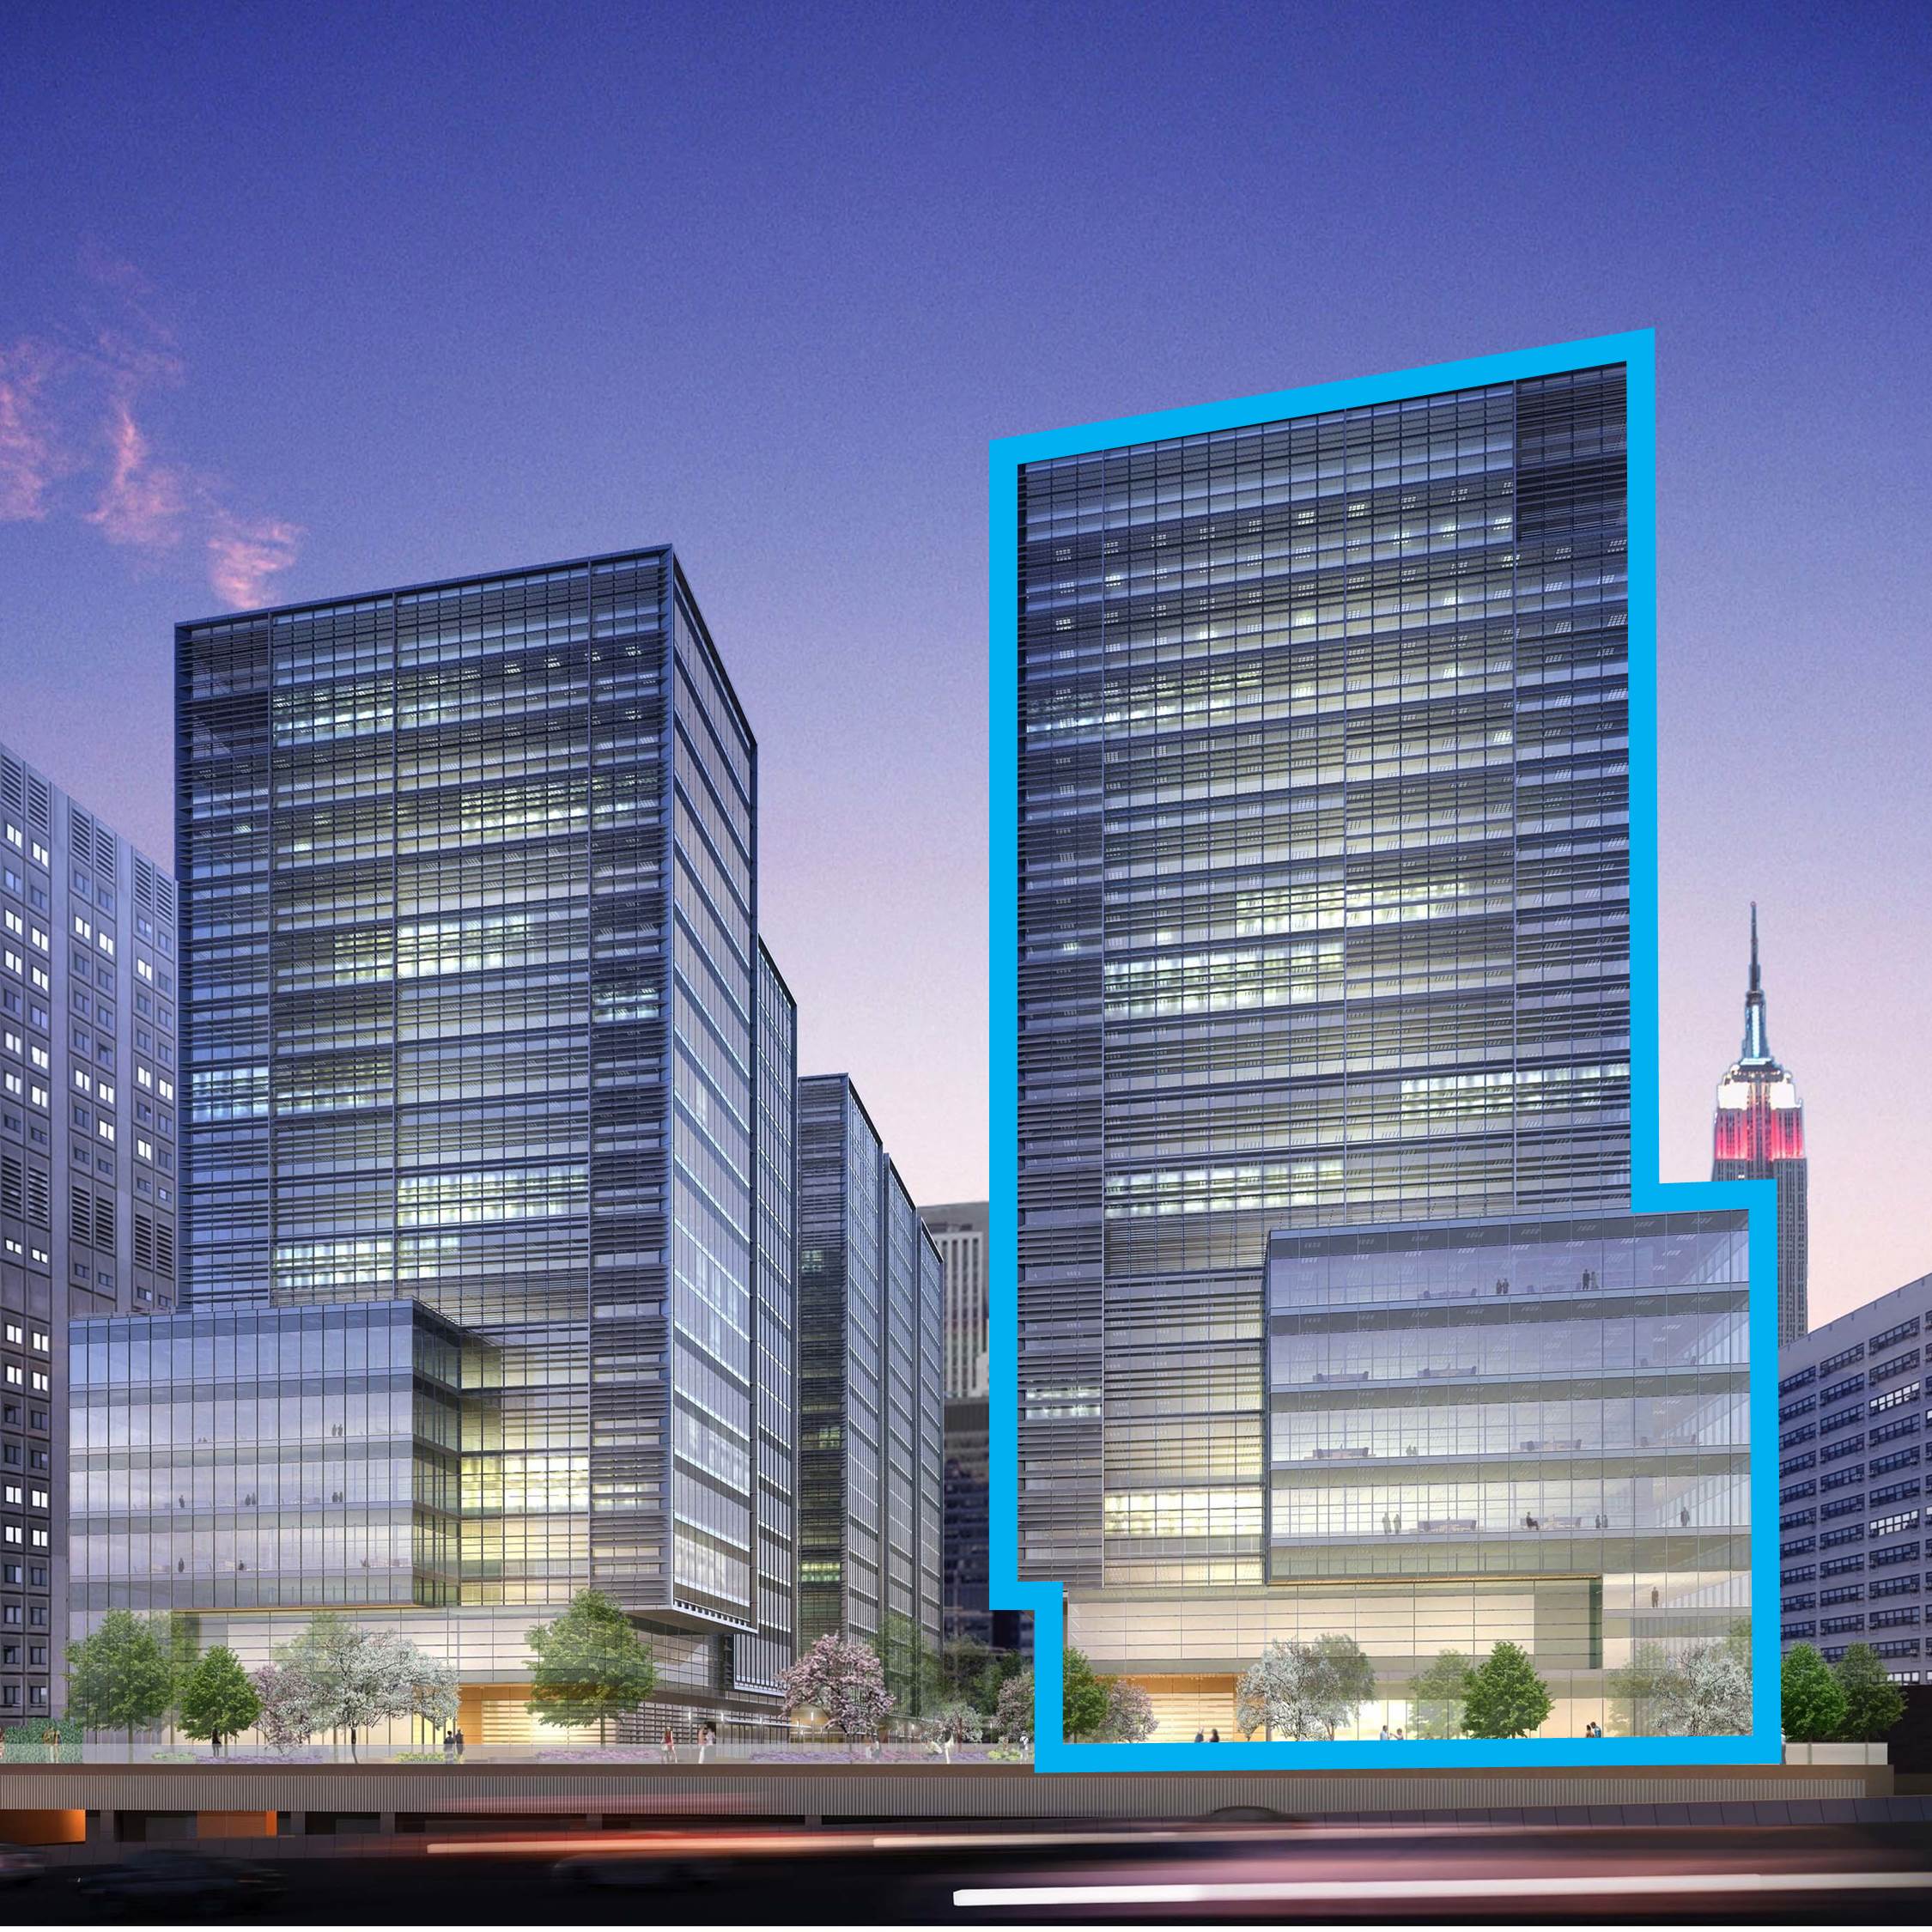 | ||||
| 5200 Illumina Way | Campus Point Drive | 1150 Eastlake Avenue East | 1165/1166 Eastlake Avenue East | 9800 Medical Center Drive | ||||
| San Diego/University Town Center | San Diego/University Town Center | Seattle/Lake Union | Seattle/Lake Union | Maryland/Rockville | ||||
| 386,044 RSF | 318,383 RSF | 260,000 RSF | 106,000 RSF | 180,000 RSF | ||||
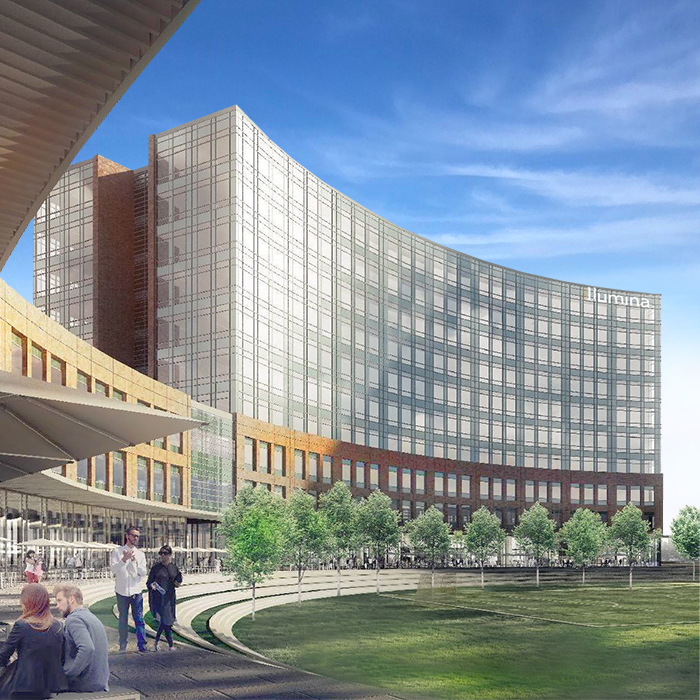 | 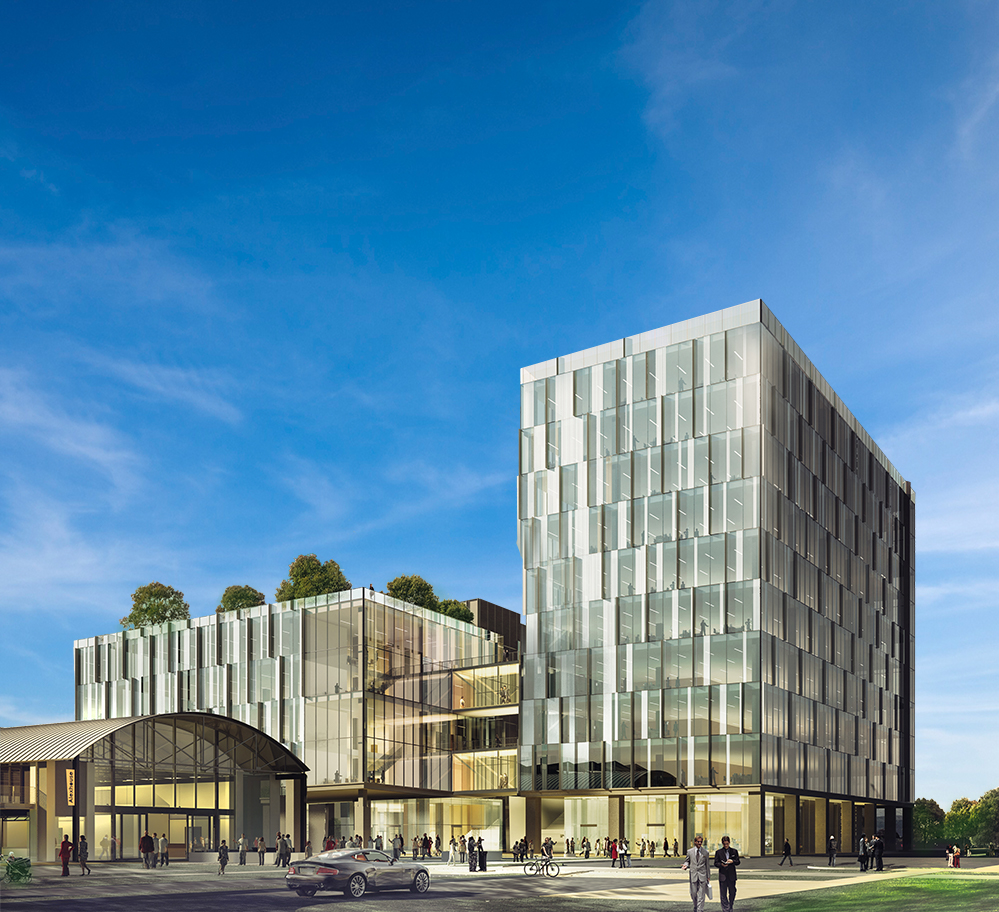 |  |  |  | ||||
| New Class A Development and Redevelopment Properties: Summary of Pipeline | |
| March 31, 2018 | |
| (Dollars in thousands) | |
| Property/Submarket | Our Ownership Interest | Book Value | Square Footage | ||||||||||||||||||||||||||||
| Development Projects | |||||||||||||||||||||||||||||||
| Undergoing Construction | Near-Term Projects Undergoing Marketing and Pre-Construction | Intermediate- Term Development | Future Development | Total(1) | |||||||||||||||||||||||||||
| Greater Boston | |||||||||||||||||||||||||||||||
| Undergoing construction | |||||||||||||||||||||||||||||||
| 266 and 275 Second Avenue/Route 128 | 100 | % | $ | 9,336 | 31,858 | — | — | — | 31,858 | ||||||||||||||||||||||
399 Binney Street (Alexandria Center® at One Kendall Square) | 100 | % | 98,936 | 164,000 | — | — | — | 164,000 | |||||||||||||||||||||||
| Intermediate-term development | |||||||||||||||||||||||||||||||
| 325 Binney Street/Cambridge | 100 | % | 89,637 | — | — | 208,965 | — | 208,965 | |||||||||||||||||||||||
| Future development | |||||||||||||||||||||||||||||||
Alexandria Technology Square®/Cambridge | 100 | % | 7,787 | — | — | — | 100,000 | 100,000 | |||||||||||||||||||||||
| Other future projects | 100 | % | 7,612 | — | — | — | 405,599 | 405,599 | |||||||||||||||||||||||
| 213,308 | 195,858 | — | 208,965 | 505,599 | 910,422 | ||||||||||||||||||||||||||
| San Francisco | |||||||||||||||||||||||||||||||
| Undergoing construction | |||||||||||||||||||||||||||||||
| 213 East Grand Avenue/South San Francisco | 100 | % | 136,977 | 300,930 | — | — | — | 300,930 | |||||||||||||||||||||||
| 279 East Grand Avenue/South San Francisco | 100 | % | 60,887 | 211,405 | — | — | — | 211,405 | |||||||||||||||||||||||
| 1655 and 1725 Third Street/Mission Bay/SoMa | 10 | % | — | (2) | 593,765 | — | — | — | 593,765 | ||||||||||||||||||||||
| Menlo Gateway/Greater Stanford | 25.2 | % | — | (2) | 520,988 | — | — | — | 520,988 | ||||||||||||||||||||||
| Alexandria PARC/Greater Stanford | 100 | % | 29,216 | 45,115 | — | — | — | 45,115 | |||||||||||||||||||||||
| Near-term projects undergoing marketing and pre-construction | |||||||||||||||||||||||||||||||
| 825 and 835 Industrial Road/Greater Stanford | 100 | % | 94,075 | — | 530,000 | — | — | 530,000 | |||||||||||||||||||||||
| 201 Haskins Way/South San Francisco | 100 | % | 40,883 | — | 280,000 | — | — | 280,000 | |||||||||||||||||||||||
681 Gateway Boulevard/South San Francisco(3) | 100 | % | — | — | 126,971 | — | — | 126,971 | |||||||||||||||||||||||
| Intermediate-term development | |||||||||||||||||||||||||||||||
| 88 Bluxome Street/Mission Bay/SoMa | 100 | % | 164,966 | — | — | 1,070,925 | (1) | — | 1,070,925 | ||||||||||||||||||||||
| 505 Brannan Street, Phase II/Mission Bay/SoMa | 99.7 | % | 15,879 | — | — | 165,000 | — | 165,000 | |||||||||||||||||||||||
| 960 Industrial Road/Greater Stanford | 100 | % | 70,636 | — | — | 500,000 | (1) | — | 500,000 | ||||||||||||||||||||||
| Future development | |||||||||||||||||||||||||||||||
| East Grand Avenue/South San Francisco | 100 | % | 5,988 | — | — | — | 90,000 | 90,000 | |||||||||||||||||||||||
| Other future projects | 100 | % | 356 | — | — | — | 95,620 | 95,620 | |||||||||||||||||||||||
| 619,863 | 1,672,203 | 936,971 | 1,735,925 | 185,620 | 4,530,719 | ||||||||||||||||||||||||||
| New York City | |||||||||||||||||||||||||||||||
Alexandria Center® for Life Science/Manhattan | 100 | % | — | — | — | 420,000 | — | 420,000 | |||||||||||||||||||||||
| $ | — | — | — | 420,000 | — | 420,000 | |||||||||||||||||||||||||
(1) Represents total square footage upon completion of development of a new Class A property. RSF presented includes RSF of a building currently in operation that will be demolished upon commencement of construction. (2) This property is an unconsolidated real estate joint venture. See our share of the investment in real estate on page 42 of this Supplemental Information. (3) See page 36 of this Supplemental Information for additional information on our near-term redevelopment opportunity at this property. | |||||||||||||||||||||||||||||||
| New Class A Development and Redevelopment Properties: Summary of Pipeline (continued) | |
| March 31, 2018 | |
| (Dollars in thousands) | |
| Property/Submarket | Our Ownership Interest | Book Value | Square Footage | ||||||||||||||||||||||||||||
| Development Projects | |||||||||||||||||||||||||||||||
| Undergoing Construction | Near-Term Projects Undergoing Marketing and Pre-Construction | Intermediate- Term Development | Future Development | Total(1) | |||||||||||||||||||||||||||
| San Diego | |||||||||||||||||||||||||||||||
| Undergoing construction | |||||||||||||||||||||||||||||||
| 9625 Towne Centre Drive/University Town Center | 54.7 | % | $ | 45,758 | 163,648 | — | — | — | 163,648 | ||||||||||||||||||||||
| Near-term projects undergoing marketing and pre-construction | |||||||||||||||||||||||||||||||
| 9880 Campus Point Drive/University Town Center | 100 | % | 43,132 | — | 98,000 | — | — | 98,000 | |||||||||||||||||||||||
| Intermediate-term development | |||||||||||||||||||||||||||||||
| 5200 Illumina Way/University Town Center | 100 | % | 11,814 | — | — | 386,044 | — | 386,044 | |||||||||||||||||||||||
| Campus Point Drive/University Town Center | 55 | % | 15,216 | — | — | 318,383 | — | 318,383 | |||||||||||||||||||||||
| Future development | |||||||||||||||||||||||||||||||
| Vista Wateridge/Sorrento Mesa | 100 | % | 4,021 | — | — | — | 163,000 | 163,000 | |||||||||||||||||||||||
| Other future projects | 100 | % | 30,717 | — | — | — | 309,895 | 309,895 | |||||||||||||||||||||||
| 150,658 | 163,648 | 98,000 | 704,427 | 472,895 | 1,438,970 | ||||||||||||||||||||||||||
| Seattle | |||||||||||||||||||||||||||||||
| Near-term projects undergoing marketing and pre-construction | |||||||||||||||||||||||||||||||
| 1818 Fairview Avenue East/Lake Union | 100 | % | 45,946 | — | 205,000 | — | — | 205,000 | |||||||||||||||||||||||
| Intermediate-term development | |||||||||||||||||||||||||||||||
| 1150 Eastlake Avenue East/Lake Union | 100 | % | 19,704 | — | — | 260,000 | — | 260,000 | |||||||||||||||||||||||
| 1165/1166 Eastlake Avenue East/Lake Union | 100 | % | 15,612 | — | — | 106,000 | — | — | 106,000 | ||||||||||||||||||||||
| 81,262 | — | 205,000 | 366,000 | — | 571,000 | ||||||||||||||||||||||||||
| Maryland | |||||||||||||||||||||||||||||||
| Undergoing construction | |||||||||||||||||||||||||||||||
| 9900 Medical Center Drive/Rockville | 100 | % | 8,040 | 45,039 | — | — | — | 45,039 | |||||||||||||||||||||||
| 704 Quince Orchard Road/Gaithersburg | 56.8 | % | — | (2) | 58,186 | — | — | — | 58,186 | ||||||||||||||||||||||
| Intermediate-term development | |||||||||||||||||||||||||||||||
| 9800 Medical Center Drive/Rockville | 100 | % | 8,801 | — | — | 180,000 | — | 180,000 | |||||||||||||||||||||||
| Future development | |||||||||||||||||||||||||||||||
| Other future projects | 100 | % | 4,034 | — | — | — | 61,000 | 61,000 | |||||||||||||||||||||||
| 20,875 | 103,225 | — | 180,000 | 61,000 | 344,225 | ||||||||||||||||||||||||||
| Research Triangle Park | |||||||||||||||||||||||||||||||
| Undergoing construction | |||||||||||||||||||||||||||||||
| 5 Laboratory Drive/Research Triangle Park | 100 | % | 18,926 | 175,000 | — | — | — | 175,000 | |||||||||||||||||||||||
| Future development | |||||||||||||||||||||||||||||||
| 6 Davis Drive/Research Triangle Park | 100 | % | 16,773 | — | — | — | 1,000,000 | 1,000,000 | |||||||||||||||||||||||
| Other future projects | 100 | % | 4,149 | — | — | — | 76,262 | 76,262 | |||||||||||||||||||||||
| 39,848 | 175,000 | — | — | 1,076,262 | 1,251,262 | ||||||||||||||||||||||||||
| Non-cluster markets – other future projects | 100 | % | 15,376 | — | — | — | 571,705 | 571,705 | |||||||||||||||||||||||
| $ | 1,141,190 | 2,309,934 | 1,239,971 | 3,615,317 | 2,873,081 | 10,038,303 | |||||||||||||||||||||||||
| (1) | Represents total square footage upon completion of development of a new Class A property. RSF presented includes RSF of a building currently in operation that will be demolished upon commencement of construction. |
| (2) | This property is an unconsolidated real estate joint venture. See our share of the investment in real estate is on page 42 of our Supplemental Information. |
| Construction Spending | |
| March 31, 2018 | |
| (Dollars in thousands, except per RSF amounts) | |
| Construction Spending | Three Months Ended March 31, 2018 | ||||||
Additions to real estate – consolidated projects | $ | 206,404 | |||||
| Investments in unconsolidated real estate joint ventures | 22,325 | ||||||
Construction spending (cash basis)(1) | 228,729 | ||||||
| Increase in accrued construction | 19,565 | ||||||
| Construction spending | $ | 248,294 | |||||
| Projected Construction Spending | Year Ending December 31, 2018 | ||||||
| Development and redevelopment projects | $ | 632,000 | |||||
| Investments in unconsolidated real estate joint ventures | 110,000 | ||||||
| Contributions from noncontrolling interests (consolidated real estate joint ventures) | (28,000 | ) | |||||
| Generic laboratory infrastructure/building improvement projects | 117,000 | (2) | |||||
| Non-revenue-enhancing capital expenditures and tenant improvements | 20,000 | ||||||
| Projected construction spending for nine months ending December 31, 2018 | 851,000 | ||||||
| Actual construction spending for three months ended March 31, 2018 | 248,294 | ||||||
| Guidance range | $ | 1,050,000 | – | $1,150,000 | |||
Non-Revenue-Enhancing Capital Expenditures(3) | Three Months Ended March 31, 2018 | Recent Average per RSF(4) | ||||||||||||
| Amount | Per RSF | |||||||||||||
| Non-revenue-enhancing capital expenditures | $ | 2,625 | $ | 0.13 | $ | 0.51 | ||||||||
| Tenant improvements and leasing costs: | ||||||||||||||
| Re-tenanted space | $ | 2,753 | $ | 20.98 | $ | 19.30 | ||||||||
| Renewal space | 83 | 0.81 | (5) | 11.16 | ||||||||||
| Total tenant improvements and leasing costs/weighted average | $ | 2,836 | $ | 12.09 | $ | 13.99 | ||||||||
| (1) | Includes revenue-enhancing projects and non-revenue-enhancing capital expenditures. |
| (2) | Includes $10 million to $15 million of projected construction spending in 2018, related to the development of a new 98,000 RSF Class A office/laboratory property at 9880 Campus Point Drive in our University Town Center submarket. |
| (3) | Excludes amounts that are recoverable from tenants, revenue enhancing, or related to properties that have undergone redevelopment. |
| (4) | Represents the average for the five years ended December 31, 2017, and 1Q18. |
| (5) | Decrease from prior year primarily related to lower volume of leasing on spaces renewed during 1Q18. We expect tenant improvement and leasing costs incurred during 2018 to be consistent with prior year. |
| Joint Venture Financial Information | |
| March 31, 2018 | |
| (Dollars in thousands) | |
Consolidated Real Estate Joint Ventures (controlled by us through contractual rights or majority voting rights) | Unconsolidated Real Estate Joint Ventures (controlled jointly or by our JV partners through contractual rights or majority voting rights) | |||||||||||
| Property/Market/Submarket | Noncontrolling Interest Share(1) | Property/Market/Submarket | Our Ownership Share | |||||||||
| 225 Binney Street/Greater Boston/Cambridge | 70.0 | % | 360 Longwood Avenue/Greater Boston/Longwood Medical Area | 27.5 | % | |||||||
| 409 and 499 Illinois Street/San Francisco/Mission Bay/SoMa | 40.0 | % | 1655 and 1725 Third Street/San Francisco/Mission Bay/SoMa | 10.0 | % | |||||||
| 1500 Owens Street/San Francisco/Mission Bay/SoMa | 49.9 | % | Menlo Gateway/San Francisco/Greater Stanford | 25.2 | % | (2) | ||||||
| Campus Pointe by Alexandria/San Diego/University Town Center | 45.0 | % | 1401/1413 Research Boulevard/Maryland/Rockville | 65.0 | % | (3) | ||||||
| 9625 Towne Centre Drive/San Diego/University Town Center | 45.3 | % | (4) | 704 Quince Orchard Road/Maryland/Gaithersburg | 56.8 | % | (3) | |||||
| March 31, 2018 | |||||||||
| Noncontrolling Interest Share of Consolidated Real Estate JVs | Our Share of Unconsolidated Real Estate JVs | ||||||||
| Investments in real estate | $ | 509,536 | $ | 225,240 | |||||
| Cash and cash equivalents | 21,373 | 4,193 | |||||||
| Restricted cash | — | 1,139 | |||||||
| Other assets | 33,229 | 20,029 | |||||||
Secured notes payable (see page 47) | — | (68,194 | ) | ||||||
| Other liabilities | (25,388 | ) | (12,542 | ) | |||||
| Redeemable noncontrolling interests | (10,212 | ) | — | ||||||
| $ | 528,538 | $ | 169,865 | ||||||
| Three months ended March 31, 2018 | |||||||||
| Noncontrolling Interest Share of Consolidated Real Estate JVs | Our Share of Unconsolidated Real Estate JVs | ||||||||
| Total revenues | $ | 13,491 | $ | 2,461 | |||||
| Rental operations | (3,903 | ) | (416 | ) | |||||
| 9,588 | 2,045 | ||||||||
| General and administrative | (47 | ) | (25 | ) | |||||
| Interest | — | (232 | ) | ||||||
| Depreciation and amortization | (3,867 | ) | (644 | ) | |||||
| $ | 5,674 | $ | 1,144 | ||||||
| (1) | In addition to the consolidated real estate joint ventures listed, various partners hold insignificant noncontrolling interests in three other properties in North America. |
| (2) | As of 1Q18, we have an ownership interest in Menlo Gateway of 25.2% and expect our ownership to increase to 49% through future funding of construction costs by 1Q19. |
| (3) | Represents our ownership interest; our voting interest is limited to 50%. |
| (4) | As of 1Q18, our partner’s ownership interest is 45.3% and is expected to increase to 49.9% by the end of 2Q18 through additional capital contributions to fund construction. |
| Investments | |
| March 31, 2018 | |
| (Dollars in thousands) | |
Adoption of new accounting standard on financial instruments
On January 1, 2018, we adopted a new accounting standard which requires us, on a prospective basis, to present our equity investments at fair value whenever fair value is readily available or observable. In 1Q18, we recognized within earnings approximately $72 million of unrealized gains from changes in fair value of investments in publicly traded companies and investments in privately held entities without readily determinable fair values. See “Definitions and Reconciliations” on page 50 for information related to our adoption of this new accounting standard.
| Public/Private Mix (Cost) | Tenant/Non-Tenant Mix (Cost) | 272 | ||||
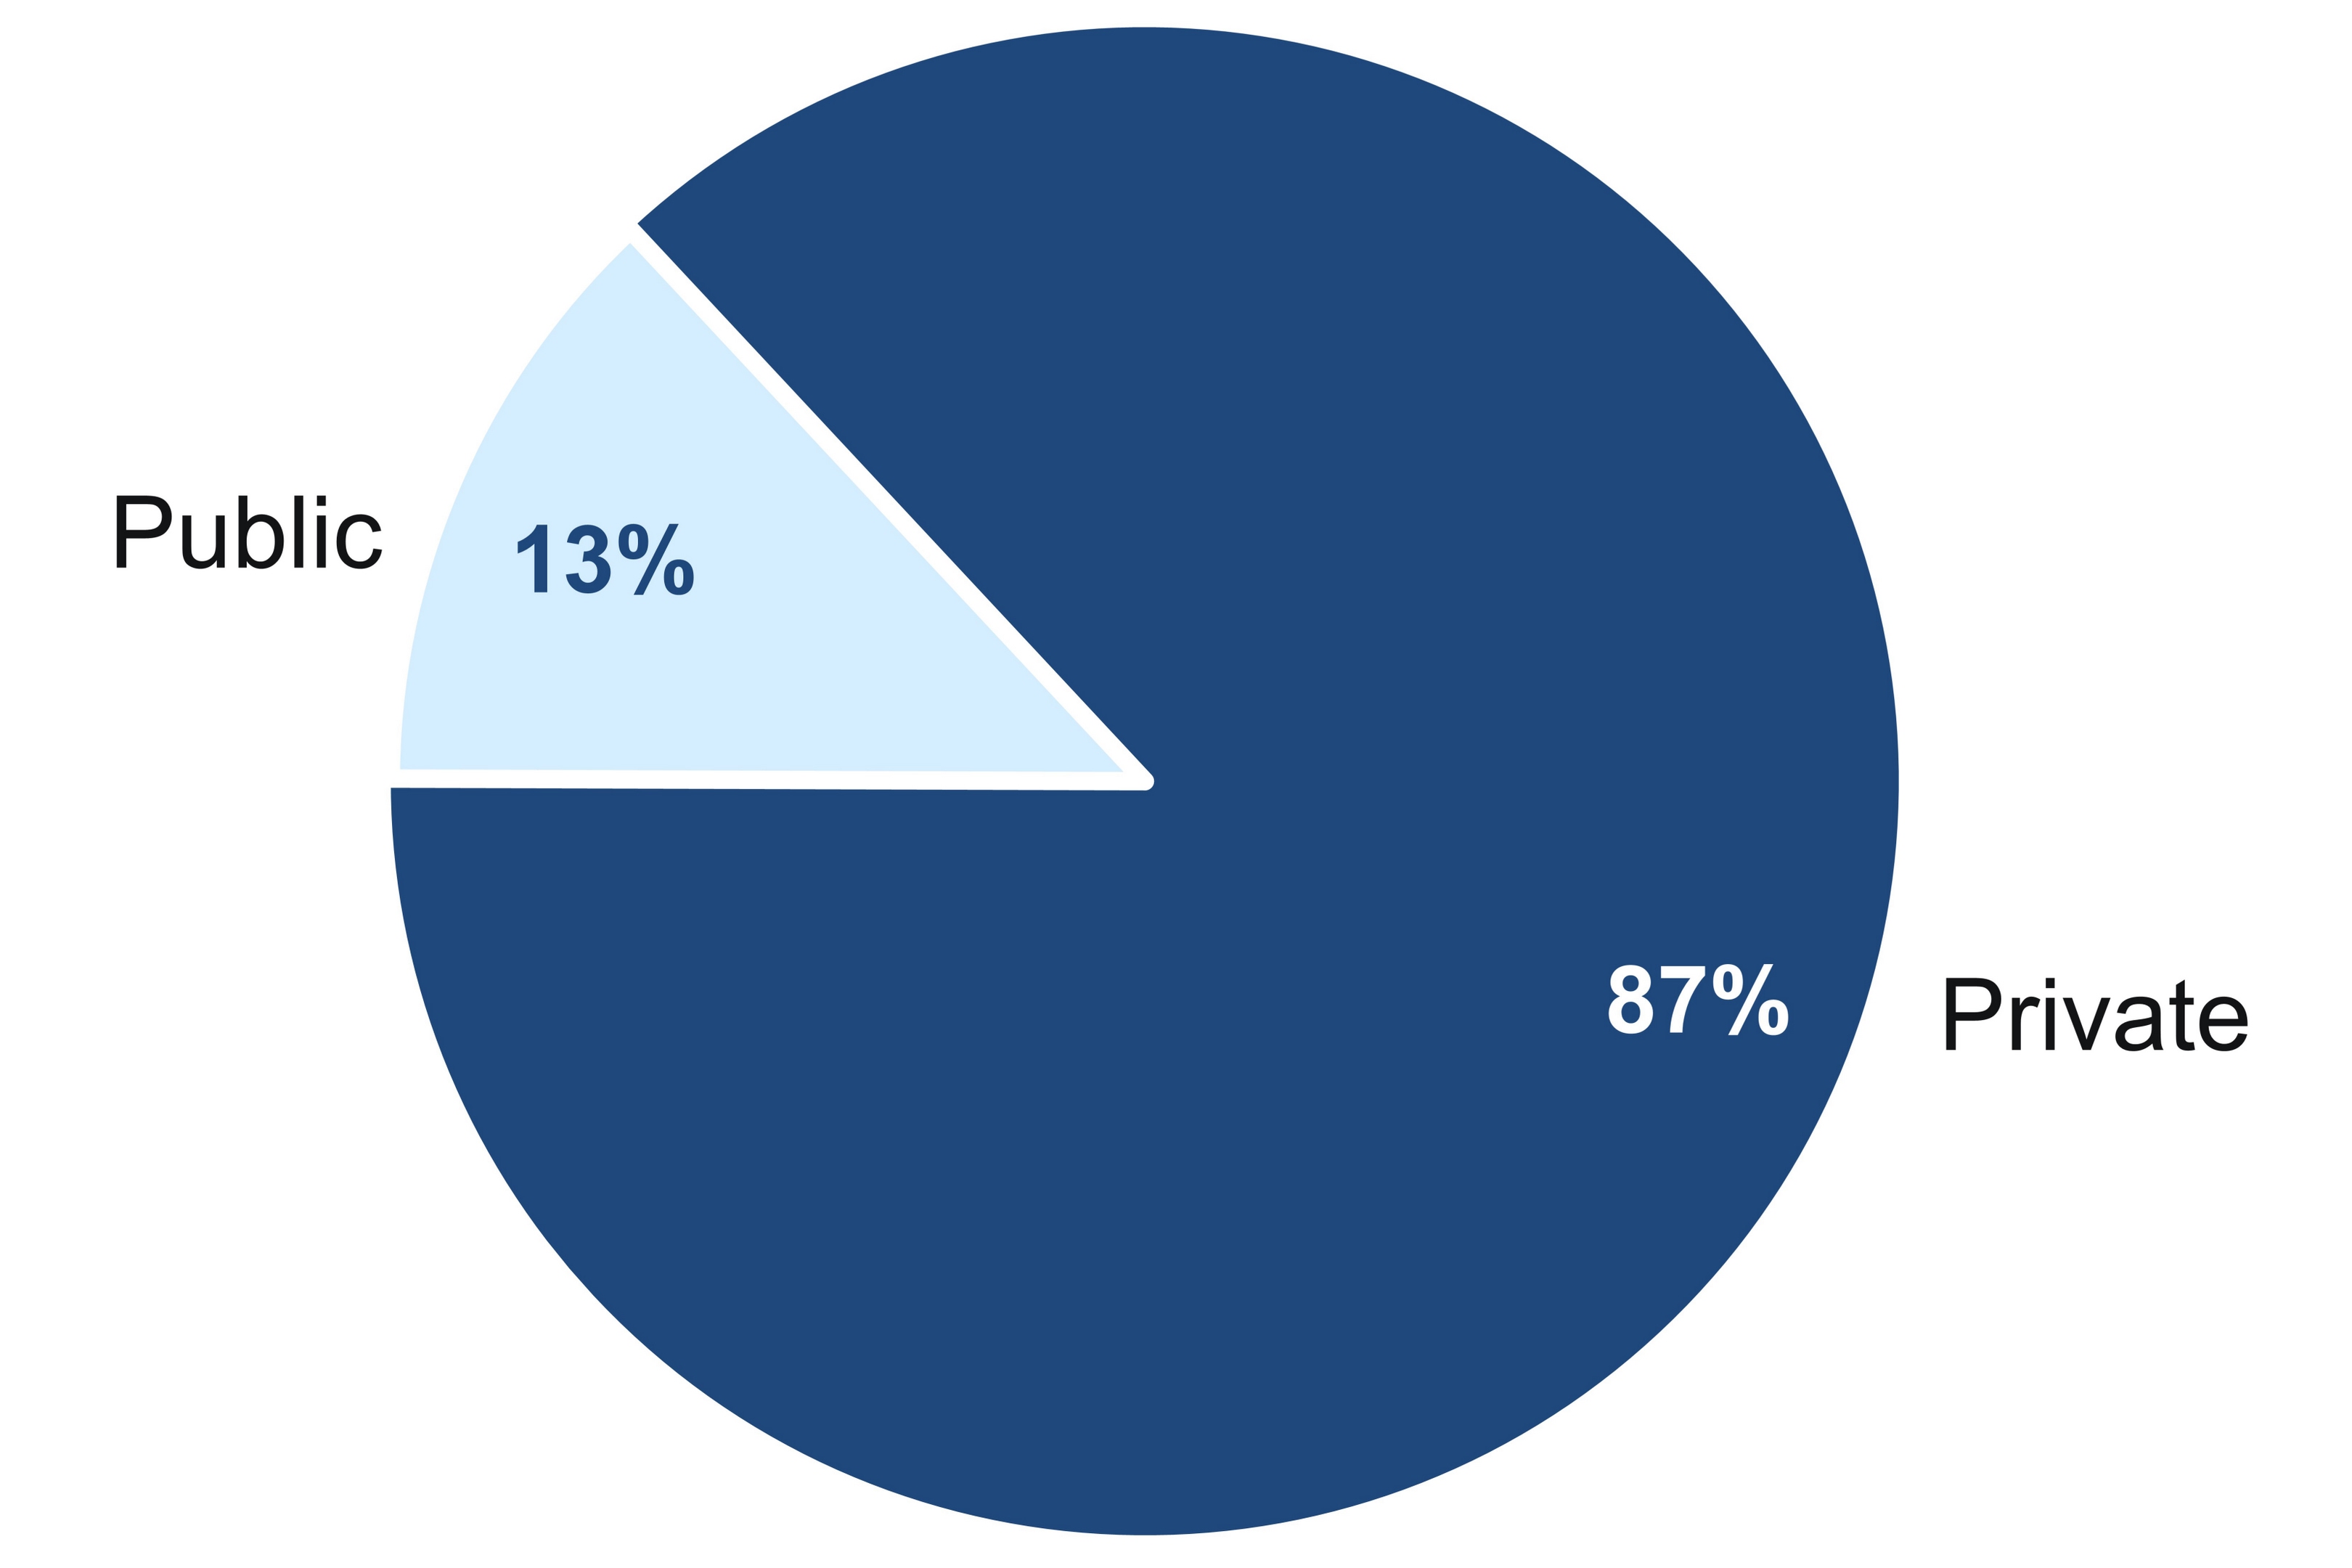 | 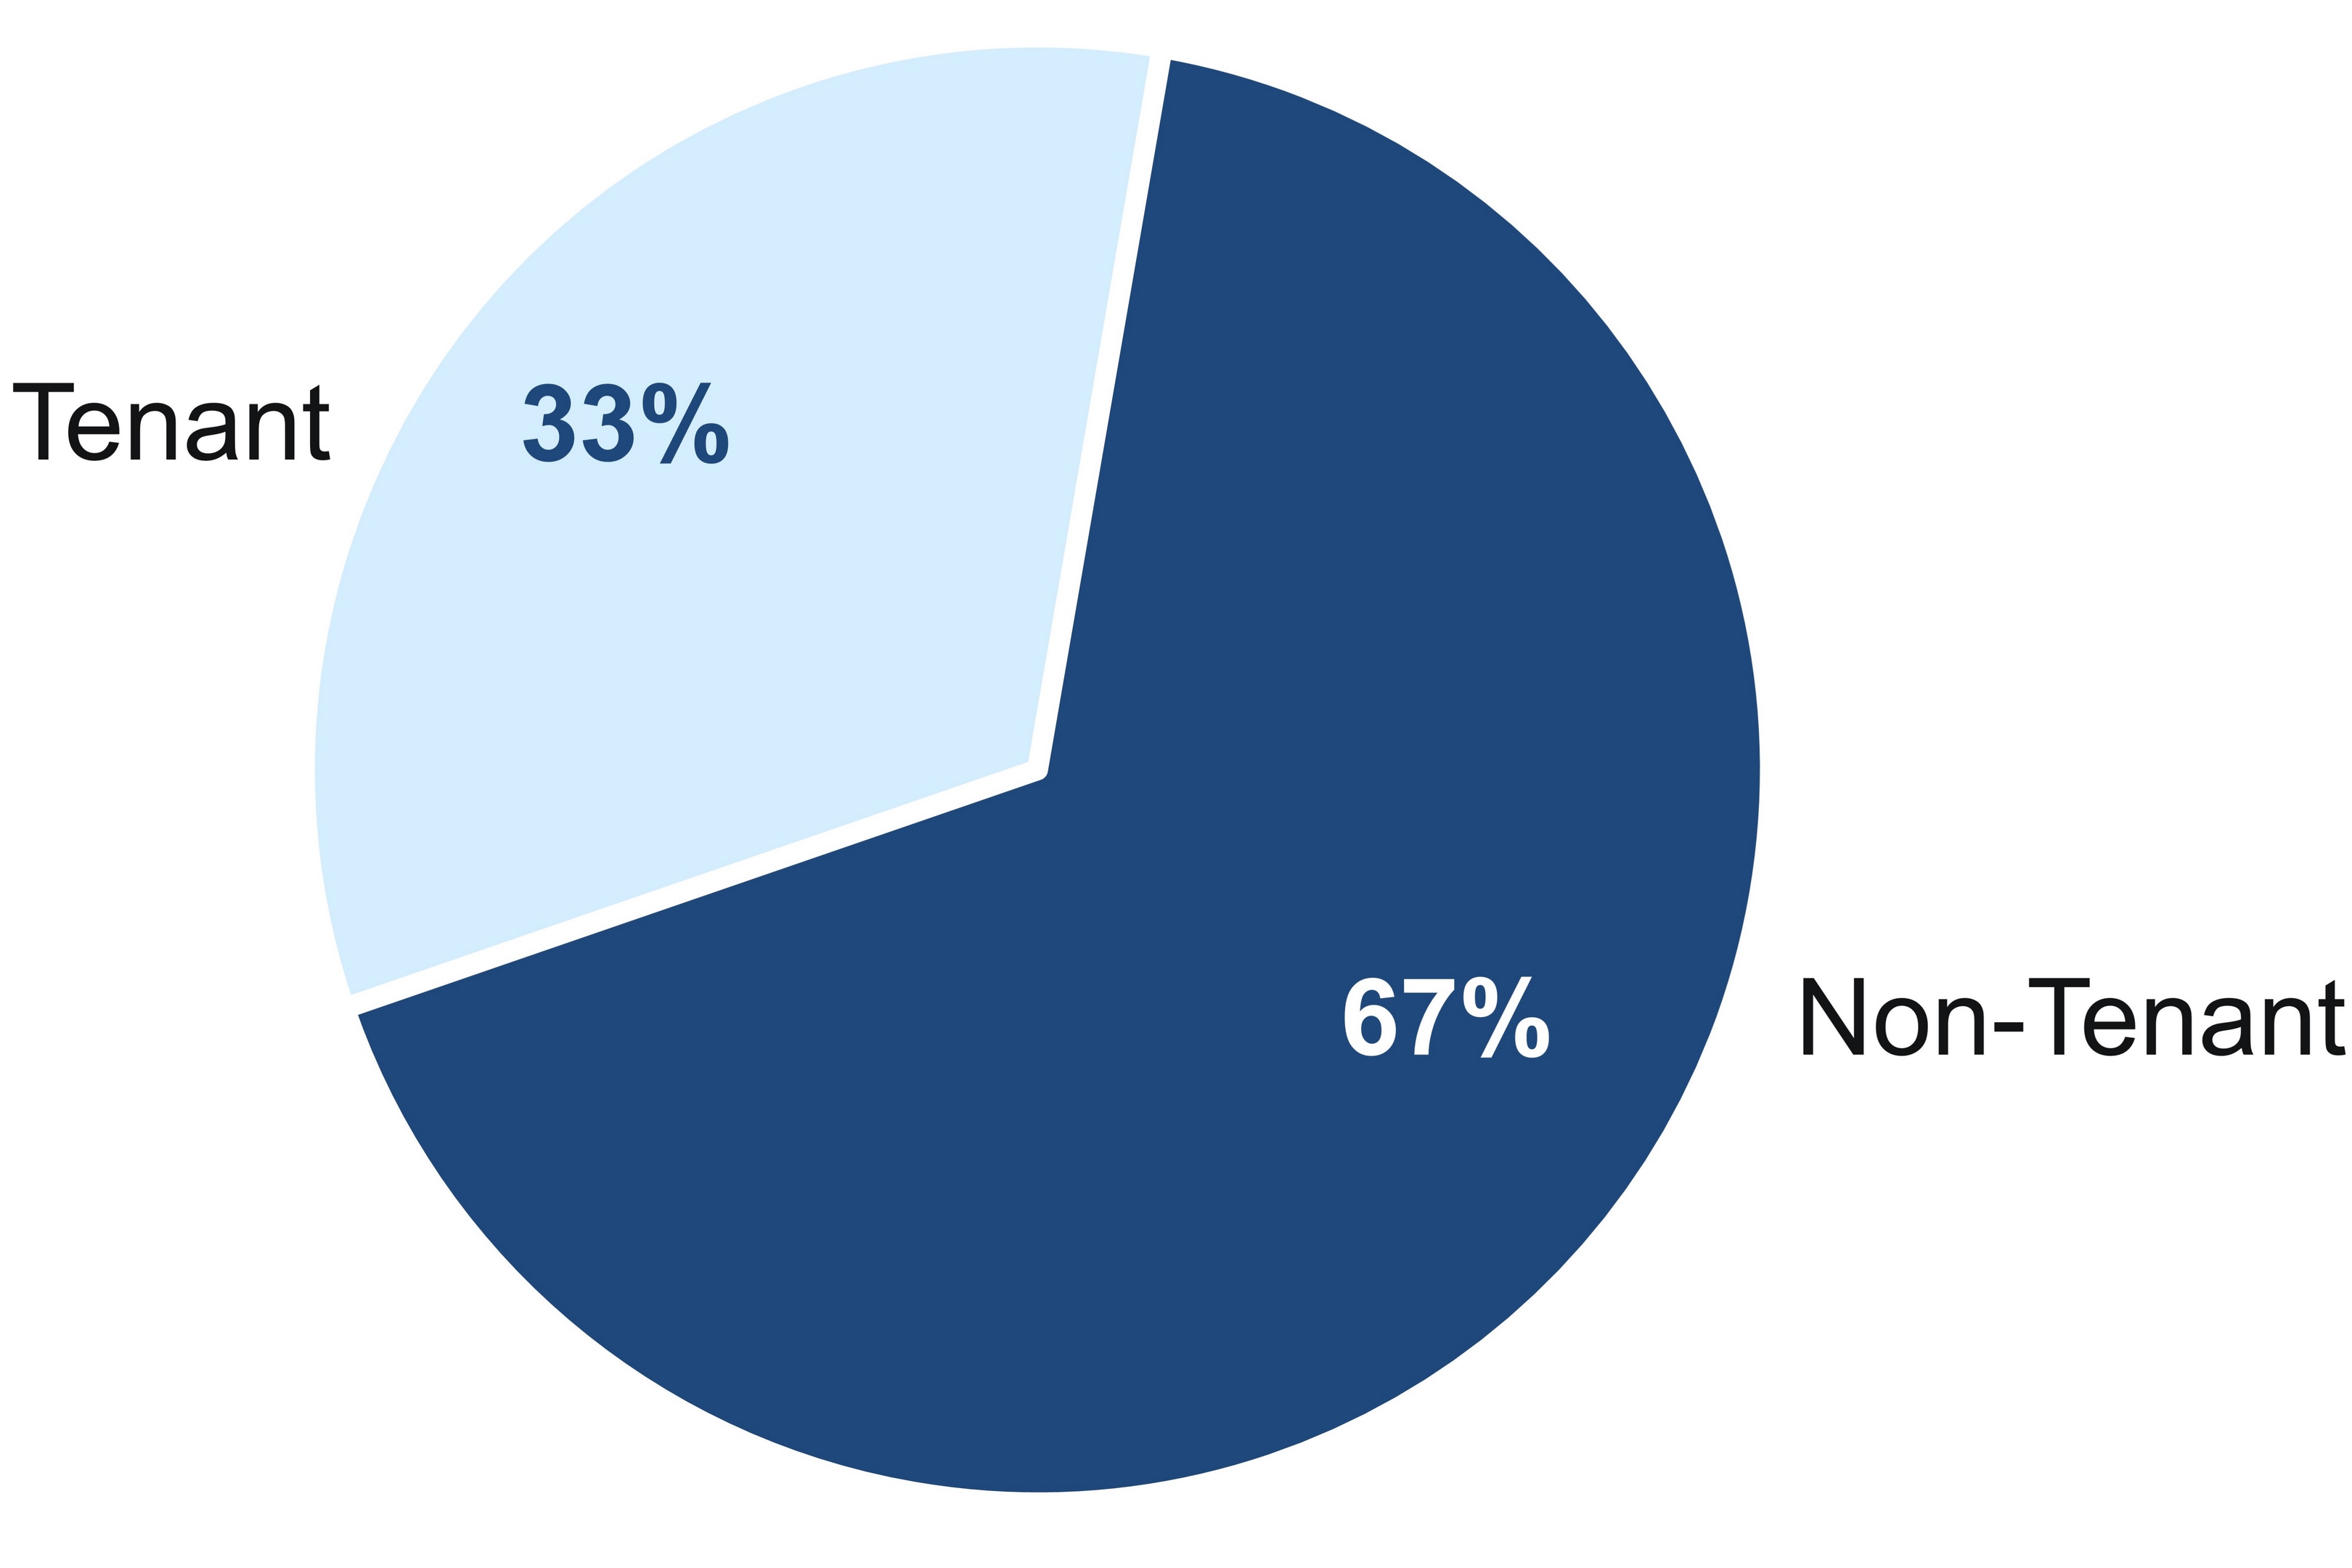 | |||||
| Holdings | ||||||
| $1.9M | ||||||
| Average Investment Cost | ||||||
| 1Q18 Investment Income | As of March 31, 2018 | Cost | Unrealized Gains | Total | ||||||||||||||
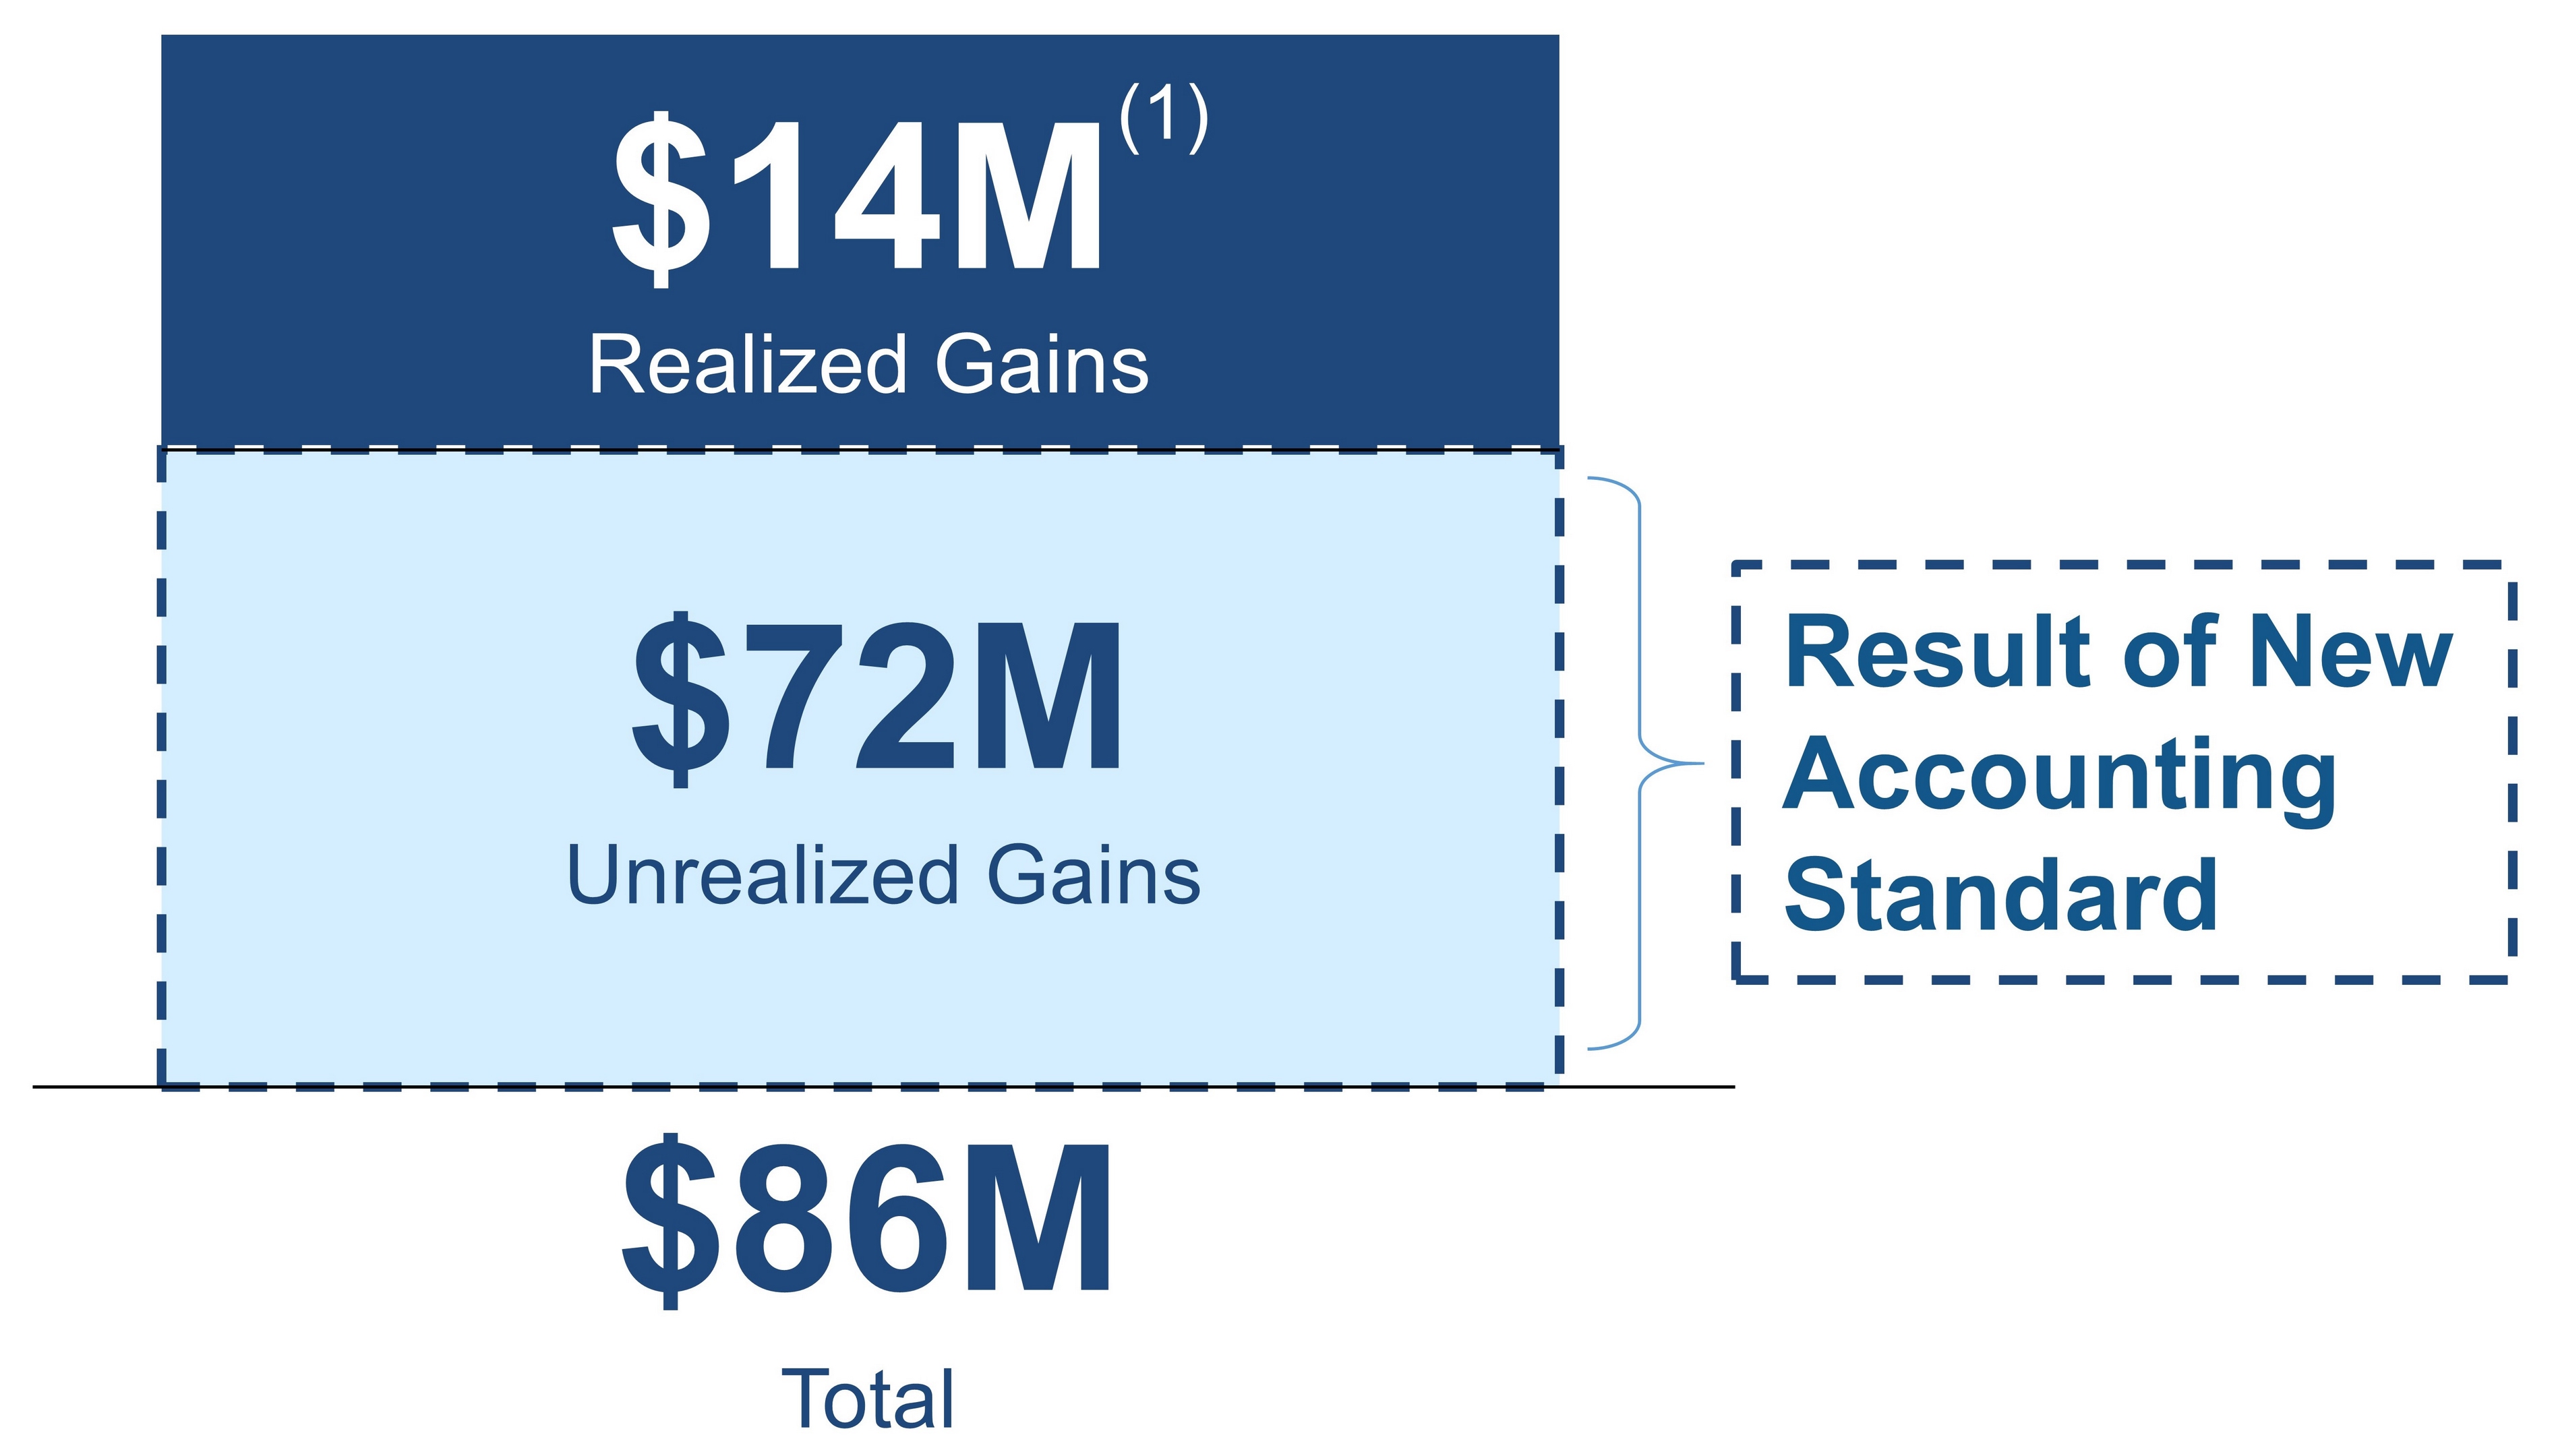 | Publicly traded companies | $ | 67,801 | $ | 95,870 | $ | 163,671 | |||||||||||
| Privately held entities without readily determinable fair values: | ||||||||||||||||||
| Entities that report NAV | 159,231 | 106,235 | (2) | 265,466 | ||||||||||||||
| Entities that do not report NAV: | ||||||||||||||||||
| Entities with observable price changes since 1/1/18 | 23,491 | 11,043 | (3) | 34,534 | ||||||||||||||
| Entities without observable price changes since 1/1/18 | 260,639 | — | 260,639 | |||||||||||||||
| Total | $ | 511,162 | $ | 213,148 | $ | 724,310 | ||||||||||||
| As of December 31, 2017 | Cost | Unrealized Gains | Total | |||||||||||||||
| Publicly traded companies | $ | 59,740 | $ | 49,771 | $ | 109,511 | ||||||||||||
| Privately held entities without readily determinable fair values: | ||||||||||||||||||
| Entities that report NAV | 148,627 | N/A | 148,627 | |||||||||||||||
| Entities that do not report NAV | 265,116 | N/A | 265,116 | |||||||||||||||
| Total | $ | 473,483 | $ | 49,771 | $ | 523,254 | ||||||||||||
| (1) | Includes an $8.3 million gain related to one publicly traded non-real estate investment in a life science entity. |
| (2) | Represents fair value adjustments (using reported NAV per share as a practical expedient to fair value) for our limited partnership investments. See definition for “Investments” on page 50 for additional information on NAV as a practical expedient. |
| (3) | Represents fair value adjustments for seven private investments that had observable price changes during 1Q18. See definition for “Investments” on page 50 for additional information on observable price changes. |
| |
| Key Credit Metrics | |
| March 31, 2018 | |
Net Debt to Adjusted EBITDA(1) | Net Debt and Preferred Stock to Adjusted EBITDA(1) | |||||
 | ||||||
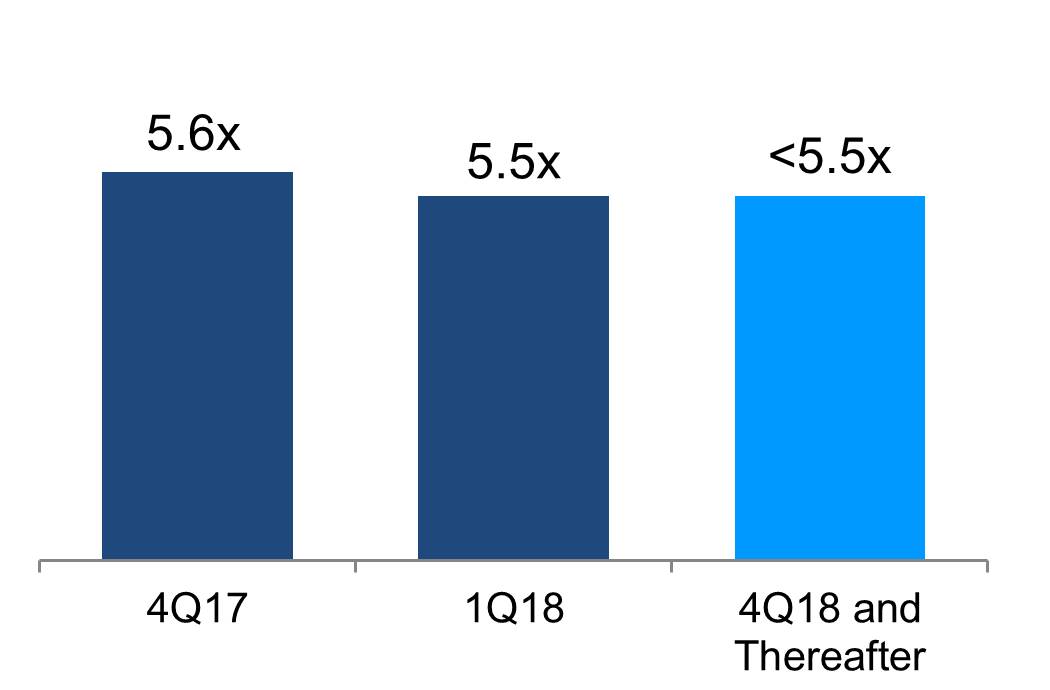 | ||||||
Fixed-Charge Coverage Ratio(1) | Liquidity(2) | |||||
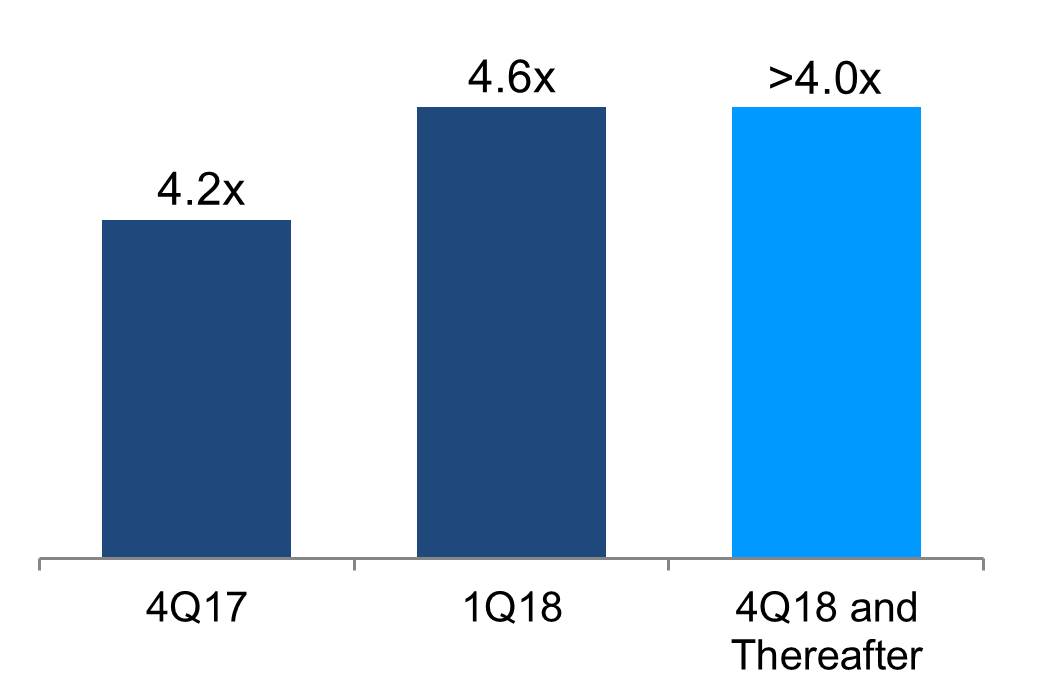 | ||||||
| $2.3B | ||||||
| (in millions) | ||||||
| Availability under our $1.65 billion unsecured senior line of credit | $ | 1,160 | ||||
| Outstanding forward equity sales agreements | 714 | |||||
| Cash, cash equivalents, and restricted cash | 259 | |||||
| Investments in publicly traded companies | 163 | |||||
| Remaining construction loan commitments | 19 | |||||
| $ | 2,315 | |||||
| (1) | Quarter annualized. |
| (2) | As of 1Q18. |
| |
| Summary of Debt | |
| March 31, 2018 | |
Debt maturities chart
(In millions)
 | ||
| (1) | Includes our secured construction loan for our property at 50 and 60 Binney Street in our Cambridge submarket with aggregate commitments of $350.0 million. We have two one-year options to extend the stated maturity date to January 28, 2021, subject to certain conditions. Our sources and uses guidance on page 5 assumes repayment of our 2019 unsecured senior bank term loan amounts aggregating $200.0 million in 2018. |
Fixed-rate/hedged and unhedged variable-rate debt
(Dollars in thousands)
Fixed-Rate/Hedged Variable-Rate Debt | Unhedged Variable-Rate Debt | Total | Percentage | Weighted-Average | |||||||||||||||
Interest Rate(1) | Remaining Term (in years) | ||||||||||||||||||
| Secured notes payable | $ | 444,228 | $ | 331,461 | $ | 775,689 | 14.9 | % | 4.08 | % | 3.0 | ||||||||
| Unsecured senior notes payable | 3,396,912 | — | 3,396,912 | 65.2 | 4.06 | 6.6 | |||||||||||||
| $1.65 billion unsecured senior line of credit | 50,000 | 440,000 | 490,000 | 9.4 | 2.53 | 3.6 | |||||||||||||
| 2019 Unsecured Senior Bank Term Loan | 199,622 | — | 199,622 | 3.8 | 2.77 | 0.8 | |||||||||||||
| 2021 Unsecured Senior Bank Term Loan | 348,575 | — | 348,575 | 6.7 | 2.56 | 2.8 | |||||||||||||
| Total/weighted average | $ | 4,439,337 | $ | 771,461 | $ | 5,210,798 | 100.0 | % | 3.77 | % | 5.3 | ||||||||
| Percentage of total debt | 85 | % | 15 | % | (2) | 100 | % | ||||||||||||
| (1) | Represents the weighted-average interest rate as of the end of the applicable period, including expense/income related to our interest rate hedge agreements, amortization of loan fees, amortization of debt premiums (discounts), and other bank fees. |
| (2) | Our key credit metrics guidance assumes the reduction of our unhedged variable-rate debt to 5% in by 4Q18. |
| Summary of Debt (continued) | |
| March 31, 2018 | |
| (Dollars in thousands) | |
| Debt | Stated Rate | Interest Rate(1) | Maturity Date(2) | Principal Payments Remaining for the Periods Ending December 31, | Principal | Unamortized (Deferred Financing Cost), (Discount)/Premium | Total | |||||||||||||||||||||||||||||||||||||||
| 2018 | 2019 | 2020 | 2021 | 2022 | Thereafter | |||||||||||||||||||||||||||||||||||||||||
| Secured notes payable | ||||||||||||||||||||||||||||||||||||||||||||||
| Greater Boston | L+1.50 | % | 3.36 | % | 1/28/19 | (3) | $ | — | $ | 331,461 | $ | — | $ | — | $ | — | $ | — | $ | 331,461 | $ | (998 | ) | $ | 330,463 | |||||||||||||||||||||
| Greater Boston, San Diego, Seattle, and Maryland | 7.75 | % | 8.12 | 4/1/20 | 1,499 | 2,138 | 104,352 | — | — | — | 107,989 | (668 | ) | 107,321 | ||||||||||||||||||||||||||||||||
| San Diego | 4.66 | % | 4.90 | 1/1/23 | 1,078 | 1,686 | 1,762 | 1,852 | 1,942 | 26,259 | 34,579 | (313 | ) | 34,266 | ||||||||||||||||||||||||||||||||
| Greater Boston | 3.93 | % | 3.19 | 3/10/23 | 1,091 | 1,505 | 1,566 | 1,628 | 1,693 | 74,517 | 82,000 | 2,697 | 84,697 | |||||||||||||||||||||||||||||||||
| Greater Boston | 4.82 | % | 3.39 | 2/6/24 | 2,178 | 3,078 | 3,204 | 3,392 | 3,561 | 187,281 | 202,694 | 15,475 | 218,169 | |||||||||||||||||||||||||||||||||
| San Francisco | 6.50 | % | 6.67 | 7/1/36 | 22 | 23 | 25 | 26 | 28 | 649 | 773 | — | 773 | |||||||||||||||||||||||||||||||||
| Secured debt weighted-average interest rate/subtotal | 4.51 | % | 4.08 | 5,868 | 339,891 | 110,909 | 6,898 | 7,224 | 288,706 | 759,496 | 16,193 | 775,689 | ||||||||||||||||||||||||||||||||||
| 2019 Unsecured Senior Bank Term Loan | L+1.20 | % | 2.77 | 1/3/19 | — | 200,000 | — | — | — | — | 200,000 | (378 | ) | 199,622 | ||||||||||||||||||||||||||||||||
| 2021 Unsecured Senior Bank Term Loan | L+1.10 | % | 2.56 | 1/15/21 | — | — | — | 350,000 | — | — | 350,000 | (1,425 | ) | 348,575 | ||||||||||||||||||||||||||||||||
| $1.65 billion unsecured senior line of credit | L+1.00 | % | 2.53 | 10/29/21 | — | — | — | 490,000 | — | — | 490,000 | — | 490,000 | |||||||||||||||||||||||||||||||||
| Unsecured senior notes payable | 2.75 | % | 2.96 | 1/15/20 | — | — | 400,000 | — | — | — | 400,000 | (1,432 | ) | 398,568 | ||||||||||||||||||||||||||||||||
| Unsecured senior notes payable | 4.60 | % | 4.74 | 4/1/22 | — | — | — | — | 550,000 | — | 550,000 | (2,600 | ) | 547,400 | ||||||||||||||||||||||||||||||||
| Unsecured senior notes payable | 3.90 | % | 4.04 | 6/15/23 | — | — | — | — | — | 500,000 | 500,000 | (3,091 | ) | 496,909 | ||||||||||||||||||||||||||||||||
| Unsecured senior notes payable | 3.45 | % | 3.63 | 4/30/25 | — | — | — | — | — | 600,000 | 600,000 | (6,167 | ) | 593,833 | ||||||||||||||||||||||||||||||||
| Unsecured senior notes payable | 4.30 | % | 4.51 | 1/15/26 | — | — | — | — | — | 300,000 | 300,000 | (3,765 | ) | 296,235 | ||||||||||||||||||||||||||||||||
| Unsecured senior notes payable | 3.95 | % | 4.14 | 1/15/27 | — | — | — | — | — | 350,000 | 350,000 | (4,398 | ) | 345,602 | ||||||||||||||||||||||||||||||||
| Unsecured senior notes payable | 3.95 | % | 4.09 | 1/15/28 | — | — | — | — | — | 425,000 | 425,000 | (4,128 | ) | 420,872 | ||||||||||||||||||||||||||||||||
| Unsecured senior notes payable | 4.50 | % | 4.61 | 7/30/29 | — | — | — | — | — | 300,000 | 300,000 | (2,507 | ) | 297,493 | ||||||||||||||||||||||||||||||||
| Unsecured debt weighted average/subtotal | 3.72 | — | 200,000 | 400,000 | 840,000 | 550,000 | 2,475,000 | 4,465,000 | (29,891 | ) | 4,435,109 | |||||||||||||||||||||||||||||||||||
| Weighted-average interest rate/total | 3.77 | % | $ | 5,868 | $ | 539,891 | $ | 510,909 | $ | 846,898 | $ | 557,224 | $ | 2,763,706 | $ | 5,224,496 | $ | (13,698 | ) | $ | 5,210,798 | |||||||||||||||||||||||||
| Balloon payments | $ | — | $ | 531,461 | $ | 503,979 | $ | 840,000 | $ | 550,000 | $ | 2,758,724 | $ | 5,184,164 | $ | — | $ | 5,184,164 | ||||||||||||||||||||||||||||
| Principal amortization | 5,868 | 8,430 | 6,930 | 6,898 | 7,224 | 4,982 | 40,332 | (13,698 | ) | 26,634 | ||||||||||||||||||||||||||||||||||||
| Total debt | $ | 5,868 | $ | 539,891 | $ | 510,909 | $ | 846,898 | $ | 557,224 | $ | 2,763,706 | $ | 5,224,496 | $ | (13,698 | ) | $ | 5,210,798 | |||||||||||||||||||||||||||
| Fixed-rate/hedged variable-rate debt | $ | 5,868 | $ | 208,430 | $ | 510,909 | $ | 406,898 | $ | 557,224 | $ | 2,763,706 | $ | 4,453,035 | $ | (13,698 | ) | $ | 4,439,337 | |||||||||||||||||||||||||||
| Unhedged variable-rate debt | — | 331,461 | — | 440,000 | — | — | 771,461 | — | 771,461 | |||||||||||||||||||||||||||||||||||||
| Total debt | $ | 5,868 | $ | 539,891 | $ | 510,909 | $ | 846,898 | $ | 557,224 | $ | 2,763,706 | $ | 5,224,496 | $ | (13,698 | ) | $ | 5,210,798 | |||||||||||||||||||||||||||
| (1) | Represents the weighted-average interest rate as of the end of the applicable period, including expense/income related to our interest rate hedge agreements, amortization of loan fees, amortization of debt premiums (discounts), and other bank fees. |
| (2) | Reflects any extension options that we control. |
| (3) | Secured construction loan for our property at 50 and 60 Binney Street in our Cambridge submarket with aggregate commitments of $350.0 million. We have two one-year options to extend the stated maturity date to January 28, 2021, subject to certain conditions. As of 1Q18, the aggregate remaining commitments were $18.5 million. |
| Summary of Debt (continued) | |
| March 31, 2018 | |
| (Dollars in thousands) | |
| Unconsolidated real estate joint ventures’ debt | |||||||||||||||||||||||||
| 100% at JV Level | |||||||||||||||||||||||||
| Unconsolidated Joint Venture | Our Share | Initial Maturity Date | Extension Option Maturity Date(1) | Stated Interest Rate(2) | Interest Rate(2)(3) | Debt Balance(4) | Remaining Commitments | ||||||||||||||||||
| 360 Longwood Avenue | 27.5 | % | 9/1/22 | 9/1/24 | 3.32% | 3.61 | % | $ | 94,091 | $ | 17,000 | (5) | |||||||||||||
| 1655 and 1725 Third Street | 10.0 | % | 6/29/21 | 6/29/24 | L+3.70% | 4.82 | % | 42,197 | 332,803 | ||||||||||||||||
| Menlo Gateway, Phase I | 25.2 | % | (6) | 3/1/19 | 3/3/20 | L+2.50% | 4.11 | % | 124,382 | 23,454 | |||||||||||||||
| 1401/1413 Research Boulevard | 65.0 | % | 5/17/20 | 7/1/20 | L+2.50% | 5.11 | % | 9,784 | 14,733 | ||||||||||||||||
| 704 Quince Orchard Road | 56.8 | % | 3/16/23 | N/A | L+1.95% | 4.26 | % | 836 | 13,979 | ||||||||||||||||
| $ | 271,290 | $ | 401,969 | ||||||||||||||||||||||
| Loan closed in April 2018 | |||||||||||||||||||||||||
| Menlo Gateway, Phase II | 25.2 | % | (6) | 5/1/35 | N/A | 4.53% | N/A | $ | — | $ | 157,270 | ||||||||||||||
| (1) | Reflects extension options that exist, which may be subject to certain conditions. |
| (2) | For acquired loans, interest rate includes adjustments to reflect our effective borrowing costs at the time of acquisition. |
| (3) | Represents interest rate, including interest expense and amortization of loan fees and discount/premium as of 1Q18. |
| (4) | Represents outstanding principal, net of unamortized deferred financing costs and discount/premium. |
| (5) | The remaining loan commitment balance excludes an earn-out advance provision that allows for incremental borrowings up to $48.0 million, subject to certain conditions. |
| (6) | See page 42 of this Supplemental Information for additional information. |
| Debt covenants | ||||||||
Debt Covenant Ratios(1) | Unsecured Senior Notes Payable | $1.65 Billion Unsecured Senior Line of Credit and Unsecured Senior Bank Term Loans | ||||||
| Requirement | March 31, 2018 | Requirement | March 31, 2018 | |||||
| Total Debt to Total Assets | ≤ 60% | 36% | ≤ 60.0% | 29.6% | ||||
| Secured Debt to Total Assets | ≤ 40% | 5% | ≤ 45.0% | 4.4% | ||||
| Consolidated EBITDA to Interest Expense | ≥ 1.5x | 5.7x | ≥ 1.50x | 4.07x | ||||
| Unencumbered Total Asset Value to Unsecured Debt | ≥ 150% | 266% | N/A | N/A | ||||
| Unsecured Leverage Ratio | N/A | N/A | ≤ 60.0% | 32.7% | ||||
| Unsecured Interest Coverage Ratio | N/A | N/A | ≥ 1.50x | 6.70x | ||||
| (1) | All covenant ratio titles utilize terms as defined in the respective debt agreements; therefore, EBITDA is not calculated under the definition set forth by the SEC in Exchange Act Release No. 47226. |
| Interest rate swap agreements | |||||||||||||||||||||||
| Effective Date | Maturity Date | Number of Contracts | Weighted-Average Interest Pay Rate(1) | Fair Value as of 3/31/18 | Notional Amount in Effect as of | ||||||||||||||||||
| 3/31/18 | 12/31/18 | 12/31/19 | |||||||||||||||||||||
| March 29, 2018 | March 31, 2019 | 8 | 1.16% | $ | 5,813 | $ | 600,000 | $ | 600,000 | $ | — | ||||||||||||
| March 29, 2019 | March 31, 2020 | 1 | 1.89% | 648 | — | — | 100,000 | ||||||||||||||||
| Total | $ | 6,461 | $ | 600,000 | $ | 600,000 | $ | 100,000 | |||||||||||||||
| (1) | In addition to the interest pay rate for each swap agreement, interest is payable at an applicable margin over LIBOR for borrowings outstanding as of 1Q18, as listed under the column heading “Stated Rate” in our summary table of outstanding indebtedness and respective principal payments on the previous page. |
| |
| Definitions and Reconciliations | |
| March 31, 2018 | |
This section contains additional information for sections throughout this Supplemental Information package, as well as explanations and reconciliations of certain non-GAAP financial measures and the reasons why we use these supplemental measures of performance and believe they provide useful information to investors. Additional detail can be found in our most recent annual report on Form 10-K and subsequent quarterly reports on Form 10-Q, as well as other documents filed with or furnished to the SEC from time to time.
Adjusted EBITDA and Adjusted EBITDA margins
The following table reconciles net income, the most directly comparable financial measure calculated and presented in accordance with GAAP, to Adjusted EBITDA:
| Three Months Ended | |||||||||||||||||||
| (Dollars in thousands) | 3/31/18 | 12/31/17 | 9/30/17 | 6/30/17 | 3/31/17 | ||||||||||||||
| Net income | $ | 141,518 | $ | 45,607 | $ | 59,546 | $ | 41,496 | $ | 47,555 | |||||||||
| Interest expense | 36,915 | 36,082 | 31,031 | 31,748 | 29,784 | ||||||||||||||
| Income taxes | 940 | 1,398 | 1,305 | 1,333 | 767 | ||||||||||||||
| Depreciation and amortization | 114,219 | 107,714 | 107,788 | 104,098 | 97,183 | ||||||||||||||
| Stock compensation expense | 7,248 | 6,961 | 7,893 | 5,504 | 5,252 | ||||||||||||||
| Loss on early extinguishment of debt | — | 2,781 | — | — | 670 | ||||||||||||||
| Gain on sales of real estate – rental properties | — | — | — | — | (270 | ) | |||||||||||||
| Our share of gain on sales of real estate from unconsolidated real estate JVs | — | — | (14,106 | ) | — | — | |||||||||||||
| Gain on sales of real estate – land parcels | — | — | — | (111 | ) | — | |||||||||||||
| Unrealized gain on non-real estate investments | (72,229 | ) | — | — | — | — | |||||||||||||
| Impairment of real estate and non-real estate investments | — | 3,805 | — | 4,694 | — | ||||||||||||||
| Adjusted EBITDA | $ | 228,611 | $ | 204,348 | $ | 193,457 | $ | 188,762 | $ | 180,941 | |||||||||
Revenues, as adjusted(1) | $ | 333,471 | $ | 302,596 | (2) | $ | 285,370 | $ | 277,550 | (2) | $ | 270,877 | |||||||
| Adjusted EBITDA margins | 69% | 68% | 68% | 68% | 67% | ||||||||||||||
| (1) | Revenues, as adjusted, includes realized gains or losses on non-real estate investments. We use revenues, as adjusted, in our calculation of Adjusted EBITDA margin. We believe using revenues, as adjusted, provides a more accurate Adjusted EBITDA margin calculation. |
| (2) | Excludes impairment charges aggregating $4.5 million and $3.8 million, primarily related to three non-real estate investments, during 2Q17 and 4Q17, respectively. We believe excluding impairment of non-real estate investments improves the comparability of the Adjusted EBITDA margins from period to period. |
We use Adjusted EBITDA as a supplemental performance measure of our operations, for financial and operational decision making, and as a supplemental or additional means of evaluating period-to-period comparisons on a consistent basis. Adjusted EBITDA is calculated as earnings before interest, taxes, depreciation, and amortization (“EBITDA”), excluding stock compensation expense, gains or losses on early extinguishment of debt, gains or losses on sales of real estate and land parcels, unrealized gains or losses on non-real estate investments, and impairments.
We believe Adjusted EBITDA provides investors with relevant and useful information, as it allows investors to evaluate our operating performance without having to account for differences recognized because of real estate investment and disposition decisions, financing decisions, capital structure, capital market transactions, and variances resulting from the volatility of market conditions outside of our control. For example, we exclude gains or losses on the early extinguishment of debt to allow investors to measure our performance independent of our capital structure and indebtedness. We believe that adjusting for the effects of impairments and gains or losses on sales of real estate allows investors to evaluate performance from period to period on a consistent basis without having to account for differences recognized because of real estate investment and disposition decisions. We believe that excluding charges related to share-based compensation and unrealized gains or losses on non-real estate investments facilitates a comparison of our operations across periods without the variances caused by the volatility of the amounts (which depends on market forces outside our control). Adjusted EBITDA has limitations as a measure of our performance. Adjusted EBITDA does not reflect our historical cash expenditures or future cash requirements for capital expenditures or contractual commitments. While Adjusted EBITDA is a relevant measure of performance, it does not represent net income or cash flows from operations calculated and presented in accordance with GAAP, and it should not be considered as an alternative to those indicators in evaluating performance or liquidity.
Annual rental revenue
Annual rental revenue represents the annualized fixed base rental amount, in effect as of the end of the period, related to our operating RSF. Annual rental revenue is presented using 100% of the annual rental revenue of our consolidated properties and our share of annual rental revenue for our unconsolidated real estate joint ventures. Annual rental revenue per RSF is computed by dividing annual rental revenue by the sum of 100% of the RSF of our consolidated properties and our share of the RSF of properties held in unconsolidated real estate joint ventures. As of March 31, 2018, approximately 97% of our leases (on an RSF basis) were triple net leases, which require tenants to pay substantially all real estate taxes, insurance, utilities, common area expenses, and other operating expenses (including increases thereto) in addition to base rent. Annual rental revenue excludes these operating expenses recovered from our tenants. Amounts recovered from our tenants related to these operating expenses are classified in tenant recoveries in our consolidated statements of income.
Cash interest
Cash interest is equal to interest expense calculated in accordance with GAAP plus capitalized interest, less amortization of loan fees and debt premiums/discounts. See definition of fixed-charge coverage ratio for a reconciliation of interest expense, the most directly comparable financial measure calculated and presented in accordance with GAAP, to cash interest.
Class A properties and AAA locations
Class A properties are properties clustered in AAA locations that provide innovative tenants with highly dynamic and collaborative environments that enhance their ability to successfully recruit and retain world-class talent and inspire productivity, efficiency, creativity, and success. Class A properties generally command higher annual rental rates than other classes of similar properties.
| |
| Definitions and Reconciliations (continued) | |
| March 31, 2018 | |
AAA locations are in close proximity to concentrations of specialized skills, knowledge, institutions, and related businesses. Such locations are generally characterized by high barriers to entry for new landlords, high barriers to exit for tenants, and a limited supply of available space.
Development, redevelopment, and pre-construction
A key component of our business model is our disciplined allocation of capital to the development and redevelopment of new Class A properties located in world-class collaborative life science and technology campuses in AAA urban innovation clusters. These projects are focused on providing high-quality, generic, and reusable spaces that meet the real estate requirements of, and are reusable by, a wide range of tenants. Upon completion, each value-creation project is expected to generate a significant increase in rental income, net operating income, and cash flows. Our development and redevelopment projects are generally in locations that are highly desirable to high-quality entities, which we believe results in higher occupancy levels, longer lease terms, higher rental income, higher returns, and greater long-term asset value.
Development projects consist of the ground-up development of generic and reusable facilities. Redevelopment projects consist of the permanent change in use of office, warehouse, and shell space into office/laboratory or tech office space. We generally will not commence new development projects for aboveground construction of new Class A office/laboratory and tech office space without first securing significant pre-leasing for such space, except when there is solid market demand for high-quality Class A properties.
Pre-construction activities include entitlements, permitting, design, site work, and other activities preceding commencement of construction of aboveground building improvements. The advancement of pre-construction efforts is focused on reducing the time required to deliver projects to prospective tenants. These critical activities add significant value for future ground-up development and are required for the vertical construction of buildings. Ultimately, these projects will provide high-quality facilities and are expected to generate significant revenue and cash flows.
Dividend payout ratio (common stock)
Dividend payout ratio (common stock) is the ratio of the absolute dollar amount of dividends on our common stock (shares of common stock outstanding on the respective record dates multiplied by the related dividend per share) to funds from operations attributable to Alexandria’s common stockholders – diluted, as adjusted.
Dividend yield
Dividend yield for the quarter represents the annualized quarter dividend divided by the closing common stock price at the end of the quarter.
Fixed-charge coverage ratio
Fixed-charge coverage ratio is a non-GAAP financial measure representing the ratio of Adjusted EBITDA to fixed charges. We believe this ratio is useful to investors as a supplemental measure of our ability to satisfy fixed financing obligations and preferred stock dividends. Cash interest is equal to interest expense calculated in accordance with GAAP, plus capitalized interest, less amortization of loan fees and debt premiums/discounts. The fixed-charge coverage ratio calculation below is not directly comparable to the computation of ratio of earnings to fixed charges as defined in Item 503(d) of Regulation S-K and to the “Computation of Consolidated Ratio of Earnings to Fixed Charges and Consolidated Ratio of Earnings to Combined Fixed Charges and Preferred Stock Dividends” included in Exhibit 12.1 to our annual report on Form 10-K.
The following table reconciles interest expense, the most directly comparable financial measure calculated and presented in accordance with GAAP, to cash interest and fixed charges:
| Three Months Ended | |||||||||||||||||||
| (Dollars in thousands) | 3/31/18 | 12/31/17 | 9/30/17 | 6/30/17 | 3/31/17 | ||||||||||||||
| Adjusted EBITDA | $ | 228,611 | $ | 204,348 | $ | 193,457 | $ | 188,762 | $ | 180,941 | |||||||||
| Interest expense | $ | 36,915 | $ | 36,082 | $ | 31,031 | $ | 31,748 | $ | 29,784 | |||||||||
| Capitalized interest | 13,360 | 12,897 | 17,092 | 15,069 | 13,164 | ||||||||||||||
| Amortization of loan fees | (2,543 | ) | (2,571 | ) | (2,840 | ) | (2,843 | ) | (2,895 | ) | |||||||||
| Amortization of debt premiums | 575 | 639 | 652 | 625 | 596 | ||||||||||||||
| Cash interest | 48,307 | 47,047 | 45,935 | 44,599 | 40,649 | ||||||||||||||
| Dividends on preferred stock | 1,302 | 1,302 | 1,302 | 1,278 | 3,784 | ||||||||||||||
| Fixed charges | $ | 49,609 | $ | 48,349 | $ | 47,237 | $ | 45,877 | $ | 44,433 | |||||||||
| Fixed-charge coverage ratio: | |||||||||||||||||||
| – quarter annualized | 4.6x | 4.2x | 4.1x | 4.1x | 4.1x | ||||||||||||||
| – trailing 12 months | 4.3x | 4.1x | 4.0x | 3.9x | 3.8x | ||||||||||||||
| |
| Definitions and Reconciliations (continued) | |
| March 31, 2018 | |
Funds from operations and funds from operations, as adjusted, attributable to Alexandria’s common stockholders
GAAP-basis accounting for real estate assets utilizes historical cost accounting and assumes that real estate values diminish over time. In an effort to overcome the difference between real estate values and historical cost accounting for real estate assets, the Nareit Board of Governors established funds from operations as an improved measurement tool. Since its introduction, funds from operations has become a widely used non-GAAP financial measure among equity REITs. We believe that funds from operations is helpful to investors as an additional measure of the performance of an equity REIT. Moreover, we believe that funds from operations, as adjusted, allows investors to compare our performance to the performance of other real estate companies on a consistent basis, without having to account for differences recognized because of real estate investment and disposition decisions, financing decisions, capital structure, capital market transactions, and variances resulting from the volatility of market conditions outside of our control. We compute funds from operations in accordance with standards established by the Nareit Board of Governors in its April 2002 White Paper and related implementation guidance (the “Nareit White Paper”). The Nareit White Paper defines funds from operations as net income (computed in accordance with GAAP), excluding gains (losses) from sales of depreciable real estate and land parcels, and impairments of depreciable real estate (excluding land parcels), plus real estate-related depreciation and amortization, and after adjustments for our share of consolidated and unconsolidated partnerships and real estate joint ventures. Impairments represent the write-down of assets when fair value over the recoverability period is less than the carrying value due to changes in general market conditions and do not necessarily reflect the operating performance of the properties during the corresponding period. The definition of funds from operations in the Nareit White Paper does not include adjustments related to unrealized gains and losses on non-real estate investments, which are affected by market conditions outside of our control. Consequently, unrealized gains and losses on non-real estate investments recognized in earnings, affects our reported funds from operations as computed in accordance with the Nareit White Paper.
We compute funds from operations, as adjusted, as funds from operations calculated in accordance with the Nareit White Paper excluding significant realized gains or losses on the sale of non-real estate investments, unrealized gains or losses on non-real estate investments, losses on early extinguishment of debt, preferred stock redemption charges, impairments of non-depreciable real estate, impairments of non-real estate investments, and deal costs, and the amount of such items that is allocable to our unvested restricted stock awards. Neither funds from operations nor funds from operations, as adjusted, should be considered as alternatives to net income (determined in accordance with GAAP) as indications of financial performance, or to cash flows from operating activities (determined in accordance with GAAP) as measures of liquidity, nor are they indicative of the availability of funds for our cash needs, including our ability to make distributions.
Initial stabilized yield (unlevered)
Initial stabilized yield is calculated as the quotient of the estimated amounts of net operating income at stabilization and our investment in the property. Our initial stabilized yield excludes the benefit of leverage. Our cash rents related to our value-creation projects are expected to increase over time due to contractual annual rent escalations. Our estimates for initial stabilized yields, initial stabilized yields (cash basis), and total costs at completion represent our initial estimates at the commencement of the project. We expect to update this information upon completion of the project, or sooner if there are significant changes to the expected project yields or costs.
| • | Initial stabilized yield reflects rental income, including contractual rent escalations and any rent concessions over the term(s) of the lease(s), calculated on a straight-line basis. |
| • | Initial stabilized yield (cash basis) reflects cash rents at the stabilization date after initial rental concessions, if any, have elapsed and our total cash investment in the property. |
Investments
We hold investments in publicly traded companies and privately held entities primarily involved in the life science and technology industries. On January 1, 2018, we adopted a new ASU on financial instruments that prospectively changed how we recognize, measure, present, and disclose these investments.
Key differences between prior accounting standards and the new ASU:
Prior to January 1, 2018
| • | Investments in publicly traded companies were reflected at fair value in the balance sheet, with changes in fair value classified in other comprehensive income within equity. |
| • | Investments in privately held entities were accounted for under the cost method of accounting. |
| • | Gains or losses were recognized in net income upon the sale of an investment. |
| • | Investments in privately held entities required accounting under the equity method unless our interest in the entity was deemed to be so minor that we had virtually no influence over the entity’s operating and financial policies. Under the equity method of accounting, we recognized our investment initially at cost and adjusted the carrying amount of the investment to recognize our share of the earnings or losses of the investee subsequent to the date of our investment. We had no investments accounted for under the equity method as of December 31, 2017. |
| • | Investments were evaluated for impairment, with other-than-temporary impairments recognized in net income. |
Effective January 1, 2018
| • | Investments in publicly traded companies are reflected at fair value in the balance sheet, with changes in fair value recognized in net income. |
| • | Investments in privately held entities without readily determinable fair values previously accounted for under the cost method are accounted for as follows: |
| • | Investments in privately held entities that report NAV are reflected at fair value using NAV as a practical expedient, with changes in fair value recognized in net income. |
| • | Investments in privately held entities that do not report NAV are carried at cost, adjusted for observable price changes and impairments, with changes recognized in net income. |
| • | One time adjustments recognized on January 1, 2018: |
| • | For investments in publicly traded companies, reclassification of cumulative unrealized gains and losses as of December 31, 2017, aggregating $49.8 million, from accumulated other comprehensive income to retained earnings. |
| • | For investments in privately held entities without readily determinable fair values that were previously accounted for under the cost method: |
| • | Adjustment of cumulative unrealized gains for investments in privately held entities that report NAV, representing the difference between fair values as of December 31, 2017, using NAV as a practical expedient, and the carrying value of the investments as of December 31, 2017, previously accounted for under the cost method, aggregating $90.8 million, with a corresponding adjustment to retained earnings. |
| • | No adjustment was required for investments in privately held entities that do not report NAV. The ASU requires a prospective transition approach for investments in privately held entities that do not report NAV. The FASB clarified that it would be difficult for entities to determine the last observable transaction price existing prior to the adoption of this ASU. Therefore, unlike our investments in privately held entities that report NAV that were adjusted to reflect fair values upon adoption of the new ASU, our investments in privately held entities that do not report NAV were not retrospectively adjusted to fair values upon adoption. As such, any initial valuation adjustments made for investments in privately held entities that do not report NAV subsequent to January 1, 2018 as a result of future observable price changes will include recognition of |
| |
| Definitions and Reconciliations (continued) | |
| March 31, 2018 | |
cumulative unrealized gains or losses equal to the difference between the carrying basis of the investment and the observable price at the date of measurement.
| • | Investments in privately held entities will continue to require accounting under the equity method unless our interest in the entity was deemed to be so minor that we had virtually no influence over the entity’s operating and financial policies. Under the equity method of accounting, we recognize our investment initially at cost and adjust the carrying amount of the investment to recognize our share of the earnings or losses of the investee subsequent to the date of our investment. We had no investments accounted for under the equity method as of March 31, 2018. |
Changes in fair value for investments in publicly traded companies and investments in privately held entities that report NAV, and observable price changes for investments in privately held entities that do not report NAV, are recognized as unrealized gains or losses and classified as investment income in our consolidated statements of income.
Investment-grade or large cap tenants
Investment-grade or large cap tenants include tenants that are investment-grade rated or have their most recently reported market capitalization or private valuation greater than $10 billion as of March 31, 2018.
Items included in net income attributable to Alexandria’s common stockholders
We present a tabular comparison of items, whether gain or loss, that may facilitate a high-level understanding of our results and provide context for the disclosures included in this Supplemental Information, our most recent annual report on Form 10-K, and our subsequent quarterly reports on Form 10-Q. We believe this tabular presentation promotes a better understanding of corporate-level decisions and activities that significantly affect comparison of our operating results from period to period. We also believe this tabular presentation will supplement an understanding of our disclosures and real estate operating results. Gains or losses on sales of real estate and impairments of held for sale assets are related to corporate-level decisions to dispose of real estate. Gains or losses on early extinguishment of debt and preferred stock redemption charges are related to corporate-level financing decisions focused on our capital structure strategy. Significant realized and unrealized gains or losses from non-real estate investments are not related to the operating performance of our real estate assets as they result from strategic, corporate-level non-real estate investment decisions and external market conditions. Impairments of non-real estate investments are not related to the operating performance of our real estate as they represent the write-down of a non-real estate investment when its fair value declines below its carrying value due to changes in general market or other conditions outside of our control. Significant items, whether a gain or loss, included in the tabular disclosure for current periods are described in further detail in this Supplemental Information.
Joint venture financial information
We present components of balance sheet and operating results information related to our joint ventures, which are not in accordance with, or intended to be presentations in accordance with, GAAP. We present the proportionate share of certain financial line items as follows: (i) for each real estate joint venture that we consolidate in our financial statements, but of which we own less than 100%, we apply the noncontrolling interest economic ownership percentage to each financial item to arrive at the amount of such cumulative noncontrolling interest share of each component presented; and (ii) for each real estate joint venture that we do not control, and do not consolidate, we apply our economic ownership percentage to each financial item to arrive at our proportionate share of each component presented.
The components of balance sheet and operating results information related to joint ventures do not represent our legal claim to those items. The joint venture agreement for each entity that we do not wholly own generally determines what equity holders can receive upon capital events, such as sales or refinancing, or in the event of a liquidation. Equity holders are normally entitled to their respective legal ownership of any residual cash from a joint venture only after all liabilities, priority distributions, and claims have been repaid or satisfied.
We believe this information can help investors estimate the balance sheet and operating results information related to our partially owned entities. Presenting this information provides a perspective not immediately available from consolidated financial statements and one that can supplement an understanding of joint venture assets, liabilities, revenues, and expenses included in our consolidated results.
The components of balance sheet and operating results information related to joint ventures are limited as an analytical tool, as the overall economic ownership interest does not represent our legal claim to each of our joint ventures’ assets, liabilities, or results of operations. In addition, joint venture financial information may include financial information related to the unconsolidated real estate joint ventures that we do not control. We believe that in order to facilitate a clear understanding of our operating results and our total assets and liabilities, joint venture financial information should be examined in conjunction with our consolidated statements of income and balance sheets. Joint venture financial information should not be considered an alternative to our consolidated financial statements, which are prepared in accordance with GAAP.
Net cash provided by operating activities after dividends
Net cash provided by operating activities after dividends includes the deduction for distributions to noncontrolling interests. For purposes of this calculation, changes in operating assets and liabilities are excluded as they represent timing differences.
| |
| Definitions and Reconciliations (continued) | |
| March 31, 2018 | |
Net debt to Adjusted EBITDA and net debt and preferred stock to Adjusted EBITDA
Net debt to Adjusted EBITDA and net debt and preferred stock to Adjusted EBITDA are non-GAAP financial measures that we believe are useful to investors as supplemental measures in evaluating our balance sheet leverage. Net debt is equal to the sum of total consolidated debt less cash, cash equivalents, and restricted cash. Net debt and preferred stock is equal to the sum of net debt, as discussed above, plus preferred stock outstanding as of period end. See “Adjusted EBITDA” for further information on the calculation of Adjusted EBITDA.
The following table reconciles debt to net debt, and to net debt and preferred stock, and computes the ratio of each to Adjusted EBITDA:
| (Dollars in thousands) | 3/31/18 | 12/31/17 | 9/30/17 | 6/30/17 | 3/31/17 | |||||||||||||||
| Secured notes payable | $ | 775,689 | $ | 771,061 | $ | 1,153,890 | $ | 1,127,348 | $ | 1,083,758 | ||||||||||
| Unsecured senior notes payable | 3,396,912 | 3,395,804 | 2,801,290 | 2,800,398 | 2,799,508 | |||||||||||||||
| Unsecured senior line of credit | 490,000 | 50,000 | 314,000 | 300,000 | — | |||||||||||||||
| Unsecured senior bank term loans | 548,197 | 547,942 | 547,860 | 547,639 | 547,420 | |||||||||||||||
| Unamortized deferred financing costs | 27,438 | 29,051 | 27,803 | 29,710 | 31,616 | |||||||||||||||
| Cash and cash equivalents | (221,645 | ) | (254,381 | ) | (118,562 | ) | (124,877 | ) | (151,209 | ) | ||||||||||
| Restricted cash | (37,337 | ) | (22,805 | ) | (27,713 | ) | (20,002 | ) | (18,320 | ) | ||||||||||
| Net debt | $ | 4,979,254 | $ | 4,516,672 | $ | 4,698,568 | $ | 4,660,216 | $ | 4,292,773 | ||||||||||
| Net debt | $ | 4,979,254 | $ | 4,516,672 | $ | 4,698,568 | $ | 4,660,216 | $ | 4,292,773 | ||||||||||
| 7.00% Series D convertible preferred stock | 74,386 | 74,386 | 74,386 | 74,386 | 74,386 | |||||||||||||||
| Net debt and preferred stock | $ | 5,053,640 | $ | 4,591,058 | $ | 4,772,954 | $ | 4,734,602 | $ | 4,367,159 | ||||||||||
| Adjusted EBITDA: | ||||||||||||||||||||
| – quarter annualized | $ | 914,444 | $ | 817,392 | $ | 773,828 | $ | 755,048 | $ | 723,764 | ||||||||||
| – trailing 12 months | $ | 815,178 | $ | 767,508 | $ | 728,869 | $ | 689,079 | $ | 650,579 | ||||||||||
| Net debt to Adjusted EBITDA: | ||||||||||||||||||||
| – quarter annualized | 5.4 | x | 5.5 | x | 6.1 | x | 6.2 | x | 5.9 | x | ||||||||||
| – trailing 12 months | 6.1 | x | 5.9 | x | 6.4 | x | 6.8 | x | 6.6 | x | ||||||||||
| Net debt and preferred stock to Adjusted EBITDA: | ||||||||||||||||||||
| – quarter annualized | 5.5 | x | 5.6 | x | 6.2 | x | 6.3 | x | 6.0 | x | ||||||||||
| – trailing 12 months | 6.2 | x | 6.0 | x | 6.5 | x | 6.9 | x | 6.7 | x | ||||||||||
Net operating income and operating margin
The following table reconciles net income to net operating income:
| Three Months Ended | |||||||||
| (Dollars in thousands) | 3/31/18 | 3/31/17 | |||||||
| Net income | $ | 141,518 | $ | 47,555 | |||||
| Equity in earnings of unconsolidated real estate joint ventures | (1,144 | ) | (361 | ) | |||||
| General and administrative expenses | 22,421 | 19,229 | |||||||
| Interest expense | 36,915 | 29,784 | |||||||
| Depreciation and amortization | 114,219 | 97,183 | |||||||
| Loss on early extinguishment of debt | — | 670 | |||||||
| Gain on sales of real estate – rental properties | — | (270 | ) | ||||||
| Investment income | (85,561 | ) | — | ||||||
| Net operating income | $ | 228,368 | $ | 193,790 | |||||
| Revenues | $ | 320,139 | $ | 270,877 | |||||
| Operating margin | 71% | 72% | |||||||
Net operating income is a non-GAAP financial measure calculated as net income, the most directly comparable financial measure calculated and presented in accordance with GAAP, excluding equity in the earnings (losses) of our unconsolidated real estate joint ventures, general and administrative expenses, interest expense, depreciation and amortization, impairment of real estate, gains or losses on early extinguishment of debt, gains or losses on sales of real estate, and investment income. We believe net operating income provides useful information to investors regarding our financial condition and results of operations because it primarily reflects those income and expense items that are incurred at the property level. Therefore, we believe net operating income is a useful measure for evaluating the operating performance of our real estate assets. Net operating income on a cash basis is net operating income adjusted to exclude the effect of straight-line rent and amortization of acquired above- and below-market lease revenue adjustments required by GAAP. We believe that net operating income on a cash basis is helpful to investors as an additional measure of operating performance because it eliminates straight-line rent revenue and the amortization of acquired above- and below-market leases.
Further, we believe net operating income is useful to investors as a performance measure because, when compared across periods, net operating income reflects trends in occupancy rates, rental rates, and operating costs, which provide a perspective not immediately apparent from net income. Net operating income can be used to measure the initial stabilized yields of our properties by calculating the quotient of net operating income generated by a property on a straight-line basis and our investment in the property. Net operating income excludes certain components from net income in order to provide results that are more closely related to the results of operations of our properties. For example, interest expense is not necessarily linked to the operating performance of a real estate asset and is often incurred at the corporate level rather than at the property level. In addition, depreciation and amortization, because of historical cost accounting and useful life estimates, may distort comparability of operating performance at the property level. Impairments of real estate have been excluded in deriving net operating income because we do not consider impairments of real estate to be property-level
| |
| Definitions and Reconciliations (continued) | |
| March 31, 2018 | |
operating expenses. Impairments of real estate relate to changes in the values of our assets and do not reflect the current operating performance with respect to related revenues or expenses. Our impairments of real estate represent the write-down in the value of the assets to the estimated fair value less cost to sell. These impairments result from investing decisions and deterioration in market conditions. We also exclude realized and unrealized investment income calculated under a new ASU effective 1/1/18, which results from investment decisions that occur at the corporate level related to non-real estate investments in publicly traded companies and certain privately held entities. Therefore, we do not consider these activities to be an indication of operating performance of our real estate assets at the property level. Our calculation of net operating income also excludes charges incurred from changes in certain financing decisions, such as loss on early extinguishment of debt, as these charges often relate to corporate strategy. Property operating expenses that are included in determining net operating income primarily consist of costs that are related to our operating properties, such as utilities, repairs, and maintenance; rental expense related to ground leases; contracted services, such as janitorial, engineering, and landscaping; property taxes and insurance; and property-level salaries. General and administrative expenses consist primarily of accounting and corporate compensation, corporate insurance, professional fees, office rent, and office supplies that are incurred as part of corporate office management.
We believe that in order to facilitate a clear understanding of our operating results, net operating income should be examined in conjunction with net income as presented in our consolidated statements of income. Net operating income should not be considered as an alternative to net income as an indication of our performance, nor as an alternative to cash flows as a measure either of liquidity or our ability to make distributions.
Operating statistics
We present certain operating statistics related to our properties, including number of properties, RSF, occupancy percentage, leasing activity, and contractual lease expirations as of the end of the period. We believe these measures are useful to investors because they facilitate an understanding of certain trends for our properties. We compute the number of properties, RSF, occupancy percentage, leasing activity, and contractual expirations at 100% for all properties in which we have an investment, including properties owned by our consolidated and unconsolidated real estate joint ventures. For operating metrics based on annual rental rate revenue, see our discussion of annual rental revenue herein.
Same property comparisons
As a result of changes within our total property portfolio during the comparative periods presented, including changes from assets acquired or sold, properties placed into development or redevelopment, and development or redevelopment properties recently placed into service, the consolidated total rental revenues, tenant recoveries, and rental operating expenses in our operating results can show significant changes from period to period. In order to supplement an evaluation of our results of operations over a given period, we analyze the operating performance for all properties that were fully operating for the entirety of the comparative periods presented, referred to as same properties. These properties are analyzed separately from properties acquired subsequent to the first day in the earliest comparable period presented, properties that underwent development or redevelopment at any time during the comparative periods, and corporate entities (legal entities performing general and administrative functions), which are excluded from same property results. Additionally, rental revenues from lease termination fees, if any, are excluded from the results of same properties.
The following table reconciles the number of same properties to total properties:
| Development – under construction | Properties | |||
| 213 East Grand Avenue | 1 | |||
| 399 Binney Street | 1 | |||
| 279 East Grand Avenue | 1 | |||
Menlo Gateway (unconsolidated real estate JV) | 3 | |||
1655 and 1725 Third Street (unconsolidated real estate JV) | 2 | |||
| 8 | ||||
| Development – placed into service after January 1, 2017 | Properties | |||
| 505 Brannan Street | 1 | |||
| 510 Townsend Street | 1 | |||
| ARE Spectrum | 3 | |||
| 400 Dexter Avenue North | 1 | |||
| 100 Binney Street | 1 | |||
| 7 | ||||
| Redevelopment – under construction | Properties | |||
| 9625 Towne Centre Drive | 1 | |||
| 5 Laboratory Drive | 1 | |||
| 9900 Medical Center Drive | 1 | |||
| 266 and 275 Second Avenue | 2 | |||
| Alexandria PARC | 4 | |||
704 Quince Orchard Road (unconsolidated real estate JV) | 1 | |||
| 10 | ||||
| Acquisitions after January 1, 2017 | Properties | |||
| 88 Bluxome Street | 1 | |||
| 960 Industrial Road | 1 | |||
| 1450 Page Mill Road | 1 | |||
| 701 Gateway Boulevard | 1 | |||
| 4110 Campus Point Court | 1 | |||
| Summers Ridge Science Park | 4 | |||
| 9 | ||||
| Total properties excluded from same properties | 34 | |||
| Same properties | 188 | (1) | ||
| Total properties in North America as of March 31, 2018 | 222 | |||
| (1) | Includes 9880 Campus Point Drive, a building that was occupied through January 2018 and is currently undergoing demolition as we expect to develop a 98,000 RSF Class A office/laboratory property. |
Stabilized occupancy date
The stabilized occupancy date represents the estimated date on which the project is expected to reach occupancy of 95% or greater.
Total equity market capitalization
Total equity market capitalization is equal to the sum of outstanding shares of 7.00% Series D cumulative convertible preferred stock and common stock multiplied by the related closing price of each class of security at the end of each period presented.
Total market capitalization
Total market capitalization is equal to the sum of total equity market capitalization and total debt.
| |
| Definitions and Reconciliations (continued) | |
| March 31, 2018 | |
Unencumbered net operating income as a percentage of total net operating income
Unencumbered net operating income as a percentage of total net operating income is a non-GAAP financial measure that we believe is useful to investors as a performance measure of the results of operations of our unencumbered real estate assets, as it reflects those income and expense items that are incurred at the unencumbered property level. Unencumbered net operating income is derived from assets classified in continuing operations, which are not subject to any mortgage, deed of trust, lien, or other security interest, as of the period for which income is presented.
The following table summarizes unencumbered net operating income as a percentage of total net operating income:
| Three Months Ended | |||||||||||||||||||
| (Dollars in thousands) | 3/31/18 | 12/31/17 | 9/30/17 | 6/30/17 | 3/31/17 | ||||||||||||||
| Unencumbered net operating income | $ | 198,599 | $ | 181,719 | $ | 164,291 | $ | 158,072 | $ | 157,391 | |||||||||
| Encumbered net operating income | 29,769 | 28,999 | 37,610 | 38,007 | 36,399 | ||||||||||||||
| Total net operating income | $ | 228,368 | $ | 210,718 | $ | 201,901 | $ | 196,079 | $ | 193,790 | |||||||||
| Unencumbered net operating income as a percentage of total net operating income | 87% | 86% | 81% | 81% | 81% | ||||||||||||||
Weighted-average interest rate for capitalization of interest
The weighted-average interest rate required for calculating capitalization of interest pursuant to GAAP represents a weighted-average rate based on the rates applicable to borrowings outstanding during the period, including expense/income related to our interest rate hedge agreements, amortization of loan fees, amortization of debt premiums (discounts), and other bank fees. A separate calculation is performed to determine our weighted-average interest rate for capitalization for each month. The rate will vary each month due to changes in variable interest rates, outstanding debt balances, the proportion of variable-rate debt to fixed-rate debt, the amount and terms of interest rate hedge agreements, and the amount of loan fee and premium (discount) amortization.
The following table presents the weighted-average interest rate for capitalization of interest:
| Three Months Ended | |||||||||
| 3/31/18 | 12/31/17 | 9/30/17 | 6/30/17 | 3/31/17 | |||||
| Weighted-average interest rate for capitalization of interest | 3.91% | 3.89% | 3.96% | 3.98% | 3.95% | ||||
Weighted-average shares of common stock outstanding – diluted
We enter into capital market transactions from time to time to fund acquisitions, fund construction of our highly leased development and redevelopment projects, and for general working capital purposes. In March 2017 and January 2018, we entered into forward equity sales agreements to sell shares of our common stock. We are required to consider the potential dilutive effect of our forward equity sales agreements under the treasury stock method while the forward equity sales agreements are outstanding.
We also consider the effect of assumed conversions of our outstanding 7.00% Series D cumulative convertible preferred stock (“Series D Convertible Preferred Stock”) when determining potentially dilutive incremental shares to our common stock. Under the assumed conversion, we add back to net income dividends paid on our Series D Convertible Preferred Stock to the numerator and then include additional common shares assumed to have been issued to the denominator of the per share calculation. On January 1, 2018, we adopted an ASU that requires changes in the fair value of our non-real estate investments to be recognized in net income. Upon adoption of the ASU, we recognized a large unrealized gain in our investment income. As a result of the significant amount of unrealized gain recognized during 1Q18, our Series D Convertible Preferred Stock had a dilutive effect on funds from operations attributable to Alexandria Real Estate Equities, Inc.’s common stockholders – diluted, computed in accordance with the definition in the Nareit White Paper.
The weighted-average shares of common stock outstanding – diluted during each period include the following shares related to our forward equity sales agreements and Series D cumulative convertible preferred incremental dilutive common stock:
| Three Months Ended | ||||||||||||||
| (In thousands) | 3/31/18 | 12/31/17 | 9/30/17 | 6/30/17 | 3/31/17 | |||||||||
| Potential additional shares upon settlement/ conversion: | ||||||||||||||
| Outstanding forward equity sales agreements | 6,056 | 4,755 | 4,755 | 4,755 | 4,755 | |||||||||
| 7.00% Series D Convertible Preferred Stock | 2,975 | 2,975 | 2,975 | 2,975 | 2,975 | |||||||||
| Incremental dilutive common shares: | ||||||||||||||
| Outstanding forward equity sales agreements | 270 | 776 | 698 | 530 | 53 | |||||||||
| Earnings per share – diluted and funds from operations, as adjusted – diluted | 270 | 776 | 698 | 530 | 53 | |||||||||
| 7.00% Series D Convertible Preferred Stock | 741 | — | — | — | — | |||||||||
| Funds from operations – diluted | 1,011 | 776 | 698 | 530 | 53 | |||||||||