(1)Refer to “Annual rental revenue,” “Class A properties and AAA locations,” and “Investment-grade or publicly traded large cap tenants” in the “Definitions and reconciliations” of our Supplemental Information for additional details.
(2)Liquidity as of June 30, 2020, pro forma for outstanding forward equity sales agreement entered into in July 2020. Refer to “Key credit metrics” of our Supplemental Information for additional details.
(3)Refer to “Summary of debt” in the “Key credit metrics” of our Supplemental Information for additional details.
(1)Liquidity as of June 30, 2020, pro forma for outstanding forward equity sales agreements entered into in July 2020. Refer to “Key credit metrics” of our Supplemental Information for additional details.
(2)Represents credit rating levels from Moody’s Investors Service and S&P Global Ratings in comparison to those of all publicly traded REITs (excluding mortgage REITs) as of June 30, 2020.
(3)Quarter annualized.
(4)As of June 30, 2020.
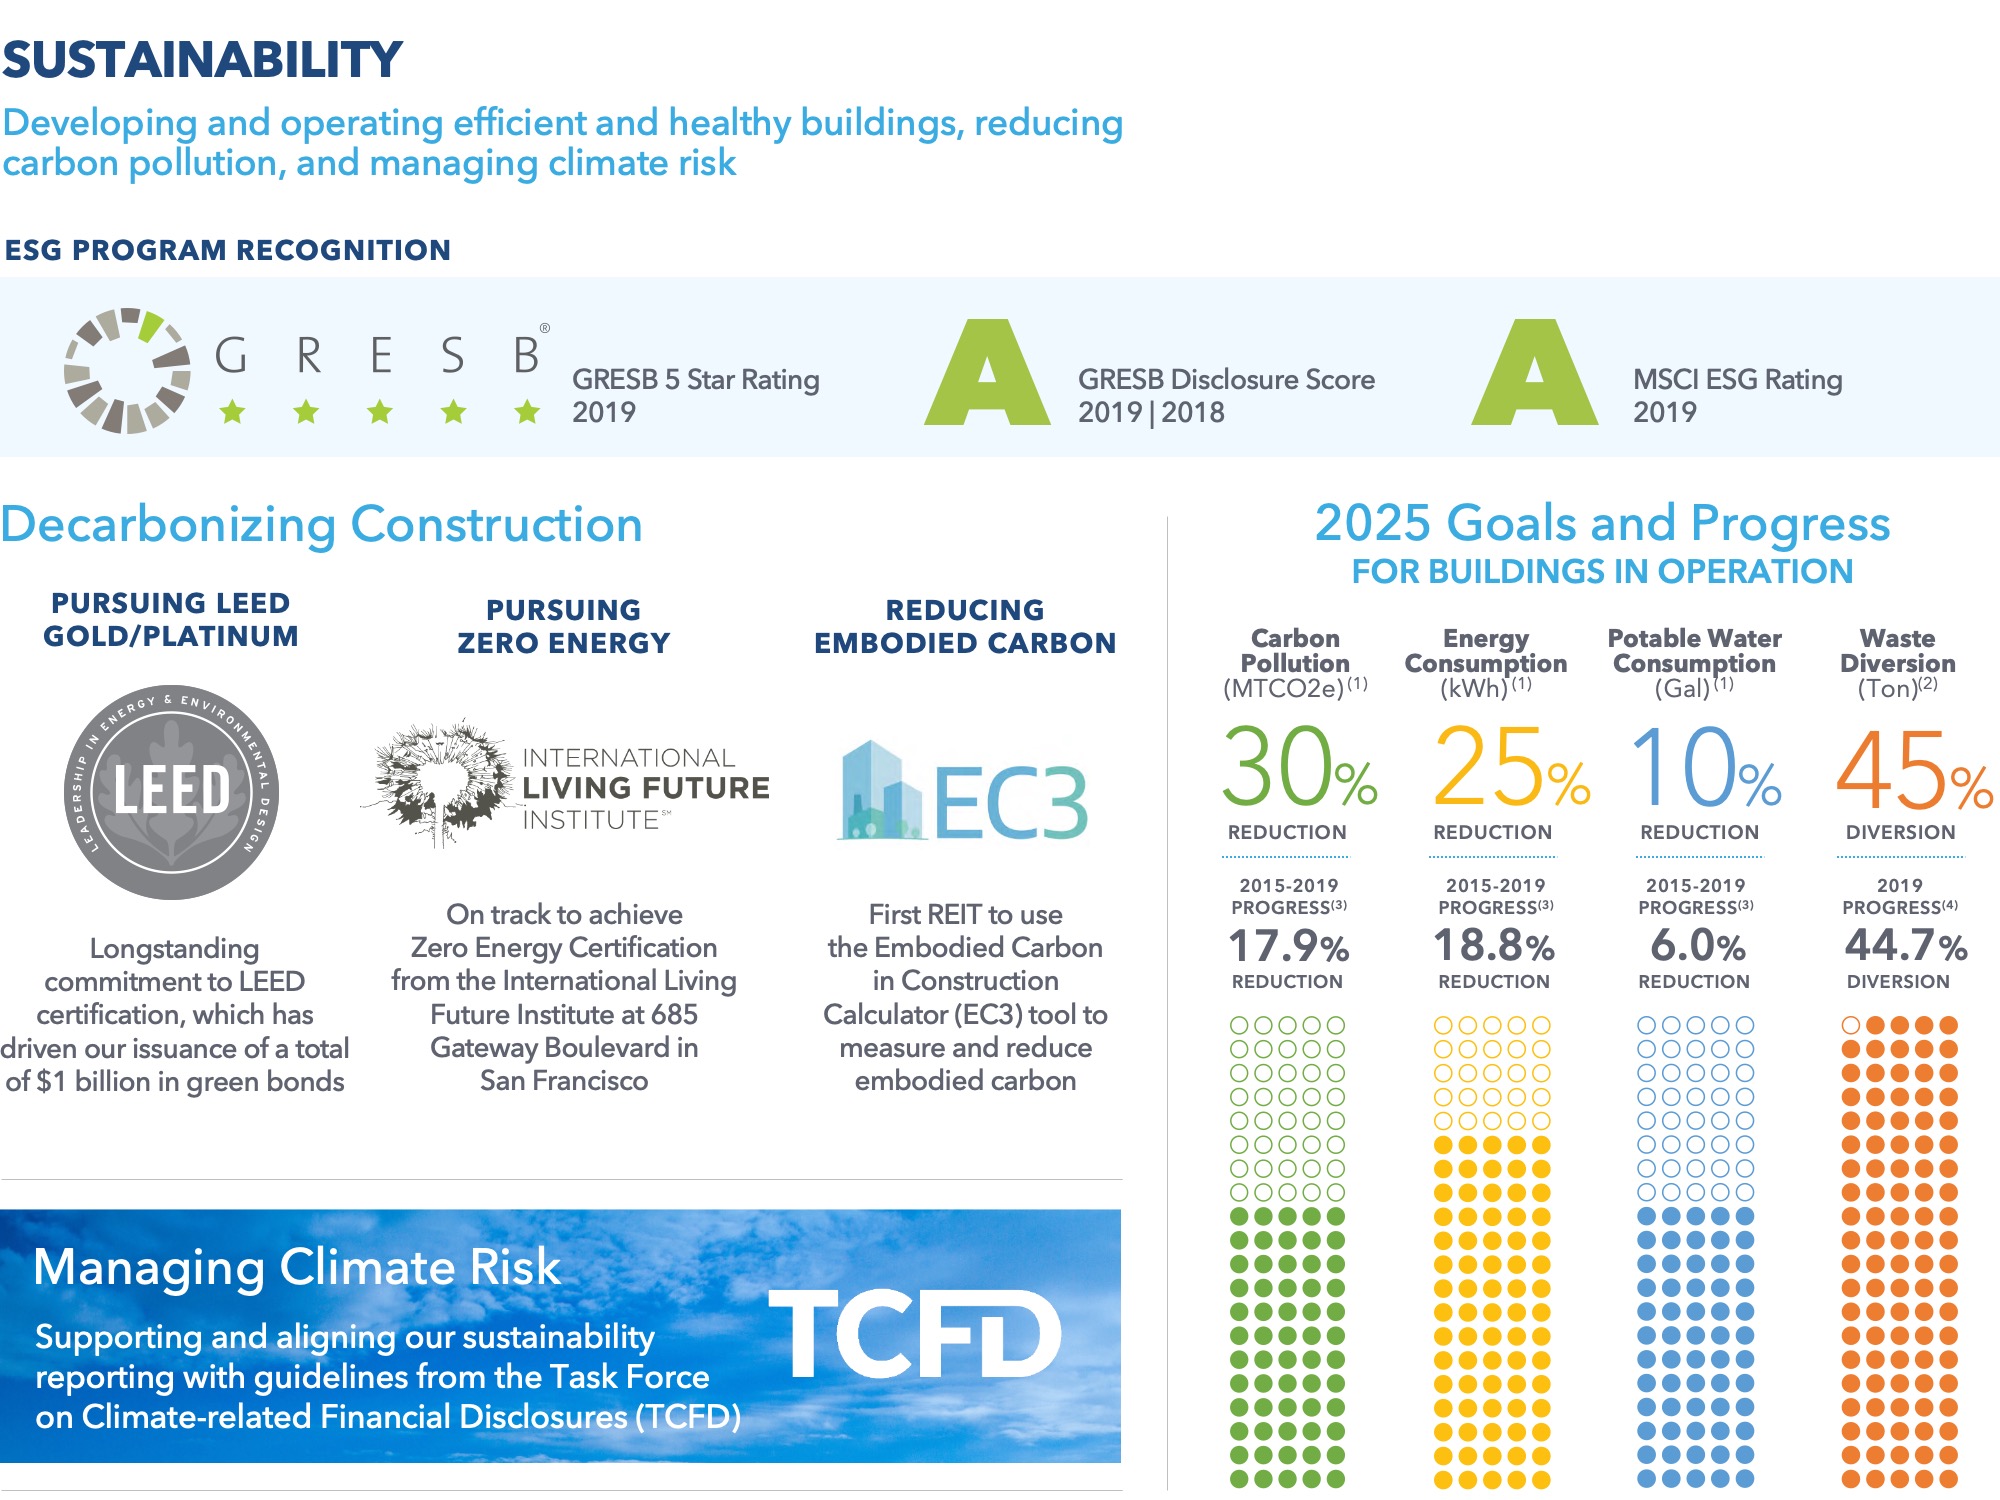
(1)Relative to a 2015 baseline for buildings in operation that Alexandria directly manages.
(2)Relative to a 2015 baseline for buildings in operation that Alexandria indirectly and directly manages.
(3)Reflects sum of annual like-for-like progress from 2015 to 2019.
(4)Reflects progress for all buildings in operation in 2019 that Alexandria indirectly and directly manages.
(1)Projects targeting Fitwel or WELL certification.
| | | | | |
| |
| |
| Table of Contents | |
| June 30, 2020 | |
| |
| | | | | | | | | | | | | | |
| EARNINGS PRESS RELEASE | Page | | | Page |
| | | | |
| | | | |
| | | | |
| | | | |
| | | | |
| SUPPLEMENTAL INFORMATION | Page | | | Page |
| | | External Growth / Investments in Real Estate | |
| | | | |
| | | New Class A Development and Redevelopment Properties: | |
| | | | |
| | | | |
| | | | |
| Internal Growth | | | | |
| | | Balance Sheet Management | |
| | | | |
| | | | |
| | | | |
| | | Definitions and Reconciliations | |
| | | | |
| | | | |
| | | | |
| | | | |
This document includes “forward-looking statements” within the meaning of Section 27A of the Securities Act of 1933, as amended, and Section 21E of the Securities Exchange Act of 1934, as amended. Please refer to page 11 of this Earnings Press Release and our Supplemental Information for further information.
This document is not an offer to sell or a solicitation to buy securities of Alexandria Real Estate Equities, Inc. Any offers to sell or solicitations to buy our securities shall be made only by means of a prospectus approved for that purpose. Unless otherwise indicated, the “Company,” “Alexandria,” “ARE,” “we,” “us,” and “our” refer to Alexandria Real Estate Equities, Inc. and our consolidated subsidiaries.
| | | | | | | | |
| Alexandria Real Estate Equities, Inc. All Rights Reserved. © 2020 | viii |
Alexandria Real Estate Equities, Inc.
Reports:
2Q20 Revenues of $437.0 million, Up 16.9% Over 2Q19;
2Q20 and 1H20 Net Income per Share – Diluted of $1.82 and $1.99, respectively;
2Q20 and 1H20 FFO per Share – Diluted, As Adjusted, of $1.81 and $3.63, respectively; and Operational Excellence and Strong and Flexible Balance Sheet With Significant Liquidity
PASADENA, Calif. – July 27, 2020 – Alexandria Real Estate Equities, Inc. (NYSE:ARE) announced financial and operating results for the second quarter ended June 30, 2020.
| | | | | | | | | | | | | | | | | | | | | | | | | | |
| Key highlights | | | | | | | | |
| Operating results | 2Q20 | | 2Q19 | | 1H20 | | 1H19 | |
| Total revenues: | | | | | | | | |
| In millions | $ | 437.0 | | | $ | 373.9 | | | $ | 876.9 | | | $ | 732.7 | | |
| Growth | 16.9 | % | | | | 19.7 | % | | | |
| Net income attributable to Alexandria’s common stockholders – diluted | | | | | | | | |
| In millions | $ | 226.6 | | | $ | 76.3 | | | $ | 244.8 | | | $ | 200.2 | | |
| Per share | $ | 1.82 | | | $ | 0.68 | | | $ | 1.99 | | | $ | 1.80 | | |
| Funds from operations attributable to Alexandria’s common stockholders – diluted, as adjusted | | | | | | | | |
| In millions | $ | 225.0 | | | $ | 192.7 | | | $ | 446.4 | | | $ | 382.5 | | |
| Per share | $ | 1.81 | | | $ | 1.73 | | | $ | 3.63 | | | $ | 3.44 | | |
Alexandria and its tenants at the vanguard of advancing solutions for COVID-19
Safe and effective vaccines and therapies, in addition to widespread testing, are desperately needed to combat the global COVID-19 pandemic. Over 80 of our life science tenants are advancing solutions for COVID-19. By maintaining essential business operations across our campuses, Alexandria has enabled several of our life science tenants to continue mission-critical COVID-19-related research and development. Refer to “Alexandria and Its Innovative Tenants Are at the Vanguard of the Life Science Ecosystem Advancing Solutions for COVID-19” of this Earnings Press Release for additional details.
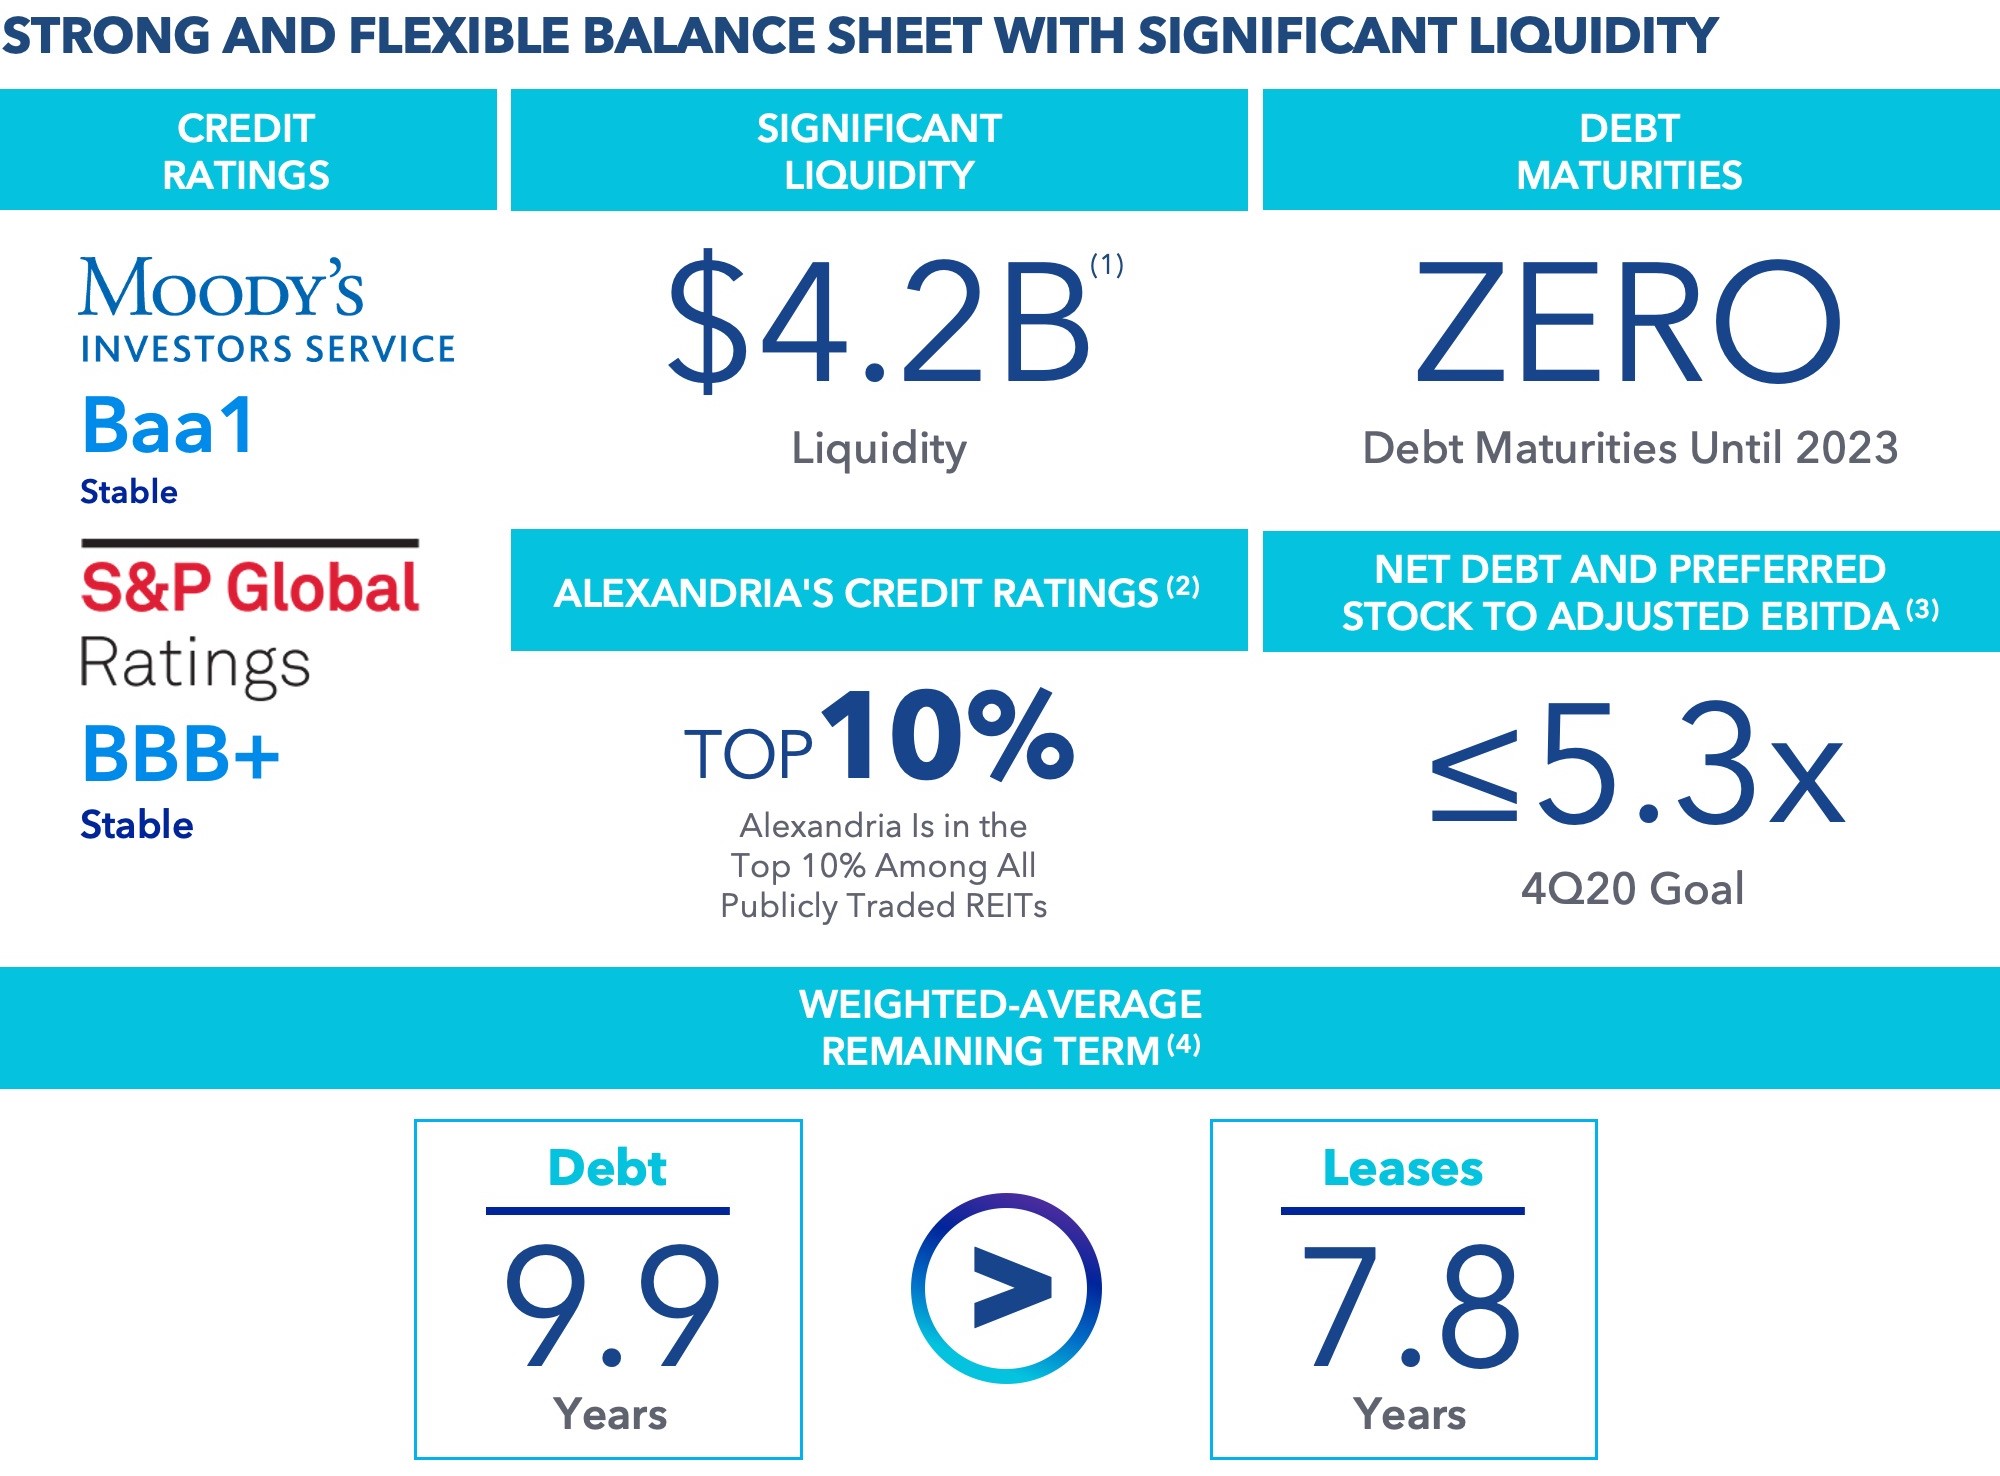
Strong and flexible balance sheet with significant liquidity
•$4.2 billion of liquidity as of June 30, 2020, pro forma for our $1.1 billion forward equity sales agreements entered into in July 2020.
•Zero debt maturing until 2023.
•9.9 years weighted-average remaining term of debt as of June 30, 2020.
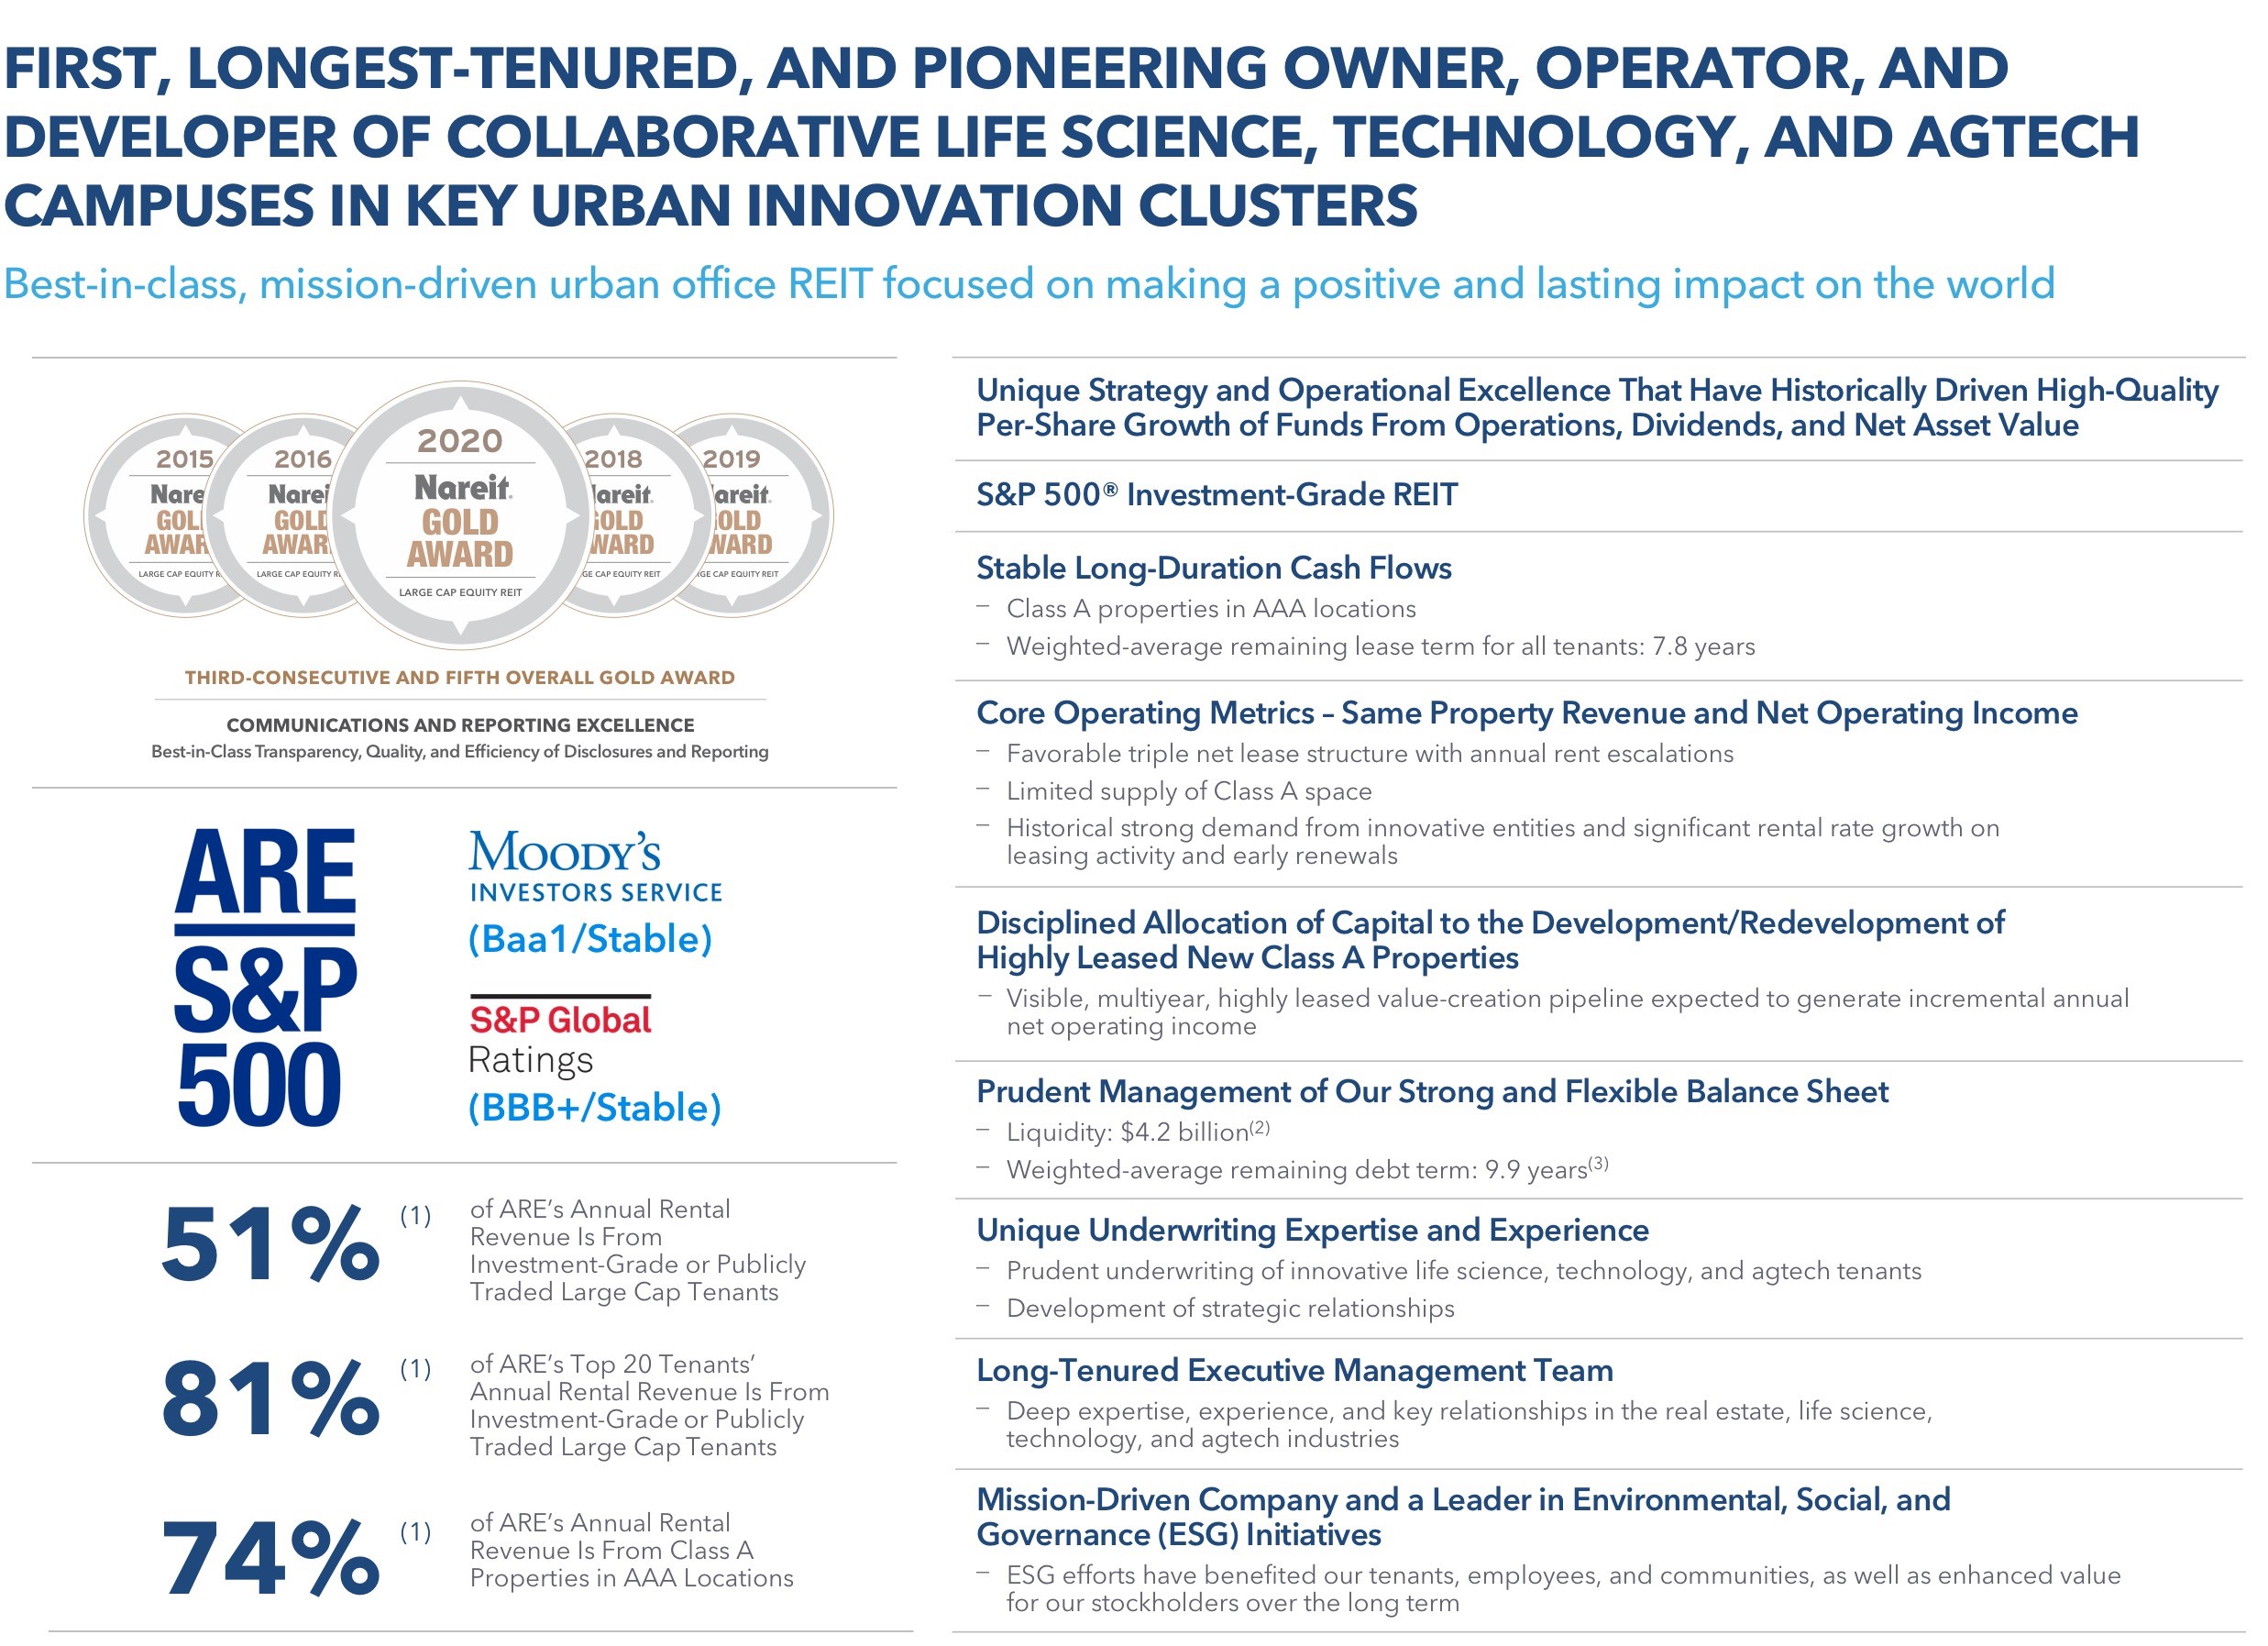
•Investment-grade credit rating, which ranks in the top 10% among all publicly traded REITs, of Baa1/Stable from Moody’s Investors Service and BBB+/Stable from S&P Global Ratings, both as of June 30, 2020.
Continued dividend strategy to share cash flows with stockholders
Common stock dividend declared for 2Q20 of $1.06 per common share, aggregating $4.12 per common share for the twelve months ended June 30, 2020, up 25 cents, or 6%, over the twelve months ended June 30, 2019. Our FFO payout ratio of 59% for the three months ended June 30, 2020, allows us to share cash flows from operating activities with our stockholders while also retaining a significant portion for reinvestment.
A REIT industry-leading, high-quality tenant roster
•51% of annual rental revenue from investment-grade or publicly traded large cap tenants.
•Weighted-average remaining lease term of 7.8 years.
Continued strength in collections drives lowest tenant receivables balance since 2012
•As of July 24, 2020, we have collected 99% of July 2020 rents and tenant recoveries.
•We have collected 99.4% of June 2020 rents and tenant recoveries.
•As of June 30, 2020, our tenant receivables balance was $7.2 million, our lowest balance since 2012.
High-quality revenues and cash flows, strong Adjusted EBITDA margin, and operational excellence
| | | | | | | | | | | | | | |
| Percentage of annual rental revenue in effect from: | | | | |
| Investment-grade or publicly traded large cap tenants | | 51 | % | | |
| Class A properties in AAA locations | | 74 | % | | |
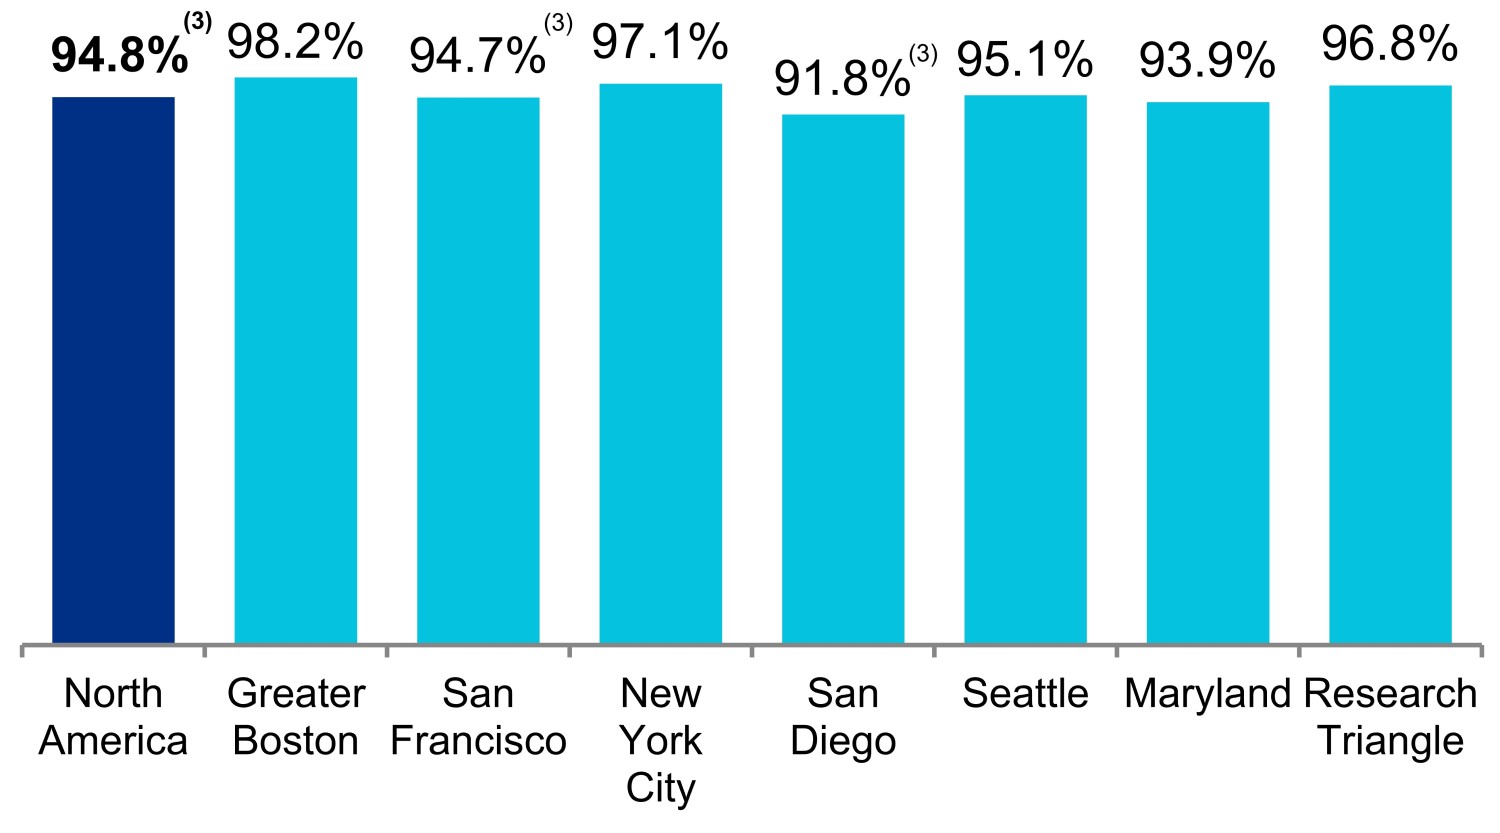
| Occupancy of operating properties in North America | | 94.8 | % | (1) | |
| Operating margin | | 72 | % | | |
| Adjusted EBITDA margin | | 69 | % | | |
| Weighted-average remaining lease term: | | | | |
| All tenants | | 7.8 | years | |
| Top 20 tenants | | 11.2 | years | |
| | | | |
(1)Includes 647,771 RSF, or 2.3%, of vacancy in our North America markets, representing lease-up opportunities at properties recently acquired, primarily at our SD Tech by Alexandria campus (joint venture), 601, 611, and 651 Gateway Boulevard (joint venture), and 5505 Morehouse Drive. Excluding these vacancies, occupancy of operating properties in North America was 97.1% as of June 30, 2020. Refer to “Occupancy” in this Supplemental Information for additional details regarding vacancy from recently acquired properties.
Strong leasing activity in 2Q20 and continued rental rate growth
•Continued strong leasing activity in light of modest contractual lease expirations at the beginning of 2020 and a highly leased value-creation pipeline; continued rental rate growth in 1H20 over expiring rates on renewed and re-leased space:
| | | | | | | | | | | | | | |
| | 2Q20 | | 1H20 |
| Total leasing activity – RSF | | 1,077,510 | | | 1,780,865 | |
| Leasing of development and redevelopment space – RSF | | 196,039 | | | 210,271 | |
| Lease renewals and re-leasing of space: | | | | |
| RSF (included in total leasing activity above) | | 699,130 | | | 1,251,152 | |
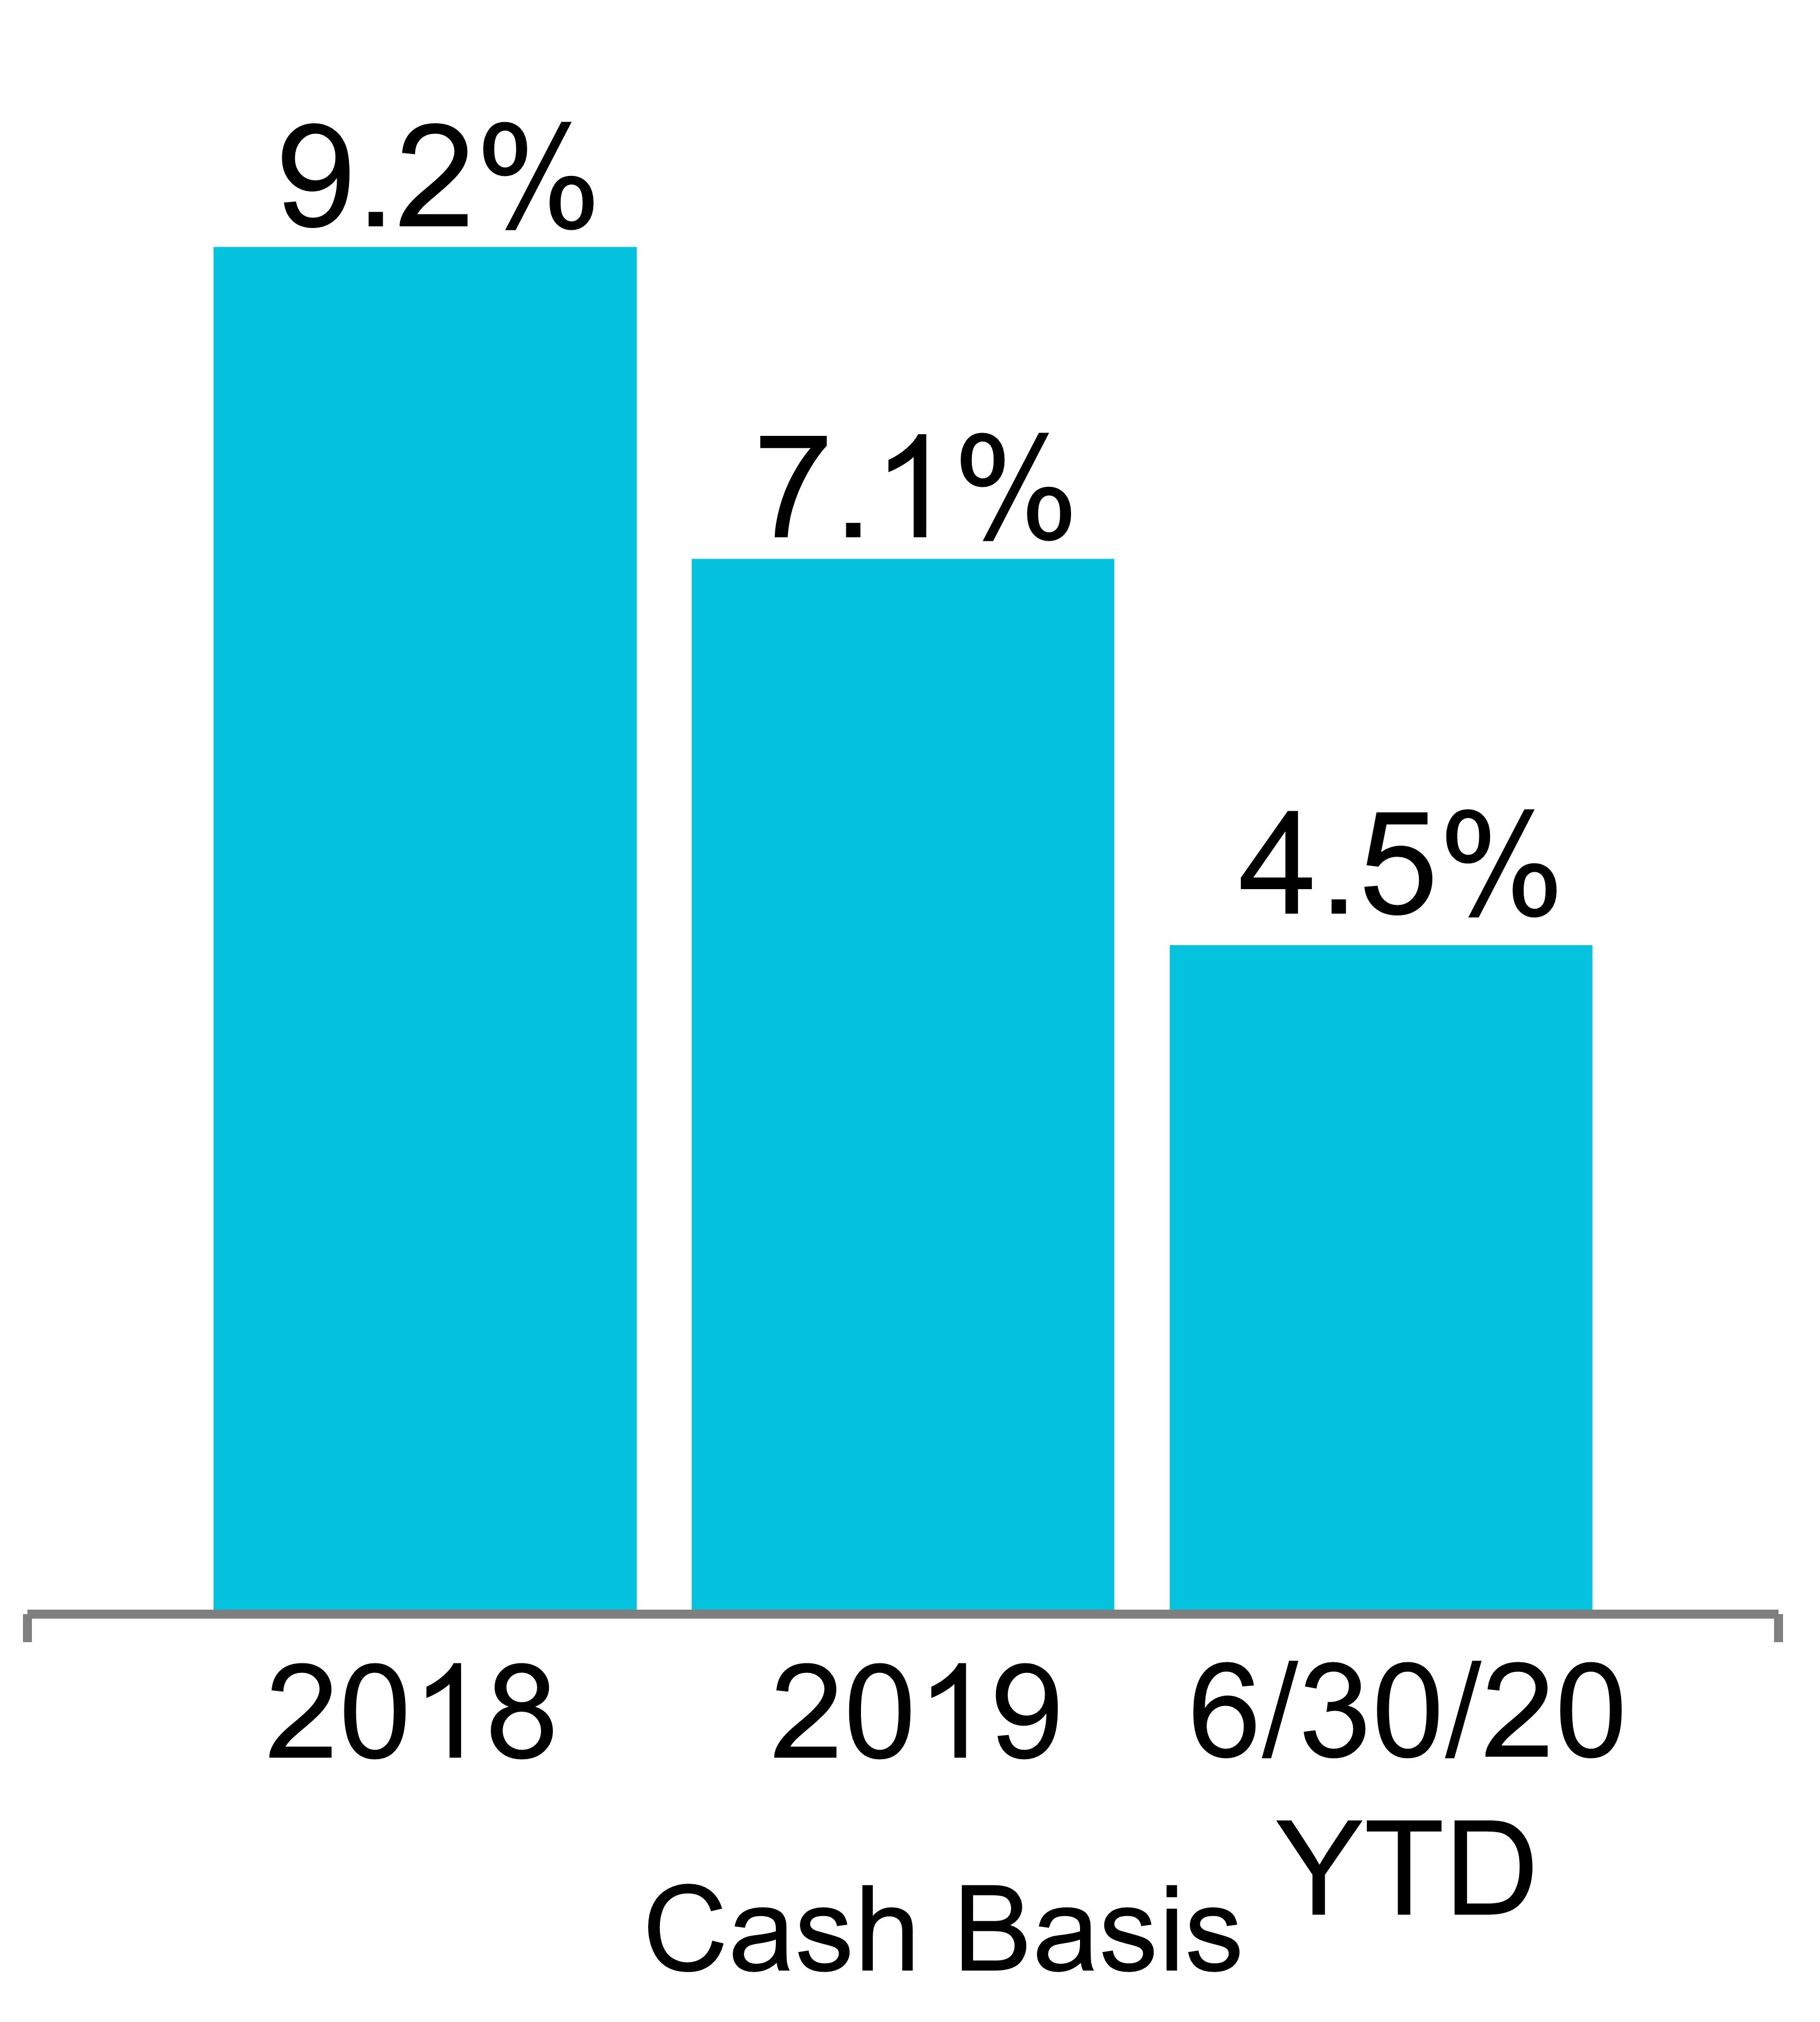
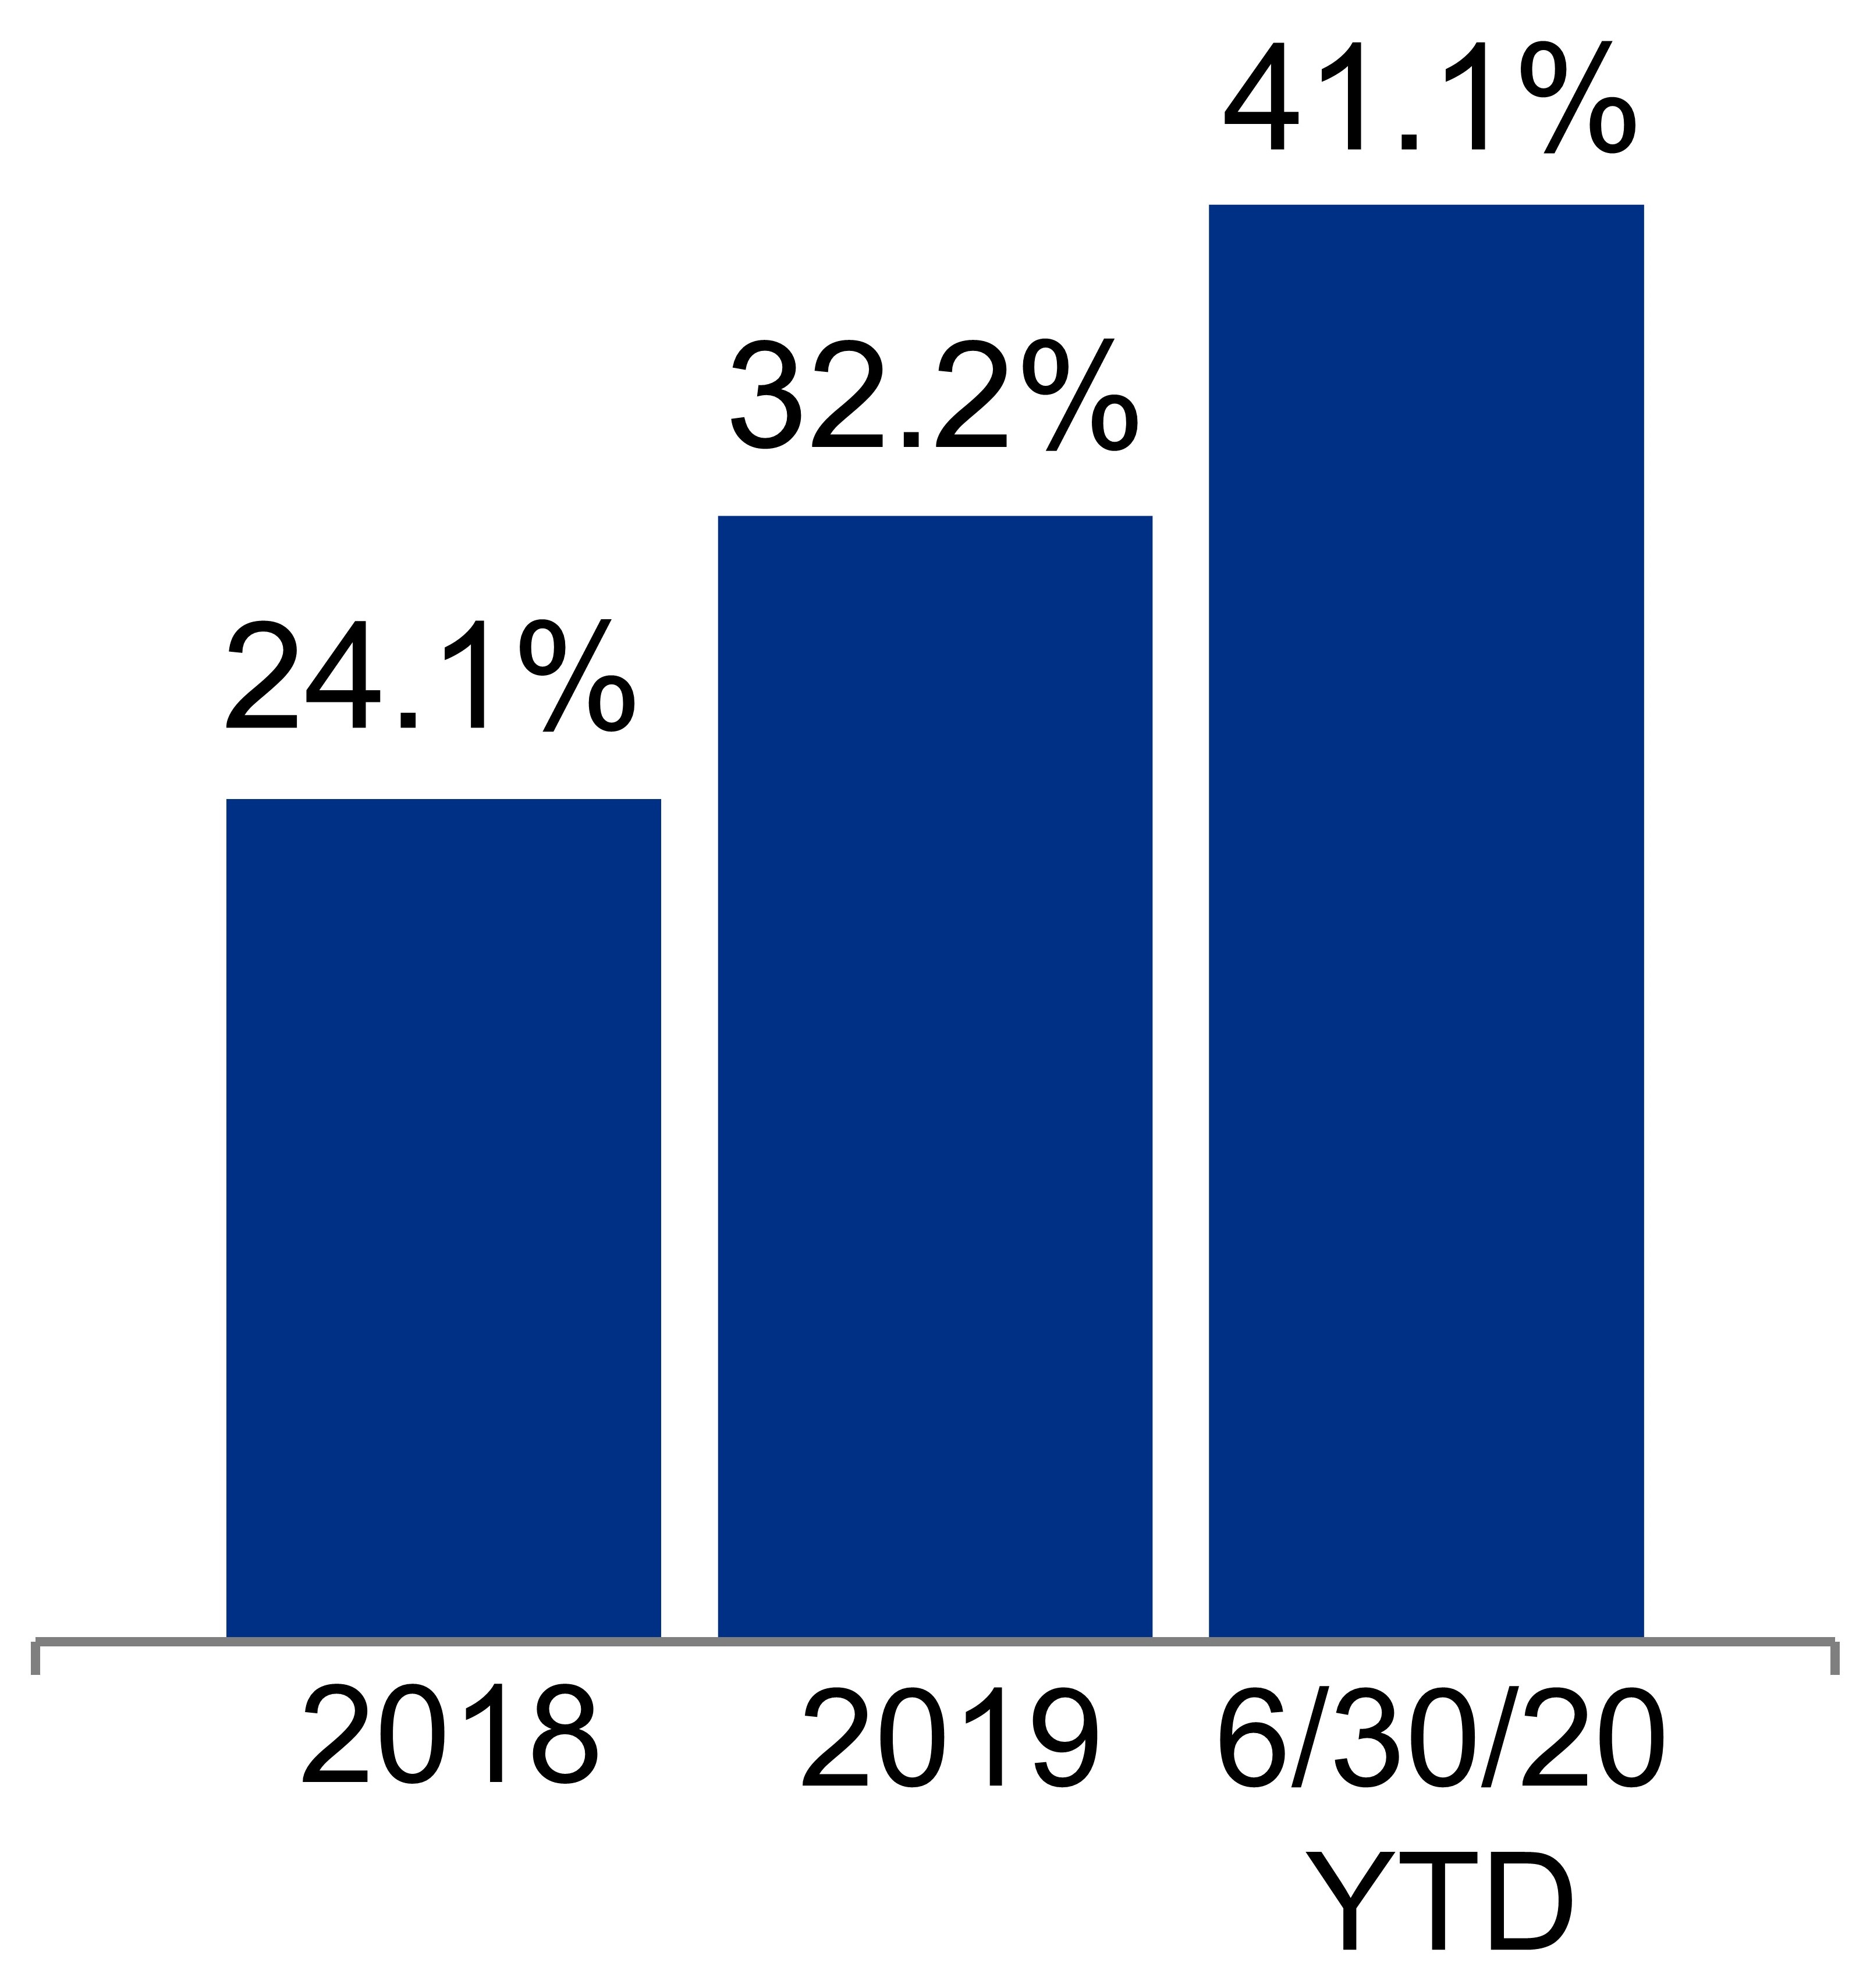
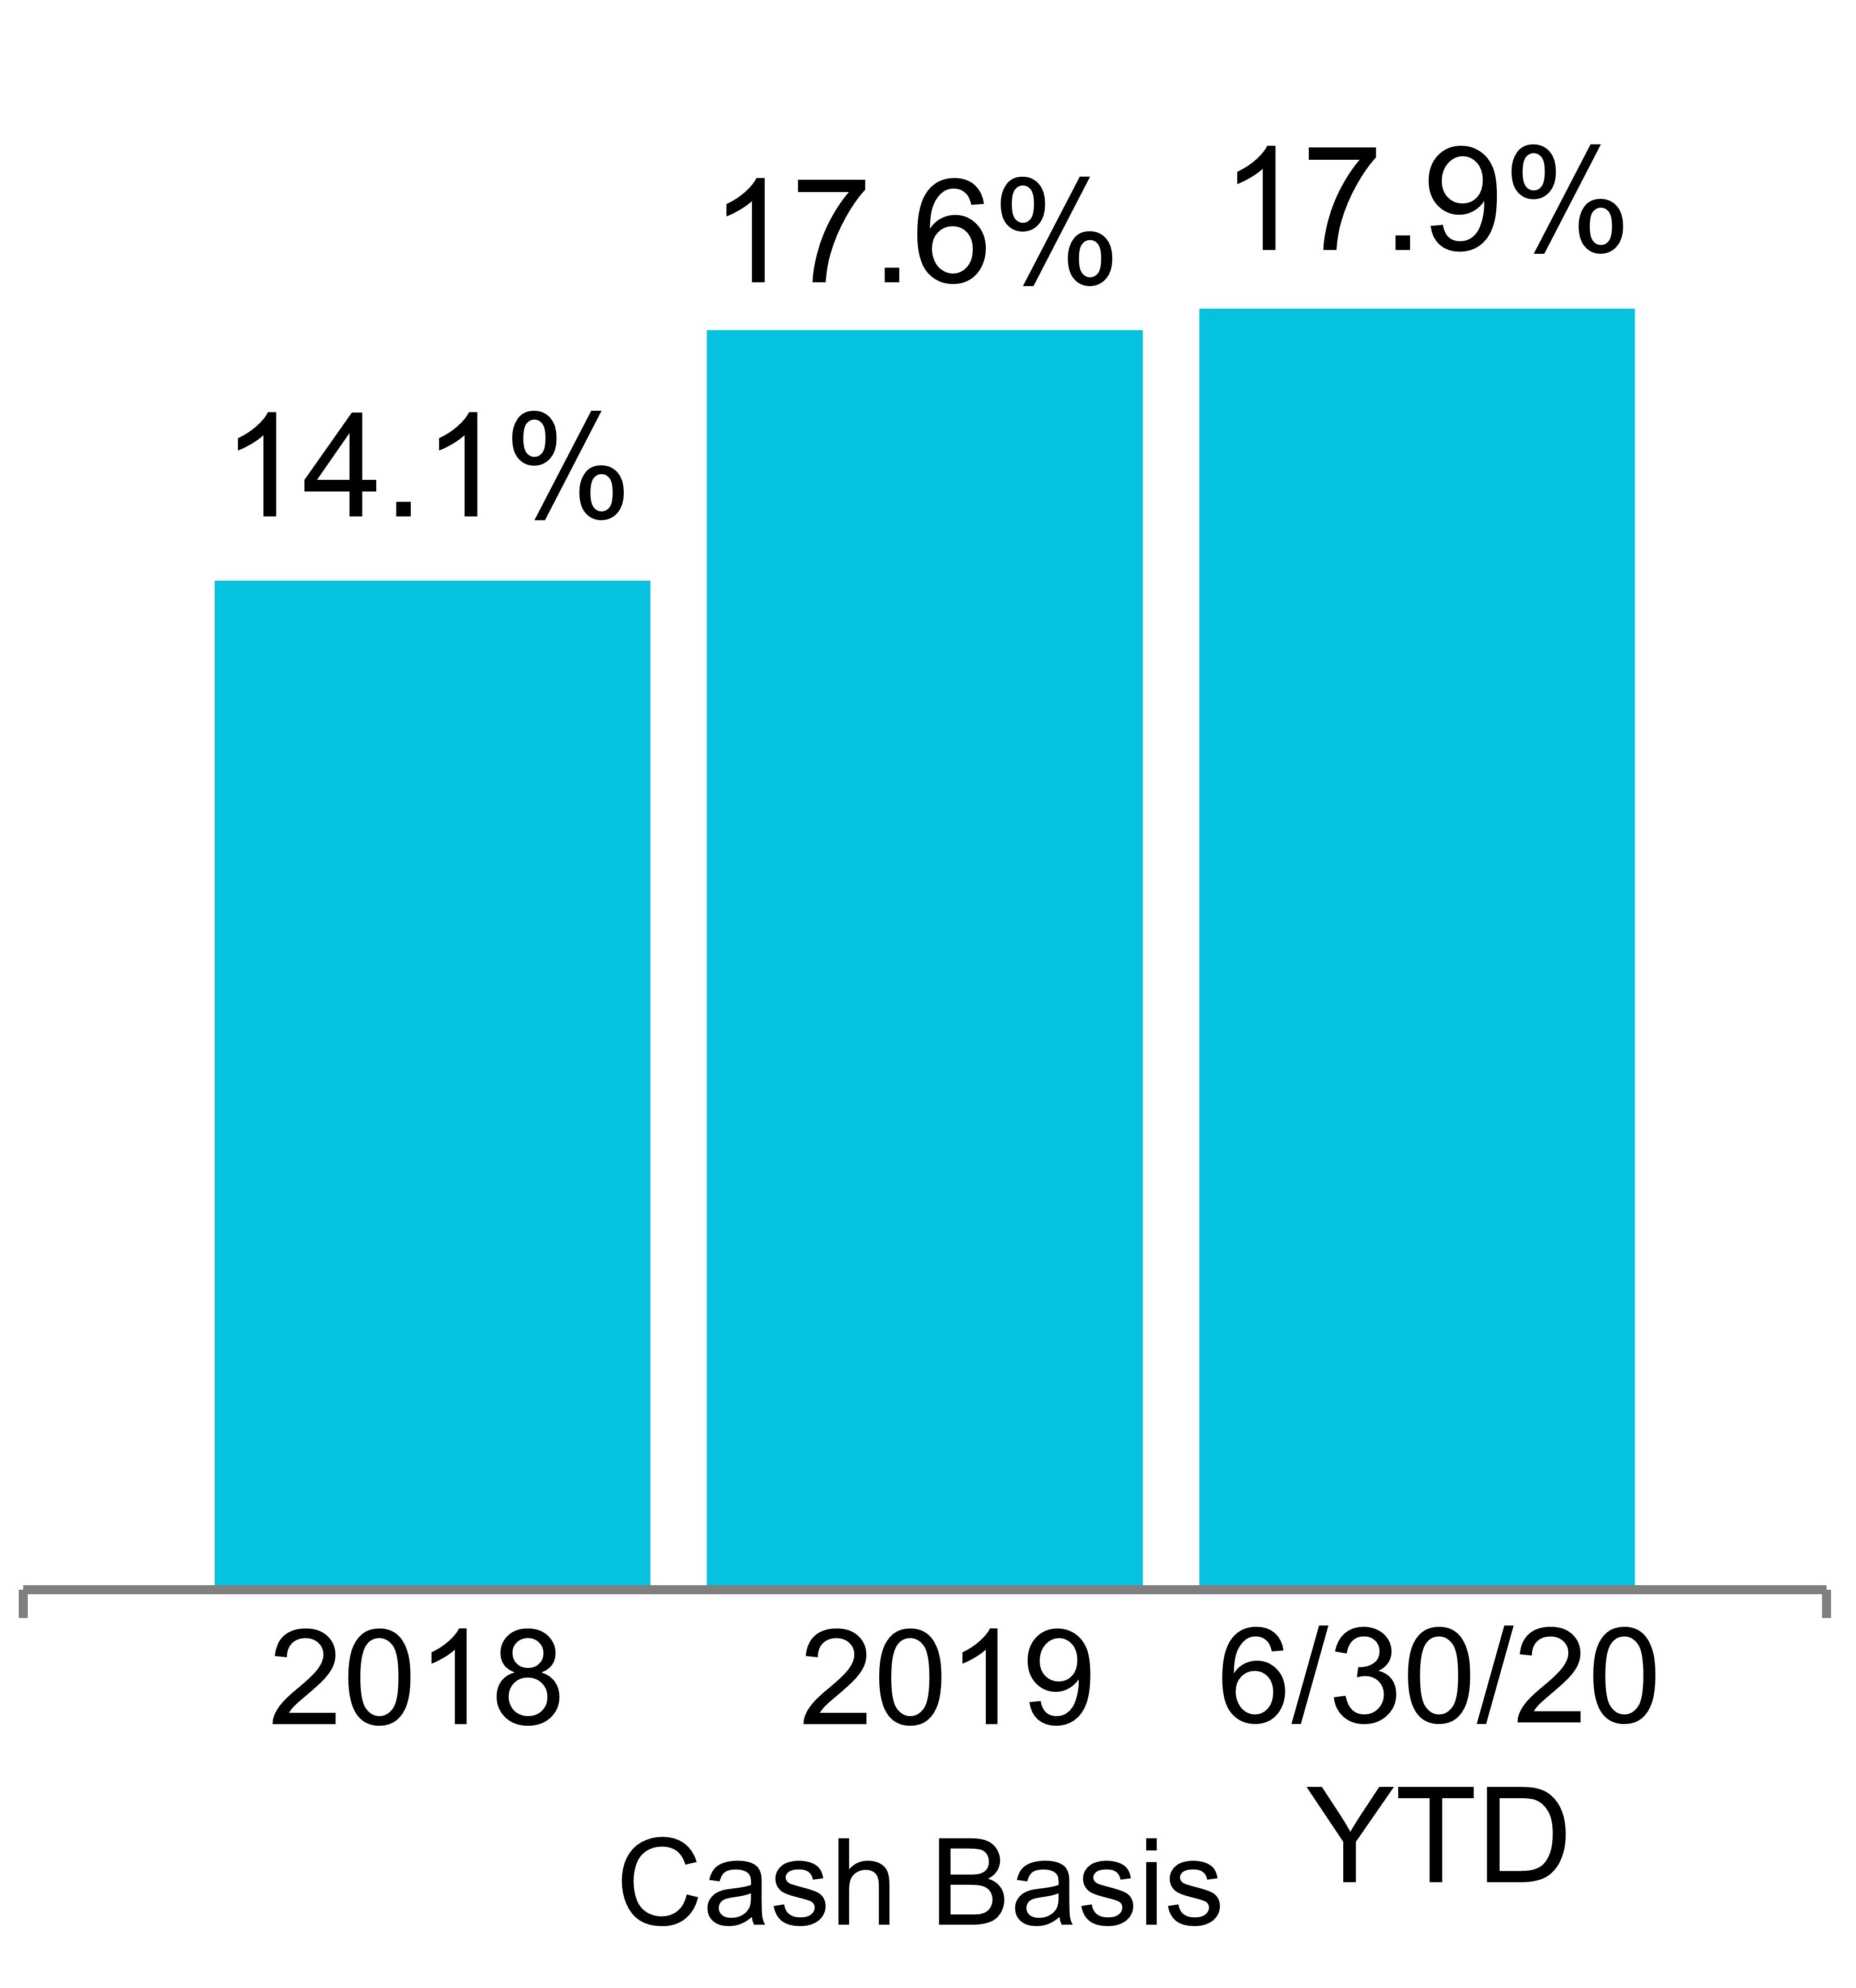
| Rental rate increases | | 37.2% | | 41.1% |
| Rental rate increases (cash basis) | | 15.0% | | 17.9% |
Guidance for unique and opportunistic value-creation acquisitions and construction
Refer to next page for specific details.
| | | | | |
| |
| |
| Second Quarter Ended June 30, 2020, Financial and Operating Results (continued) | |
| June 30, 2020 | |
| |
Key items included in operating results
| | | | | | | | | | | | | | | | | | | | | | | | | | | | | | | | | | | | | | | | | | | | | | | |
| Key items included in net income attributable to Alexandria’s common stockholders: | | | | | | | | | | | | | | | |
| (In millions, except per share amounts) | Amount | | | | Per Share – Diluted | | | | Amount | | | | Per Share – Diluted | | |
| 2Q20 | | 2Q19 | | 2Q20 | | 2Q19 | | 1H20 | | 1H19 | | 1H20 | | 1H19 |
Unrealized gains on non-real estate investments(1) | $ | 171.7 | | | $ | 11.1 | | | $ | 1.38 | | | $ | 0.10 | | | $ | 154.5 | | | $ | 83.3 | | | $ | 1.25 | | | $ | 0.75 | |
Impairment of real estate(2) | (13.2) | | | — | | | (0.11) | | | — | | | (22.9) | | (3) | — | | | (0.18) | | | — | |
Impairment of non-real estate investments(1) | (4.7) | | | — | | | (0.04) | | | — | | | (24.5) | | | — | | | (0.20) | | | — | |
| Loss on early extinguishment of debt | — | | | — | | | — | | | — | | | — | | | (7.4) | | | — | | | (0.07) | |
| Preferred stock redemption charge | — | | | — | | | — | | | — | | | — | | | (2.6) | | | — | | | (0.02) | |
| Total | $ | 153.8 | | | $ | 11.1 | | | $ | 1.23 | | | $ | 0.10 | | | $ | 107.1 | | | $ | 73.3 | | | $ | 0.87 | | | $ | 0.66 | |
| | | | | | | | | | | | | | | |
| | | | | | | | | | | | | | | |
(1)Refer to “Investments” on page 46 of our Supplemental Information for additional details. (2)Primarily relates to an impairment charge of a previously pending acquisition in April 2020 of an operating tech office property to reduce the carrying amount of a pre-acquisition deposit to zero dollars, concurrently with the submission of our notice to terminate the transaction.
(3)Amount includes $7.6 million related to our investment in a recently developed retail property held by our unconsolidated real estate joint venture and is classified in equity in earnings of unconsolidated real estate joint ventures within our consolidated statements of operations.
Guidance for unique and opportunistic value-creation acquisitions and construction
•Our initial 2020 guidance issued on December 3, 2019, included guidance midpoint for our 2020 construction spending and acquisitions of $1.6 billion and $950 million, respectively, and reflected a strong outlook for 2020, including continued strong demand for our value-creation development and redevelopment projects.
•Our guidance issued on April 27, 2020, reduced our 2020 forecasted construction spend, acquisitions, real estate dispositions and partial interest sales, and issuance of common equity. These reductions were deemed necessary while we monitored the impact of COVID-19 on many areas of our business, including the overall macro and capital market environments.
•Our guidance issued on July 27, 2020, was updated to address the continuing tenant demand for our development and redevelopment pipeline in part due to COVID-19 requirements, as well as existing and anticipated attractive acquisition opportunities in our markets, which will be partially funded through forecasted real estate dispositions and partial interest sales. Key updates to our sources and uses include:
•Increased midpoint for our 2020 construction spending guidance range from $960.0 million to $1.35 billion.
•An additional $900 million to $1.3 billion of real estate acquisitions in 2H20, including acquisitions completed in July 2020.
•Increased midpoint of our real estate dispositions and partial interest sales from $50.0 million to $1.25 billion, which is expected to fund a portion of the increase in construction spending and acquisitions in addition to providing significant capital for growth over the next two to three quarters.
•See “Key capital events” on page 3 for additional details on our July 2020 forward equity offering.
•See “Guidance” on page 10 for detailed assumptions for our updated guidance.
2020 Nareit Gold Investor CARE Award winner
2020 recipient of the Nareit Gold Investor CARE (Communications and Reporting Excellence) Award in the Large Cap Equity REIT category as the best-in-class REIT that delivers transparent, quality, and efficient communications and reporting to the investment community; our fifth Nareit Gold Investor CARE Award over the last six years, and our third consecutive Gold Award.
Core operating metrics
Continued strong net operating income and internal growth
•Net operating income (“NOI”) (cash basis) of $1.1 billion for 2Q20 annualized, up $165.0 million, or 17.6%, compared to 2Q19 annualized.
•94% of our leases contain contractual annual rent escalations approximating 3.0%.
•Same property net operating income growth:
•1.6% and 4.5% (cash basis) for 1H20 over 1H19.
•0.6% and 2.5% (cash basis) for 2Q20 over 2Q19.
•Includes the effect of temporary reduction in same property occupancy of 80 basis points related to downtime in connection with leases aggregating 152,045 RSF, with 63% already leased for delivery in the third quarter of 2020 at significantly higher rental rates. Excluding the impact of the temporary vacancies, the same property net operating income growth for the three months ended June 30, 2020, would have been 1.6% and 4.2% (cash basis), respectively. We expect occupancy and other contractual rental increases in the second half of 2020 will increase same property NOI and same property NOI (cash basis) to within our guidance range for the year ending December 31, 2020.
•Minimal remaining 2020 contractual lease expirations, aggregating 2.3% of annual rental revenue.
Highly leased value-creation pipeline, including COVID-19-focused R&D space
•Current projects aggregating 3.3 million RSF, including COVID-19-focused R&D spaces, are highly leased at 61% and will generate significant revenues and cash flows.
•As of July 27, 2020, construction activities were in process at all of our active value-creation projects.
•Significant pre-leasing at two new value-creation projects in our Sorrento Mesa submarket:
•Near-term development project at SD Tech by Alexandria, aggregating 176,428 RSF, is 59% pre-leased; and
•Active redevelopment project at 9877 Waples Street, a recently acquired property aggregating 63,774 RSF, is 100% pre-leased.
•Annual net operating income (cash basis), including our share of unconsolidated real estate joint ventures, is expected to increase $29 million upon the burn-off of initial free rent on recently delivered projects.
Strategic acquisitions with significant value-creation opportunities in key submarkets
•During 2Q20, we completed the acquisition of four properties aggregating 1.6 million RSF, including 1.4 million RSF of future value-creation opportunities and 63,774 RSF currently undergoing redevelopment, for an aggregate purchase price of $215.3 million. Refer to “Acquisitions” of this Earnings Press Release for additional details.
| | | | | |
| |
| |
| Second Quarter Ended June 30, 2020, Financial and Operating Results (continued) | |
| June 30, 2020 | |
| |
Balance sheet management
Key metrics as of June 30, 2020
•$27.7 billion of total market capitalization.
•$20.2 billion of total equity capitalization.
•$4.2 billion of liquidity as of June 30, 2020, pro forma for our $1.1 billion forward equity sales agreements entered into in July 2020.
| | | | | | | | | | | | | | | | | | | | | | | | | | |
| | 2Q20 | | | | | Goal | |
| | Quarter | | | Trailing | | 4Q20 | |
| | Annualized | | | 12 Months | | Annualized | |
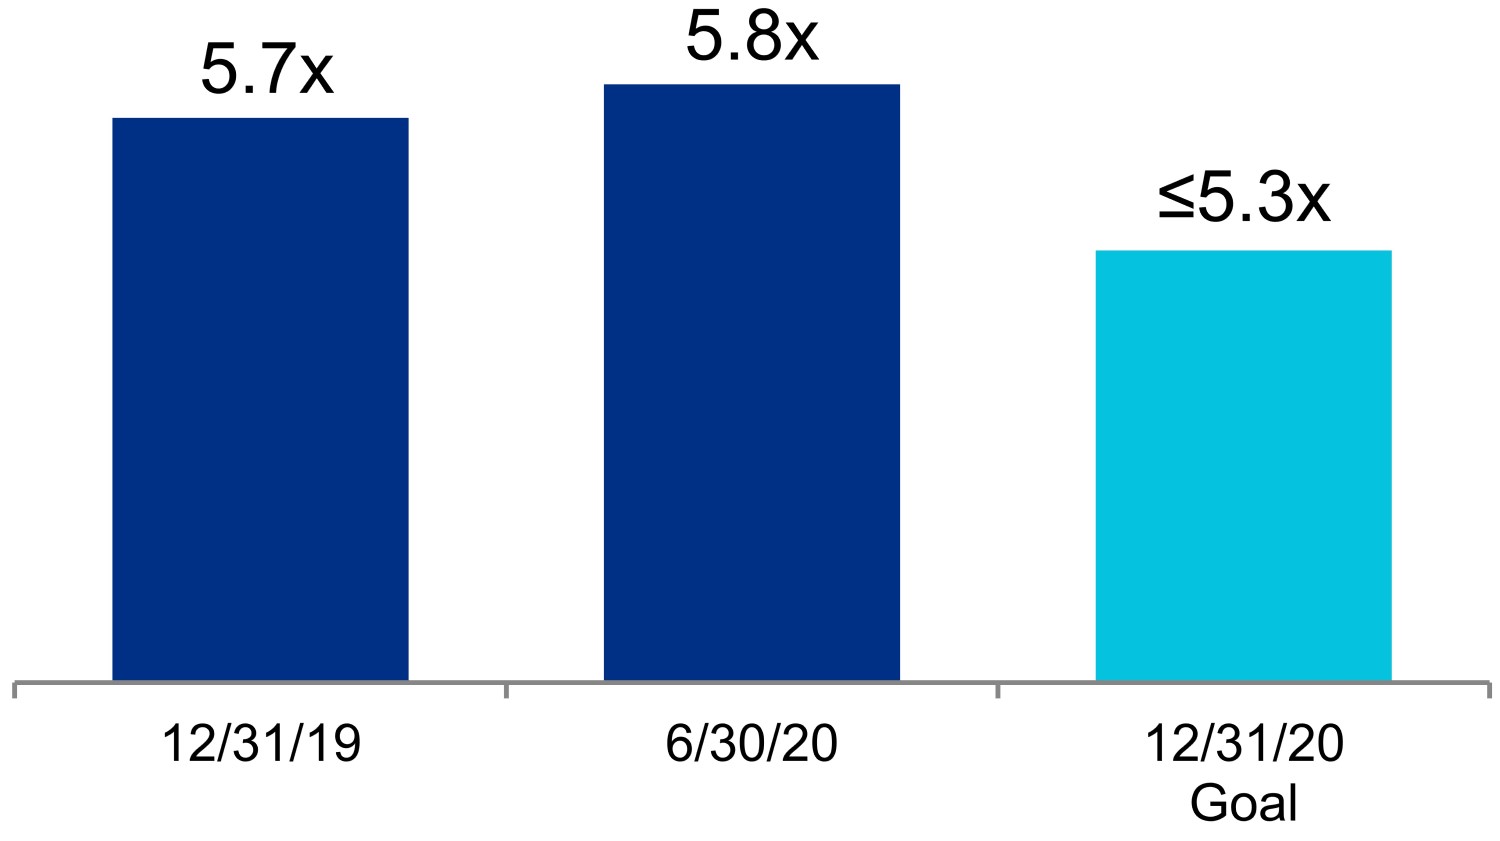
| Net debt and preferred stock to Adjusted EBITDA | | 5.8x | | | 6.2x | | Less than or equal to 5.3x | |
| Fixed-charge coverage ratio | | 4.2x | | | 4.2x | | Greater than or equal to 4.4x | |
| | | | | | | | |
| | | | | | | | | | | | |
| Value-creation pipeline of new Class A development and redevelopment projects as a percentage of gross investments in real estate | | 2Q20 | | |
| Current projects 65% leased/negotiating | | 7% | | |
Income-producing/potential cash flows/covered land play(1) | | 6% | | |
| Land | | 2% | | |
| | | | |
(1)Includes projects that have existing buildings that are generating or can generate operating cash flows. Also includes development rights associated with existing operating campuses.
Key capital events
•In April 2020, we closed an additional unsecured senior line of credit with $750.0 million of available commitments. The new unsecured senior line of credit matures on April 14, 2022, and bears interest at LIBOR plus 1.05%. Pursuant to the terms of the agreement, we are required to repay the facility, if applicable, and reduce commitments available upon receiving the net proceeds from certain qualifying events, including new corporate debt and 50% of proceeds from the issuance of common stock, including any net proceeds from the settlement of our July 2020 forward equity sales agreements. Including our existing $2.2 billion unsecured senior line of credit, we have $2.95 billion in aggregate commitments under our unsecured senior lines of credit as of June 30, 2020.
•In 2020, we entered into forward equity sales agreements to sell an aggregate 13.8 million shares of our common stock (including the exercise of an underwriters’ option). As of July 27, 2020, our outstanding forward equity agreements are as follows:
| | | | | | | | | | | | | | | | | | | | | | | | | | | | | | | | |
| | Public Offering Price | | Shares
(in thousands) | | | | Net Proceeds
(in thousands) | | |
| Date | | | | Settled | | Outstanding | | Received | | Remaining |
| January 2020 | | $ | 155.00 | | | 3,356 | | | 3,544 | | | $ | 500,001 | | | $ | 519,621 | |
| July 2020 | | $ | 160.50 | | | — | | | 6,900 | | | — | | | 1,061,952 | |
| | | | 3,356 | | | 10,444 | | | $ | 500,001 | | | $ | 1,581,573 | |
| | | | | | | | | | |
•During the three months ended June 30, 2020 and through July 27, 2020, there was no sale activity under our “at-the-market” common stock offering program (“ATM program”). As of July 27, 2020, we have $843.7 million remaining available under our ATM program.
Investments
•Our investments in publicly traded companies and privately held entities aggregated a carrying amount of $1.3 billion, including an adjusted cost basis of $762.3 million and unrealized gains of $556.2 million, as of June 30, 2020.
•Investment income included $184.7 million during 2Q20, comprising $17.7 million in realized gains, $4.7 million in impairments related to privately held non-real estate investments, and $171.7 million in unrealized gains.
Leader in corporate responsibility: philanthropic activities and partnerships to positively impact our communities
At the vanguard of fighting COVID-19 by aiding communities adversely affected by the global pandemic
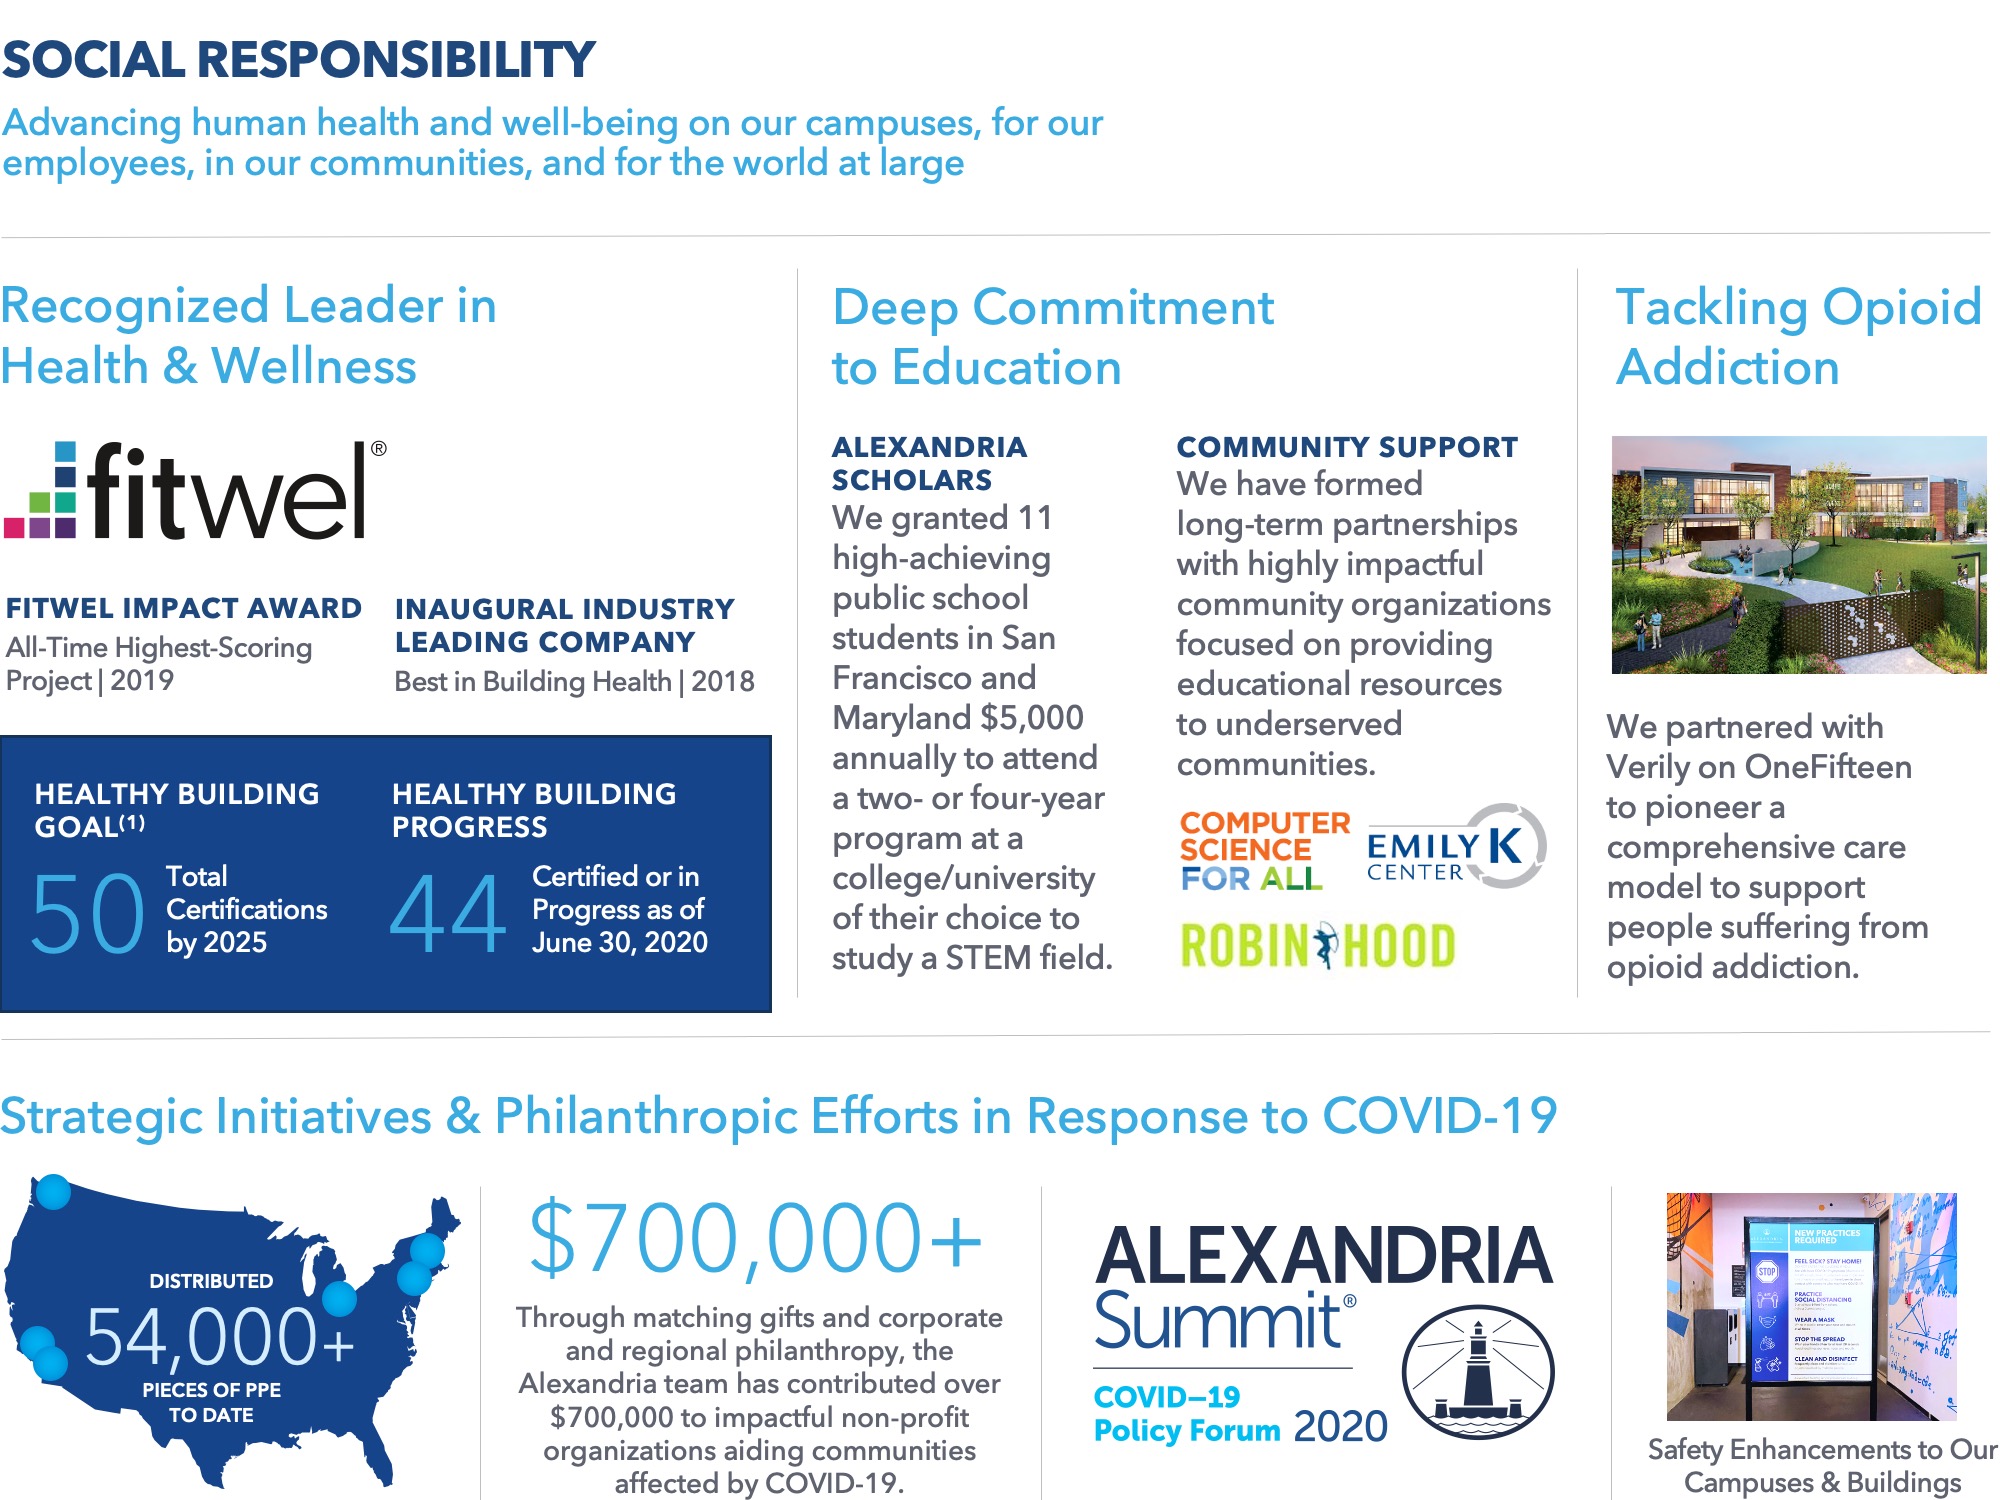
•Alexandria has sourced and donated over 54,000 pieces of much-needed personal protective equipment to 12 hospitals and other entities in need in New York City, Boston, Seattle, San Diego, Dayton, and Los Angeles for use by medical professionals working on the front lines of the COVID-19 response. Through strategic philanthropic giving and the Company’s matching gift programs, Alexandria donated, in aggregate, over $700,000 to several highly impactful national and regional organizations performing important work to support a myriad of efforts in communities affected by this global public health emergency, including the following:
•Feeding America – COVID-19 Response Fund, the fund from the nation’s largest hunger-relief organization with a network of 200 member food banks, is supporting the food banks that help people feed their families during the school closures, job disruptions, and health risks related to the COVID-19 pandemic.
•First Responders Children’s Foundation COVID-19 Emergency Response Fund is providing support to the families of first responders on the front lines of the COVID-19 pandemic, who are enduring financial hardship due to the outbreak.
•Robin Hood’s COVID-19 Relief Fund, from New York City’s largest poverty-fighting organization, is providing immediate, short-term grants to support non-profits that are on the front lines in the fight against COVID-19 so they can move swiftly to serve affected communities.
•Relief Opportunities for All Restaurants (ROAR) is providing financial relief directly to employees of restaurants who have lost their jobs as a result of the COVID-19 pandemic.
•City of Cambridge Disaster Fund for COVID-19 is providing emergency assistance in partnership with non-profit organizations to individuals and families in Cambridge experiencing extreme financial hardship caused by the COVID-19 crisis.
•Project Angel Food is committed to providing uninterrupted deliveries of nutritious medically tailored meals to people impacted by serious illness in the Los Angeles area throughout the duration of the COVID-19 pandemic.
Driving educational opportunity and providing resources to underserved communities
•We regard education as one of the most fundamental foundations to achieving a safe, healthy, and good life. As a result, we have forged deep partnerships with inspiring community organizations focused on providing educational resources to underserved communities in a multitude of ways. Working closely with these organizations, we have helped open the doors of opportunity for countless students.
| | | | | |
| |
| |
| Second Quarter Ended June 30, 2020, Financial and Operating Results (continued) | |
| June 30, 2020 | |
| |
Driving educational opportunity and providing resources to underserved communities (continued)
•During 2Q20, we announced Alexandria’s 2020 scholarship recipients, 11 high-achieving public school students in San Francisco and Maryland who will each receive $5,000 annually to attend either a two- or four-year program at a college/university of their choice to study one of the STEM (science, technology, engineering, and mathematics) fields.
•As both a founding and sustaining donor, we have been passionate longtime supporters of Computer Science for All (CS4ALL) — a 10-year initiative launched in 2015 to provide high-quality computer science education for New York City’s 1.1 million public school students. Alexandria volunteers have worked alongside NYC high school students to rebuild computers donated by Alexandria for use in the CS4ALL program; served as judges for CS4ALL’s Hack League, a citywide coding competition involving students from 62 middle and high schools across New York City; participated in multiple Computer Science Education Weeks, a global effort encouraging computer science education; and hosted CS4ALL students at the Alexandria Center® for Life Science – NYC for them to learn about the vast array of jobs that computer science touches and the career paths available to them. Our ongoing partnership with CS4ALL has helped ensure that NYC’s public school students have the skills they need to achieve success in higher education, the 21st-century job market, and beyond.
•Through our very hands-on work with, and mission-critical funding support for, the Emily Krzyzewski Center in Durham, North Carolina, we are helping propel academically focused, low-income K–12 students and graduates toward success in college. Emily K programs begin in elementary and middle school to build and accelerate academic skills that lay the foundation for future college success. As students move on to high school, they receive holistic support in the areas of college planning, personal management and leadership, academic skills development, and career exploration, leading to graduating seniors who are scholarship eligible and college ready. After 12 years, the success rate for admittance to a four-year college is 100%.
•Robin Hood, New York City’s largest poverty fighting organization, has an intense focus on education and works to ensure that low-income students at risk of not finishing high school graduate ready to succeed in college and career. Robin Hood has provided over $29 million in funding to impactful tutoring and mentorship programs, college prep programs, mental health and counseling services, and teacher training initiatives and has helped more than 55,000 students across the city last year alone. We have very actively worked with CEO Wes Moore, as well as offered significant financial support, to make a huge impact in the underserved communities of New York City through highly important programs that have measurable outcomes.
•Alexandria has worked closely with Breakthrough Greater Boston (BTGB) over many years to prepare low-income students for success in college and train the next generation of urban teachers. Through six years of intensive, tuition-free, out-of-school-time programming, BTGB changes students’ academic trajectories and supports them along the path to college. Students gain a passion for learning and the perseverance and tools needed to succeed in college and beyond. BTGB also works to build the next generation of teachers through competitive recruitment, research-based training, and coaching from master teachers. Teaching Fellows gain intensive in-classroom experience, expert training, and 1:1 coaching.
Pioneering a uniquely comprehensive care model to tackle opioid addiction
•Against the backdrop of the COVID-19 pandemic, the U.S. opioid epidemic remains one of the most devastating public health issues of our time. With many people confronting additional stresses such as isolation, unemployment, anxiety, and loss, monthly drug overdose deaths, which decreased in 2018 for the first time in 25 years, have skyrocketed to record numbers during the pandemic, up 42% in May 2020 relative to May 2019. This alarming spike in drug overdoses highlights the urgent unmet need for evidence-based holistic treatment systems for addiction.
•As a key component of Alexandria’s mission to advance human health, we partnered with Verily, an Alphabet company, to pioneer a comprehensive care model for the full and sustained recovery of people suffering from opioid addiction. The 59,000 RSF campus, situated on 4.3 acres in Dayton, Ohio, includes dedicated facilities and services for treatment, residential housing, group therapy, family reunification, fitness, workforce development programs, job placement, and community transition. Alexandria has led the design and development of the campus, which opened to patients in the fall of 2019. In July 2020, we completed OneFifteen Living, the campus's three-story residential facility designed to serve as a safe place for individuals suffering from opioid addiction to live while accessing on-campus treatment services.
•As overdose deaths in 1H20 are up 34% compared to 1H19 in Montgomery County, Ohio, where our state-of-the-art OneFifteen campus is located, OneFifteen's doors are open to those ready to make a change and it has also successfully ramped up telehealth services to ensure those needing its addiction services do not experience a gap in care during this critical time. It is our sincerest hope that OneFifteen will not only provide hope for the Dayton community, but that is also serves as a blueprint for rest of the country.
Industry and ESG leadership
•In June 2020, our executive chairman and founder, Joel S. Marcus, had the honor of serving as the keynote speaker for a special fireside chat at the virtual BIO Health Caucus hosted by the Association of University Research Parks, an organization dedicated to guiding leaders to cultivate communities of innovation at global anchor institutions. The virtual fireside, titled “Three Decades of Building Bio Health Facilities and Companies,” covered a broad array of topics that provided a comprehensive view of our essential business, our dynamic cluster locations, and our critical role at the vanguard of the life science ecosystem fighting COVID-19.
•In June 2020, we released our 2019 Corporate Responsibility Report, which reinforces Alexandria’s longstanding environmental, social, and governance commitment, strong progress toward our 2025 environmental impact goals, and critical role at the vanguard of the life science ecosystem advancing solutions for COVID-19.
•In June 2020, we announced that Alexandria LaunchLabs® – AgTech awarded its inaugural $100,000 AgTech Innovation Prize to TerMir Inc., an early-stage agtech company aiming to address key, unresolved agricultural, environmental, and human health challenges.
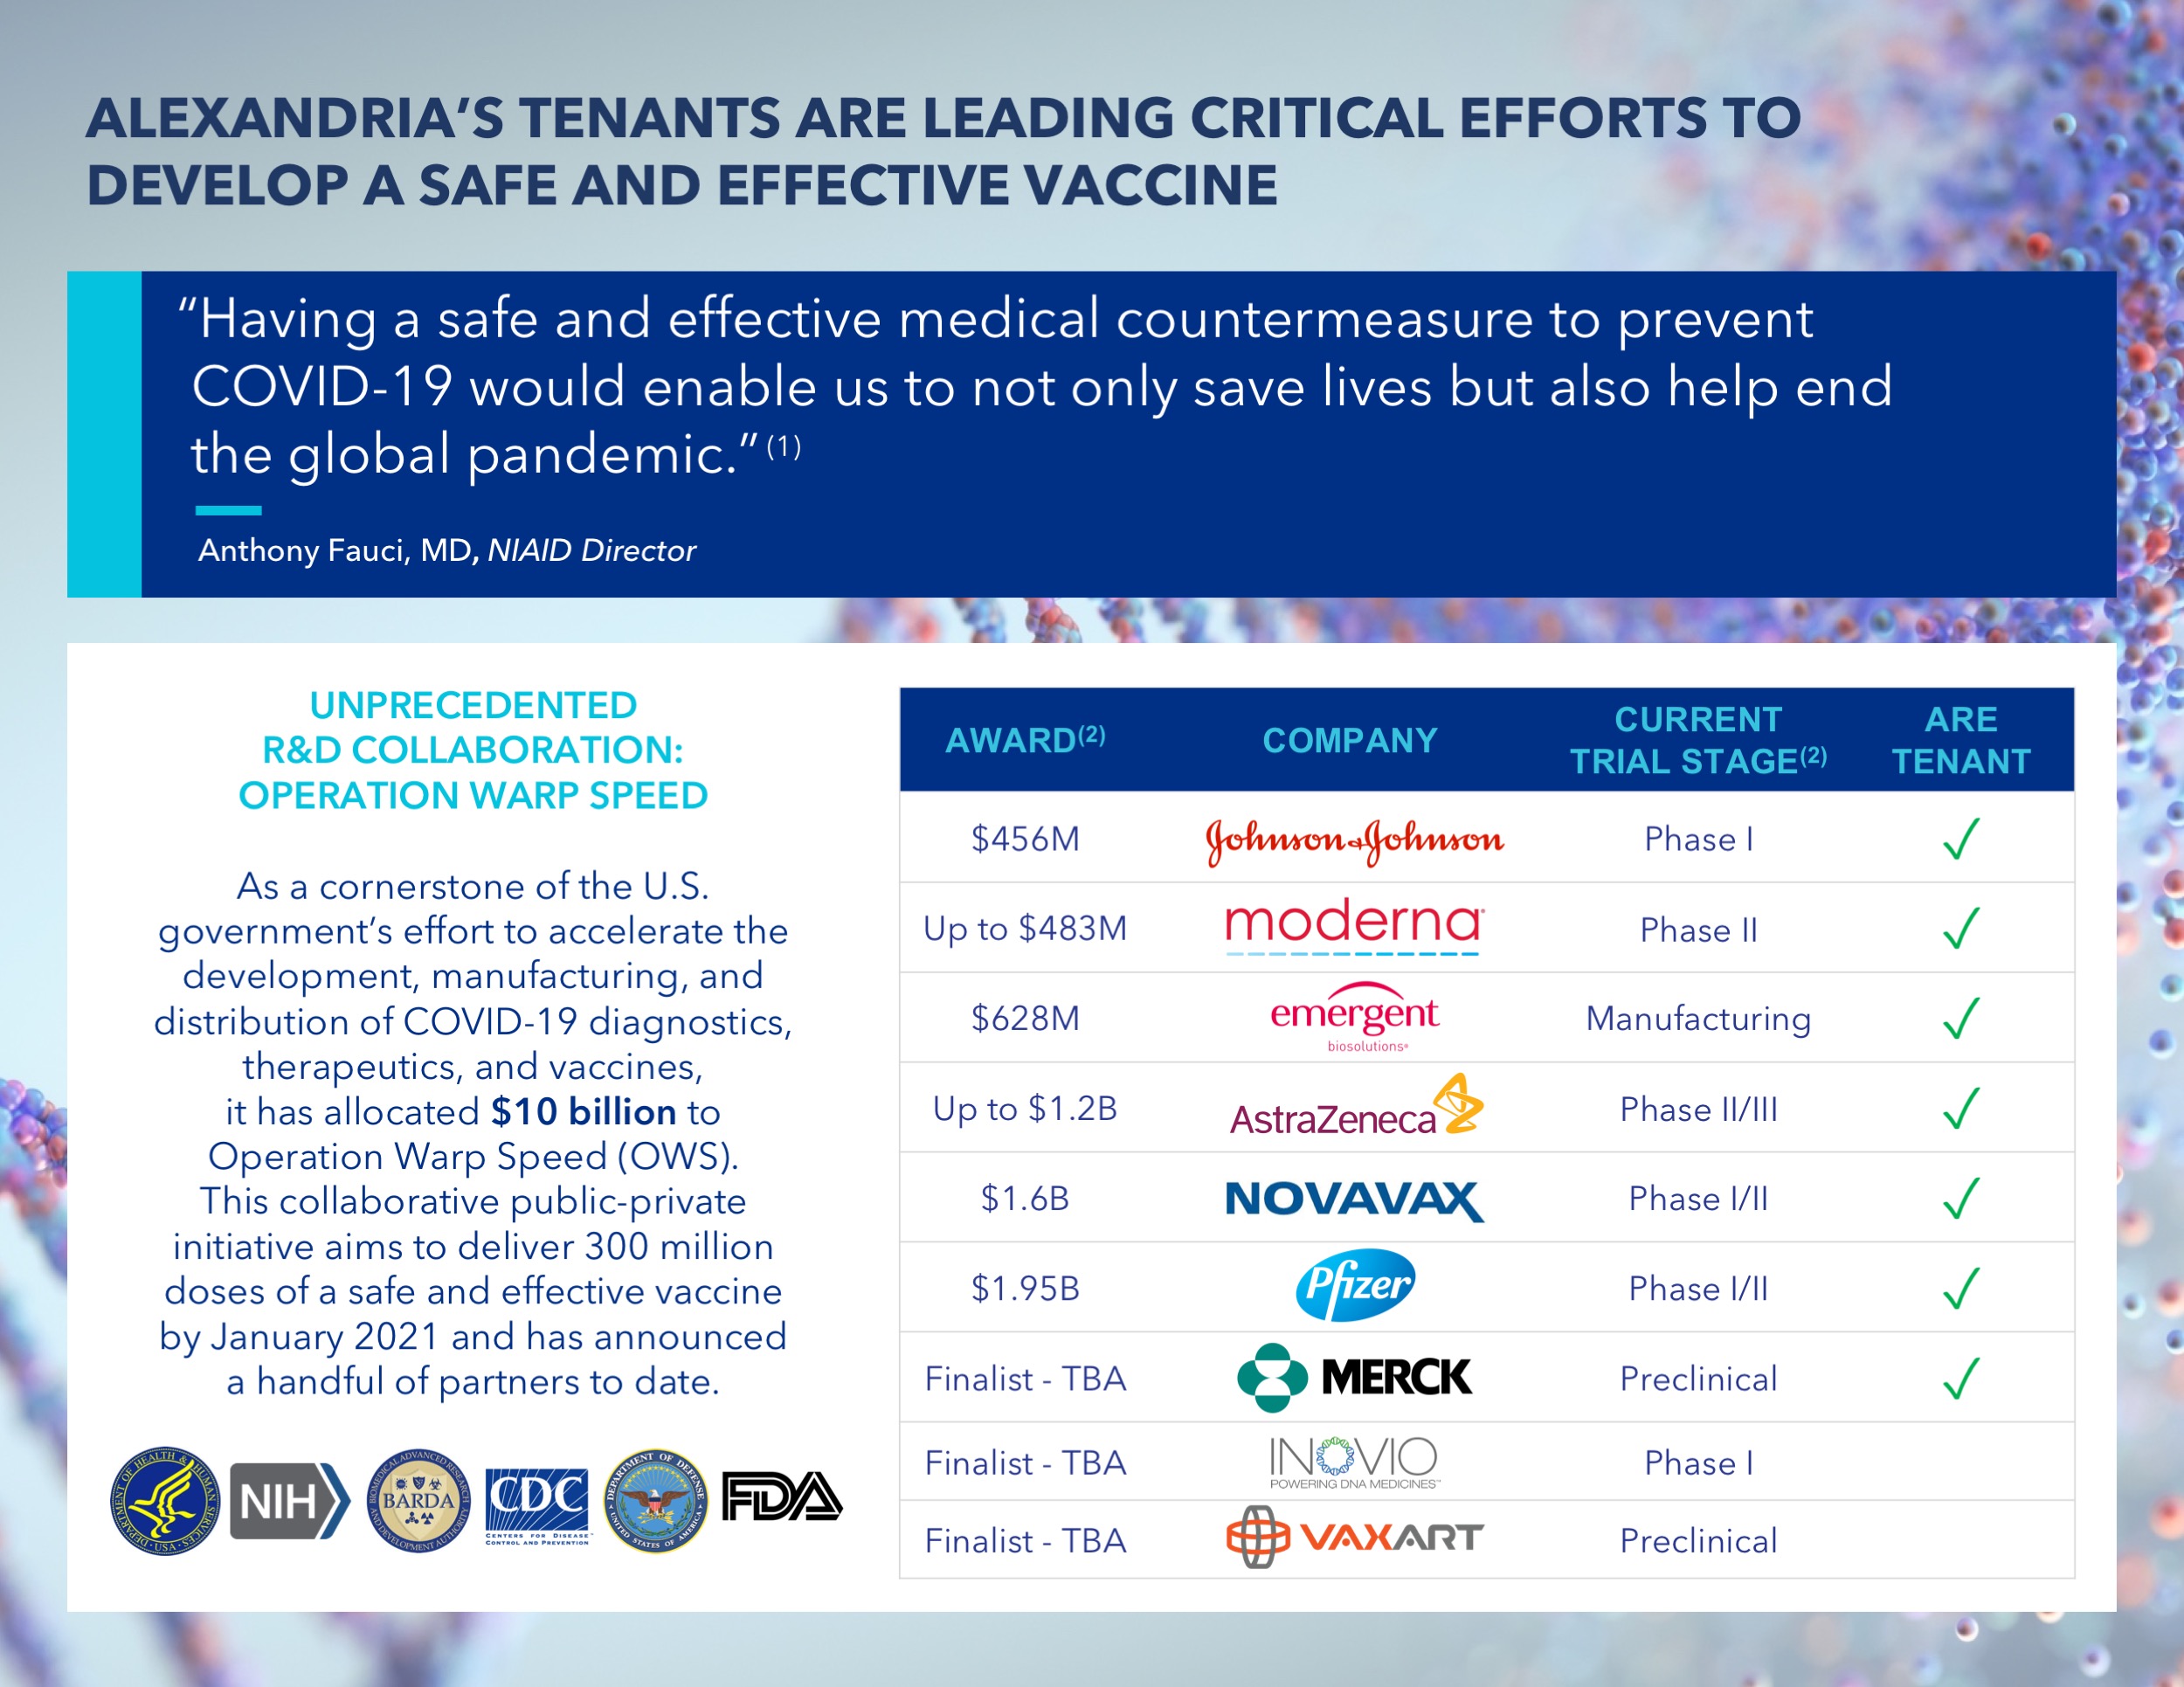
(1)Represents an illustrative subset of over 80 tenants focused on COVID-19-related efforts, with some of these companies working on multiple efforts that span testing, treatment, and/or vaccine development.
(1)Source: FierceBiotech, “NIAID creates new COVID-19 drug and vaccine trial network through Trump's Warp Speed program,” July 9, 2020.
(2)Announced award value and clinical trial stage as of July 24, 2020.
| | | | | |
| |
| Alexandria Fighting COVID-19 on Multiple Fronts | |
| |
| June 30, 2020 | |
| |
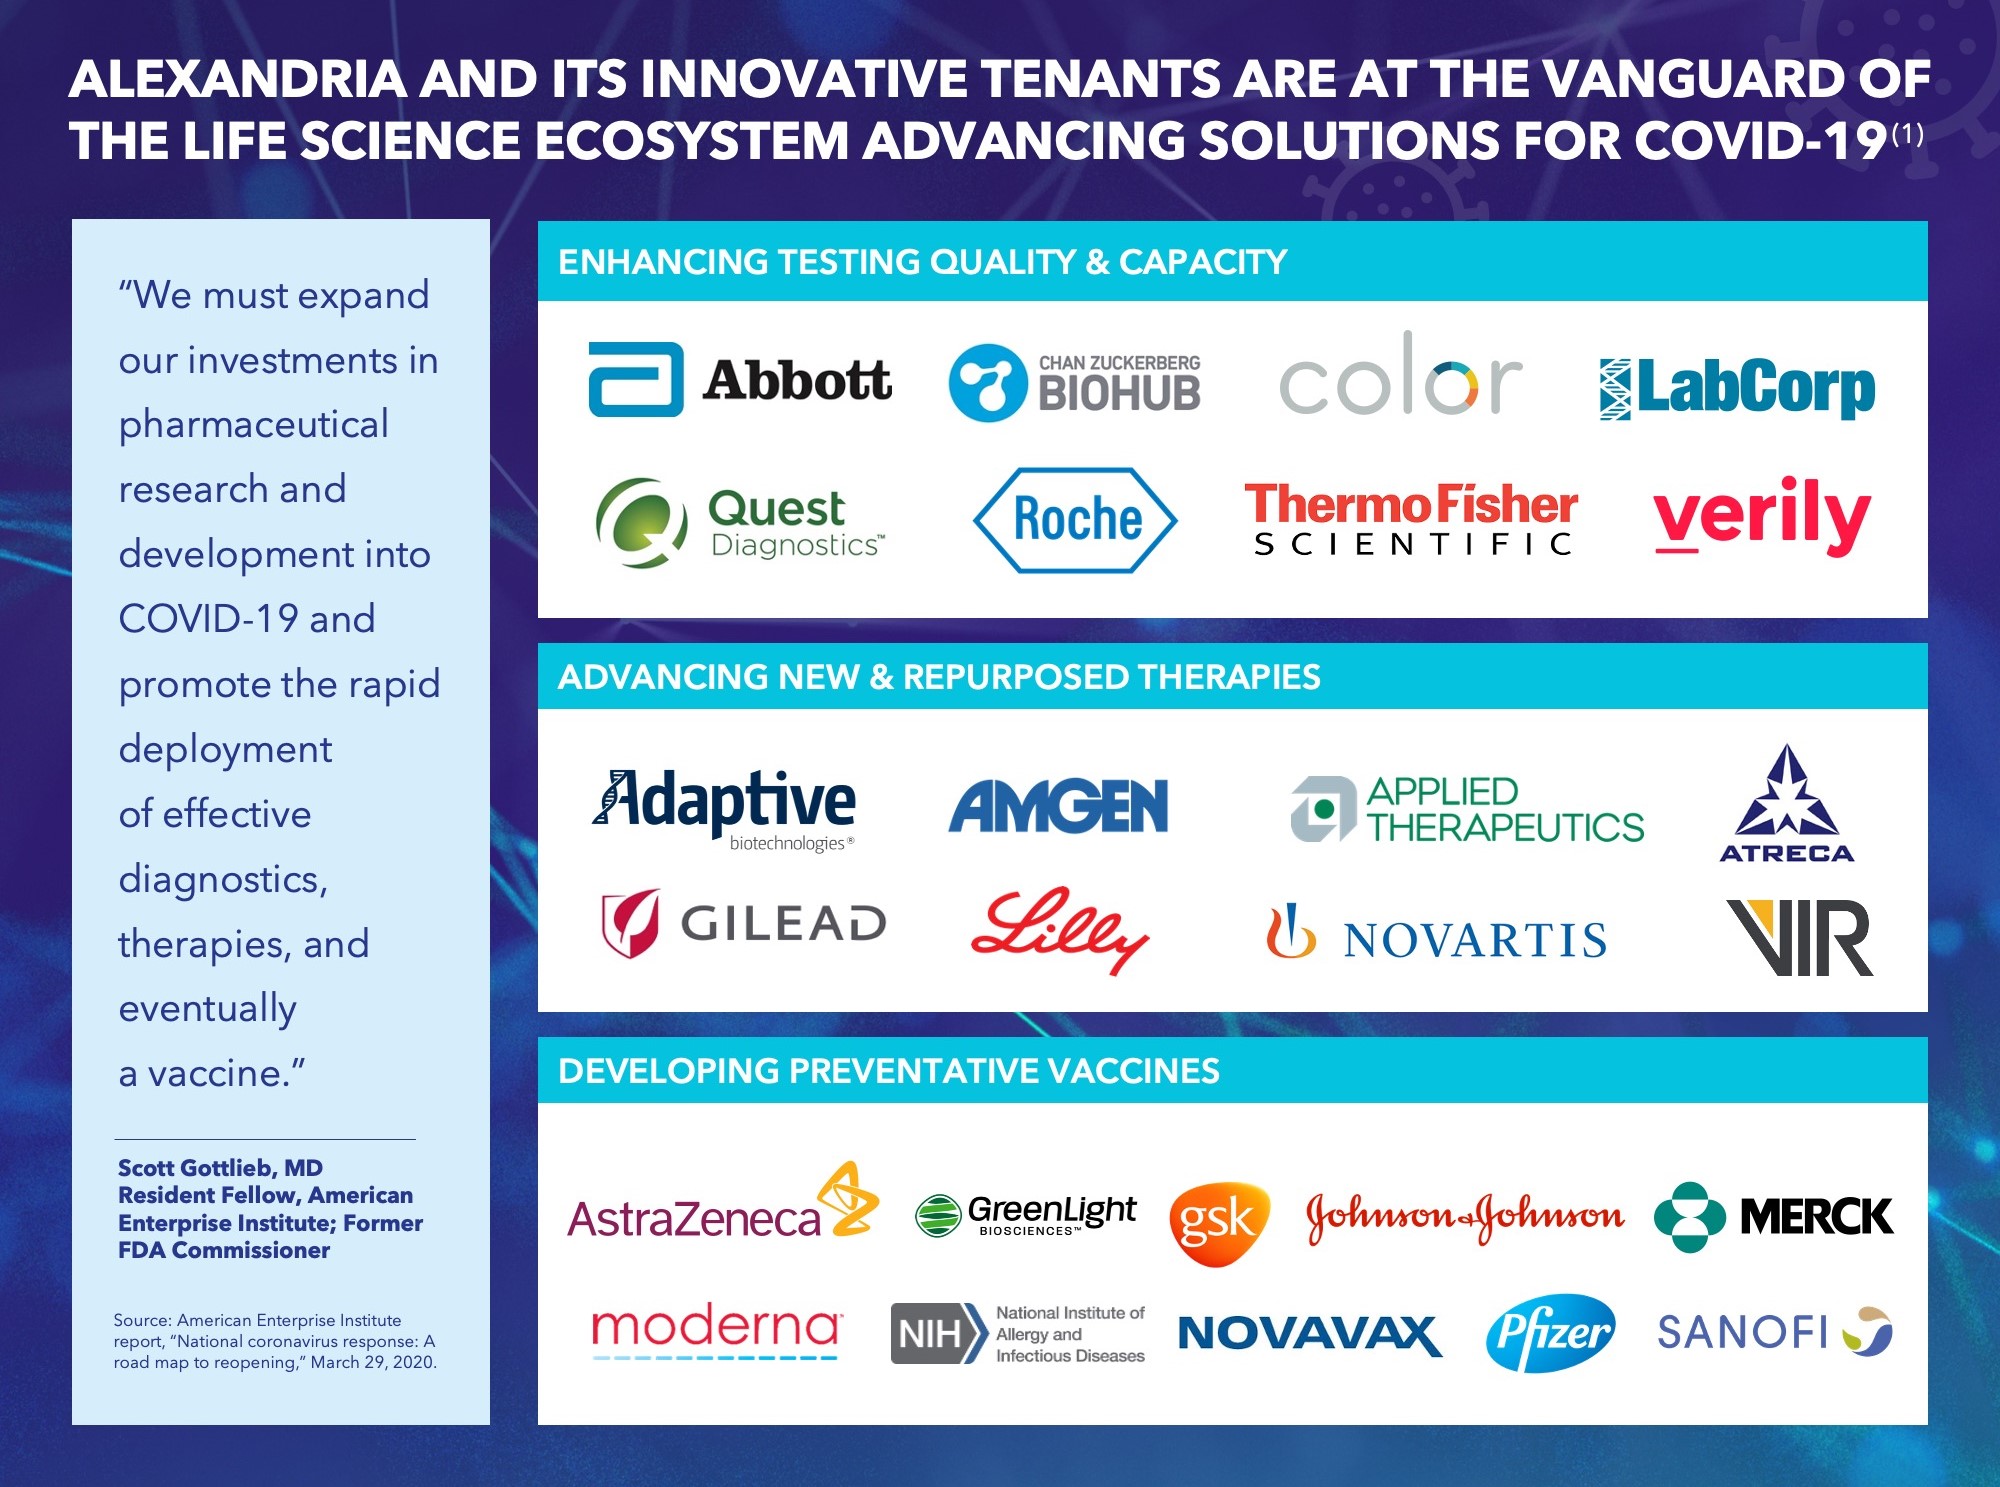
Alexandria and its innovative tenants are at the vanguard of the life science ecosystem advancing solutions for COVID-19
Safe and effective vaccines and therapies, in addition to widespread testing, are desperately needed to combat the global COVID-19 pandemic. By maintaining essential business operations across our campuses, Alexandria has enabled several of our life science tenants to continue mission-critical COVID-19-related research and development. The heroic work being done by so many of our tenants and campus community members to help test for, treat, and prevent COVID-19, as well as provide medical supplies and protective equipment to neighboring hospitals, is profound and inspiring. We are currently tracking over 80 tenants across our cluster markets who are advancing solutions for COVID-19.
Developing preventative vaccines
A prophylactic vaccine should help bring about the effective end of the global COVID-19 pandemic. As such, researchers around the world are developing over 165 vaccines against the coronavirus, with at least 27 vaccine candidates in human trials.
In an effort to expedite the development, manufacturing, and distribution of COVID-19 vaccines, the U.S. government has allocated $10 billion to its Operation Warp Speed (OWS) initiative, calling for unprecedented public-private collaboration. OWS has awarded grants to a handful of company partners to date, including tenants AstraZeneca plc, Emergent BioSolutions Inc., Johnson & Johnson, Moderna, Inc., Novavax, Inc., and Pfizer Inc. Clinical trial data will continue to be reported by each company over the coming months, and the first COVID-19 vaccine could receive emergency use authorization from the FDA by year-end 2020 or early 2021.
Other tenants, including GlaxoSmithKline, GreenLight Biosciences, Inc., Medicago Inc., Merck & Co., Inc., and Sanofi, are similarly leveraging their vaccine development expertise and technology platforms to bring vaccine candidates into clinical trials, with the goal of expediting the delivery of a safe and effective vaccine to the public within the next 12 months.
Advancing new and repurposed therapies
Over 350 experimental drug treatments are being studied in over 500 clinical trials around the world in addition to more than 250 therapeutic candidates in preclinical development. A substantial number of these programs are sponsored by our tenants, including the following notable efforts:
•Eli Lilly and Company, in collaboration with AbCellera, began its Phase I study ahead of schedule to test a novel antibody targeted against the SARS-CoV-2 virus, the first COVID-19-specific antibody program of its kind to enter the clinic.
•Gilead Sciences, Inc.’s remdesivir is in late-stage studies for the treatment of moderate and severe COVID-19 patients. Based on positive safety and efficacy data, the FDA granted emergency use authorization for remdesivir in the treatment of hospitalized patients with severe COVID-19.
•Adaptive Biotechnologies Corporation and Amgen are working together to identify and develop therapeutic antibodies from the blood of patients who are actively fighting or have recently recovered from COVID-19.
•Vir Biotechnology, Inc. has announced unique partnerships with Alnylam Pharmaceuticals, Inc. and GlaxoSmithKline to utilize its neutralizing antibody platform to identify novel drug candidates that could be used as therapeutic or preventative COVID-19 treatments.
Many other Alexandria tenants, including AbbVie Inc., Atreca Inc., Corvus Pharmaceuticals, Inc., Enanta Pharmaceuticals, Inc., Novartis AG, and Pfizer Inc., are similarly endeavoring to develop novel therapies and repurpose existing and investigational drugs to provide near-term treatments for moderate and severe COVID-19 patients and those at highest risk.
Improving testing quality and capacity
Color Genomics, Laboratory Corporation of America Holdings, Quest Diagnostics, Roche, Thermo Fisher Scientific Inc., Verily Life Sciences, and others are working to improve testing quality, capacity, and turnaround time to more effectively determine who has an active COVID-19 infection, who has been exposed to the virus, and who has developed immunity against it. The increased availability of widespread COVID-19 testing is critical for curtailing the pandemic and facilitating a safer reopening of workplaces, communities, and society overall.
| | | | | |
| |
| Acquisitions | |
| June 30, 2020 | |
| (Dollars in thousands) | |
| |
| | | | | | | | | | | | | | | | | | | | | | | | | | | | | | | | | | | | | | | | | | | | | | | | | | | | | | | | | | | | | | | | | | | | | | | | | | | | | | | | | | | | | | |
| Property | | Submarket/Market | | Date of
Purchase | | Number of Properties | | Operating
Occupancy | | | Square Footage | | | | | | | | | Unlevered Yields | | | | | | Purchase Price | | |
| | | | | | | | | | | Future Development | | Active Redevelopment | | Operating With Future Development/ Redevelopment | | | Operating | | Initial Stabilized | | | Initial Stabilized (Cash) | | | | | |
| | | | | | | | | | | | | | | | | | | | | | | | | | | | |
| | | | | | | | | | | | | | | | | | | | | | | | | | | | |
| Completed in 1Q20 | | | | | | 11 | | 79 | % | | | 295,000 | | | — | | | 371,031 | | | | 1,492,599 | | | | | | | | | $ | 484,579 | | |
| | | | | | | | | | | | | | | | | | | | | | | | | | | | |
| Completed in 2Q20: | | | | | | | | | | | | | | | | | | | | | | | | | | | | |
| 987 and 1075 Commercial Street | | Greater Stanford/San Francisco | | 4/14/20 | | 2 | | 100 | % | | | 700,000 | | (1) | — | | | 26,738 | | | | — | | | (2) | | | (2) | | | | 113,250 | | |
| 4555 Executive Drive | | University Town Center/San Diego | | 6/2/20 | | 1 | | 100 | % | | | 200,000 | | (1) | — | | | 41,475 | | | | — | | | (2) | | | (2) | | | | 43,000 | | |
| Other | | Various | | Various | | 1 | | N/A | | | 544,825 | | | 63,774 | | | — | | | | — | | | N/A | | | N/A | | | | 59,000 | | |
| | | | | | 4 | | 100 | % | | | 1,444,825 | | | 63,774 | | | 68,213 | | | | — | | | | | | | | | | 215,250 | | |
| | | | | | | | | | | | | | | | | | | | | | | | | | | | |
| Completed in July 2020: | | | | | | | | | | | | | | | | | | | | | | | | | | | | |
| Various | | Various | | Various(3) | | 3 | | Various | | | 567,488 | | | — | | | 181,515 | | | | — | | | N/A | | | N/A | | | | 141,744 | | |
| Pending acquisitions: | | | | | | | | | | | | | | | | | | | | | | | | | | | | |
| Pending | | Greater Boston | | TBD | | 2 | | 100 | % | | | 400,000 | | | — | | | 200,000 | | | | 300,000 | | | | | | | | | | 330,000 | | |
| Other | | Various | | TBD | | | | | | | | | | | | | | | | | | | | | | | 780,000 | | |
| | | | | | | | | | | | | | | | | | | | | | | | | | | | |
| 2020 guidance range | | | | | | | | | | | | | | | | | | | | | | | $1,600,000 - $2,000,000 | | | | | |
| | | | | | | | | | | | | | | | | | | | | | | | | | | | |
| Mercer Mega Block | | Lake Union/Seattle | | TBD(4) | | — | | N/A | | | 800,000 | | | — | | | — | | | | — | | | (3) | | | (3) | | | $ | 143,500 | | |
| | | | | | | | | | | | | | | | | | | | | | | | | | | | |
(1)Represents total square footage upon completion of development or redevelopment of a new Class A property. Square footage presented includes RSF of buildings currently in operation. We intend to demolish the existing property upon expiration of the existing in-place leases and commencement of future construction. Refer to “Definitions and reconciliations” of this Supplemental Information for additional details on value-creation square feet currently included in rental properties.
(2)We expect to provide total estimated costs and related yields for development and redevelopment projects in the future, subsequent to the commencement of construction.
(3)Includes three properties acquired through three transactions.
(4)We are diligently working through various long-lead time due diligence items, with certain deadlines extending into early 2021. We are working toward completion of all due diligence items as soon as possible.
| | | | | |
| |
| Guidance | |
| June 30, 2020 | |
| (Dollars in millions, except per share amounts) | |
| |
Our initial 2020 guidance issued on December 3, 2019, included ranges for 2020 construction spending and acquisitions of $1.55 billion to $1.65 billion and $900 million to $1.0 billion, respectively, and reflected a strong outlook for 2020, including continued strong demand for our value-creation development and redevelopment projects. Our guidance issued on April 27, 2020 reduced our 2020 forecasted construction spend, acquisitions, real estate dispositions and partial interest sales, and issuance of common equity. These reductions were deemed necessary while we monitored the impact of COVID-19 on many areas of our business, including the overall macro and capital market environments.
The following provides key updates to our 2020 guidance since April 27, 2020, based on our current view of existing market conditions and other assumptions for the year ending December 31, 2020, and reflects increases in uses of capital to address the continuing tenant demand for our development and redevelopment pipeline and existing and anticipated attractive acquisition opportunities. Our updated 2020 construction spending guidance range increased closer to our initial forecast for 2020. Additionally, our initial guidance for 2020 anticipated meaningful acquisitions opportunities and our updated 2020 acquisition guidance range continues to reflect opportunistic offerings in the market with an increase above our initial acquisition guidance range to be funded through forecasted real estate dispositions and partial interest sales. Proceeds from these forecasted sales are expected to fund a portion of the increase in construction spending and acquisitions, in addition to providing significant capital for growth over the next two to three quarters. We remain committed to our guidance for net debt and preferred stock to Adjusted EBITDA – fourth quarter of 2020, annualized, of less than or equal to 5.3x. There can be no assurance that actual amounts will not be materially higher or lower than these expectations. Also, refer to our discussion of “forward-looking statements” on page 12 of this Earnings Press Release for additional details.
| | | | | | | | | | | | | | | | | | | | | | | | | | | | | |
| Projected 2020 Earnings per Share and Funds From Operations per Share Attributable to Alexandria’s Common Stockholders – Diluted | | | | | | | | | |
| | As of 7/27/20 | | | | As of 4/27/20 | | | |
Earnings per share(1) | | $3.00 to $3.08 | | | | $1.69 to $1.79 | | | |
| Depreciation and amortization of real estate assets | | | 5.15 | | | | 5.15 | | |
Impairment of real estate – rental properties(2) | | | 0.06 | | | | 0.06 | | |
| Allocation to unvested restricted stock awards | | | (0.05) | | | | (0.04) | | |
| Funds from operations per share | | $8.16 to $8.24 | | | | $6.86 to $6.96 | | | |
| Unrealized (gains) losses on non-real estate investments | | | (1.25) | | | | 0.14 | | |
| Impairment of non-real estate investments | | | 0.20 | | | | 0.16 | | |
Impairment of real estate(3) | | | 0.12 | | | | 0.10 | | |
| Allocation to unvested restricted stock awards | | | 0.01 | | | | (0.01) | | |
| Other | | | 0.02 | | | | — | | |
Funds from operations per share, as adjusted(1) | | $7.26 to $7.34 | | | | $7.25 to $7.35 | | | |
| Midpoint | | $7.30 | | | | $7.30 | | | |
| | | | | | | | | | | | | | | | | | | | | | | | | | | | | |
| | As of 7/27/20 | | | | As of 4/27/20 | | | |
| Key Assumptions | | Low | | High | | Low | | High | |
| Occupancy percentage in North America as of December 31, 2020 | | 94.8% | | 95.4% | | 94.8% | | 95.4% | |
| Lease renewals and re-leasing of space: | | | | | | | | | |
| Rental rate increases | | 28.0% | | 31.0% | | 28.0% | | 31.0% | |
| Rental rate increases (cash basis) | | 14.0% | | 17.0% | | 14.0% | | 17.0% | |
| Same property performance: | | | | | | | | | |
| Net operating income increase | | 1.0% | | 3.0% | | 1.0% | | 3.0% | |
| Net operating income increase (cash basis) | | 4.5% | | 6.5% | | 4.5% | | 6.5% | |
| Straight-line rent revenue | | $ | 98 | | | $ | 108 | | | $ | 98 | | | $ | 108 | | |
| General and administrative expenses | | $ | 121 | | | $ | 126 | | | $ | 121 | | | $ | 126 | | |
| Capitalization of interest | | $ | 117 | | | $ | 127 | | | $ | 102 | | | $ | 112 | | |
| Interest expense | | $ | 170 | | | $ | 180 | | | $ | 185 | | | $ | 195 | | |
(1)Excludes unrealized gains or losses after June 30, 2020, that are required to be recognized in earnings and are excluded from funds from operations per share, as adjusted.
(2)Includes a $7.6 million impairment on our investment in a recently developed retail property held by our unconsolidated real estate joint venture.
(3)Includes eight cents related to an impairment charge of $10 million recognized in April 2020 to write off the carrying amount of the pre-acquisition deposit related to an operating tech office property for which our revised economic projections declined from our initial underwriting. The impairment was recognized concurrently with the submission of our notice to terminate the transaction.
| | | | | |
| |
| Guidance | |
| June 30, 2020 | |
| (Dollars in millions, except per share amounts) | |
| |
| | | | | | | | | | |
| Key Credit Metrics | | 2020 Guidance | | |
| Net debt and preferred stock to Adjusted EBITDA – 4Q20 annualized | | Less than or equal to 5.3x | | |
| Fixed-charge coverage ratio – 4Q20 annualized | | Greater than or equal to 4.4x | | |
| | | | |
| | | | | | | | | | | | | | | | | | | | | | | | | | | | | | | | | | | | | | | | | | | | | | | | | | | |
| | As of 7/27/20 | | | | | | | | | | | | | | | | | |
| Key Sources and Uses of Capital | | Range | | | | Midpoint | | | Certain
Completed Items | | | As of 4/27/20
Midpoint | | As of 2/3/20
Midpoint | | | | | |
| Sources of capital: | | | | | | | | | | | | | | | | | | | |
| Net cash provided by operating activities after dividends | | $ | 185 | | | $ | 225 | | | $ | 205 | | | | | | $ | 205 | | | $ | 220 | | | | | | |
| Incremental debt | | 415 | | | 575 | | | | 495 | | | see below | | | 335 | | | 380 | | | | | | |
| Real estate dispositions and partial interest sales | | 1,000 | | | 1,500 | | | | 1,250 | | | $ | 51 | | (1) | | 50 | | (1) | 50 | | (1) | | | | |
| Common equity | | 2,090 | | | 2,090 | | | | 2,090 | | | $ | 2,087 | | (2) | | 1,020 | | (1) | 1,900 | | (1) | | | | |
| Total sources of capital | | $ | 3,690 | | | $ | 4,390 | | | $ | 4,040 | | | | | | $ | 1,610 | | | $ | 2,550 | | | | | | |
| Uses of capital: | | | | | | | | | | | | | | | | | | | |
Construction (see page 44 for additional information) | | $ | 1,200 | | | $ | 1,500 | | | $ | 1,350 | | | | | | $ | 960 | | | $ | 1,600 | | | | | | |
Acquisitions (see page 8 for additional information) | | 1,600 | | | 2,000 | | | | 1,800 | | | $ | 842 | | | | 650 | | | 950 | | | | | | |
| Total uses of capital | | $ | 2,800 | | | $ | 3,500 | | | $ | 3,150 | | | | | | $ | 1,610 | | | $ | 2,550 | | | | | | |
| Incremental debt (included above): | | | | | | | | | | | | | | | | | | | |
Issuance of unsecured senior notes payable(3) | | $ | 700 | | | $ | 700 | | | $ | 700 | | | $ | 700 | | | | $ | 700 | | | $ | 600 | | | | | | |
| | | | | | | | | | | | | | | | | | | |
| | | | | | | | | | | | | | | | | | | |
| | | | | | | | | | | | | | | | | | | |
| $3.0 billion unsecured senior lines of credit and other | | (285) | | | (125) | | | | (205) | | | | | | (365) | | | (220) | | | | | | |
| Incremental debt | | $ | 415 | | | $ | 575 | | | $ | 495 | | | | | | $ | 335 | | | $ | 380 | | | | | | |
| | | | | | | | | | | | | | | | | | | |
| Excess sources of capital | | | | | | $ | 890 | | | | | | $ | — | | | $ | — | | | | | | |
(1)In April 2020, we completed the sale of a partial interest in properties at 9808 and 9868 Scranton Road in our Sorrento Mesa submarket to the existing SD Tech by Alexandria consolidated real estate joint venture, of which we own 50%. We received proceeds of $51.1 million for the 50% interest in the properties that our joint venture partner acquired through the joint venture. Our previous guidance disclosures included a combined amount for real estate dispositions, partial interest sales, and common equity. Amounts presented have been split into two separate categories for (i) actual real estate dispositions and partial interest sales completed through July 27, 2020, and (ii) common equity.
(2)In January 2020 and July 2020, we completed $1.0 billion and $1.1 billion of forward equity sales agreements, respectively, to sell an aggregate of 6.9 million shares for each offering (13.8 million in aggregate) of our common stock (including the exercise of an underwriters’ option) at a public offering price of $155.00 per share and $160.50 per share, respectively, before underwriting discounts. In March 2020, we settled 3.4 million shares from our forward equity sales agreements and received proceeds of $500.0 million. As of July 27, 2020, 10.4 million shares of our common stock remain outstanding under forward equity sales agreements, for which we expect to receive proceeds of $1.6 billion, to be further adjusted as provided in the sales agreements, that will fund pending and recently completed acquisitions and the construction of our highly leased development projects. We expect to settle the remaining outstanding forward equity sales agreements in 2020.
(3)We may opportunistically seek to refinance additional near term maturities in 2020, subject to market conditions.
| | | | | |
| |
| |
| Earnings Call Information and About the Company | |
| June 30, 2020 | |
| |
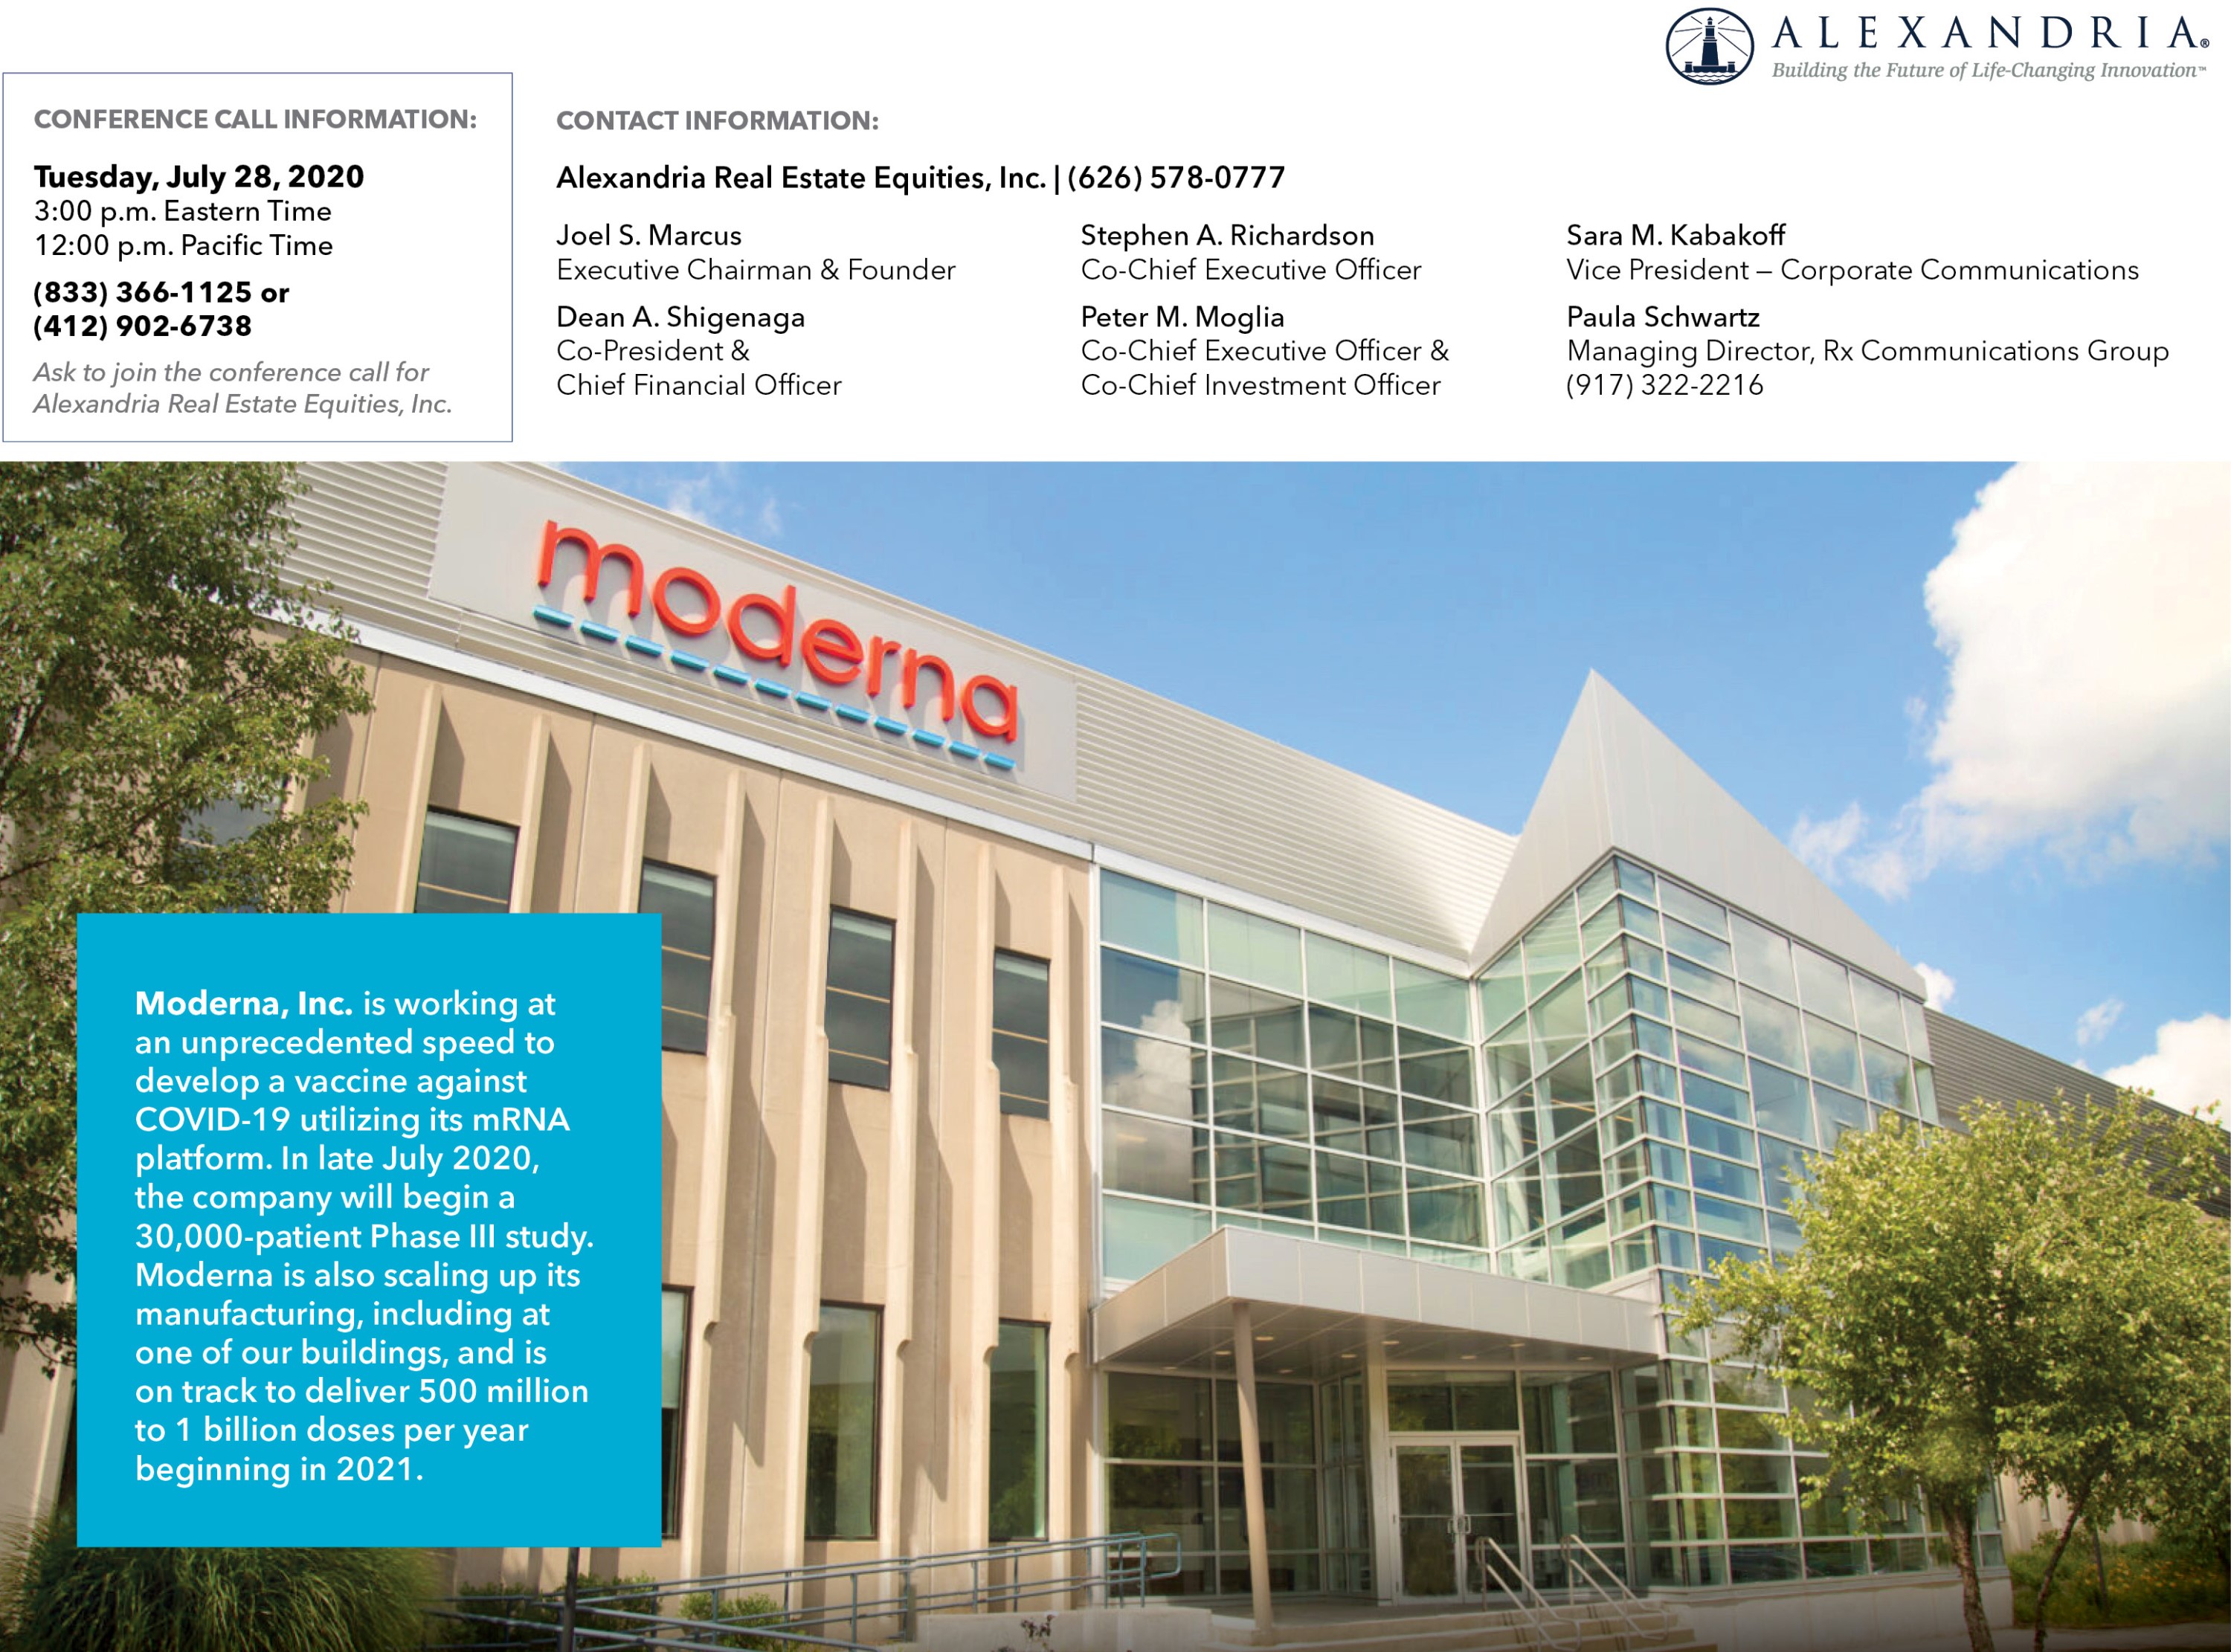
We will host a conference call on Tuesday, July 28, 2020, at 3:00 p.m. Eastern Time (“ET”)/noon Pacific Time (“PT”), which is open to the general public, to discuss our financial and operating results for the second quarter ended June 30, 2020. To participate in this conference call, dial (833) 366-1125 or (412) 902-6738 shortly before 3:00 p.m. ET/noon PT and ask the operator to join the call for Alexandria Real Estate Equities, Inc. The audio webcast can be accessed at www.are.com in the “For Investors” section. A replay of the call will be available for a limited time from 5:00 p.m. ET/2:00 p.m. PT on Tuesday, July 28, 2020. The replay number is (877) 344-7529 or (412) 317-0088, and the access code is 10143904.
Additionally, a copy of this Earnings Press Release and Supplemental Information for the second quarter ended June 30, 2020, is available in the “For Investors” section of our website at www.are.com or by following this link: http://www.are.com/fs/2020q2.pdf.
For any questions, please contact Joel S. Marcus, executive chairman and founder; Stephen A. Richardson, co-chief executive officer; Peter M. Moglia, co-chief executive officer and co-chief investment officer; Dean A. Shigenaga, co-president and chief financial officer; or Sara M. Kabakoff, vice president – corporate communications, at (626) 578-0777; or Paula Schwartz, managing director of Rx Communications Group, at (917) 322-2216.
About the Company
Alexandria Real Estate Equities, Inc. (NYSE:ARE), an S&P 500® urban office real estate investment trust (“REIT”), is the first, longest-tenured, and pioneering owner, operator, and developer uniquely focused on collaborative life science, technology, and agtech campuses in AAA innovation cluster locations, with a total market capitalization of $27.7 billion as of June 30, 2020, and an asset base in North America of 43.0 million square feet (“SF”). The asset base in North America includes 28.8 million RSF of operating properties and 2.3 million RSF of Class A properties undergoing construction, 6.6 million RSF of near-term and intermediate-term development and redevelopment projects, and 5.3 million SF of future development projects. Founded in 1994, Alexandria pioneered this niche and has since established a significant market presence in key locations, including Greater Boston, San Francisco, New York City, San Diego, Seattle, Maryland, and Research Triangle. Alexandria has a longstanding and proven track record of developing Class A properties clustered in urban life science, technology, and agtech campuses that provide our innovative tenants with highly dynamic and collaborative environments that enhance their ability to successfully recruit and retain world-class talent and inspire productivity, efficiency, creativity, and success. Alexandria also provides strategic capital to transformative life science, technology, and agtech companies through our venture capital arm. We believe our unique business model and diligent underwriting ensure a high-quality and diverse tenant base that results in higher occupancy levels, longer lease terms, higher rental income, higher returns, and greater long-term asset value. For additional information on Alexandria, please visit www.are.com.
***********
This document includes “forward-looking statements” within the meaning of Section 27A of the Securities Act of 1933, as amended, and Section 21E of the Securities Exchange Act of 1934, as amended. Such forward-looking statements include, without limitation, statements regarding our 2020 earnings per share attributable to Alexandria’s common stockholders – diluted, 2020 funds from operations per share attributable to Alexandria’s common stockholders – diluted, net operating income, and our projected sources and uses of capital. You can identify the forward-looking statements by their use of forward-looking words, such as “forecast,” “guidance,” “goals,” “projects,” “estimates,” “anticipates,” “believes,” “expects,” “intends,” “may,” “plans,” “seeks,” “should,” or “will,” or the negative of those words or similar words. These forward-looking statements are based on our current expectations, beliefs, projections, future plans and strategies, anticipated events or trends, and similar expressions concerning matters that are not historical facts, as well as a number of assumptions concerning future events. There can be no assurance that actual results will not be materially higher or lower than these expectations. These statements are subject to risks, uncertainties, assumptions, and other important factors that could cause actual results to differ materially from the results discussed in the forward-looking statements. Factors that might cause such a difference include, without limitation, our failure to obtain capital (debt, construction financing, and/or equity) or refinance debt maturities, increased interest rates and operating costs, adverse economic or real estate developments in our markets (including the impact of the ongoing COVID-19 pandemic), our failure to successfully place into service and lease any properties undergoing development or redevelopment and our existing space held for future development or redevelopment (including new properties acquired for that purpose), our failure to successfully operate or lease acquired properties, decreased rental rates, increased vacancy rates or failure to renew or replace expiring leases, defaults on or non-renewal of leases by tenants, adverse general and local economic conditions, an unfavorable capital market environment, decreased leasing activity or lease renewals, and other risks and uncertainties detailed in our filings with the Securities and Exchange Commission (“SEC”). Accordingly, you are cautioned not to place undue reliance on such forward-looking statements. All forward-looking statements are made as of the date of this Earnings Press Release, and unless otherwise stated, we assume no obligation to update this information and expressly disclaim any obligation to update or revise any forward-looking statements, whether as a result of new information, future events, or otherwise. For more discussion relating to risks and uncertainties that could cause actual results to differ materially from those anticipated in our forward-looking statements, and risks to our business in general, please refer to our SEC filings, including our most recent annual report on Form 10-K and any subsequent quarterly reports on Form 10-Q.
For additional discussion of the risks and other potential impacts posed by the outbreak of the COVID-19 pandemic and uncertainties we, our tenants, and the global and national economies face as a result, see the sections entitled “Risk Factors” and “Management’s Discussion and Analysis of Financial Condition and Results of Operations” in our quarterly report on Form 10-Q filed with the SEC on July 27, 2020.
Alexandria®, Lighthouse Design® logo, Building the Future of Life-Changing Innovation™, Alexandria Center®, Alexandria Technology Square®, Alexandria Summit®, Alexandria Technology Center®, Alexandria Innovation Center®, LaunchLabs®, and GradLabs™ are trademarks of Alexandria Real Estate Equities, Inc. All other company names, trademarks, and logos referenced herein are the property of their respective owners.
| | | | | |
| |
| Consolidated Statements of Operations | |
| June 30, 2020 | |
| (Dollars in thousands, except per share amounts) | |
| |
| | | | | | | | | | | | | | | | | | | | | | | | | | | | | | | | | | | | | | | | | | | | |
| | | Three Months Ended | | | | | | | | | | Six Months Ended | | |
| | | 6/30/20 |
| 3/31/20 | | 12/31/19 | | 9/30/19 | | 6/30/19 | | 6/30/20 | | 6/30/19 |
| Revenues: | | | | | | | | | | | | | | |
| Income from rentals | | $ | 435,856 | | (1) | $ | 437,605 | | | $ | 404,721 | | | $ | 385,776 | | | $ | 371,618 | | | $ | 873,461 | | | $ | 726,367 | |
| Other income | | 1,100 | | | 2,314 | | | 3,393 | | | 4,708 | | | 2,238 | | | 3,414 | | | 6,331 | |
| Total revenues | | 436,956 | | | 439,919 | | | 408,114 | | | 390,484 | | | 373,856 | | | 876,875 | | | 732,698 | |
| | | | | | | | | | | | | | |
| Expenses: | | | | | | | | | | | | | | |
| Rental operations | | 123,911 | | | 129,103 | | | 121,852 | | | 116,450 | | | 105,689 | | | 253,014 | | | 207,190 | |
| General and administrative | | 31,775 | | | 31,963 | | | 29,782 | | | 27,930 | | | 26,434 | | | 63,738 | | | 51,111 | |
| Interest | | 45,014 | | | 45,739 | | | 45,493 | | | 46,203 | | | 42,879 | | | 90,753 | | | 81,979 | |
| Depreciation and amortization | | 168,027 | | | 175,496 | | | 140,518 | | | 135,570 | | | 134,437 | | | 343,523 | | | 268,524 | |
| Impairment of real estate | | 13,218 | | (2) | 2,003 | | | 12,334 | | | — | | | — | | | 15,221 | | | — | |
| Loss on early extinguishment of debt | | — | |
| — | | | — | | | 40,209 | | | — | | | — | | | 7,361 | |
| Total expenses | | 381,945 | | | 384,304 | | | 349,979 | | | 366,362 | | | 309,439 | | | 766,249 | | | 616,165 | |
| | | | | | | | | | | | | | |
| Equity in earnings (losses) of unconsolidated real estate joint ventures | | 3,893 | | | (3,116) | | | 4,777 | | | 2,951 | | | 1,262 | | | 777 | | | 2,408 | |
| Investment income (loss) | | 184,657 | | | (21,821) | | | 152,667 | | | (63,076) | | | 21,500 | | | 162,836 | | | 105,056 | |
| Gain on sales of real estate | | — | | | — | | | 474 | | | — | | | — | | | — | | | — | |
| Net income (loss) | | 243,561 | | | 30,678 | | | 216,053 | | | (36,003) | | | 87,179 | | | 274,239 | | | 223,997 | |
| Net income attributable to noncontrolling interests | | (13,907) | | | (11,913) | | | (13,612) | | | (11,199) | | | (8,412) | | | (25,820) | | | (16,071) | |
| Net income (loss) attributable to Alexandria Real Estate Equities, Inc.’s stockholders | | 229,654 | | | 18,765 | | | 202,441 | | | (47,202) | | | 78,767 | | | 248,419 | | | 207,926 | |
| Dividends on preferred stock | | — | | | — | | | — | | | (1,173) | | | (1,005) | | | — | | | (2,031) | |
| Preferred stock redemption charge | | — | | | — | | | — | | | — | | | — | | | — | | | (2,580) | |
| Net income attributable to unvested restricted stock awards | | (3,054) | | | (1,925) | | | (2,823) | | | (1,398) | | | (1,432) | | | (3,574) | | | (3,134) | |
| Net income (loss) attributable to Alexandria Real Estate Equities, Inc.’s common stockholders | | $ | 226,600 | | | $ | 16,840 | | | $ | 199,618 | | | $ | (49,773) | | | $ | 76,330 | | | $ | 244,845 | | | $ | 200,181 | |
| | | | | | | | | | | | | | |
| Net income (loss) per share attributable to Alexandria Real Estate Equities, Inc.’s common stockholders: | | | | | | | | | | | | | | |
| Basic | | $ | 1.82 | | | $ | 0.14 | | | $ | 1.75 | | | $ | (0.44) | | | $ | 0.68 | | | $ | 1.99 | | | $ | 1.80 | |
| Diluted | | $ | 1.82 | | | $ | 0.14 | | | $ | 1.74 | | | $ | (0.44) | | | $ | 0.68 | | | $ | 1.99 | | | $ | 1.80 | |
| | | | | | | | | | | | | | |
| Weighted-average shares of common stock outstanding: | | | | | | | | | | | | | | |
| Basic | | 124,333 | | | 121,433 | | | 114,175 | | | 112,120 | | | 111,433 | | | 122,883 | | | 111,245 | |
| Diluted | | 124,448 | | | 121,785 | | | 114,974 | | | 112,120 | | | 111,501 | | | 123,117 | | | 111,279 | |
| | | | | | | | | | | | | | |
| Dividends declared per share of common stock | | $ | 1.06 | | | $ | 1.03 | | | $ | 1.03 | | | $ | 1.00 | | | $ | 1.00 | | | $ | 2.09 | | | $ | 1.97 | |
(1)Change in income from rentals from 1Q20 comprise a $5.4 million decrease in tenant recoveries as a result of lower variable operating expenses, including our utility costs and restaurant-related expenses, partially offset by a $3.6 million increase in rental revenue driven by recently acquired operating properties and continued rental rate growth in lease renewals within our key submarkets.
(2)Includes a $10 million impairment charge to reduce the carrying amount of a pre-acquisition deposit to zero dollars, concurrently with the submission of our notice to terminate the acquisition that was pending at the time.
| | | | | |
| |
| Consolidated Balance Sheets | |
| June 30, 2020 | |
| (In thousands) | |
| |
| | | | | | | | | | | | | | | | | | | | | | | | | | | | | | | | |
| | 6/30/20 | | 3/31/20 | | 12/31/19 | | 9/30/19 | | 6/30/19 |
| Assets | | | | | | | | | | |
| Investments in real estate | | $ | 16,281,125 | | | $ | 15,832,182 | | | $ | 14,844,038 | | | $ | 13,618,280 | | | $ | 12,872,824 | |
| Investments in unconsolidated real estate joint ventures | | 326,858 | | | 325,665 | | | 346,890 | | | 340,190 | | | 334,162 | |
| Cash and cash equivalents | | 206,860 | | | 445,255 | | | 189,681 | | | 410,675 | | | 198,909 | |
| Restricted cash | | 34,680 | | | 43,116 | | | 53,008 | | | 42,295 | | | 39,316 | |
| Tenant receivables | | 7,208 | | | 14,976 | | | 10,691 | | | 10,668 | | | 9,228 | |
| Deferred rent | | 688,749 | | | 663,926 | | | 641,844 | | | 615,817 | | | 585,082 | |
| Deferred leasing costs | | 274,483 | | | 269,458 | | | 270,043 | | | 252,772 | | | 247,468 | |
| Investments | | 1,318,465 | | | 1,123,482 | | | 1,140,594 | �� | | 990,454 | | | 1,057,854 | |
| Other assets | | 930,680 | | | 983,875 | | | 893,714 | | | 777,003 | | | 694,627 | |
| Total assets | | $ | 20,069,108 | | | $ | 19,701,935 | | | $ | 18,390,503 | | | $ | 17,058,154 | | | $ | 16,039,470 | |
| | | | | | | | | | |
| Liabilities, Noncontrolling Interests, and Equity | | | | | | | | | | |
| Secured notes payable | | $ | 344,784 | | | $ | 347,136 | | | $ | 349,352 | | | $ | 351,852 | | | $ | 354,186 | |
| Unsecured senior notes payable | | 6,738,486 | | | 6,736,999 | | | 6,044,127 | | | 6,042,831 | | | 5,140,914 | |
| Unsecured senior lines of credit | | 440,000 | | | 221,000 | | | 384,000 | | | 343,000 | | | 514,000 | |
| Unsecured senior bank term loan | | — | | | — | | | — | | | — | | | 347,105 | |
| Accounts payable, accrued expenses, and other liabilities | | 1,343,181 | | | 1,352,554 | | | 1,320,268 | | | 1,241,276 | | | 1,157,417 | |
| Dividends payable | | 133,681 | | | 129,981 | | | 126,278 | | | 115,575 | | | 114,379 | |
| Total liabilities | | 9,000,132 | | | 8,787,670 | | | 8,224,025 | | | 8,094,534 | | | 7,628,001 | |
| | | | | | | | | | |
| Commitments and contingencies | | | | | | | | | | |
| | | | | | | | | | |
| Redeemable noncontrolling interests | | 12,122 | | | 12,013 | | | 12,300 | | | 12,099 | | | 10,994 | |
| | | | | | | | | | |
| Alexandria Real Estate Equities, Inc.’s stockholders’ equity: | | | | | | | | | | |
| 7.00% Series D cumulative convertible preferred stock | | — | | | — | | | — | | | 57,461 | | | 57,461 | |
| Common stock | | 1,246 | | | 1,243 | | | 1,208 | | | 1,132 | | | 1,120 | |
| Additional paid-in capital | | 9,443,274 | | | 9,336,949 | | | 8,874,367 | | | 7,743,188 | | | 7,581,573 | |
| Accumulated other comprehensive loss | | (13,080) | | | (15,606) | | | (9,749) | | | (11,549) | | | (11,134) | |
| Alexandria Real Estate Equities, Inc.’s stockholders’ equity | | 9,431,440 | | | 9,322,586 | | | 8,865,826 | | | 7,790,232 | | | 7,629,020 | |
| Noncontrolling interests | | 1,625,414 | | | 1,579,666 | | | 1,288,352 | | | 1,161,289 | | | 771,455 | |
| Total equity | | 11,056,854 | | | 10,902,252 | | | 10,154,178 | | | 8,951,521 | | | 8,400,475 | |
| Total liabilities, noncontrolling interests, and equity | | $ | 20,069,108 | | | $ | 19,701,935 | | | $ | 18,390,503 | | | $ | 17,058,154 | | | $ | 16,039,470 | |
| | | | | |
| |
| Funds From Operations and Funds From Operations per Share | |
| June 30, 2020 | |
| (In thousands) | |
| |
The following table presents a reconciliation of net income (loss) attributable to Alexandria’s common stockholders, the most directly comparable financial measure presented in accordance with generally accepted accounting principles (“GAAP”), including our share of amounts from consolidated and unconsolidated real estate joint ventures, to funds from operations attributable to Alexandria’s common stockholders – diluted, and funds from operations attributable to Alexandria’s common stockholders – diluted, as adjusted, for the periods below:
| | | | | | | | | | | | | | | | | | | | | | | | | | | | | | | | | | | | | | | | | | | | |
| | | Three Months Ended | | | | | | | | | | Six Months Ended | | |
| | 6/30/20 | | 3/31/20 | | 12/31/19 | | 9/30/19 | | 6/30/19 | | 6/30/20 | | 6/30/19 |
| | | | | | | | | | | | | | |
| | | | | | | | | | | | | | |
| Net income (loss) attributable to Alexandria’s common stockholders | | $ | 226,600 | | | $ | 16,840 | | | $ | 199,618 | | | $ | (49,773) | | | $ | 76,330 | | | $ | 244,845 | | | $ | 200,181 | |
Depreciation and amortization of real estate assets(1) | | 165,040 | | | 172,628 | | | 137,761 | | | 135,570 | | | 134,437 | | | 337,668 | | | 268,524 | |
| Noncontrolling share of depreciation and amortization from consolidated real estate JVs | | (15,775) | | | (15,870) | | | (10,176) | | | (8,621) | | | (6,744) | | | (31,645) | | | (12,163) | |
| Our share of depreciation and amortization from unconsolidated real estate JVs | | 2,858 | | | 2,643 | | | 2,702 | | | 1,845 | | | 973 | | | 5,501 | | | 1,819 | |
| Gain on sales of real estate | | — | | | — | | | (474) | | | — | | | — | | | — | | | — | |
| Impairment of real estate – rental properties | | — | | | 7,644 | | | 12,334 | | | — | | | — | | | 7,644 | | | — | |
| Assumed conversion of 7.00% Series D cumulative convertible preferred stock | | — | | | — | | | — | | | — | | | 1,005 | | | — | | | 2,031 | |
| Allocation to unvested restricted stock awards | | (2,228) | | | (847) | | | (1,809) | | | — | | | (1,445) | | | (4,531) | | | (3,740) | |
Funds from operations attributable to Alexandria’s common stockholders – diluted(1) | | 376,495 | | | 183,038 | | | 339,956 | | | 79,021 | | | 204,556 | | | 559,482 | | | 456,652 | |
| Unrealized (gains) losses on non-real estate investments | | (171,652) | | | 17,144 | | | (148,268) | | | 70,043 | | | (11,058) | | | (154,508) | | | (83,264) | |
| Impairment of non-real estate investments | | 4,702 | | (2) | 19,780 | | | 9,991 | | | 7,133 | | | — | | | 24,482 | | | — | |
| Impairment of real estate | | 13,218 | | (3) | 2,003 | | | — | | | — | | | — | | | 15,221 | | | — | |
| Loss on early extinguishment of debt | | — | | | — | | | — | | | 40,209 | | | — | | | — | | | 7,361 | |
| Loss on early termination of interest rate hedge agreements | | — | | | — | | | — | | | 1,702 | | | — | | | — | | | — | |
| Preferred stock redemption charge | | — | | | — | | | — | | | — | | | — | | | — | | | 2,580 | |
| Removal of assumed conversion of 7.00% Series D cumulative convertible preferred stock | | — | | | — | | | — | | | — | | | (1,005) | | | — | | | (2,031) | |
| Allocation to unvested restricted stock awards | | 2,251 | | | (591) | | | 1,760 | | | (1,002) | | | 179 | | | 1,711 | | | 1,157 | |
| Funds from operations attributable to Alexandria’s common stockholders – diluted, as adjusted | | $ | 225,014 | | | $ | 221,374 | | | $ | 203,439 | | | $ | 197,106 | | | $ | 192,672 | | | $ | 446,388 | | | $ | 382,455 | |
(1)Calculated in accordance with standards established by the Nareit Board of Governors. Refer to “Funds from operations and funds from operations, as adjusted, attributable to Alexandria’s common stockholders” in the “Definitions and reconciliations” of our Supplemental Information for additional details.
(2)Primarily relates to two investments in privately held entities that do not report NAV.
(3)Primarily relates to a $10 million impairment charge to write off the pre-acquisition deposit for a previously pending acquisition, which was recognized in April 2020 concurrently with the submission of our notice to terminate the transaction.
| | | | | |
| |
| Funds From Operations and Funds From Operations per Share (continued) | |
| June 30, 2020 | |
| (In thousands, except per share amounts) | |
| |
The following table presents a reconciliation of net income (loss) per share attributable to Alexandria’s common stockholders, the most directly comparable financial measure presented in accordance with GAAP, including our share of amounts from consolidated and unconsolidated real estate joint ventures, to funds from operations per share attributable to Alexandria’s common stockholders – diluted, and funds from operations per share attributable to Alexandria’s common stockholders – diluted, as adjusted, for the periods below. Per share amounts may not add due to rounding.
| | | | | | | | | | | | | | | | | | | | | | | | | | | | | | | | | | | | | | | | | | | | |
| | Three Months Ended | | | | | | | | | | Six Months Ended | | |
| | 6/30/20 | | 3/31/20 | | 12/31/19 | | 9/30/19 | | 6/30/19 | | 6/30/20 | | 6/30/19 |
| Net income (loss) per share attributable to Alexandria’s common stockholders – diluted | | $ | 1.82 | | | $ | 0.14 | | | $ | 1.74 | | | $ | (0.44) | | | $ | 0.68 | | | $ | 1.99 | | | $ | 1.80 | |
| Depreciation and amortization of real estate assets | | 1.22 | | | 1.31 | | | 1.13 | | | 1.14 | | | 1.15 | | | 2.53 | | | 2.32 | |
| Impairment of real estate – rental properties | | — | | | 0.06 | | | 0.11 | | | — | | | — | | | 0.06 | | | — | |
| Allocation to unvested restricted stock awards | | (0.01) | | | (0.01) | | | (0.02) | | | — | | | — | | | (0.04) | | | (0.04) | |
Funds from operations per share attributable to Alexandria’s common stockholders – diluted(1) | | 3.03 | | | 1.50 | | | 2.96 | | | 0.70 | | | 1.83 | | | 4.54 | | | 4.08 | |
| Unrealized (gains) losses on non-real estate investments | | (1.38) | | | 0.14 | | | (1.29) | | | 0.62 | | | (0.10) | | | (1.25) | | | (0.75) | |
| Impairment of non-real estate investments | | 0.04 | | (1) | 0.16 | | | 0.09 | | | 0.06 | | | — | | | 0.20 | | | — | |
| Impairment of real estate | | 0.11 | | (1) | 0.02 | | | — | | | — | | | — | | | 0.12 | | | — | |
| Loss on early extinguishment of debt | | — | | | — | | | — | | | 0.36 | | | — | | | — | | | 0.07 | |
| Loss on early termination of interest rate hedge agreements | | — | | | — | | | — | | | 0.02 | | | — | | | — | | | — | |
| Preferred stock redemption charge | | — | | | — | | | — | | | — | | | — | | | — | | | 0.02 | |
| Allocation to unvested restricted stock awards | | 0.01 | | | — | | | 0.01 | | | (0.01) | | | — | | | 0.02 | | | 0.02 | |
| Funds from operations per share attributable to Alexandria’s common stockholders – diluted, as adjusted | | $ | 1.81 | | | $ | 1.82 | | | $ | 1.77 | | | $ | 1.75 | | | $ | 1.73 | | | $ | 3.63 | | | $ | 3.44 | |
| | | | | | | | | | | | | | |
Weighted-average shares of common stock outstanding(2) for calculations of: | | | | | | | | | | | | | | |
| Earnings per share – diluted | | 124,448 | | | 121,785 | | | 114,974 | | | 112,120 | | | 111,501 | | | 123,117 | | | 111,279 | |
| Funds from operations – diluted, per share | | 124,448 | | | 121,785 | | | 114,974 | | | 112,562 | | | 112,077 | | | 123,117 | | | 111,857 | |
| Funds from operations – diluted, as adjusted, per share | | 124,448 | | | 121,785 | | | 114,974 | | | 112,562 | | | 111,501 | | | 123,117 | | | 111,279 | |
| | | | | | | | | | | | | | |
(1)Refer to footnotes on the previous page for additional details.
(2)Refer to “Weighted-average shares of common stock outstanding – diluted” in the “Definitions and reconciliations” of our Supplemental Information for additional details.
SUPPLEMENTAL
INFORMATION
| | | | | |
| |
| |
| Company Profile | |
| June 30, 2020 | |
| |
Alexandria Real Estate Equities, Inc. (NYSE:ARE), an S&P 500® urban office REIT, is the first, longest-tenured, and pioneering owner, operator, and developer uniquely focused on collaborative life science, technology, and agtech campuses in AAA innovation cluster locations, with a total market capitalization of $27.7 billion as of June 30, 2020, and an asset base in North America of 43.0 million SF. The asset base in North America includes 28.8 million RSF of operating properties and 2.3 million RSF of Class A properties undergoing construction, 6.6 million RSF of near-term and intermediate-term development and redevelopment projects, and 5.3 million SF of future development projects. Founded in 1994, Alexandria pioneered this niche and has since established a significant market presence in key locations, including Greater Boston, San Francisco, New York City, San Diego, Seattle, Maryland, and Research Triangle. Alexandria has a longstanding and proven track record of developing Class A properties clustered in urban life science, technology, and agtech campuses that provide our innovative tenants with highly dynamic and collaborative environments that enhance their ability to successfully recruit and retain world-class talent and inspire productivity, efficiency, creativity, and success. Alexandria also provides strategic capital to transformative life science, technology, and agtech companies through our venture capital arm. We believe our unique business model and diligent underwriting ensure a high-quality and diverse tenant base that results in higher occupancy levels, longer lease terms, higher rental income, higher returns, and greater long-term asset value. For additional information on Alexandria, please visit www.are.com.
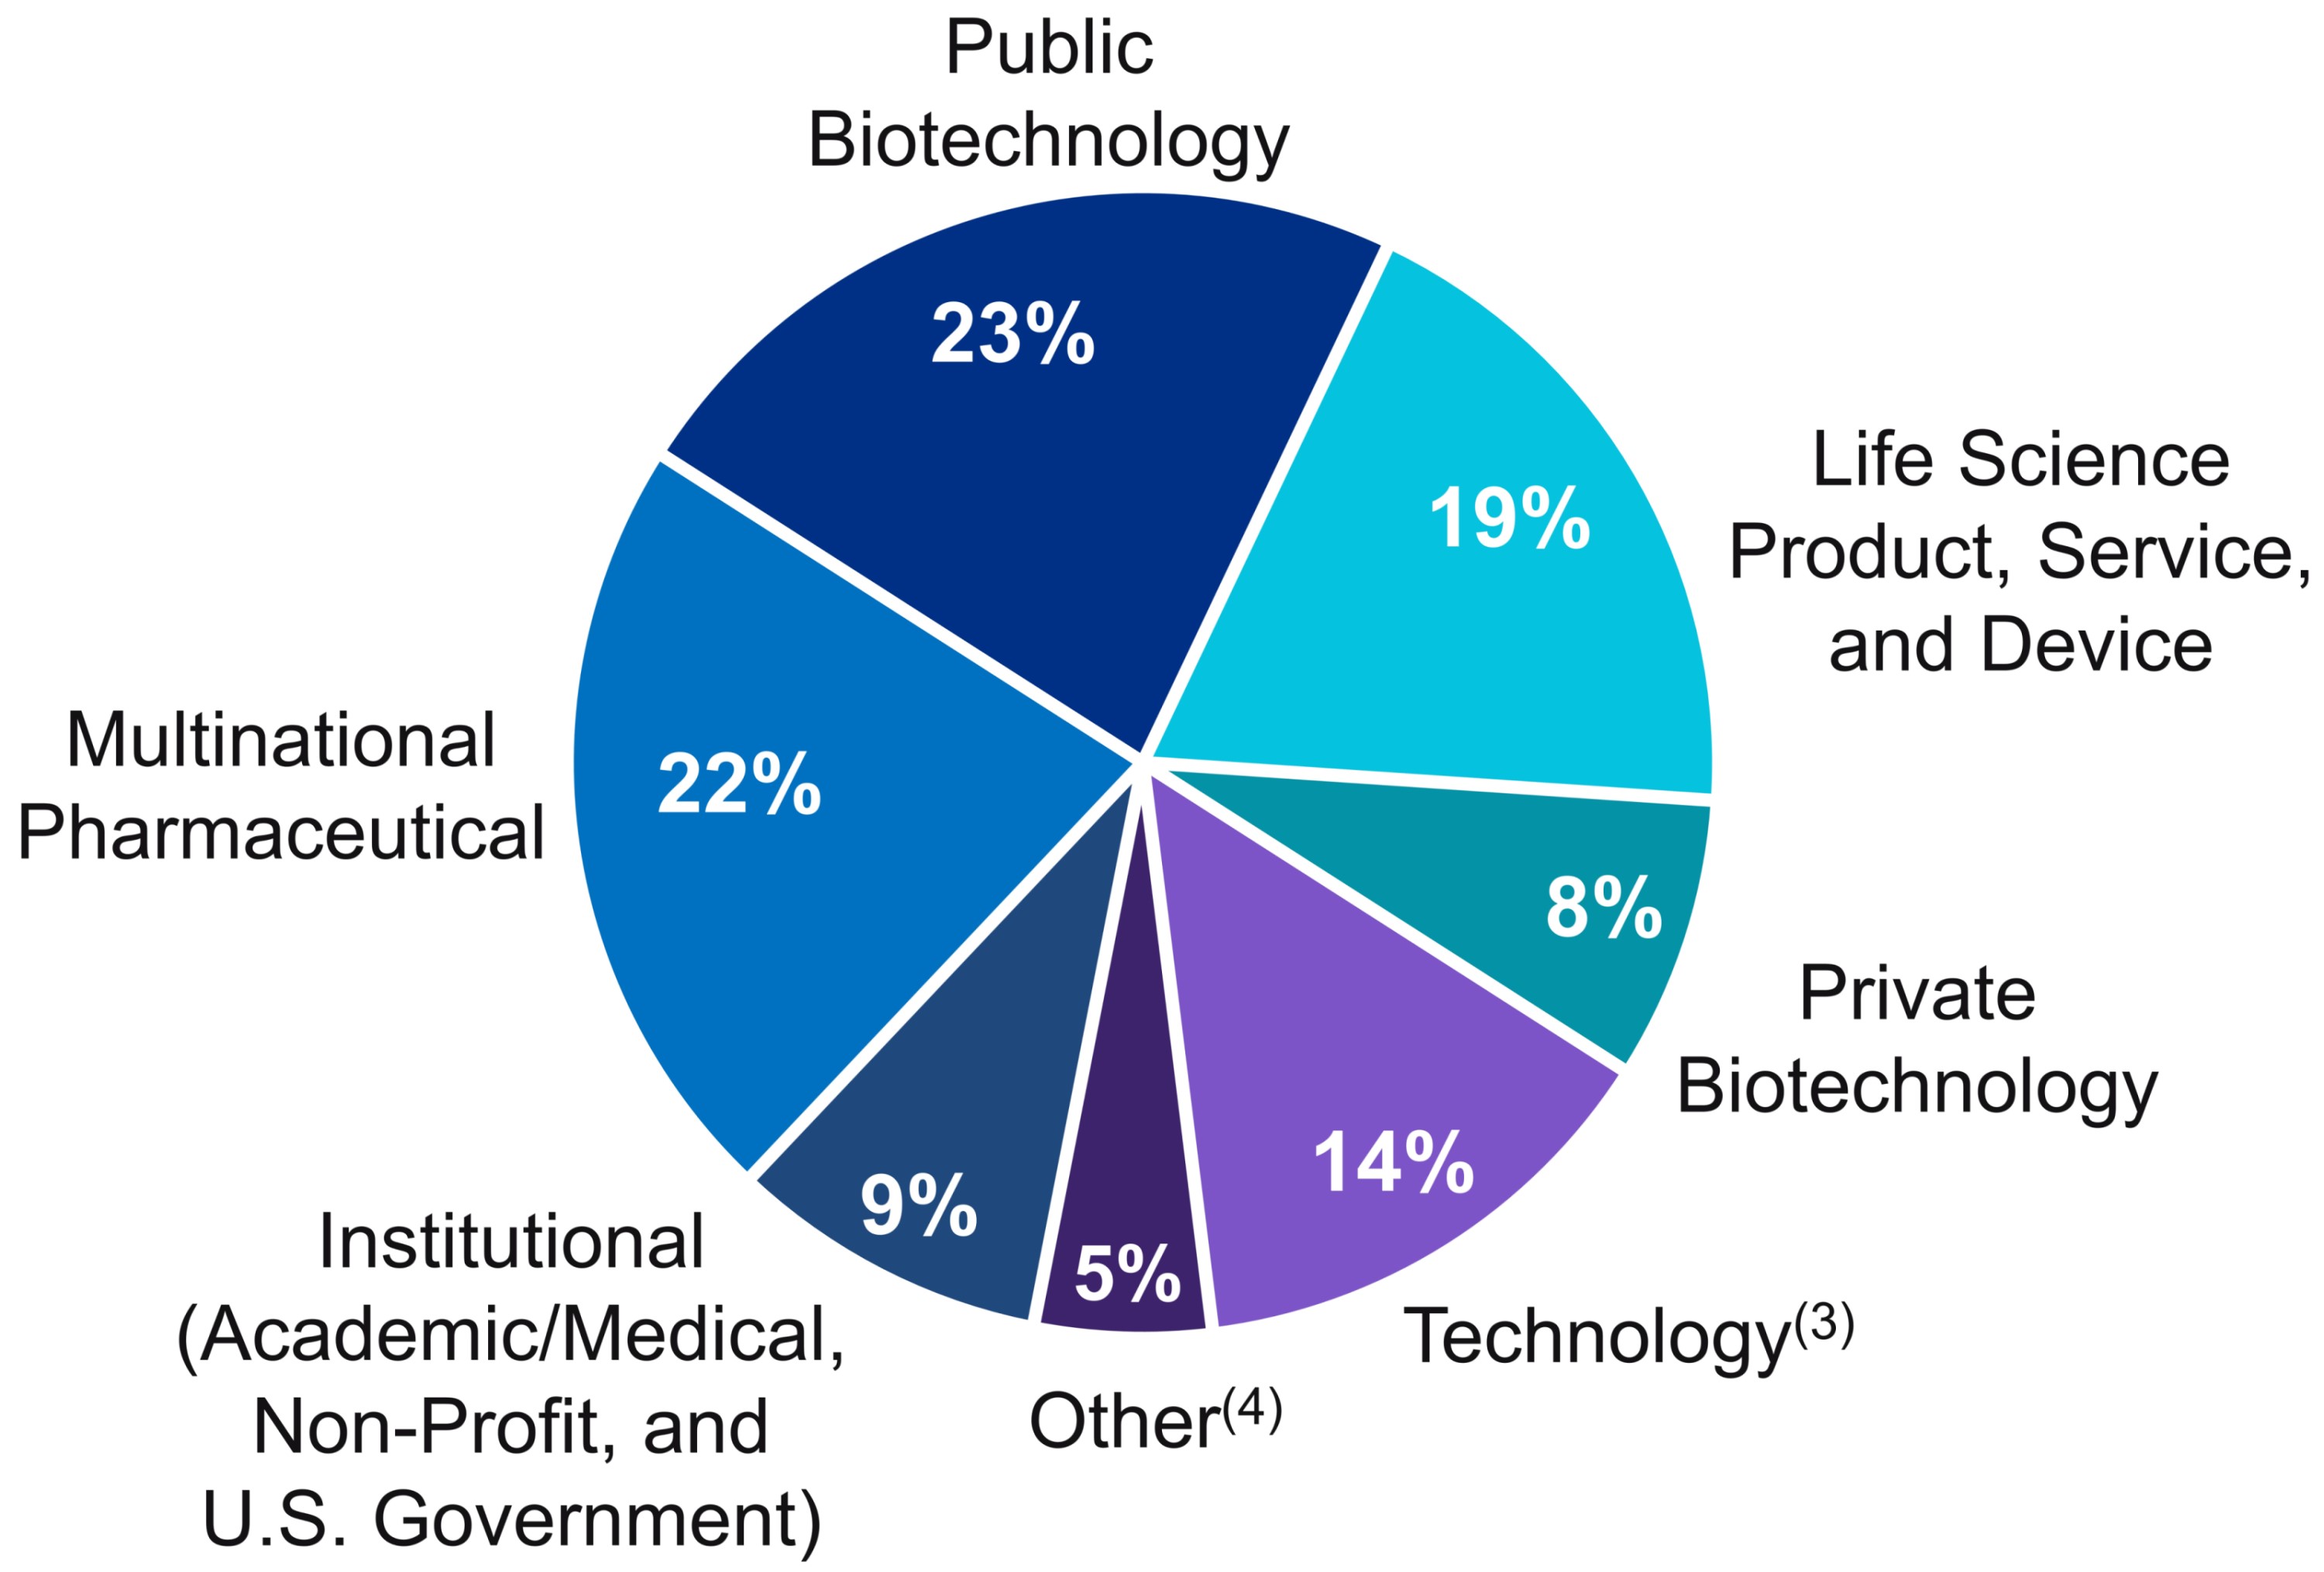
Tenant base
Alexandria is known for our high-quality and diverse tenant base, with 51% of our annual rental revenue generated from tenants that are investment-grade rated or publicly traded large cap companies. The quality, diversity, breadth, and depth of our significant relationships with our tenants provide Alexandria with high-quality and stable cash flows. Alexandria’s underwriting team and long-term industry relationships positively distinguish us from all other publicly traded REITs and real estate companies.
Executive and senior management team
Alexandria’s executive and senior management team has unique experience and expertise in creating, owning, and operating highly dynamic and collaborative campuses in key urban life science, technology, and agtech cluster locations that inspire innovation. From the development of high-quality, sustainable real estate, to the ongoing cultivation of collaborative environments with unique amenities and events, the Alexandria team has a first-in-class reputation of excellence in our niche. Alexandria’s highly experienced management team also includes regional market directors with leading reputations and longstanding relationships within the life science, technology, and agtech communities in their respective urban innovation clusters. We believe that our expertise, experience, reputation, and key relationships in the real estate, life science, technology, and agtech industries provide Alexandria significant competitive advantages in attracting new business opportunities.
Alexandria’s executive and senior management team consists of 41 individuals, averaging 25 years of real estate experience, including 14 years with Alexandria. Our executive management team alone averages 18 years of experience with Alexandria.
| | | | | | | | |
| EXECUTIVE MANAGEMENT TEAM | | |
| Joel S. Marcus | | Stephen A. Richardson |
| Executive Chairman & Founder | | Co-Chief Executive Officer |
| Peter M. Moglia | | Dean A. Shigenaga |
Co-Chief Executive Officer &
Co-Chief Investment Officer | | Co-President & Chief Financial Officer |
| Thomas J. Andrews | | Daniel J. Ryan |
| Co-President & Regional Market Director – Greater Boston | | Co-Chief Investment Officer & Regional Market Director – San Diego |
| Lawrence J. Diamond | | Joseph Hakman |
| Co-Chief Operating Officer & Regional Market Director – Maryland | | Chief Strategic Transactions Officer and Co-Chief Operating Officer |
| Vincent R. Ciruzzi | | John H. Cunningham |
| Chief Development Officer | | Executive Vice President – Regional Market Director – New York City |
| Marc E. Binda | | Andres R. Gavinet |
Executive Vice President –
Finance & Treasurer | | Chief Accounting Officer |
| Jackie B. Clem | | Terezia C. Nemeth |
| General Counsel & Secretary | | Executive Vice President – Regional Market Director – San Francisco |
| Gary D. Dean | | |
Executive Vice President –
Real Estate Legal Affairs | | |
| | | | | |
| |
| |
| Investor Information | |
| June 30, 2020 | |
| |
| | | | | | | | | | | | | | | | | |
| Corporate Headquarters | | New York Stock Exchange Trading Symbol | | Information Requests | |
| 26 North Euclid Avenue | | Common stock: ARE | | Phone: | (626) 578-0777 |
| Pasadena, California 91101 | | | | Email: | corporateinformation@are.com |
| | | | | Web: | www.are.com |
| | | | | |
| | |
| Alexandria is currently covered by the following research analysts. This list may be incomplete and is subject to change as firms initiate or discontinue coverage of our company. Please note that any opinions, estimates, or forecasts regarding our historical or predicted performance made by these analysts are theirs alone and do not represent opinions, estimates, or forecasts of Alexandria or our management. Alexandria does not by our reference or distribution of the information below imply our endorsement of or concurrence with any opinions, estimates, or forecasts of these analysts. Interested persons may obtain copies of analysts’ reports on their own as we do not distribute these reports. Several of these firms may, from time to time, own our stock and/or hold other long or short positions in our stock and may provide compensated services to us. |
| | | | | | | | | | | | | | | | | | | | |
| Bank of America Merrill Lynch | | Citigroup Global Markets Inc. | | JMP Securities | | RBC Capital Markets |
| Jamie Feldman / Elvis Rodriguez | | Michael Bilerman / Emmanuel Korchman | | Aaron Hecht / Matthew Hurwit | | Michael Carroll / Jason Idoine |
| (646) 855-5808 / (646) 855-1589 | | (212) 816-1383 / (212) 816-1382 | | (415) 835-3963 / (415) 835-3964 | | (440) 715-2649 / (440) 715-2651 |
| | | | | | |
| BTIG, LLC | | Evercore ISI | | J.P. Morgan Securities LLC | | Robert W. Baird & Co. Incorporated |
| Tom Catherwood / James Sullivan | | Sheila McGrath / Wendy Ma | | Anthony Paolone / Ray Zhong | | David Rodgers / Nicholas Thillman |
| (212) 738-6140 / (212) 738-6139 | | (212) 497-0882 / (212) 497-0870 | | (212) 622-6682 / (212) 622-5411 | | (216) 737-7341 / (414) 298-5053 |
| | | | | | |
| CFRA | | Green Street Advisors, Inc. | | Mizuho Securities USA Inc. | | SMBC Nikko Securities America, Inc. |
| Kenneth Leon | | Daniel Ismail / Chris Darling | | Omotayo Okusanya / Venkat Kommineni | | Richard Anderson / Jay Kornreich |
| (646) 517-2552 | | (949) 640-8780 / (949) 640-8780 | | (646) 949-9672 / (646) 949-9754 | | (646) 521-2351 / (646) 424-3202 |
| | | | | | |
| | | | | | |
| | | | | | |
| Fixed Income Coverage | | | | Rating Agencies | | |
| Barclays Capital Inc. | | Wells Fargo & Company | | Moody’s Investors Service | | S&P Global Ratings |
| Srinjoy Banerjee / Devon Zhou | | Thierry Perrein / Kevin McClure | | (212) 553-0376 | | Fernanda Hernandez / Michael Souers |
| (212) 526-3521 / (212) 526-6961 | | (704) 410-3262 / (704) 410-3252 | | | | (212) 438-1347 / (212) 438-2508 |
| | | | | | |
| J.P. Morgan Securities LLC | | | | | | |
| Mark Streeter / Ian Snyder | | | | | | |
| (212) 834-5086 / (212) 834-3798 | | | | | | |
| | | | | |
| |
| Financial and Asset Base Highlights | |
| June 30, 2020 | |
| (Dollars in thousands, except per share amounts) | |
| |
| | | | | | | | | | | | | | | | | | | | | | | | | | | | | | | | |
| | | Three Months Ended (unless stated otherwise) | | | | | | | | |
| | 6/30/20 | | 3/31/20 | | 12/31/19 | | 9/30/19 | | 6/30/19 |
| Selected financial data from consolidated financial statements and related information | | | | | | | | | | |
| Rental revenues | | $ | 341,555 | | | $ | 337,942 | | | $ | 308,418 | | | $ | 293,182 | | | $ | 289,625 | |
| Tenant recoveries | | $ | 94,301 | | | $ | 99,663 | | | $ | 96,303 | | | $ | 92,594 | | | $ | 81,993 | |
| General and administrative expenses | | $ | 31,775 | | | $ | 31,963 | | | $ | 29,782 | | | $ | 27,930 | | | $ | 26,434 | |
General and administrative expenses as a percentage of net operating income – trailing 12 months | | 10.3% | | 10.2% | | 10.0% | | 9.7% | | 9.5% |
| Operating margin | | 72% | | 71% | | 70% | | 70% | | 72% |
| Adjusted EBITDA margin | | 69% | | 68% | | 68% | | 68% | | 69% |
| Adjusted EBITDA – quarter annualized | | $ | 1,253,844 | | | $ | 1,239,016 | | | $ | 1,148,620 | | | $ | 1,099,908 | | | $ | 1,063,056 | |
| Adjusted EBITDA – trailing 12 months | | $ | 1,185,347 | | | $ | 1,137,650 | | | $ | 1,085,382 | | | $ | 1,040,449 | | | $ | 1,004,724 | |
| | | | | | | | | | |
| Net debt at end of period | | $ | 7,333,905 | | | $ | 6,870,571 | | | $ | 6,582,089 | | | $ | 6,333,459 | | | $ | 6,154,885 | |
| Net debt to Adjusted EBITDA – quarter annualized | | 5.8x | | 5.5x | | 5.7x | | 5.8x | | 5.8x |
| Net debt to Adjusted EBITDA – trailing 12 months | | 6.2x | | 6.0x | | 6.1x | | 6.1x | | 6.1x |
| Net debt and preferred stock to Adjusted EBITDA – quarter annualized | | 5.8x | | 5.5x | | 5.7x | | 5.8x | | 5.8x |
| Net debt and preferred stock to Adjusted EBITDA – trailing 12 months | | 6.2x | | 6.0x | | 6.1x | | 6.1x | | 6.2x |
| | | | | | | | | | |
| Fixed-charge coverage ratio – quarter annualized | | 4.2x | | 4.5x | | 4.2x | | 3.9x | | 4.2x |
| Fixed-charge coverage ratio – trailing 12 months | | 4.2x | | 4.2x | | 4.2x | | 4.1x | | 4.2x |
| Unencumbered net operating income as a percentage of total net operating income | | 95% | | 95% | | 95% | | 95% | | 94% |
| | | | | | | | | | |
| Closing stock price at end of period | | $ | 162.25 | | | $ | 137.06 | | | $ | 161.58 | | | $ | 154.04 | | | $ | 141.09 | |
| Common shares outstanding (in thousands) at end of period | | 124,559 | | | 124,326 | | | 120,800 | | | 113,173 | | | 111,986 | |
| Total equity capitalization at end of period | | $ | 20,209,636 | | | $ | 17,040,078 | | | $ | 19,518,915 | | | $ | 17,522,382 | | | $ | 15,887,660 | |
| Total market capitalization at end of period | | $ | 27,732,906 | | | $ | 24,345,213 | | | $ | 26,296,394 | | | $ | 24,260,065 | | | $ | 22,243,865 | |
| | | | | | | | | | |
| Dividend per share – quarter/annualized | | $1.06/$4.24 | | $1.03/$4.12 | | $1.03/$4.12 | | $1.00/$4.00 | | $1.00/$4.00 |
| Dividend payout ratio for the quarter | | 59% | | 58% | | 61% | | 57% | | 58% |
| Dividend yield – annualized | | 2.6% | | 3.0% | | 2.5% | | 2.6% | | 2.8% |
| | | | | | | | | | |
| Amounts related to operating leases: | | | | | | | | | | |
| Operating lease liabilities | | $ | 291,710 | | | $ | 293,173 | | | $ | 271,809 | | | $ | 270,614 | | | $ | 243,585 | |
| Rent expense | | $ | 4,936 | | | $ | 4,781 | | | $ | 4,609 | | | $ | 4,705 | | | $ | 4,482 | |
| | | | | | | | | | |
| Capitalized interest | | $ | 30,793 | | | $ | 24,680 | | | $ | 23,822 | | | $ | 24,558 | | | $ | 21,674 | |
| Weighted-average interest rate for capitalization of interest during the period | | 4.03% | | 3.80% | | 3.88% | | 4.00% | | 4.14% |
| | | | | | | | | | |
| | | | | |
| |
| Financial and Asset Base Highlights (continued) | |
| June 30, 2020 | |
| (Dollars in thousands, except annual rental revenue per occupied RSF amounts) | |
| |
| | | | | | | | | | | | | | | | | | | | | | | | | | | | | | | | |
| | | Three Months Ended (unless stated otherwise) | | | | | | | | |
| | 6/30/20 | | 3/31/20 | | 12/31/19 | | 9/30/19 | | 6/30/19 |
| Amounts included in funds from operations and non-revenue-enhancing capital expenditures | | | | | | | | | | |
| Straight-line rent revenue | | $ | 23,367 | | | $ | 20,597 | | | $ | 24,400 | | | $ | 27,394 | | | $ | 25,476 | |
| Amortization of acquired below-market leases | | $ | 13,787 | | | $ | 15,964 | | | $ | 8,837 | | | $ | 5,774 | | | $ | 8,054 | |
| Straight-line rent expense on ground leases | | $ | 167 | | | $ | 171 | | | $ | 219 | | | $ | 320 | | | $ | 226 | |
| Stock compensation expense | | $ | 9,185 | | | $ | 9,929 | | | $ | 10,239 | | | $ | 10,935 | | | $ | 11,437 | |
| Amortization of loan fees | | $ | 2,737 | | | $ | 2,247 | | | $ | 2,241 | | | $ | 2,251 | | | $ | 2,380 | |
| Amortization of debt premiums | | $ | 888 | | | $ | 888 | | | $ | 907 | | | $ | 1,287 | | | $ | 782 | |
| Non-revenue-enhancing capital expenditures: | | | | | | | | | | |
| Building improvements | | $ | 3,107 | | | $ | 3,198 | | | $ | 3,295 | | | $ | 2,901 | | | $ | 2,876 | |
| Tenant improvements and leasing commissions | | $ | 11,500 | | | $ | 12,923 | | | $ | 14,648 | | | $ | 11,964 | | | $ | 13,901 | |
| | | | | | | | | | |
| Operating statistics and related information (at end of period) | | | | | | | | | | |
| Number of properties – North America | | 304 | | | 302 | | | 291 | | | 269 | | | 257 | |
| RSF – North America (including development and redevelopment projects under construction) | | 31,141,758 | | | 30,924,356 | | | 29,098,433 | | | 27,288,263 | | | 26,321,122 | |
| Total square feet – North America | | 43,023,989 | | | 41,514,374 | | | 39,170,786 | | | 38,496,276 | | | 37,120,560 | |
| Annual rental revenue per occupied RSF – North America | | $ | 51.30 | | | $ | 51.18 | | | $ | 51.04 | | | $ | 51.00 | | | $ | 50.27 | |
| Occupancy of operating properties – North America | | 94.8% | (1) | 95.1% | | 96.8% | | 96.6% | | 97.4% |
| Occupancy of operating and redevelopment properties – North America | | 92.3% | | 92.9% | | 94.4% | | 94.5% | | 96.4% |
| Weighted-average remaining lease term (in years) | | 7.8 | | 7.8 | | 8.1 | | 8.3 | | 8.4 |
| | | | | | | | | | |
| Total leasing activity – RSF | | 1,077,510 | | | 703,355 | | | 1,752,124 | | | 1,241,677 | | | 819,949 | |
| Lease renewals and re-leasing of space – change in average new rental rates over expiring rates: | | | | | | | | | | |
| Rental rate increases | | 37.2% | | 46.3% | | 37.0% | | 27.9% | | 32.5% |
| Rental rate increases (cash basis) | | 15.0% | | 22.3% | | 21.7% | | 11.2% | | 17.8% |
| RSF (included in total leasing activity above) | | 699,130 | | | 557,367 | | | 571,650 | | | 758,113 | | | 587,930 | |
| | | | | | | | | | |
| Same property – percentage change over comparable quarter from prior year: | | | | | | | | | | |
| Net operating income increase | | 0.6% | (2) | 2.4% | | 2.0% | | 2.5% | | 4.3% |
| Net operating income increase (cash basis) | | 2.5% | (2) | 6.1% | | 4.0% | | 5.7% | | 9.5% |
| | | | | | | | | | |
(1)Refer to “Occupancy” in this Supplemental Information for additional details.
(2)Includes the effect of lower revenues from our retail tenancy and transient/short-term parking. Excluding this effect, same property net operating income growth for the three months ended June 30, 2020, would be 1.6% and 4.2% (cash basis), respectively. We expect occupancy and other contractual rental increases in the second half of 2020 will increase same property NOI and same property NOI (cash basis) to within our guidance range for the year ending December 31, 2020.
| | | | | |
| |
| |
| High-Quality, Diverse, and Innovative Tenants | |
| June 30, 2020 | |
| |
Long-Duration Cash Flows From High-Quality, Diverse, and
Innovative Tenants
| | | | | | | | | | | | | | | | | |
Investment-Grade or
Publicly Traded Large Cap Tenants | | | | | Tenant Mix |
| | | | | |
| 51% | | | | |
| | | | | |
| | | | | |
| | | | | |
of ARE’s Annual Rental Revenue(1) | | | | | |
| | | | | |
| | | | | |
| | | | | |
| Long-Duration Lease Terms | | | | | |
| | | | | |
| 7.8 Years | | | | |
| | | | | |
| | | | | |
| | | | | |
Weighted-Average Remaining Term(2) | | | | | |
| | | | | Percentage of ARE’s Annual Rental Revenue(1) |
(1)Represents annual rental revenue in effect as of June 30, 2020.
(2)Based on aggregate annual rental revenue in effect as of June 30, 2020. Refer to “Annual rental revenue” in the “Definitions and reconciliations” of this Supplemental Information for additional details on our methodology on annual rental revenue from unconsolidated real estate joint ventures.
(3)67% of our annual rental revenue from technology tenants is from investment-grade or publicly traded large cap tenants. The weighted-average remaining term of leases with our technology tenants is 15.5 years.
(4)Our other tenants, aggregating 5.0% of our annual rental revenue, comprise 4.3% of annual rental revenue from professional services, finance, telecommunications, and construction/real estate companies and only 0.7% from retail-related tenants.
| | | | | |
| |
| |
| Class A Properties in AAA Locations | |
| June 30, 2020 | |
| |
High-Quality Cash Flows From Class A Properties in AAA Locations
| | | | | | | | | | | | | | |
Class A Properties in
AAA Locations | | | | AAA Locations |
| | | | |
| | | | |
| | | | |
| 74% | | | | |
| | | | |
| | | | |
| | | | |
| | | | |
| | | | |
| | | | |
| of ARE’s | | | | |
Annual Rental Revenue(1) | | | | |
| | | | |
| | | | |
| | | | |
| | | | Percentage of ARE’s Annual Rental Revenue(1) |
(1)Represents annual rental revenue in effect as of June 30, 2020.
| | | | | | | | | | | | | | |
Solid Historical Occupancy(1) | | | | Occupancy Across Key Locations(2) |
| | | | |
| | | | |
| | | | |
| 96% | | | | |
| | | | |
| | | | |
| | | | |
| | | | |
| | | | |
| | | | |
| Over 10 Years | | | | |
| | | | |
| | | | |
| | | | |
| | | | |
| | | | |
(1)Represents average occupancy of operating properties in North America as of each December 31 for the last 10 years and as of June 30, 2020.
(2)As of June 30, 2020.
(3)Includes 647,771 RSF, or 2.3%, of vacancy in our North America markets (noted below), representing lease-up opportunities at properties recently acquired. Excluding these vacancies, occupancy of operating properties in North America was 97.1% as of June 30, 2020.
| | | | | | | | | | | | | | | | | | | | | | | | | | | | | | | | |
| | | | As of June 30, 2020 | | | | | | | | | | |
| | | | Vacant | | Occupancy Impact | | | | | | | | |
| Property | | Submarket/Market | | RSF | | Region | | Consolidated | | | | | | |
| 601, 611, and 651 Gateway Boulevard | | South San Francisco/San Francisco | | 201,570 | | | 2.6 | % | | 0.7 | % | | | | | | |
| SD Tech by Alexandria | | Sorrento Mesa/San Diego | | 182,484 | | | 3.0 | % | | 0.6 | | | | | | | |
| 5505 Morehouse Drive | | Sorrento Mesa/San Diego | | 71,016 | | | 1.2 | % | | 0.3 | | | | | | | |
| Other acquisitions | | Various | | 192,701 | | | N/A | | 0.7 | | | | | | | |
| | | | 647,771 | | | | | 2.3 | % | | | | | | |
| | | | | |
| |
| |
| Key Operating Metrics | |
| June 30, 2020 | |
| |
| | | | | | | | | | | | | | | | | | | | | | | | | | | | | | | | |
Historical Same Property
Net Operating Income | | | Favorable Lease Structure(1) | | | | | | | |
| | | Strategic Lease Structure by Owner and Operator of Collaborative Life Science, Technology, and Agtech Campuses | | | | | | | |
| | | Increasing cash flows | | | | | | | |
| | | Percentage of leases containing annual rent escalations | | | | | | 94 | % | |
| | | Stable cash flows | | | | | | | |
| | | Percentage of triple net leases | | | | | | 93 | % | |
| | | Lower capex burden | | | | | | | |
| | | Percentage of leases providing for the recapture of capital expenditures | | | | | | 92 | % | |
| | | | | | | | | | |
| | | | | | | | | | |
Historical Rental Rates:
Renewed/Re-Leased Space | | | Margins(2) | | | | | | | |
| | | | | | | | | | |
| | | Operating | | | | | Adjusted EBITDA | | |
| | | 72% | | | | | 69% | | |
| | | | | | | | | | |
| | | | | | | | | | |
| | | | | | | | | | |
(1)Percentages calculated based on RSF as of June 30, 2020.
(2)Represents percentages for the three months ended June 30, 2020.
| | | | | |
| |
| Same Property Performance | |
| June 30, 2020 | |
| (Dollars in thousands) | |
| |
| | | | | | | | | | | | | | | | | | | | | | | | | | | | | | | | | | | | | | |
| | June 30, 2020 | | | | | | | | June 30, 2020 | | |
| Same Property Financial Data | | Three Months Ended | | | Six Months Ended | | | Same Property Statistical Data | | Three Months Ended | | Six Months Ended |
| Percentage change over comparable period from prior year: | | | | | | | | Number of same properties | | 228 | | 213 |
| Net operating income increase | | 0.6% | (1) | | 1.6% |
| | Rentable square feet | | 21,779,066 | | 21,191,416 |
| Net operating income increase (cash basis) | | 2.5% | (1) | | 4.5% | | | Occupancy – current-period average | | 96.3% | | 96.6% |
| Operating margin | | 73% | | | 73% | | | Occupancy – same-period prior-year average | | 97.1% | | 97.1% |
| | | | | | | | | | | | |
| | | | | | | | | | | | | | | | | | | | | | | | | | | | | | | | | | | | | | | | | | | | | | | | | | | | | |
| | | Three Months Ended June 30, | | | | | | | | Six Months Ended June 30, | | | | | | | |
| | 2020 | | 2019 | | $ Change | | % Change | | 2020 | | 2019 | | $ Change | | % Change | |
| Income from rentals: | | | | | | | | | | | | | | | | | |
| | | | | | | | | | | | | | | | | |
| Same properties | | $ | 272,951 | | | $ | 273,543 | | | $ | (592) | | | (0.2 | %) | | $ | 529,138 | | | $ | 522,721 | | | $ | 6,417 | | | 1.2 | % | |
| Non-same properties | | 68,604 | | | 16,082 | | | 52,522 | | | 326.6 | | | 150,359 | | | 41,467 | | | 108,892 | | | 262.6 | | |
| Rental revenues | | 341,555 | | | 289,625 | | | 51,930 | | | 17.9 | | | 679,497 | | | 564,188 | | | 115,309 | | | 20.4 | | |
| | | | | | | | | | | | | | | | | |
| | | | | | | | | | | | | | | | | |
| Same properties | | 81,618 | | | 79,637 | | | 1,981 | | | 2.5 | | | 162,493 | | | 153,902 | | | 8,591 | | | 5.6 | | |
| Non-same properties | | 12,683 | | | 2,356 | | | 10,327 | | | 438.3 | | | 31,471 | | | 8,277 | | | 23,194 | | | 280.2 | | |
| Tenant recoveries | | 94,301 | | | 81,993 | | | 12,308 | | | 15.0 | | | 193,964 | | | 162,179 | | | 31,785 | | | 19.6 | | |
| | | | | | | | | | | | | | | | | |
| Income from rentals | | 435,856 | | | 371,618 | | | 64,238 | | | 17.3 | | | 873,461 | | | 726,367 | | | 147,094 | | | 20.3 | | |
| | | | | | | | | | | | | | | | | |
| Same properties | | 32 | | | 93 | | | (61) | | | (65.6) | | | 114 | | | 265 | | | (151) | | | (57.0) | | |
| Non-same properties | | 1,068 | | | 2,145 | | | (1,077) | | | (50.2) | | | 3,300 | | | 6,066 | | | (2,766) | | | (45.6) | | |
| Other income | | 1,100 | | | 2,238 | | | (1,138) | | | (50.8) | | | 3,414 | | | 6,331 | | | (2,917) | | | (46.1) | | |
| | | | | | | | | | | | | | | | | |
| Same properties | | 354,601 | | | 353,273 | | | 1,328 | | | 0.4 | | | 691,745 | | | 676,888 | | | 14,857 | | | 2.2 | | |
| Non-same properties | | 82,355 | | | 20,583 | | | 61,772 | | | 300.1 | | | 185,130 | | | 55,810 | | | 129,320 | | | 231.7 | | |
| Total revenues | | 436,956 | | | 373,856 | | | 63,100 | | | 16.9 | | | 876,875 | | | 732,698 | | | 144,177 | | | 19.7 | | |
| | | | | | | | | | | | | | | | | |
| Same properties | | 94,006 | | | 94,140 | | | (134) | | | (0.1) | | | 188,816 | | | 181,678 | | | 7,138 | | | 3.9 | | |
| Non-same properties | | 29,905 | | | 11,549 | | | 18,356 | | | 158.9 | | | 64,198 | | | 25,512 | | | 38,686 | | | 151.6 | | |
| Rental operations | | 123,911 | | | 105,689 | | | 18,222 | | | 17.2 | | | 253,014 | | | 207,190 | | | 45,824 | | | 22.1 | | |
| | | | | | | | | | | | | | | | | |
| Same properties | | 260,595 | | | 259,133 | | | 1,462 | | | 0.6 | | | 502,929 | | | 495,210 | | | 7,719 | | | 1.6 | | |
| Non-same properties | | 52,450 | | | 9,034 | | | 43,416 | | | 480.6 | | | 120,932 | | | 30,298 | | | 90,634 | | | 299.1 | | |
| Net operating income | | $ | 313,045 | | | $ | 268,167 | | | $ | 44,878 | | | 16.7 | % | | $ | 623,861 | | | $ | 525,508 | | | $ | 98,353 | | | 18.7 | % | |
| | | | | | | | | | | | | | | | | |
| Net operating income – same properties | | $ | 260,595 | | | $ | 259,133 | | | $ | 1,462 | | | 0.6 | % | (1) | $ | 502,929 | | | $ | 495,210 | | | $ | 7,719 | | | 1.6 | % | |
| Straight-line rent revenue | | (18,873) | | | (22,441) | | | 3,568 | | | (15.9) | | | (33,492) | | | (45,225) | | | 11,733 | | | (25.9) | | |
| Amortization of acquired below-market leases | | (4,637) | | | (5,292) | | | 655 | | | (12.4) | | | (7,372) | | | (7,757) | | | 385 | | | (5.0) | | |
| Net operating income – same properties (cash basis) | | $ | 237,085 | | | $ | 231,400 | | | $ | 5,685 | | | 2.5 | % | (1) | $ | 462,065 | | | $ | 442,228 | | | $ | 19,837 | | | 4.5 | % | |
| | | | | | | | | | | | | | | | | |
Refer to “Same property comparisons” in the “Definitions and reconciliations” of this Supplemental Information for a reconciliation of same properties to total properties. “Definitions and reconciliations” also contains definitions of “Tenant recoveries” and “Net operating income” and their respective reconciliations from the most directly comparable financial measures presented in accordance with GAAP.
(1)Includes the effect of temporary reduction in same property occupancy of 80 basis points related to downtime in connection with leases aggregating 152,045 RSF, with 63% already leased for delivery in the third quarter of 2020 at significantly higher rental rates. Excluding the impact of the temporary vacancies, the same property net operating income growth for the three months ended June 30, 2020, would have been 1.6% and 4.2% (cash basis), respectively. We expect occupancy and other contractual rental increases in the second half of 2020 will increase same property NOI and same property NOI (cash basis) to within our guidance range for the year ending December 31, 2020.
| | | | | |
| |
| Leasing Activity | |
| June 30, 2020 | |
| (Dollars per RSF) | |
| |
| | | | | | | | | | | | | | | | | | | | | | | | | | | | | | | | | | | | | | | | | | | | | | | | | | | | | | | | | | | | | | | | | | | | | | | | | | |
| | | Three Months Ended | | | | | | | | Six Months Ended | | | | | | | | Year Ended | | | | | |
| | | June 30, 2020 | | | | | | | | June 30, 2020 | | | | | | | | December 31, 2019 | | | | | |
| | Including
Straight-Line Rent | | | | Cash Basis | | | | Including
Straight-Line Rent | | | | Cash Basis | | | | Including
Straight-Line Rent | | | | Cash Basis | | |
| Leasing activity: | | | | | | | | | | | | | | | | | | | | | | | | |
Renewed/re-leased space(1) | | | | | | | | | | | | | | | | | | | | | | | | |
| Rental rate changes | | | 37.2% | | | | 15.0% | | | | 41.1% | | | | 17.9% | | | | 32.2% | | | | 17.6% | |
| New rates | | | $55.34 | | | | | $53.15 | | | | | $51.78 | | | | | $49.07 | | | | | $58.65 | | | | | $56.19 | | |
| Expiring rates | | | $40.34 | | | | | $46.20 | | | | | $36.71 | | | | | $41.61 | | | | | $44.35 | | | | | $47.79 | | |
| RSF | | | 699,130 | | | | | | | | | 1,251,152 | | | | | | | | | 2,427,108 | | | | | | |
| Tenant improvements/leasing commissions | | | $16.86 | | | | | | | | | $19.52 | | | | | | | | | $20.28 | | | | | | |
| Weighted-average lease term | | | 5.3 years | | | | | | | | 5.4 years | | | | | | | | 5.7 years | | | | | |
| | | | | | | | | | | | | | | | | | | | | | | | |
| Developed/redeveloped/previously vacant space leased | | | | | | | | | | | | | | | | | | | | | | | | |
| New rates | | | $58.18 | | | | | $54.31 | | | | | $56.12 | | | | | $53.37 | | | | | $55.95 | | | | | $52.19 | | |
| RSF | | | 378,380 | | (2) | | | | | | | 529,713 | | | | | | | | | 2,635,614 | | | | | | |
| Tenant improvements/leasing commissions | | | $19.79 | | |
| | | | | | $17.73 | | | | | | | | | $13.74 | | | | | | |
| Weighted-average lease term | | | 10.2 years | | | | | | | | 8.9 years | | | | | | | | 9.8 years | | | | | |
| | | | | | | | | | | | | | | | | | | | | | | | |
| Leasing activity summary (totals): | | | | | | | | | | | | | | | | | | | | | | | | |
| New rates | | | $56.33 | | | | | $53.56 | | | | | $53.07 | | | | | $50.35 | | | | | $57.25 | | | | | $54.11 | | |
| RSF | | | 1,077,510 | | (3) | | | | | | | 1,780,865 | | (3) | | | | | | | 5,062,722 | | | | | | |
| Tenant improvements/leasing commissions | | | $17.89 | | | | | | | | | $18.99 | | | | | | | | | $16.88 | | | | | | |
| Weighted-average lease term | | | 7.0 years | | | | | | | | 6.4 years | | | | | | | | 7.8 years | | | | | |
| | | | | | | | | | | | | | | | | | | | | | | | |
Lease expirations(1) | | | | | | | | | | | | | | | | | | | | | | | | |
| Expiring rates | | | $39.25 | | | | | $44.04 | | | | | $36.36 | | | | | $40.67 | | | | | $43.43 | | | | | $46.59 | | |
| RSF | | | 1,081,504 | | | | | | | | | 1,879,355 | | | | | | | | | 2,822,434 | | | | | | |
Leasing activity includes 100% of results for each property in which we have an investment in North America.
(1)Excludes month-to-month leases aggregating 65,592 RSF and 41,809 RSF as of June 30, 2020, and December 31, 2019, respectively.
(2)As of July 27, 2020, our value-creation pipeline was 65% leased or negotiating.
(3)During the six months ended June 30, 2020, we granted tenant concessions/free rent averaging 1.7 months with respect to the 1,780,865 RSF leased. Approximately 66% of the leases executed during the six months ended June 30, 2020, did not include concessions for free rent.
| | | | | |
| |
| |
| Contractual Lease Expirations | |
| June 30, 2020 | |
| |
| | | | | | | | | | | | | | | | | | | | | | | | | | | | | | | | | | | | | | | | | | | | | | | | | | | | | | | | | | | |
| Year | | | | RSF | | | | Percentage of
Occupied RSF | | | | Annual Rental Revenue (Per RSF)(1) | | | | Percentage of Total
Annual Rental Revenue | | | |
| 2020 | (2) | | | 807,485 | | | | | 3.0 | % | | | | $ | 38.40 | | | | | 2.3 | % | | |
| 2021 | | | | 1,550,450 | | | | | 5.7 | % | | | | $ | 42.80 | | | | | 4.8 | % | | |
| 2022 | | | | 2,439,487 | | | | | 9.0 | % | | | | $ | 42.06 | | | | | 7.5 | % | | |
| 2023 | | | | 2,815,546 | | | | | 10.4 | % | | | | $ | 45.65 | | | | | 9.3 | % | | |
| 2024 | | | | 2,316,246 | | | | | 8.6 | % | | | | $ | 45.58 | | | | | 7.7 | % | | |
| 2025 | | | | 1,979,757 | | | | | 7.3 | % | | | | $ | 48.43 | | | | | 7.0 | % | | |
| 2026 | | | | 1,680,093 | | | | | 6.2 | % | | | | $ | 48.20 | | | | | 5.9 | % | | |
| 2027 | | | | 2,481,628 | | | | | 9.2 | % | | | | $ | 50.78 | | | | | 9.2 | % | | |
| 2028 | | | | 1,842,786 | | | | | 6.8 | % | | | | $ | 59.34 | | | | | 8.0 | % | | |
| 2029 | | | | 1,474,769 | | | | | 5.4 | % | | | | $ | 57.38 | | | | | 6.2 | % | | |
| Thereafter | | | | | 7,698,120 | | | | | 28.4 | % | | | | $ | 57.69 | | | | | 32.1 | % | | |
| | | | | | | | | | | | | | | | | | | | | | | | | | | | | | | | | | | | | | | | | | | | | | | | | | | | | | | | | | | | | | | | | | | | | | | | | | | | | | | | | | | | | | |
| Market | | 2020 Contractual Lease Expirations (in RSF) | | | | | | | | | | | | Annual Rental Revenue (Per RSF)(1) | | 2021 Contractual Lease Expirations (in RSF) | | | | | | | | | | | | Annual Rental Revenue (Per RSF)(1) |
| | Leased | | Negotiating/
Anticipating | | Targeted for
Development/
Redevelopment | | | Remaining Expiring Leases(3) | | | Total(2) | | | | Leased | | Negotiating/
Anticipating | | Targeted for
Development/
Redevelopment | | | Remaining Expiring Leases(4) | | | Total | | |
| | | | | | | | | | | | | | | | | | | | | | | | | | | | |
| Greater Boston | | 79,736 | | | 38,834 | | | 75,754 | | (5) | | 69,051 | | | | 263,375 | | | $ | 44.68 | | | — | |
| 11,897 | | | 79,101 | | (5) |
| 241,230 | | | | 332,228 | | | $ | 43.69 | |
| San Francisco | | 15,128 | | | — | | | — | | | | 106,540 | | | | 121,668 | | | 45.86 | | | 35,798 | | | 2,843 | | | 26,738 | | (6) |
| 403,952 | | | | 469,331 | | | 52.39 | |
| New York City | | 3,407 | | | — | | | — | | | | 21,581 | | | | 24,988 | | | 59.81 | | | 13,101 | | | — | | | — | | | | 2,315 | | | | 15,416 | | | 116.82 | |
| San Diego | | 36,038 | | | 71,961 | | (7) | — | | | | 126,643 | | |
| 234,642 | | | 33.69 | | | 89,780 | | | 44,681 | |
| 41,475 | | (8) | | 198,447 | | | | 374,383 | | | 36.18 | |
| Seattle | | 15,835 | | | — | | | — | | | | 8,397 | | | | 24,232 | | | 54.24 | | | 15,704 | | | — | | | — | | | | 54,514 | | | | 70,218 | | | 51.17 | |
| Maryland | | 10,820 | | | — | | | — | | | | 12,477 | | | | 23,297 | | | 32.29 | | | — | | | 14,323 | | | — | | |
| 107,770 | | | | 122,093 | | | 24.58 | |
| Research Triangle | | 34,226 | | | 1,592 | | | — | | | | 41,778 | | | | 77,596 | | | 15.95 | | | 16,942 | | | 22,634 | | | — | | | | 91,517 | | | | 131,093 | | | 28.45 | |
| Canada | | — | | | 2,587 | | | — | | | | 20,953 | | | | 23,540 | | | 11.23 | | | — | | | 4,722 | | | — | | | | 13,672 | | | | 18,394 | | | 23.40 | |
| Non-cluster markets | | 6,285 | | | — | | | — | | | | 7,862 | | | | 14,147 | | | 46.59 | | | — | | | — | | | — | | | | 17,294 | | | | 17,294 | | | 67.08 | |
| Total | | 201,475 | | | 114,974 | | | 75,754 | | | | 415,282 | | | | 807,485 | | | $ | 38.40 | | | 171,325 | | | 101,100 | | | 147,314 | | | | 1,130,711 | |
| | 1,550,450 | | | $ | 42.80 | |
| Percentage of expiring leases | | 25 | % | | 14 | % | | 9 | % | | | 52 | % | | | 100 | % | | | | 11 | % | | 7 | % | | 10 | % | | | 72 | % | | | 100 | % | | |
(1)Represents amounts in effect as of June 30, 2020.
(2)Excludes month-to-month leases aggregating 65,592 RSF as of June 30, 2020.
(3)The largest remaining contractual lease expiration in 2020 is 93,521 RSF related to a recently acquired property in our South San Francisco submarket.
(4)The largest remaining contractual lease expiration in 2021 is 89,576 RSF at a Class A office/laboratory building in our University Town Center submarket.
(5)Represents office space aggregating 154,855 RSF at The Arsenal on the Charles, a campus acquired on December 17, 2019, in our Cambridge/Inner Suburbs submarket, that is targeted for redevelopment into office/laboratory space upon expiration of the respective existing leases.
(6)Represents two retail leases aggregating 26,738 RSF at our recently acquired properties at 987 and 1075 Commercial Street. Upon expiration of these leases, we expect to demolish the existing building to allow for the future development of 700,000 RSF of an office/laboratory building on the site.
(7)Includes 71,961 RSF at 9363 and 9393 Towne Centre Drive in our University Town Center submarket, a future development site.
(8)Represents 41,475 RSF at the recently acquired property at 4555 Executive Drive in our University Town Center submarket. Upon expiration of the existing lease during the third quarter of 2021, we expect to demolish the existing building to allow for the future development of a new office/laboratory building on the site.
| | | | | |
| |
| Top 20 Tenants | |
| June 30, 2020 | |
| (Dollars in thousands, except average market cap amounts) | |
| |
81% of Top 20 Annual Rental Revenue From Investment-Grade
or Publicly Traded Large Cap Tenants(1)
| | | | | | | | | | | | | | | | | | | | | | | | | | | | | | | | | | | | | | | | | | | | | | | | | | | | | | | | | | | | | | | | | | | | | | | |
| | Tenant | | Remaining Lease Term(1) (in years) | | | | Aggregate
RSF | | | | Annual Rental Revenue(1) | | | | Percentage of Aggregate Annual Rental Revenue(1) | | Investment-Grade
Credit Ratings | | | | Average Market Cap(1) (in billions) | |
| | | | | | | | | | | | | | | | | | | | | | | |
| | | | | | | | | | | | | | | | | | Moody’s | | S&P | | | |
| 1 | | Bristol-Myers Squibb Company | | | 8.2 | | | | | 900,050 | | | | | $ | 52,243 | | | | 3.9 | % | | A2 | | A+ | | $ | 116.5 | | |
| 2 | | Takeda Pharmaceutical Company Ltd. | | | 9.1 | | | | | 606,249 | | | | | 39,342 | | | | 2.9 | | | Baa2 | | BBB+ | | $ | 57.2 | | |
| 3 | | Facebook, Inc. | | | 11.5 | | | | | 903,786 | | | | | 38,951 | | | | 2.9 | | | — | | — | | $ | 562.6 | | |
| 4 | | Illumina, Inc. | | | 10.1 | | | | | 891,495 | | | | | 35,907 | | | | 2.7 | | | — | | BBB | | $ | 45.4 | | |
| 5 | | Sanofi | | | 8.0 | | | | | 494,693 | | | | | 33,845 | | | | 2.5 | | | A1 | | AA | | $ | 116.9 | | |
| 6 | | Eli Lilly and Company | | | 9.0 | | | | | 531,784 | | | | | 33,527 | | | | 2.5 | | | A2 | | A+ | | $ | 124.4 | | |
| 7 | | Novartis AG | | | 7.8 | | | | | 441,894 | | | | | 31,216 | | | | 2.3 | | | A1 | | AA- | | $ | 223.9 | | |
| 8 | | Roche | | | 2.7 | | (2) | | | 649,482 | | | | | 28,298 | | | | 2.1 | | | Aa3 | | AA | | $ | 270.2 | | |
| 9 | | Uber Technologies, Inc. | | | 62.4 | | (3) | | | 1,009,188 | | | | | 27,379 | | | | 2.0 | | | — | | — | | $ | 56.3 | | |
| 10 | | bluebird bio, Inc. | | | 6.9 | | | | | 312,805 | | | | | 23,169 | | | | 1.7 | | | — | | — | | $ | 4.7 | | |
| 11 | | Maxar Technologies(4) | | | 5.0 | | | | | 478,000 | | | | | 21,577 | | | | 1.6 | | | — | | — | | $ | 0.7 | | |
| 12 | | Massachusetts Institute of Technology | | | 8.5 | | | | | 257,626 | | | | | 21,145 | | | | 1.6 | | | Aaa | | AAA | | $ | — | | |
| 13 | | Moderna, Inc. | | | 10.6 | | | | | 354,396 | | | | | 21,054 | | | | 1.6 | | | — | | — | | $ | 9.9 | | |
| 14 | | Merck & Co., Inc. | | | 13.1 | | | | | 321,063 | | | | | 20,075 | | | | 1.5 | | | A1 | | AA- | | $ | 211.3 | | |
| 15 | | New York University | | | 11.3 | | | | | 201,284 | | | | | 19,126 | | | | 1.4 | | | Aa2 | | AA- | | $ | — | | |
| 16 | | Pfizer Inc. | | | 4.7 | | | | | 416,979 | | | | | 17,762 | | | | 1.3 | | | A1 | | AA- | | $ | 204.9 | | |
| 17 | | Stripe, Inc. | | | 7.3 | | | | | 295,333 | | | | | 17,736 | | | | 1.3 | | | — | | — | | $ | — | | |
| 18 | | athenahealth, Inc.(4) | | | 12.0 | | | | | 409,710 | | | | | 17,686 | | | | 1.3 | | | — | | — | | $ | — | | |
| 19 | | Amgen Inc. | | | 3.8 | | | | | 407,369 | | | | | 16,838 | | | | 1.3 | | | Baa1 | | A- | | $ | 127.8 | | |
| 20 | | United States Government | | | 7.4 | | | | | 287,638 | | | | | 16,521 | | | | 1.2 | | | Aaa | | AA+ | | $ | — | | |
| | Total/weighted-average | | | 11.2 | | (3) | | | 10,170,824 | | | | | $ | 533,397 | | | | 39.6 | % | | | | | | | |
(1)Based on aggregate annual rental revenue in effect as of June 30, 2020. Refer to “Annual rental revenue” and “Investment-grade or publicly traded large cap tenants” in the “Definitions and reconciliations” of this Supplemental Information for additional details on our methodology on annual rental revenue from unconsolidated real estate joint ventures and average daily market capitalization.
(2)Includes 197,787 RSF expiring in 2022 at our recently acquired property at 651 Gateway Boulevard in our South San Francisco submarket. Upon expiration of the lease, 651 Gateway Boulevard will be redeveloped into a Class A office/laboratory building.
(3)Includes (i) ground leases for land at 1455 and 1515 Third Street (two buildings aggregating 422,980 RSF), and (ii) leases at 1655 and 1725 Third Street (two buildings aggregating 586,208 RSF) owned by our unconsolidated joint venture in which we have an ownership interest of 10%. Annual rental revenue is presented using 100% of the annual rental revenue of our consolidated properties and our share of annual rental revenue for our unconsolidated real estate joint ventures. Refer to footnote 1 for additional details. Excluding the ground lease, the weighted-average remaining lease term for our top 20 tenants was 8.5 years as of June 30, 2020.
(4)Located at properties acquired during the three months ended December 31, 2019.
| | | | | |
| |
| Summary of Properties and Occupancy | |
| June 30, 2020 | |
| (Dollars in thousands, except per RSF amounts) | |
| |
Summary of properties
| | | | | | | | | | | | | | | | | | | | | | | | | | | | | | | | | | | | | | | | | | | | | | | | | | | | | | | | | | | |
| Market | | RSF | | | | | | | | | | Number of Properties | | Annual Rental Revenue | | | | | |
| | Operating | | Development | | Redevelopment | | Total | | % of Total | | | | Total | | % of Total | | Per RSF | |
| Greater Boston | | 7,591,334 | | | — | | | 205,690 | | | 7,797,024 | | | 25 | % | | 66 | | | $ | 475,672 | | | 35 | % | | $ | 63.82 | | |
| San Francisco | | 7,732,722 | | | 841,178 | | | 347,912 | | | 8,921,812 | | | 29 | | | 62 | | | 370,512 | | | 28 | | | 57.88 | | |
| New York City | | 1,127,580 | | | — | | | 140,098 | | | 1,267,678 | | | 4 | | | 5 | | | 77,766 | | | 6 | | | 71.91 | | |
| San Diego | | 5,990,151 | | | 199,621 | | | 63,774 | | | 6,253,546 | | | 20 | | | 77 | | | 216,032 | | | 16 | | | 39.31 | | |
| Seattle | | 1,538,465 | | | 100,086 | | | — | | | 1,638,551 | | | 5 | | | 17 | | | 77,640 | | | 6 | | | 53.07 | | |
| Maryland | | 2,799,682 | | | 261,096 | | | 20,998 | | | 3,081,776 | | | 10 | | | 43 | | | 76,413 | | | 6 | | | 29.35 | | |
| Research Triangle | | 1,224,904 | | | 160,000 | | | — | | | 1,384,904 | | | 4 | | | 17 | | | 33,186 | | | 2 | | | 28.00 | | |
| Canada | | 256,967 | | | — | | | — | | | 256,967 | | | 1 | | | 3 | | | 5,717 | | | — | | | 24.72 | | |
| Non-cluster markets | | 354,879 | | | — | | | — | | | 354,879 | | | 1 | | | 11 | | | 9,508 | | | 1 | | | 37.83 | | |
| Properties held for sale | | 184,621 | | | — | | | — | | | 184,621 | | | 1 | | | 3 | | | 942 | | | — | | | N/A | |
| North America | | 28,801,305 | | | 1,561,981 | | | 778,472 | | | 31,141,758 | | | 100 | % | | 304 | | | $ | 1,343,388 | | | 100 | % | | $ | 51.30 | | |
| | | | 2,340,453 | | | | | | | | | | | | | | | |
Summary of occupancy
| | | | | | | | | | | | | | | | | | | | | | | | | | | | | | | | | | | | | | |
| | | Operating Properties | | | | | | Operating and Redevelopment Properties | | | | |
| Market | | 6/30/20 | | 3/31/20 | | 6/30/19 | | 6/30/20 | | 3/31/20 | | 6/30/19 |
| Greater Boston | | 98.2 | % | | 98.9 | % | | 98.7 | % | | 95.6 | % | | 97.0 | % | | 98.4 | % |
| San Francisco | | 94.7 | | (1) | 94.7 | | | 98.7 | | | 90.6 | | | 90.6 | | | 98.7 | |
| New York City | | 97.1 | | (2) | 99.2 | | | 98.8 | | | 86.2 | | | 88.1 | | | 87.8 | |
| San Diego | | 91.8 | | (1) | 90.9 | | | 95.2 | | | 90.8 | | | 90.9 | | | 95.2 | |
| Seattle | | 95.1 | | (3) | 97.8 | | | 97.3 | | | 95.1 | | | 97.8 | | | 97.3 | |
| Maryland | | 93.9 | | | 95.9 | | | 96.7 | | | 93.2 | | | 94.6 | | | 95.1 | |
| Research Triangle | | 96.8 | | | 96.5 | | | 97.9 | | | 96.8 | | | 96.5 | | | 94.2 | |
| Subtotal | | 95.1 | | | 95.6 | | | 97.6 | | | 92.6 | | | 93.3 | | | 96.6 | |
| Canada | | 90.0 | | | 93.6 | | | 93.7 | | | 90.0 | | | 93.6 | | | 93.7 | |
| Non-cluster markets | | 70.8 | | | 65.2 | | | 84.9 | | | 70.8 | | | 65.2 | | | 84.9 | |
| North America | | 94.8 | % | (1) | 95.1 | % | | 97.4 | % | | 92.3 | % | | 92.9 | % | | 96.4 | % |
| | | | | | | | | | | | |
(1)Refer to “Occupancy” in this Supplemental Information for additional details.
(2)The decrease in occupancy for the New York City market from March 31, 2020, was primarily related to one lease for 19,647 RSF that ended during the three months ended June 30, 2020. This space has been 100% re-leased to a new tenant with expected delivery by the end of 2020.
(3)The decrease in occupancy for the Seattle market from March 31, 2020, was related to recently acquired properties containing 31,518 RSF of vacant space.
Refer to “Definitions and reconciliations” in this Supplemental Information for additional details.
| | | | | |
| |
| Property Listing | |
| June 30, 2020 | |
| (Dollars in thousands) | |
| |
| | | | | | | | | | | | | | | | | | | | | | | | | | | | | | | | | | | | | | | | | | | | | | | | | | | | | | | | | | | | | | | | | | | | |
Market / Submarket / Address | | | | RSF | | | | | | | | | Number of Properties | | Annual Rental Revenue | | | Occupancy Percentage | | | | |
| | | | | | | | | | | | | | | | | | | | | | |
| | | | | | | | | | | | | | | | | | Operating | | | Operating and Redevelopment | |
| | | | Operating | | | Development | | Redevelopment | | Total | | | | | | | | | | | |
| | | | | | | | | | | | | | | | | | | | | | |
| Greater Boston | | | | | | | | | | | | | | | | | | | | | | |
| Cambridge/Inner Suburbs | | | | | | | | | | | | | | | | | | | | | |
| | Alexandria Center® at Kendall Square | | 2,365,487 | | | | — | | | — | | | 2,365,487 | | | 10 | | $ | 168,990 | | | | 98.9 | % | | | 98.9 | % | |
| | 50, 60, 75/125(1), 100, and 225(1) Binney Street, 161 and 215 First Street, 150 Second Street, 300 Third Street, and 11 Hurley Street | | | | | | | | | | | | | | | | | | | | |
| | Alexandria Technology Square® | | 1,181,635 | | | | — | | | — | | | 1,181,635 | | | 7 | | 101,118 | | | | 98.2 | | | | 98.2 | | |
| | 100, 200, 300, 400, 500, 600, and 700 Technology Square | | | | | | | | | | | | | | | | | | | | |
| | The Arsenal on the Charles | | 630,598 | | | | — | | | 205,690 | | | 836,288 | | | 11 | | 24,731 | | | | 100.0 | | | | 75.4 | | |
| | 311, 321, and 343 Arsenal Street, 300 and 400 North Beacon Street, 1, 2, and 3 Kingsbury Avenue, and 100, 200, and 400 Talcott Avenue | | | | | | | | | | | | | | | | | | | | |
| | Alexandria Center® at One Kendall Square | | 815,156 | | | | — | | | — | | | 815,156 | | | 10 | | 68,287 | | | | 97.1 | | | | 97.1 | | |
| | One Kendall Square – Buildings 100, 200, 300, 400, 500, 600/700, 1400, 1800, 2000, and 399 Binney Street | | | | | | | | | | | | | | | | | | | | |
| | 480 and 500 Arsenal Street | | 234,260 | | | | — | | | — | | | 234,260 | | | 2 | | 9,826 | | | | 88.1 | | | | 88.1 | | |
| | 640 Memorial Drive | | 225,504 | | | | — | | | — | | | 225,504 | | | 1 | | 13,815 | | | | 100.0 | | | | 100.0 | | |
| | 780 and 790 Memorial Drive | | 99,658 | | | | — | | | — | | | 99,658 | | | 2 | | 8,194 | | | | 100.0 | | | | 100.0 | | |
| | 167 Sidney Street and 99 Erie Street | | 54,549 | | | | — | | | — | | | 54,549 | | | 2 | | 4,025 | | | | 100.0 | | | | 100.0 | | |
| | 79/96 13th Street (Charlestown Navy Yard) | | 25,309 | | | | — | | | — | | | 25,309 | | | 1 | | 620 | | | | 100.0 | | | | 100.0 | | |
| | Cambridge/Inner Suburbs | | 5,632,156 | | | | — | | | 205,690 | | | 5,837,846 | | | 46 | | 399,606 | | | | 98.3 | | | | 94.8 | | |
| Seaport Innovation District | | | | | | | | | | | | | | | | | | | | | |
| | 5 Necco Street | | 87,163 | | | | — | | | — | | | 87,163 | | | 1 | | 4,672 | | | | 86.6 | | | | 86.6 | | |
| Route 128 | | | | | | | | | | | | | | | | | | | | | |
| | 275 Grove Street | | 509,702 | | | | — | | | — | | | 509,702 | | | 1 | | 25,280 | | | | 99.2 | | | | 99.2 | | |
| | Alexandria Park at 128 | | 343,882 | | | | — | | | — | | | 343,882 | | | 8 | | 12,228 | | | | 100.0 | | | | 100.0 | | |
| | 3 and 6/8 Preston Court, 29, 35, and 44 Hartwell Avenue, 35 and 45/47 Wiggins Avenue, and 60 Westview Street | | | | | | | | | | | | | | | | | | | | |
| | 225, 266, and 275 Second Avenue | | 317,617 | | | | — | | | — | | | 317,617 | | | 3 | | 13,932 | | | | 100.0 | | | | 100.0 | | |
| | 100 Tech Drive | | 200,431 | | | | — | | | — | | | 200,431 | | | 1 | | 8,455 | | | | 100.0 | | | | 100.0 | | |
| | 19 Presidential Way | | 144,892 | | | | — | | | — | | | 144,892 | | | 1 | | 4,773 | | | | 94.2 | | | | 94.2 | | |
| | 100 Beaver Street | | 82,330 | | | | — | | | — | | | 82,330 | | | 1 | | 3,165 | | | | 80.0 | | | | 80.0 | | |
| | 285 Bear Hill Road | | 26,270 | | | | — | | | — | | | 26,270 | | | 1 | | 1,167 | | | | 100.0 | | | | 100.0 | | |
| | Route 128 | | 1,625,124 | | | | — | | | — | | | 1,625,124 | | | 16 | | 69,000 | | | | 98.2 | | | | 98.2 | | |
| Route 495 | | | | | | | | | | | | | | | | | | | | | |
| | 111 and 130 Forbes Boulevard | | 155,846 | | | | — | | | — | | | 155,846 | | | 2 | | 1,745 | | | | 100.0 | | | | 100.0 | | |
| | 20 Walkup Drive | | 91,045 | | | | — | | | — | | | 91,045 | | | 1 | | 649 | | | | 100.0 | | | | 100.0 | | |
| | Route 495 | | 246,891 | | | | — | | | — | | | 246,891 | | | 3 | | 2,394 | | | | 100.0 | | | | 100.0 | | |
| | Greater Boston | | 7,591,334 | | | | — | | | 205,690 | | | 7,797,024 | | | 66 | | $ | 475,672 | | | | 98.2 | % | | | 95.6 | % | |
| | | | | | | | | | | | | | | | | | | | | | |
| | (1)We own a partial interest in this property through a real estate joint venture. Refer to “Joint venture financial information” of this Supplemental Information for additional details. | | | | | | | | | | | | | | | | | | | | |
| | | | | |
| |
| Property Listing (continued) | |
| June 30, 2020 | |
| (Dollars in thousands) | |
| |
| | | | | | | | | | | | | | | | | | | | | | | | | | | | | | | | | | | | | | | | | | | | | | | | | | | | | | | | | | | | | | | | | | | | |
Market / Submarket / Address | | | | RSF | | | | | | | | | Number of Properties | | Annual Rental Revenue | | | Occupancy Percentage | | | | |
| | | | | | | | | | | | | | | | | | | | | | |
| | | | | | | | | | | | | | | | | | Operating | | | Operating and Redevelopment | |
| | | | Operating | | | Development | | Redevelopment | | Total | | | | | | | | | | | |
| | | | | | | | | | | | | | | | | | | | | | |
| San Francisco | | | | | | | | | | | | | | | | | | | | | | |
| Mission Bay/SoMa | | | | | | | | | | | | | | | | | | | | | |
| | Alexandria Center® for Science and Technology – Mission Bay | | 1,990,262 | | | | — | | | — | | | 1,990,262 | | | 9 | | $ | 88,305 | | | | 100.0 | % | | | 100.0 | % | |
| | 1455, 1515, 1655(1), and 1725(1) Third Street, 409 and 499 Illinois Street(1), 1500(1) and 1700 Owens Street, and 455 Mission Bay Boulevard South | | | | | | | | | | | | | | | | | | | | |
| | 510 Townsend Street | | 295,333 | | | | — | | | — | | | 295,333 | | | 1 | | 17,736 | | | | 100.0 | | | | 100.0 | | |
| | 945 Market Street | | — | | | | — | | | 255,765 | | | 255,765 | | | 1 | | — | | | | N/A | | | — | | |
| | 505 Brannan Street | | 148,146 | | | | — | | | — | | | 148,146 | | | 1 | | 12,129 | | | | 100.0 | | | | 100.0 | | |
| | 260 Townsend Street | | 66,682 | | | | — | | | — | | | 66,682 | | | 1 | | 4,271 | | | | 73.4 | | | | 73.4 | | |
| | Mission Bay/SoMa | | 2,500,423 | | | | — | | | 255,765 | | | 2,756,188 | | | 13 | | 122,441 | | | | 99.3 | | | | 90.1 | | |
| South San Francisco | | | | | | | | | | | | | | | | | | | | | |
| | Alexandria Technology Center® – Gateway | | 1,412,480 | | | | — | | | — | | | 1,412,480 | | | 11 | | 56,292 | | | | 79.2 | | | | 79.2 | | |
| | 600, 601(1), 611(1), 630, 650, 651(1), 681(1), 685(1), 701(1), 901, and 951 Gateway Boulevard | | | | | | | | | | | | | | | | | | | | |
| | 213, 249, 259, 269, and 279 East Grand Avenue | | 919,704 | | | | — | | | — | | | 919,704 | | | 5 | | 48,744 | | | | 100.0 | | | | 100.0 | | |
| | 201 Haskins Way | | — | | | | 315,000 | | | — | | | 315,000 | | | 1 | | — | | | | N/A | | | N/A | |
| | 400 and 450 East Jamie Court | | 163,035 | | | | — | | | — | | | 163,035 | | | 2 | | 9,436 | | | | 100.0 | | | | 100.0 | | |
| | 500 Forbes Boulevard(1) | | 155,685 | | | | — | | | — | | | 155,685 | | | 1 | | 6,619 | | | | 100.0 | | | | 100.0 | | |
| | 7000 Shoreline Court | | 136,395 | | | | — | | | — | | | 136,395 | | | 1 | | 5,420 | | | | 62.8 | | | | 62.8 | | |
| | 341 and 343 Oyster Point Boulevard | | 107,960 | | | | — | | | — | | | 107,960 | | | 2 | | 5,767 | | | | 100.0 | | | | 100.0 | | |
| | 849/863 Mitten Road/866 Malcolm Road | | 103,857 | | | | — | | | — | | | 103,857 | | | 1 | | 5,076 | | | | 100.0 | | | | 100.0 | | |
| | South San Francisco | | 2,999,116 | | | | 315,000 | | | — | | | 3,314,116 | | | 24 | | 137,354 | | | | 88.5 | | | | 88.5 | | |
| Greater Stanford | | | | | | | | | | | | | | | | | | | | | |
| | Menlo Gateway(1) | | 772,983 | | | | — | | | — | | | 772,983 | | | 3 | | 29,842 | | | | 100.0 | | | | 100.0 | | |
| | 100 Independence Drive and 125 and 135 Constitution Drive | | | | | | | | | | | | | | | | | | | | |
| | Alexandria District for Science and Technology | | 136,738 | | | | 526,178 | | | — | | | 662,916 | | | 5 | | 4,091 | | | | 100.0 | | | | 100.0 | | |
| | 825, 835, and 960 Industrial Road and 987 and 1075 Commercial Street | | | | | | | | | | | | | | | | | | | | |
| | 3825 and 3875 Fabian Way | | 478,000 | | | | — | | | — | | | 478,000 | | | 2 | | 21,577 | | | | 100.0 | | | | 100.0 | | |
| | Alexandria Stanford Life Science District | | 190,270 | | | | — | | | 92,147 | | | 282,417 | | | 3 | | 13,902 | | | | 100.0 | | | | 67.4 | | |
| | 3160, 3165, and 3170 Porter Drive | | | | | | | | | | | | | | | | | | | | |
| | Alexandria PARC | | 197,498 | | | | — | | | — | | | 197,498 | | | 4 | | 10,169 | | | | 87.7 | | | | 87.7 | | |
| | 2100, 2200, 2300, and 2400 Geng Road | | | | | | | | | | | | | | | | | | | | |
| | 3330 and 3412 Hillview Avenue | | 106,316 | | | | — | | | — | | | 106,316 | | | 2 | | 9,387 | | | | 100.0 | | | | 100.0 | | |
| | 2425 Garcia Avenue/2400/2450 Bayshore Parkway | | 99,208 | | | | — | | | — | | | 99,208 | | | 1 | | 4,257 | | | | 100.0 | | | | 100.0 | | |
| | Shoreway Science Center | | 82,462 | | | | — | | | — | | | 82,462 | | | 2 | | 5,472 | | | | 100.0 | | | | 100.0 | | |
| | 75 and 125 Shoreway Road | | | | | | | | | | | | | | | | | | | | |
| | 1450 Page Mill Road | | 77,634 | | | | — | | | — | | | 77,634 | | | 1 | | 8,009 | | | | 100.0 | | | | 100.0 | | |
| | 3350 West Bayshore Road | | 60,000 | | | | — | | | — | | | 60,000 | | | 1 | | 2,191 | | | | 62.3 | | | | 62.3 | | |
| | 2625/2627/2631 Hanover Street | | 32,074 | | | | — | | | — | | | 32,074 | | | 1 | | 1,820 | | | | 100.0 | | | | 100.0 | | |
| | Greater Stanford | | 2,233,183 | | | | 526,178 | | | 92,147 | | | 2,851,508 | | | 25 | | 110,717 | | | | 97.9 | | | | 94.0 | | |
| | San Francisco | | 7,732,722 | | | | 841,178 | | | 347,912 | | | 8,921,812 | | | 62 | | $ | 370,512 | | | | 94.7 | % | | | 90.6 | % | |
| | (1)We own a partial interest in this property through a real estate joint venture. Refer to “Joint venture financial information” of this Supplemental Information for additional details. | | | | | | | | | | | | | | | | | | | | |
| | | | | |
| |
| Property Listing (continued) | |
| June 30, 2020 | |
| (Dollars in thousands) | |
| |
| | | | | | | | | | | | | | | | | | | | | | | | | | | | | | | | | | | | | | | | | | | | | | | | | | | | | | | | | | | | | | | | | | | | |
Market / Submarket / Address | | | | RSF | | | | | | | | | Number of Properties | | Annual Rental Revenue | | | Occupancy Percentage | | | | |
| | | | | | | | | | | | | | | | | | | | | | |
| | | | | | | | | | | | | | | | | | Operating | | | Operating and Redevelopment | |
| | | | Operating | | | Development | | Redevelopment | | Total | | | | | | | | | | | |
| | | | | | | | | | | | | | | | | | | | | | |
| New York City | | | | | | | | | | | | | | | | | | | | | | |
| New York City | | | | | | | | | | | | | | | | | | | | | |
| | Alexandria Center® for Life Science – New York City | | 740,972 | | | | — | | | — | | | 740,972 | | | 3 | | $ | 62,743 | | | | 95.5 | % | | | 95.5 | % | |
| | 430 and 450 East 29th Street | | | | | | | | | | | | | | | | | | | | |
| | 219 East 42nd Street | | 349,947 | | | | — | | | — | | | 349,947 | | | 1 | | 14,006 | | | | 100.0 | | | | 100.0 | | |
| | Alexandria Center® – Long Island City | | 36,661 | | | | — | | | 140,098 | | | 176,759 | | | 1 | | 1,017 | | | | 100.0 | | | | 20.7 | | |
| | 30-02 48th Avenue | | | | | | | | | | | | | | | | | | | | |
| | New York City | | 1,127,580 | | | | — | | | 140,098 | | | 1,267,678 | | | 5 | | 77,766 | | | | 97.1 | | | | 86.2 | | |
| | | | | | | | | | | | | | | | | | | | | | |
| San Diego | | | | | | | | | | | | | | | | | | | | | | |
| Torrey Pines | | | | | | | | | | | | | | | | | | | | | |
| | ARE Spectrum | | 336,461 | | | | — | | | — | | | 336,461 | | | 3 | | 17,422 | | | | 100.0 | | | | 100.0 | | |
| | 3215 Merryfield Row and 3013 and 3033 Science Park Road | | | | | | | | | | | | | | | | | | | | |
| | ARE Torrey Ridge | | 294,326 | | | | — | | | — | | | 294,326 | | | 3 | | 12,439 | | | | 87.8 | | | | 87.8 | | |
| | 10578, 10618, and 10628 Science Center Drive | | | | | | | | | | | | | | | | | | | | |
| | ARE Sunrise | | 236,635 | | | | — | | | — | | | 236,635 | | | 3 | | 8,291 | | | | 99.7 | | | | 99.7 | | |
| | 10931/10933 and 10975 North Torrey Pines Road, 3010 Science Park Road, and 10996 Torreyana Road | | | | | | | | | | | | | | | | | | | | |
| | ARE Nautilus | | 220,651 | | | | — | | | — | | | 220,651 | | | 4 | | 10,613 | | | | 100.0 | | | | 100.0 | | |
| | 3530 and 3550 John Hopkins Court and 3535 and 3565 General Atomics Court | | | | | | | | | | | | | | | | | | | | |
| | 3545 Cray Court | | 116,556 | | | | — | | | — | | | 116,556 | | | 1 | | — | | | | — | | | | — | | |
| | 11119 North Torrey Pines Road | | 72,506 | | | | — | | | — | | | 72,506 | | | 1 | | 3,676 | | | | 100.0 | | | | 100.0 | | |
| | Torrey Pines | | 1,277,135 | | | | — | | | — | | | 1,277,135 | | | 15 | | 52,441 | | | | 88.0 | | | | 88.0 | | |
| University Town Center | | | | | | | | | | | | | | | | | | | | | |
| | Campus Pointe by Alexandria(1) | | 1,419,772 | | | | 199,621 | | | — | | | 1,619,393 | | | 10 | | 59,653 | | | | 99.9 | | | | 99.9 | | |
| | 9880(2), 10210, 10260, 10290, and 10300 Campus Point Drive and 4110, 4150, 4161, 4224, and 4242 Campus Point Court | | | | | | | | | | | | | | | | | | | | |
| | 5200 Illumina Way(1) | | 792,687 | | | | — | | | — | | | 792,687 | | | 6 | | 29,977 | | | | 100.0 | | | | 100.0 | | |
| | University District | | 520,168 | | | | — | | | — | | | 520,168 | | | 8 | | 19,361 | | | | 100.0 | | | | 100.0 | | |
| | 9363, 9393, and 9625(1) Towne Centre Drive, 4755, 4757, and 4767 Nexus Center Drive and 4555 and 4796 Executive Drive | | | | | | | | | | | | | | | | | | | | |
| | University Town Center | | 2,732,627 | | | | 199,621 | | | — | | | 2,932,248 | | | 24 | | $ | 108,991 | | | | 99.9 | % | | | 99.9 | % | |
| |
(1)We own a partial interest in this property through a real estate joint venture. Refer to “Joint venture financial information” of this Supplemental Information for additional details. (2) We own 100% of this property. | | | | | | | | | | | | | | | | | | | | |
| | | | | |
| |
| Property Listing (continued) | |
| June 30, 2020 | |
| (Dollars in thousands) | |
| |
| | | | | | | | | | | | | | | | | | | | | | | | | | | | | | | | | | | | | | | | | | | | | | | | | | | | | | | | | | | | | | | | | | | | |
Market / Submarket / Address | | | | RSF | | | | | | | | | Number of Properties | | Annual Rental Revenue | | | Occupancy Percentage | | | | |
| | | | | | | | | | | | | | | | | | | | | | |
| | | | | | | | | | | | | | | | | | Operating | | | Operating and Redevelopment | |
| | | | Operating | | | Development | | Redevelopment | | Total | | | | | | | | | | | |
| | | | | | | | | | | | | | | | | | | | | | |
| San Diego (continued) | | | | | | | | | | | | | | | | | | | | | | |
| Sorrento Mesa | | | | | | | | | | | | | | | | | | | | | |
| | SD Tech by Alexandria(1) | | 854,463 | | | | — | | | — | | | 854,463 | | | 11 | | $ | 21,375 | | | | 67.3 | % | | | 67.3 | % | |
| | 9605, 9645, 9675, 9685, 9725, 9735, 9805, 9808, 9855, and 9868 Scranton Road and 5505 Morehouse Drive(2) | | | | | | | | | | | | | | | | | | | | |
| | Summers Ridge Science Park | | 316,531 | | | | — | | | — | | | 316,531 | | | 4 | | 11,077 | | | | 100.0 | | | | 100.0 | | |
| | 9965, 9975, 9985, and 9995 Summers Ridge Road | | | | | | | | | | | | | | | | | | | | |
| | 10121 and 10151 Barnes Canyon Road | | 102,392 | | | | — | | | — | | | 102,392 | | | 2 | | 2,689 | | | | 100.0 | | | | 100.0 | | |
| | ARE Portola | | 101,857 | | | | — | | | — | | | 101,857 | | | 3 | | 3,603 | | | | 100.0 | | | | 100.0 | | |
| | 6175, 6225, and 6275 Nancy Ridge Drive | | | | | | | | | | | | | | | | | | | | |
| | 5810/5820 Nancy Ridge Drive | | 82,272 | | | | — | | | — | | | 82,272 | | | 1 | | 2,532 | | | | 100.0 | | | | 100.0 | | |
| | 7330 Carroll Road | | 66,244 | | | | — | | | — | | | 66,244 | | | 1 | | 2,431 | | | | 100.0 | | | | 100.0 | | |
| | 9877 Waples Street | | — | | | | — | | | 63,774 | | | 63,774 | | | 1 | | — | | | | N/A | | | — | | |
| | 5871 Oberlin Drive | | 33,817 | | | | — | | | — | | | 33,817 | | | 1 | | — | | | | — | | | | — | | |
| | Sorrento Mesa | | 1,557,576 | | | | — | | | 63,774 | | | 1,621,350 | | | 24 | | 43,707 | | | | 79.9 | | | | 76.8 | | |
| Sorrento Valley | | | | | | | | | | | | | | | | | | | | | |
| | 3911, 3931, 3985, 4025, 4031, 4045, and 4075 Sorrento Valley Boulevard | | 191,378 | | | | — | | | — | | | 191,378 | | | 7 | | 5,215 | | | | 88.1 | | | | 88.1 | | |
| | 11025, 11035, 11045, 11055, 11065, and 11075 Roselle Street | | 121,655 | | | | — | | | — | | | 121,655 | | | 6 | | 2,706 | | | | 97.1 | | | | 97.1 | | |
| | Sorrento Valley | | 313,033 | | | | — | | | — | | | 313,033 | | | 13 | | 7,921 | | | | 91.6 | | | | 91.6 | | |
| I-15 Corridor | | | | | | | | | | | | | | | | | | | | | |
| | 13112 Evening Creek Drive | | 109,780 | | | | — | | | — | | | 109,780 | | | 1 | | 2,972 | | | | 100.0 | | | | 100.0 | | |
| | San Diego | | 5,990,151 | | | | 199,621 | | | 63,774 | | | 6,253,546 | | | 77 | | 216,032 | | | | 91.8 | | | | 90.8 | | |
| | | | | | | | | | | | | | | | | | | | | | |
| Seattle | | | | | | | | | | | | | | | | | | | | | | |
| Lake Union | | | | | | | | | | | | | | | | | | | | | |
| | The Eastlake Life Science Campus by Alexandria – North Campus | | 631,070 | | | | — | | | — | | | 631,070 | | | 5 | | 35,479 | | | | 100.0 | | | | 100.0 | | |
| | 1616 and 1551 Eastlake Avenue East, 188 and 199 East Blaine Street, and 1600 Fairview Avenue East | | | | | | | | | | | | | | | | | | | | |
| | The Eastlake Life Science Campus by Alexandria – South Campus | | 206,134 | | | | 100,086 | | | — | | | 306,220 | | | 3 | | 11,626 | | | | 100.0 | | | | 100.0 | | |
| | 1165, 1201, and 1208 Eastlake Avenue East | | | | | | | | | | | | | | | | | | | | |
| | 400 Dexter Avenue North | | 290,111 | | | | — | | | — | | | 290,111 | | | 1 | | 15,158 | | | | 100.0 | | | | 100.0 | | |
| | 2301 5th Avenue | | 197,135 | | | | — | | | — | | | 197,135 | | | 1 | | 9,717 | | | | 99.1 | | | | 99.1 | | |
| | 219 Terry Avenue North | | 30,705 | | | | — | | | — | | | 30,705 | | | 1 | | 1,835 | | | | 100.0 | | | | 100.0 | | |
| | 601 Dexter Avenue North | | 18,680 | | | | — | | | — | | | 18,680 | | | 1 | | 425 | | | | 100.0 | | | | 100.0 | | |
| | Lake Union | | 1,373,835 | | | | 100,086 | | | — | | | 1,473,921 | | | 12 | | 74,240 | | | | 99.9 | | | | 99.9 | | |
| SoDo | | | | | | | | | | | | | | | | | | | | | |
| | 220 and 240 2nd Avenue South | | 80,160 | | | | — | | | — | | | 80,160 | | | 2 | | 1,329 | | | | 46.9 | | | | 46.9 | | |
| Elliott Bay | | | | | | | | | | | | | | | | | | | | | |
| | 3000/3018 Western Avenue | | 47,746 | | | | — | | | — | | | 47,746 | | | 1 | | 1,839 | | | | 100.0 | | | | 100.0 | | |
| | 410 West Harrison Street and 410 Elliott Avenue West | | 36,724 | | | | — | | | — | | | 36,724 | | | 2 | | 232 | | | | 14.7 | | | | 14.7 | | |
| | Elliott Bay | | 84,470 | | | | — | | | — | | | 84,470 | | | 3 | | 2,071 | | | | 62.9 | | | | 62.9 | | |
| | Seattle | | 1,538,465 | | | | 100,086 | | | — | | | 1,638,551 | | | 17 | | $ | 77,640 | | | | 95.1 | % | | | 95.1 | % | |
| |
(1)We own a partial interest in this property through a real estate joint venture. Refer to “Joint venture financial information” of this Supplemental Information for additional details. (2)We own 100% of this property. | | | | | | | | | | | | | | | | | | | | |
| | | | | |
| |
| Property Listing (continued) | |
| June 30, 2020 | |
| (Dollars in thousands) | |
| |
| | | | | | | | | | | | | | | | | | | | | | | | | | | | | | | | | | | | | | | | | | | | | | | | | | | | | | | | | | | | | | | | | | | | |
Market / Submarket / Address | | | | RSF | | | | | | | | | Number of Properties | | Annual Rental Revenue | | | Occupancy Percentage | | | | |
| | | | | | | | | | | | | | | | | | | | | | |
| | | | | | | | | | | | | | | | | | Operating | | | Operating and Redevelopment | |
| | | | Operating | | | Development | | Redevelopment | | Total | | | | | | | | | | | |
| | | | | | | | | | | | | | | | | | | | | | |
| Maryland | | | | | | | | | | | | | | | | | | | | | | |
| Rockville | | | | | | | | | | | | | | | | | | | | | |
| | 9800, 9804, 9900, 9920, and 9950 Medical Center Drive | | 383,956 | | | | 261,096 | | | — | | | 645,052 | | | 8 | | $ | 14,065 | | | | 89.5 | % | | | 89.5 | % | |
| | 9704, 9708, 9712, and 9714 Medical Center Drive | | 214,725 | | | | — | | | — | | | 214,725 | | | 4 | | 7,862 | | | | 100.0 | | | | 100.0 | | |
| | 1330 Piccard Drive | | 131,511 | | | | — | | | — | | | 131,511 | | | 1 | | 3,719 | | | | 100.0 | | | | 100.0 | | |
| | 9605 Medical Center Drive | | 115,691 | | | | — | | | — | | | 115,691 | | | 1 | | 3,163 | | | | 85.8 | | | | 85.8 | | |
| | 1500 and 1550 East Gude Drive | | 90,489 | | | | — | | | — | | | 90,489 | | | 2 | | 620 | | | | 28.1 | | | | 28.1 | | |
| | 14920 and 15010 Broschart Road | | 86,703 | | | | — | | | — | | | 86,703 | | | 2 | | 2,283 | | | | 100.0 | | | | 100.0 | | |
| | 1405 Research Boulevard | | 72,170 | | | | — | | | — | | | 72,170 | | | 1 | | 2,423 | | | | 100.0 | | | | 100.0 | | |
| | 5 Research Place | | 63,852 | | | | — | | | — | | | 63,852 | | | 1 | | 2,743 | | | | 100.0 | | | | 100.0 | | |
| | 5 Research Court | | 51,520 | | | | — | | | — | | | 51,520 | | | 1 | | 1,788 | | | | 100.0 | | | | 100.0 | | |
| | 9920 Belward Campus Drive | | 51,181 | | | | — | | | — | | | 51,181 | | | 1 | | 1,687 | | | | 100.0 | | | | 100.0 | | |
| | 12301 Parklawn Drive | | 49,185 | | | | — | | | — | | | 49,185 | | | 1 | | 1,329 | | | | 100.0 | | | | 100.0 | | |
| | Rockville | | 1,310,983 | | | | 261,096 | | | — | | | 1,572,079 | | | 23 | | 41,682 | | | | 90.7 | | | | 90.7 | | |
| Gaithersburg | | | | | | | | | | | | | | | | | | | | | |
| | Alexandria Technology Center® – Gaithersburg I | | 613,438 | | | | — | | | — | | | 613,438 | | | 9 | | 15,485 | | | | 93.8 | | | | 93.8 | | |
| | 9, 25, 35, 45, 50, and 55 West Watkins Mill Road and 910, 930, and 940 Clopper Road | | | | | | | | | | | | | | | | | | | | |
| | Alexandria Technology Center® – Gaithersburg II | | 294,087 | | | | — | | | 20,998 | | | 315,085 | | | 6 | | 7,702 | | | | 99.2 | | | | 92.6 | | |
| | 704 Quince Orchard Road(1), 708 Quince Orchard Road, and 19, 20, 21, and 22 Firstfield Road | | | | | | | | | | | | | | | | | | | | |
| | 401 Professional Drive | | 63,154 | | | | — | | | — | | | 63,154 | | | 1 | | 1,593 | | | | 91.0 | | | | 91.0 | | |
| | 950 Wind River Lane | | 50,000 | | | | — | | | — | | | 50,000 | | | 1 | | 1,004 | | | | 100.0 | | | | 100.0 | | |
| | 620 Professional Drive | | 27,950 | | | | — | | | — | | | 27,950 | | | 1 | | 1,191 | | | | 100.0 | | | | 100.0 | | |
| | Gaithersburg | | 1,048,629 | | | | — | | | 20,998 | | | 1,069,627 | | | 18 | | 26,975 | | | | 95.6 | | | | 93.8 | | |
| Beltsville | | | | | | | | | | | | | | | | | | | | | |
| | 8000/9000/10000 Virginia Manor Road | | 191,884 | | | | — | | | — | | | 191,884 | | | 1 | | 2,618 | | | | 98.4 | | | | 98.4 | | |
| Northern Virginia | | | | | | | | | | | | | | | | | | | | | |
| | 14225 Newbrook Drive | | 248,186 | | | | — | | | — | | | 248,186 | | | 1 | | 5,138 | | | | 100.0 | | | | 100.0 | | |
| | Maryland | | 2,799,682 | | | | 261,096 | | | 20,998 | | | 3,081,776 | | | 43 | | $ | 76,413 | | | | 93.9 | % | | | 93.2 | % | |
| | (1)We own a partial interest in this property through a real estate joint venture. Refer to “Joint venture financial information” of this Supplemental Information for additional details. | | | | | | | | | | | | | | | | | | | | |
| | | | | |
| |
| Property Listing (continued) | |
| June 30, 2020 | |
| (Dollars in thousands) | |
| |
| | | | | | | | | | | | | | | | | | | | | | | | | | | | | | | | | | | | | | | | | | | | | | | | | | | | | | | | | | | | | | | | | | | | |
Market / Submarket / Address | | | | RSF | | | | | | | | | Number of Properties | | Annual Rental Revenue | | | Occupancy Percentage | | | | |
| | | | | | | | | | | | | | | | | | | | | | |
| | | | | | | | | | | | | | | | | | Operating | | | Operating and Redevelopment | |
| | | | Operating | | | Development | | Redevelopment | | Total | | | | | | | | | | | |
| | | | | | | | | | | | | | | | | | | | | | |
| Research Triangle | | | | | | | | | | | | | | | | | | | | | | |
| Research Triangle | | | | | | | | | | | | | | | | | | | | | |
| | Alexandria Center® for AgTech, Phase I – Research Triangle | | 180,400 | | | | 160,000 | | | — | | | 340,400 | | | 2 | | $ | 5,491 | | | | 95.2 | % | | | 95.2 | % | |
| | 5 Laboratory Drive | | | | | | | | | | | | | | | | | | | | |
| | Alexandria Technology Center® – Alston | | 186,870 | | | | — | | | — | | | 186,870 | | | 3 | | 3,850 | | | | 93.7 | | | | 93.7 | | |
| | 100, 800, and 801 Capitola Drive | | | | | | | | | | | | | | | | | | | | |
| | 108/110/112/114 TW Alexander Drive | | 158,417 | | | | — | | | — | | | 158,417 | | | 1 | | 4,681 | | | | 100.0 | | | | 100.0 | | |
| | Alexandria Innovation Center® – Research Triangle | | 136,455 | | | | — | | | — | | | 136,455 | | | 3 | | 4,010 | | | | 98.0 | | | | 98.0 | | |
| | 7010, 7020, and 7030 Kit Creek Road | | | | | | | | | | | | | | | | | | | | |
| | 6 Davis Drive | | 100,000 | | | | — | | | — | | | 100,000 | | | 1 | | 2,126 | | | | 98.4 | | | | 98.4 | | |
| | 7 Triangle Drive | | 96,626 | | | | — | | | — | | | 96,626 | | | 1 | | 3,156 | | | | 100.0 | | | | 100.0 | | |
| | 2525 East NC Highway 54 | | 82,996 | | | | — | | | — | | | 82,996 | | | 1 | | 3,651 | | | | 100.0 | | | | 100.0 | | |
| | 407 Davis Drive | | 81,956 | | | | — | | | — | | | 81,956 | | | 1 | | 1,644 | | | | 100.0 | | | | 100.0 | | |
| | 601 Keystone Park Drive | | 77,395 | | | | — | | | — | | | 77,395 | | | 1 | | 1,410 | | | | 100.0 | | | | 100.0 | | |
| | 6040 George Watts Hill Drive | | 61,547 | | | | — | | | — | | | 61,547 | | | 1 | | 2,148 | | | | 100.0 | | | | 100.0 | | |
| | 5 Triangle Drive | | 32,120 | | | | — | | | — | | | 32,120 | | | 1 | | 479 | | | | 54.2 | | | | 54.2 | | |
| | 6101 Quadrangle Drive | | 30,122 | | | | — | | | — | | | 30,122 | | | 1 | | 540 | | | | 100.0 | | | | 100.0 | | |
| | Research Triangle | | 1,224,904 | | | | 160,000 | | | — | | | 1,384,904 | | | 17 | | 33,186 | | | | 96.8 | | | | 96.8 | | |
| | | | | | | | | | | | | | | | | | | | | | |
| Canada | | | | 256,967 | | | | — | | | — | | | 256,967 | | | 3 | | 5,717 | | | | 90.0 | | | | 90.0 | | |
| | | | | | | | | | | | | | | | | | | | | | |
| Non-cluster markets | | | | 354,879 | | | | — | | | — | | | 354,879 | | | 11 | | 9,508 | | | | 70.8 | | | | 70.8 | | |
| | | | | | | | | | | | | | | | | | | | | | |
| North America, excluding properties held for sale | | | | 28,616,684 | | | | 1,561,981 | | | 778,472 | | | 30,957,137 | | | 301 | | 1,342,446 | | | | 94.8 | % | | | 92.3 | % | |
| | | | | | | | | | | | | | | | | | | | | | |
| Properties held for sale | | | | 184,621 | | | | — | | | — | | | 184,621 | | | 3 | | 942 | | | | 20.3 | % | | | 20.3 | % | |
| | | | | | | | | | | | | | | | | | | | | | |
| Total – North America | | | | 28,801,305 | | | | 1,561,981 | | | 778,472 | | | 31,141,758 | | | 304 | | $ | 1,343,388 | | | | | | | | |
| | | | | | | | | | | | | | | | | | | | | | |
| | | | | | | | | | | | | | | | | | | | | | |
| | | | | |
| |
| Investments in Real Estate | |
| June 30, 2020 | |
| (Dollars in thousands) | |
| |
Our initial 2020 guidance issued on December 3, 2019, for our 2020 construction spending guidance ranges from $1.55 billion to $1.65 billion and reflected a strong outlook for 2020, including continued strong demand for our value-creation development and redevelopment projects.
Our guidance issued on April 27, 2020, reduced the midpoint our 2020 forecasted construction spend guidance from $1.6 billion to $960.0 million. A significant portion of our historical annual construction spend forecast included amounts related to future development projects with no aboveground vertical construction and not committed to a specific tenant. This reduction in our 2020 construction spend guidance was deemed necessary to focus primarily on projects that were partially or fully leased due to the dislocation of capital and other markets caused by COVID-19, including the overall macro and capital market environments.
To address the continuing tenant demand for our development and redevelopment pipeline and existing and anticipated attractive acquisition opportunities, we increased the midpoint our 2020 construction spending guidance range from $960.0 million to $1.35 billion, which is closer to our initial forecast for 2020.
As of July 27, 2020, construction activities were in process at all of our active construction projects with no further delays due to the temporary mandates issued by state or local ordinances arising from the COVID-19 pandemic. Construction workers continue to observe social distancing and follow rules that restrict gatherings of large groups of people in close proximity, as well as adhere to other appropriate measures that may slow the pace of construction.
Importantly, upon improvement of market conditions, we have the option, on a project-by-project basis, to address demand for our development and redevelopment projects.
| | | | | | | | | | | | | | | | | | | | | | | | | | | | | | | | | | | | | | | | | | | | |
| | | | Development and Redevelopment | | | | | | | | | | |
| | Operating | | Under Construction | | Near
Term | | Intermediate
Term | | Future | | Subtotal | | Total |
| Investments in real estate | | | | | | | | | | | | | | |
Book value as of June 30, 2020(1) | | $ | 16,283,753 | | | $ | 1,290,966 | | | $ | 539,568 | | | $ | 722,317 | | | $ | 382,015 | | | $ | 2,934,866 | | | $ | 19,218,619 | |
| | | | | | | | | | | | | | |
| Square footage | | | | | | | | | | | | | | |
| Operating | | 28,801,305 | | | — | | | — | | | — | | | — | | | — | | | 28,801,305 | |
| New Class A development and redevelopment properties | | — | | | 2,340,453 | | | 2,144,353 | | | 5,435,186 | | | 6,124,302 | | | 16,044,294 | | | 16,044,294 | |
Value-creation square feet currently included in rental properties(2) | | — | | | — | | | — | | | (975,060) | | | (846,550) | | | (1,821,610) | | | (1,821,610) | |
| Total square footage | | 28,801,305 | | | 2,340,453 | | | 2,144,353 | | | 4,460,126 | | | 5,277,752 | | | 14,222,684 | | | 43,023,989 | |
| | | | | | | | | | | | | | |
(1)Balances exclude our share of the cost basis associated with our unconsolidated properties, which is classified as investments in unconsolidated real estate joint ventures in our consolidated balance sheets.
(2)Refer to “Investments in real estate” in the “Definitions and reconciliations” of this Supplemental Information for additional details on value-creation square feet currently included in rental properties.
| | | | | |
| |
| New Class A Development and Redevelopment Properties: Current Projects | |
| |
| June 30, 2020 | |
| |
| | | | | | | | | | | | | | |
| The Arsenal on the Charles | | 945 Market Street | | 201 Haskins Way |
Greater Boston/
Cambridge/Inner Suburbs | | San Francisco/Mission Bay/SoMa | | San Francisco/South San Francisco |
| 205,690 RSF | | 255,765 RSF | | 315,000 RSF |
| | | | |
| | | | | | | | | | | | | | |
Alexandria District for
Science and Technology | | 3160 Porter Drive | | Alexandria Center® – Long Island City |
| San Francisco/Greater Stanford | | San Francisco/Greater Stanford | | New York City/New York City |
| 526,178 RSF | | 92,147 RSF | | 140,098 RSF |
| | | | |
| | | | | |
| |
| New Class A Development and Redevelopment Properties: Current Projects (continued) | |
| |
| June 30, 2020 | |
| |
| | | | | | | | | | | | | | |
9880 Campus Point Drive and
4150 Campus Point Court | | 9877 Waples Street | | 1165 Eastlake Avenue East |
| San Diego/University Town Center | | San Diego/Sorrento Mesa | | Seattle/Lake Union |
| 199,621 RSF | | 63,774 RSF | | 100,086 RSF |
| | | | |
| | | | | | | | | | | | | | |
| 9804 Medical Center Drive | | 9950 Medical Center Drive | | Alexandria Center® for AgTech |
| Maryland/Rockville | | Maryland/Rockville | | Research Triangle/Research Triangle |
| 176,832 RSF | | 84,264 RSF | | 160,000 RSF |
| | | | |
| | | | | |
| |
| New Class A Development and Redevelopment Properties: Current Projects (continued) | |
| |
| June 30, 2020 | |
| |
| | | | | | | | | | | | | | | | | | | | | | | | | | | | | | | | | | | | | | | | | | | | | | | | | | | | | | | | | | | | | |
| Property/Market/Submarket | | | | Square Footage | | | | | | Percentage | | | | | | | | | | | |
| | Dev/Redev | | In Service | | CIP | | Total | | Leased | | | Leased/Negotiating | | | | | Initial Occupancy(1) | | | |
| Developments and redevelopments under construction | | | | | | | | | | | | | | | | | | | | | |
| The Arsenal on the Charles/Greater Boston/Cambridge/Inner Suburbs | | Redev | | 630,598 | | (2) | 205,690 | | | 836,288 | | | 75 | % | | | 89 | % | | | | | | 2021 | | |
| 945 Market Street/San Francisco/Mission Bay/SoMa | | Redev | | — | | | 255,765 | | | 255,765 | | | — | | | | — | | | | | | | 2020 | (3) | |
| 201 Haskins Way/San Francisco/South San Francisco | | Dev | | — | | | 315,000 | | | 315,000 | | | 33 | | | | 33 | | | | | | 4Q20-1Q21 | | | |
| Alexandria District for Science and Technology/San Francisco/Greater Stanford | | Dev | | — | | | 526,178 | | | 526,178 | | | 59 | | | | 59 | | | | | | 4Q20-1Q21 | | | |
| 3160 Porter Drive/San Francisco/Greater Stanford | | Redev | | — | | | 92,147 | | | 92,147 | | | 20 | | | | 20 | | | | | | | 1H21 | | |
Alexandria Center® – Long Island City/New York City/New York City | | Redev | | 36,661 | | | 140,098 | | | 176,759 | | | 21 | | | | 28 | | | | | | 4Q20-1Q21 | | | |
9880 Campus Point Drive and 4150 Campus Point Court/San Diego/ University Town Center(4) | | Dev | | 69,481 | | | 199,621 | | | 269,102 | | | 89 | | | | 91 | | | | | | | 4Q19 | | |
| 9877 Waples Street/Sorrento Mesa/San Diego | | Redev | | — | | | 63,774 | | | 63,774 | | | 100 | | | | 100 | | | | | | | 2021 | | |
| 1165 Eastlake Avenue East/Seattle/Lake Union | | Dev | | — | | | 100,086 | | | 100,086 | | | 100 | | | | 100 | | | | | | 4Q20-1Q21 | | | |
| 9804 Medical Center Drive/Maryland/Rockville | | Dev | | — | | | 176,832 | | | 176,832 | | | 100 | | | | 100 | | | | | | | 2H20 | | |
| 9950 Medical Center Drive/Maryland/Rockville | | Dev | | — | | | 84,264 | | | 84,264 | | | 100 | | | | 100 | | | | | | | 2H20 | | |
704 Quince Orchard Road/Maryland/Gaithersburg(5) | | Redev | | 59,034 | | | 20,998 | | | 80,032 | | | 90 | | | | 90 | | | | | | | 4Q18 | | |
Alexandria Center® for AgTech/Research Triangle/Research Triangle(6) | | Dev | | 180,400 | | | 160,000 | | | 340,400 | | | 50 | | | | 50 | | | | | | | 2021 | | |
| Total | | | | 976,174 | | | 2,340,453 | | | 3,316,627 | | | 61 | % | | | 65 | % | | | | | | | | |
| | | | | | | | | | | | | | | | | | | | | |
(1)Initial occupancy dates are subject to leasing and/or market conditions. Construction disruptions resulting from COVID-19 and observance of social distancing measures may further impact construction and occupancy forecasts and will continue to be monitored closely. Multi-tenant projects may have occupancy by tenants over a period of time. Stabilized occupancy may vary depending on single tenancy versus multi-tenancy.
(2)We expect to redevelop an additional 154,855 RSF of an office space (acquired lease with space in operating RSF) into office/laboratory space upon expiration of the existing leases in the third quarter of 2020 and the first quarter of 2021.
(3)Various options are under evaluation for this property, including ongoing discussion with a company interested in this property. We expect to update the initial occupancy date later this year.
(4)Refer to footnote 2 on the next page.
(5)704 Quince Orchard Road is an unconsolidated real estate joint venture. RSF represents 100%.
(6)The new strategic collaborative agtech campus consists of Phase I at 5 Laboratory Drive, including campus amenities, and Phase II at 9 Laboratory Drive.
| | | | | |
| New Class A Development and Redevelopment Properties: Current Projects (continued) | |
| |
| June 30, 2020 | |
| (Dollars in thousands) | |
| |
| | | | | | | | | | | | | | | | | | | | | | | | | | | | | | | | | | | | | | | | | | | | | | | | | | | | | | | | | | | | | | |
| | Our Ownership Interest | | | | | | | | | | | | Unlevered Yields | | | | | | |
| Property/Market/Submarket | | | | | In Service | | CIP | | Cost to Complete | | Total at
Completion | | | Initial Stabilized | | | | Initial Stabilized (Cash Basis) | | |
| | | | | | | | | | | | | | | | | | | | |
| Developments and redevelopments under construction | | | | | | | | | | | | | | | | | | | | |
| The Arsenal on the Charles/Greater Boston/Cambridge/Inner Suburbs | | 100.0 | % | | | $ | 428,539 | | | $ | 109,107 | | | TBD | | | | | | | | | | | |
| 945 Market Street/San Francisco/Mission Bay/SoMa | | 99.5 | % | | | — | | | 197,330 | | | | | | | | | | | | | | |
| 201 Haskins Way/San Francisco/South San Francisco | | 100.0 | % | | | — | | | 211,100 | | | $ | 102,900 | | | $ | 314,000 | | | | | 6.6 | % | | | | 6.5 | % | |
| Alexandria District for Science and Technology/San Francisco/Greater Stanford | | 100.0 | % | | | — | | | 368,998 | | | $ | 220,002 | | | $ | 589,000 | | | | | 6.4 | % | | | | 6.1 | % | |
| 3160 Porter Drive/San Francisco/Greater Stanford | | 100.0 | % | | | — | | | 39,264 | | | TBD | | | | | | | | | | | |
Alexandria Center® – Long Island City/New York City/New York City | | 100.0 | % | | | 16,549 | | | 98,263 | | | $ | 69,488 | | | $ | 184,300 | | | | | 5.5 | % | | | | 5.6 | % | |
9880 Campus Point Drive and 4150 Campus Point Court/San Diego/ University Town Center(1) | | (1) | | | 78,429 | | | 58,269 | | | $ | 118,302 | | | $ | 255,000 | | | | | 6.3 | % | (2) | | | 6.4 | % | (2) |
| 9877 Waples Street/Sorrento Mesa/San Diego | | 100.0 | % | | | — | | | 17,064 | | | $ | 12,136 | | | $ | 29,200 | | | | | 8.6 | % | | | | 7.9 | % | |
| 1165 Eastlake Avenue East/Seattle/Lake Union | | 100.0 | % | | | — | | | 75,486 | | | $ | 62,514 | | | $ | 138,000 | | | | | 6.5 | % | (3) | | | 6.3 | % | (3) |
| 9804 Medical Center Drive/Maryland/Rockville | | 100.0 | % | | | — | | | 55,498 | | | $ | 39,902 | | | $ | 95,400 | | | | | 7.7 | % | | | | 7.2 | % | |
| 9950 Medical Center Drive/Maryland/Rockville | | 100.0 | % | | | — | | | 34,340 | | | $ | 19,960 | | | $ | 54,300 | | | | | 7.3 | % | | | | 6.8 | % | |
Alexandria Center® for AgTech/Research Triangle/Research Triangle | | 100.0 | % | | | 86,015 | | | 26,247 | | | TBD | | | | | | | | | | | |
| Consolidated projects | | | | | 609,532 | | | 1,290,966 | | | | | | | | | | | | | | |
704 Quince Orchard Road/Maryland/Gaithersburg(4) | | 56.8 | % | | | 8,599 | | | 2,825 | | | $ | 1,876 | | | $ | 13,300 | | | | | 8.9 | % | | | | 8.8 | % | |
| Total | | | | | $ | 618,131 | | | $ | 1,293,791 | | | | | | | | | | | | | | |
| | | | | | | | | | | | | | | | | | | | |
(1)Refer to “Joint venture financial information” in the “Definitions and reconciliations” of this Supplemental Information for additional details.
(2)Represents a two-phase development project as follows:
•Initial phase represents 9880 Campus Point Drive, a 98,000 RSF project to develop Alexandria GradLabs™, a highly flexible, first-of-its-kind life science platform designed to provide post-seed-stage life science companies with turnkey, fully furnished office/laboratory suites and an accelerated, scalable path for growth. As of June 30, 2020, 199,621 RSF and 69,481 RSF are classified in construction in process and in-service, respectively. The R&D building located at 9880 Campus Point Drive was demolished and as of June 30, 2020, continues to be included in our same property performance results. Refer to “Same property comparisons” in the “Definitions and reconciliations” of this Supplemental Information for additional details.
•Subsequent phase represents 4150 Campus Point Court, a 171,102 RSF, 100% leased project undergoing pre-construction, and we expect to commence vertical construction in 1Q21, with occupancy expected in 2022.
•Project costs represent development costs for 9880 Campus Point Drive and 4150 Campus Point Court. Unlevered yields represent expected aggregate returns for Campus Pointe by Alexandria, including 9880, 10290, and 10300 Campus Point Drive and 4150 Campus Point Court.
(3)Unlevered yields represent anticipated aggregate returns for 1165 Eastlake Avenue, an amenity-rich research headquarters for Adaptive Biotechnologies Corporation, and 1208 Eastlake Avenue, an adjacent multi-tenant office/laboratory building.
(4)704 Quince Orchard Road is an unconsolidated real estate joint venture. Cost and yield amounts represent our share.
| | | | | |
| |
| New Class A Development and Redevelopment Properties: Summary of Pipeline | |
| June 30, 2020 | |
| (Dollars in thousands) | |
| |
| | | | | | | | | | | | | | | | | | | | | | | | | | | | | | | | | | | | | | | | | | | | | | | | | | |
| Property/Submarket | | Our Ownership Interest | | | Book Value | | Square Footage | | | | | | | | | |
| | | | | | | Development and Redevelopment | | | | | | | | | |
| | | | | | | Under Construction | | Near
Term | | Intermediate
Term | | Future | | Total | |
| | | | | | | | | | | | | | | | |
| Greater Boston | | | | | | | | | | | | | | | | |
| The Arsenal on the Charles/Cambridge/Inner Suburbs | | 100 | % | | | $ | 126,156 | | | 205,690 | | | — | | | — | | | 200,000 | | | 405,690 | | |
| 15 Necco Street/Seaport Innovation District | | 98.2 | % | | | 179,347 | | | — | | | 293,000 | | | — | | | — | | | 293,000 | | |
| 215 Presidential Way/Route 128 | | 100 | % | | | 6,613 | | | — | | | 112,000 | | | — | | | — | | | 112,000 | | |
| 325 Binney Street/Cambridge | | 100 | % | | | 116,712 | | | — | | | — | | | 402,000 | | | — | | | 402,000 | | |
| 99 A Street/Seaport Innovation District | | 95.9 | % | | | 42,959 | | | — | | | — | | | 235,000 | | | — | | | 235,000 | | |
| 10 Necco Street/Seaport Innovation District | | 100 | % | | | 88,365 | | | — | | | — | | | 175,000 | | | — | | | 175,000 | | |
Alexandria Technology Square®/Cambridge | | 100 | % | | | 7,881 | | | — | | | — | | | — | | | 100,000 | | | 100,000 | | |
| 100 Tech Drive/Route 128 | | 100 | % | | | — | | | — | | | — | | | — | | | 300,000 | | | 300,000 | | |
| 231 Second Avenue/Route 128 | | 100 | % | | | 1,093 | | | — | | | — | | | — | | | 32,000 | | | 32,000 | | |
| Other value-creation projects | | 100 | % | | | 9,587 | | | — | | | — | | | — | | | 16,955 | | | 16,955 | | |
| | | | | 578,713 | | | 205,690 | | | 405,000 | | | 812,000 | | | 648,955 | | | 2,071,645 | | |
| San Francisco | | | | | | | | | | | | | | | | |
| 201 Haskins Way/South San Francisco | | 100 | % | | | 211,100 | | | 315,000 | | | — | | | — | | | — | | | 315,000 | | |
| Alexandria District for Science and Technology/Greater Stanford | | 100 | % | | | 611,255 | | | 526,178 | | | — | | | 587,000 | | (1) | 700,000 | | (1) | 1,813,178 | | |
| 945 Market Street/Mission Bay/SoMa | | 99.5 | % | | | 197,330 | | | 255,765 | | | — | | | — | | | — | | | 255,765 | | |
| 3160 Porter Drive/Greater Stanford | | 100 | % | | | 39,264 | | | 92,147 | | | — | | | — | | | — | | | 92,147 | | |
| 88 Bluxome Street/Mission Bay/SoMa | | 100 | % | | | 256,334 | | | — | | | 1,070,925 | | (2) | — | | | — | | | 1,070,925 | | |
Alexandria Technology Center® – Gateway/South San Francisco | | 45.0 | % | | | 44,025 | | | — | | | 217,000 | | | 300,010 | | (1) | 291,000 | | | 808,010 | | |
| 505 Brannan Street, Phase II/Mission Bay/SoMa | | 99.7 | % | | | 18,770 | | | — | | | — | | | 165,000 | | | — | | | 165,000 | | |
| 3825 and 3875 Fabian Way/Greater Stanford | | 100 | % | | | — | | | | | — | | | 250,000 | | (1) | 228,000 | | (1) | 478,000 | | |
| East Grand Avenue/South San Francisco | | 100 | % | | | 6,112 | | | — | | | — | | | — | | | 90,000 | | | 90,000 | | |
| Other value-creation projects | | 100 | % | | | 44,096 | | | — | | | — | | | 191,000 | | | 25,000 | | | 216,000 | | |
| | | | | $ | 1,428,286 | | | 1,189,090 | | | 1,287,925 | | | 1,493,010 | | | 1,334,000 | | | 5,304,025 | | |
| | | | | | | | | | | | | | | | |
(1)Represents total square footage upon completion of development or redevelopment of a new Class A property. Square footage presented includes RSF of buildings currently in operation at properties that also have inherent future development opportunities, with the intent to demolish the existing property upon expiration of the existing in-place leases and commencement of future construction. Refer to “Definitions and reconciliations” of this Supplemental Information for additional details on value-creation square feet currently included in rental properties. (2)Includes 488,899 RSF pre-leased to Pinterest, Inc., for which we expect demolition of the existing building to commence in January 2021. | | | | | | | | | | | | | | | | |
| | | | | |
| |
| New Class A Development and Redevelopment Properties: Summary of Pipeline (continued) | |
| June 30, 2020 | |
| (Dollars in thousands) | |
| |
| | | | | | | | | | | | | | | | | | | | | | | | | | | | | | | | | | | | | | | | | | | | | | | | | | |
| Property/Submarket | | Our Ownership Interest | | | Book Value | | Square Footage | | | | | | | | | |
| | | | | | | Development and Redevelopment | | | | | | | | | |
| | | | | | | Under Construction | | Near
Term | | Intermediate
Term | | Future | | Total | |
| | | | | | | | | | | | | | | | |
| New York City | | | | | | | | | | | | | | | | |
Alexandria Center® – Long Island City/New York City | | 100 | % | | | $ | 98,263 | | | 140,098 | | | — | | | — | | | — | | | 140,098 | | |
Alexandria Center® for Life Science – New York City/New York City | | 100 | % | | | 42,157 | | | — | | | — | | | 550,000 | | (1) | — | | | 550,000 | | |
| 47-50 30th Street/New York City | | 100 | % | | | 28,497 | | | — | | | — | | | 135,938 | | | — | | | 135,938 | | |
| 219 East 42nd Street/New York City | | 100 | % | | | — | | | — | | | — | | | — | | | 579,947 | | (2) | 579,947 | | |
| | | | | 168,917 | | | 140,098 | | | — | | | 685,938 | | | 579,947 | | | 1,405,983 | | |
| San Diego | | | | | | | | | | | | | | | | |
| Campus Pointe by Alexandria/University Town Center | | (3) | | | 111,126 | | | 199,621 | | | — | | | 390,164 | | (4) | 359,281 | | (4) | 949,066 | | |
| 9877 Waples Street/Sorrento Mesa | | 100 | % | | | 17,064 | | | 63,774 | | | — | | | — | | | — | | | 63,774 | | |
| 3115 Merryfield Row/Torrey Pines | | 100 | % | | | 49,409 | | | — | | | 125,000 | | | — | | | — | | | 125,000 | | |
| SD Tech by Alexandria/Sorrento Mesa | | (3) | | | 47,444 | | | — | | | 176,428 | | (5) | 190,074 | | | 388,000 | | | 754,502 | | |
| 10931 and 10933 Torrey Pines Road/Torrey Pines | | 100 | % | | | — | | | — | | | — | | | 242,000 | | (4) | — | | | 242,000 | | |
| University District/University Town Center | | 100 | % | | | 51,559 | | | — | | | — | | | 600,000 | | (4)(6) | — | | | 600,000 | | |
| Townsgate by Alexandria/Del Mar Heights | | 100 | % | | | 21,735 | | | — | | | — | | | 185,000 | | | — | | | 185,000 | | |
| 5200 Illumina Way/University Town Center | | 51 | % | | | 12,302 | | | — | | | — | | | — | | | 451,832 | | | 451,832 | | |
| Vista Wateridge/Sorrento Mesa | | 100 | % | | | 4,175 | | | — | | | — | | | — | | | 163,000 | | | 163,000 | | |
| 4045 and 4075 Sorrento Valley Boulevard/Sorrento Valley | | 100 | % | | | 7,668 | | | — | | | — | | | — | | | 149,000 | | (4) | 149,000 | | |
| Other value-creation projects | | 100 | % | | | — | | | — | | | — | | | — | | | 50,000 | | | 50,000 | | |
| | | | | 322,482 | | | 263,395 | | | 301,428 | | | 1,607,238 | | | 1,561,113 | | | 3,733,174 | | |
| Seattle | | | | | | | | | | | | | | | | |
| 1165 Eastlake Avenue East/Lake Union | | 100 | % | | | 75,486 | | | 100,086 | | | — | | | — | | | — | | | 100,086 | | |
| 1150 Eastlake Avenue East/Lake Union | | 100 | % | | | 41,687 | | | — | | | — | | | 260,000 | | | — | | | 260,000 | | |
| 701 Dexter Avenue North/Lake Union | | 100 | % | | | 47,081 | | | — | | | — | | | 217,000 | | | — | | | 217,000 | | |
| 601 Dexter Avenue North/Lake Union | | 100 | % | | | 33,787 | | | — | | | — | | | — | | | 188,400 | | (4) | 188,400 | | |
| Other value-creation projects | | 100 | % | | | 53,877 | | | — | | | — | | | — | | | 579,825 | | | 579,825 | | |
| | | | | $ | 251,918 | | | 100,086 | | | — | | | 477,000 | | | 768,225 | | | 1,345,311 | | |
| | | | | | | | | | | | | | | | |
(1)We have been negotiating a long-term ground lease for the future site of a new building approximating 550,000 RSF. Beginning in March 2020, due to the impacts of COVID-19 on New York City, the City has been using the site as a temporary morgue. The use of this site by the City has resulted in delays to deadlines for both ground lease negotiations and ultimately the timing to commence and complete key milestone construction dates. (2)Includes 349,947 RSF in operation with an opportunity to either convert the existing office space into office/laboratory space through future redevelopment or to expand the building by an additional 230,000 RSF through ground-up development. The building is currently occupied by Pfizer Inc. with a remaining lease term of approximately five years. (3)Refer to “Joint venture financial information” of this Supplemental Information for additional details on our ownership interest. (4)Represents total square footage upon completion of development of a new Class A property. Square footage presented includes RSF of buildings currently in operation at properties that also have inherent future development opportunities. We intend to demolish the existing property upon expiration of the existing in-place leases and commencement of future construction. Refer to “Definitions and reconciliations” of this Supplemental Information for additional details on value-creation square feet currently included in rental properties. (5)During the three months ended June 30, 2020, we pre-leased 59% of this project and expect to commence construction over the next six to eight months. (6)Includes our recently acquired project at 4555 Executive Drive and 9363 and 9393 Towne Centre Drive in our University Town Center submarket, which are currently under evaluation for development, subject to future market conditions. | | | | | | | | | | | | | | | | |
| | | | | |
| |
| New Class A Development and Redevelopment Properties: Summary of Pipeline (continued) | |
| June 30, 2020 | |
| (Dollars in thousands) | |
| |
| | | | | | | | | | | | | | | | | | | | | | | | | | | | | | | | | | | | | | | | | | | | | | | | | | |
| Property/Submarket | | Our Ownership Interest | | | Book Value | | Square Footage | | | | | | | | | |
| | | | | | | Development and Redevelopment | | | | | | | | | |
| | | | | | | Under Construction | | Near
Term | | Intermediate
Term | | Future | | Total | |
| | | | | | | | | | | | | | | | |
| Maryland | | | | | | | | | | | | | | | | |
| 704 Quince Orchard Road/Gaithersburg | | 56.8 | % | | | $ | — | | (1) | 20,998 | | | — | | | — | | | — | | | 20,998 | | |
| 9804 and 9800 Medical Center Drive/Rockville | | 100.0 | % | | | 56,905 | | | 176,832 | | | — | | | — | | | 64,000 | | | 240,832 | | |
| 9950 Medical Center Drive/Rockville | | 100.0 | % | | | 34,340 | | | 84,264 | | | — | | | — | | | — | | | 84,264 | | |
| 14200 Shady Grove Road/Rockville | | 100.0 | % | | | 27,285 | | | — | | | — | | | 290,000 | | | 145,000 | | | 435,000 | | |
| | | | | 118,530 | | | 282,094 | | | — | | | 290,000 | | | 209,000 | | | 781,094 | | |
| Research Triangle | | | | | | | | | | | | | | | | |
Alexandria Center® for AgTech, Phase II/Research Triangle | | 100 | % | | | 26,247 | | | 160,000 | | | — | | | — | | | — | | | 160,000 | | |
| 8 Davis Drive/Research Triangle | | 100 | % | | | 15,985 | | | — | | | 150,000 | | | 70,000 | | | — | | | 220,000 | | |
| 6 Davis Drive/Research Triangle | | 100 | % | | | 15,761 | | | — | | | — | | | — | | | 800,000 | | | 800,000 | | |
| Other value-creation projects | | 100 | % | | | 4,185 | | | — | | | — | | | — | | | 76,262 | | | 76,262 | | |
| | | | | 62,178 | | | 160,000 | | | 150,000 | | | 70,000 | | | 876,262 | | | 1,256,262 | | |
| Other value-creation projects | | 100 | % | | | 3,842 | | | — | | | — | | | — | | | 146,800 | | | 146,800 | | |
| Total | | | | | 2,934,866 | | | 2,340,453 | | | 2,144,353 | | | 5,435,186 | | | 6,124,302 | | | 16,044,294 | | (2) |
| | | | | | | | | | | | | | | | |
| Key pending acquisition | | | | | | | | | | | | | | | | |
| Mercer Mega Block/Lake Union | | (3) | | | (3) | | — | | | — | | | — | | | 800,000 | | | 800,000 | | |
| | | | | — | | | — | | | — | | | — | | | 800,000 | | | 800,000 | | |
| | | | | $ | 2,934,866 | | | 2,340,453 | | | 2,144,353 | | | 5,435,186 | | | 6,924,302 | | | 16,844,294 | | |
| | | | | | | | | | | | | | | | |
(1)This property is held by an unconsolidated real estate joint venture. Refer to “Joint venture financial information” of this Supplemental Information for additional details on our ownership interest.
(2)Total square footage includes 1,821,610 RSF of buildings currently in operation that will be redeveloped or replaced with new development RSF upon commencement of future construction. Refer to “Definitions and reconciliations” of this Supplemental Information for additional details on value-creation square feet currently included in rental properties.
(3)Refer to “Acquisitions” in our Earnings Press Release for additional details.
| | | | | |
| |
| Construction Spending | |
| June 30, 2020 | |
| (Dollars in thousands, except per RSF amounts) | |
| |
| | | | | | | | | | | | | | | | | | | | |
| | Six Months Ended | | | | |
| Construction Spending | | June 30, 2020 | | | | |
Additions to real estate – consolidated projects | | $ | 725,742 | | | | |
| Investments in unconsolidated real estate joint ventures | | | 2,861 | | | | |
| Contributions from noncontrolling interests | | | (5,704) | | | | |
| Construction spending (cash basis) | | | 722,899 | | | | |
| Change in accrued construction | | | (56,497) | | | | |
| Construction spending for the six months ended June 30, 2020 | | | 666,402 | | | | |
| Projected construction spending for the six months ending December 31, 2020 | | | 683,598 | | | | |
| Guidance midpoint | | $ | 1,350,000 | | | | |
| | | | | | |
| | | | | | | | | | | | | | | | | | | | |
| | Year Ending | | | | |
| Projected Construction Spending | | December 31, 2020 | | | | |
| Development, redevelopment, and pre-construction projects | | $ | 1,170,000 | | | | |
| Contributions from noncontrolling interests (consolidated real estate joint ventures) | | | (20,000) | | | | |
| Revenue-enhancing and repositioning capital expenditures | | | 144,000 | | | | |
| Non-revenue-enhancing capital expenditures | | | 56,000 | | | | |
| Guidance midpoint | | $ | 1,350,000 | | | | |
| | | | | | |
| | | | | | |
| | | | | | |
| | | | | |
| |
| Joint Venture Financial Information | |
| June 30, 2020 | |
| (Dollars in thousands) | |
| |
| | | | | | | | | | | | | | | | | | | | | | | | | | | | | | | | |
| Consolidated Real Estate Joint Ventures | | | | | | Unconsolidated Real Estate Joint Ventures | | | | |
| Property/Market/Submarket | | Noncontrolling Interest Share(1) | | | | Property/Market/Submarket | | Our Ownership Share(2) | | |
| 225 Binney Street/Greater Boston/Cambridge | | | 70.0 | % | | | 1655 and 1725 Third Street/San Francisco/Mission Bay/SoMa | | | 10.0 | % | |
| 75/125 Binney Street/Greater Boston/Cambridge | | | 60.0 | % | | | Menlo Gateway/San Francisco/Greater Stanford | | | 49.0 | % | |
| 409 and 499 Illinois Street/San Francisco/Mission Bay/SoMa | | | 40.0 | % | | | 704 Quince Orchard Road/Maryland/Gaithersburg | | | 56.8 | % | (3) |
| 1500 Owens Street/San Francisco/Mission Bay/SoMa | | | 49.9 | % | | | | | | | |
Alexandria Technology Center® – Gateway/San Francisco/South San Francisco(4) | | | 55.0 | % | | | | | | | |
| 500 Forbes Boulevard/San Francisco/South San Francisco | | | 90.0 | % | | | | | | | |
Campus Pointe by Alexandria/San Diego/University Town Center(5) | | | 45.0 | % | | | | | | | |
| 5200 Illumina Way/San Diego/University Town Center | | | 49.0 | % | | | | | | | |
| 9625 Towne Centre Drive/San Diego/University Town Center | | | 49.9 | % | | | | | | | |
SD Tech by Alexandria/San Diego/Sorrento Mesa(6) | | | 50.0 | % | | | | | | | |
| | | | | | | | | | |
(1)In addition to the consolidated real estate joint ventures listed, various partners hold insignificant noncontrolling interests in six other joint ventures in North America.
(2)In addition to the unconsolidated real estate joint ventures listed, we hold an interest in two other insignificant unconsolidated real estate joint ventures in North America.
(3)Represents our ownership interest; our voting interest is limited to 50%.
(4)Excludes 600, 630, 650, 901, and 951 Gateway Boulevard in our South San Francisco submarket. Noncontrolling interest share is anticipated to be 49% as we make further contributions over time.
(5)Excludes 9880 Campus Point Drive in our University Town Center submarket.
(6)Excludes 5505 Morehouse Drive in our Sorrento Mesa submarket.
| | | | | | | | | | | | | | | | | | | | | | | | |
| | As of June 30, 2020 | | | | | | |
| Noncontrolling Interest Share of Consolidated Real Estate JVs | | | | Our Share of Unconsolidated
Real Estate JVs | | | |
| Investments in real estate | $ | 1,491,601 | | | | $ | 459,843 | | | |
| Cash, cash equivalents, and restricted cash | | 48,327 | | | | | 9,338 | | | |
| Other assets | | 168,342 | | | | | 49,503 | | | |
Secured notes payable (refer to page 49) | | — | | | | | (186,254) | | | |
| Other liabilities | | (70,734) | | | | | (5,572) | | | |
| Redeemable noncontrolling interests | | (12,122) | | | | | — | | | |
| $ | 1,625,414 | | | | $ | 326,858 | | | |
| | | | | | | | | | | | | | | | | | | | | | | | | | | | | | | | | | | | | | | | | | | | | | | |
| | | | | | | | | | | | | | | |
| Noncontrolling Interest Share of
Consolidated Real Estate JVs | | | | | | | | Our Share of Unconsolidated
Real Estate JVs | | | | | | |
| June 30, 2020 | | | | | | | | June 30, 2020 | | | | | | |
| Three Months Ended | | | | Six Months Ended | | | | Three Months Ended | | | | Six Months Ended | | |
| Total revenues | $ | 39,869 | | | | $ | 77,646 | | | | $ | 10,011 | | | | $ | 20,655 | | |
| Rental operations | | (10,302) | | | | | (20,397) | | | | | (1,199) | | | | | (2,617) | | |
| | 29,567 | | | | | 57,249 | | | | | 8,812 | | | | | 18,038 | | |
| General and administrative | | (102) | | | | | (219) | | | | | (50) | | | | | (134) | | |
| Interest | | — | | | | | — | | | | | (2,011) | | | | | (3,982) | | |
| Depreciation and amortization | | (15,775) | | | | | (31,645) | | | | | (2,858) | | | | | (5,501) | | |
| Impairment of real estate | | — | | | | | — | | | | | — | | | | | (7,644) | | |
Fixed returns allocated to redeemable noncontrolling interests(1) | | 217 | | | | | 435 | | | | | — | | | | | — | | |
| $ | 13,907 | | | | $ | 25,820 | | | | $ | 3,893 | | | | $ | 777 | | |
| | | | | | | | | | | | | | | |
| Straight-line rent and below-market lease revenue | $ | 1,274 | | | | $ | 3,236 | | | | $ | 5,698 | | | | $ | 11,551 | | |
Funds from operations(2) | $ | 29,682 | | | | $ | 57,465 | | | | $ | 6,751 | | | | $ | 13,922 | | |
| | | | | | | | | | | | | | | |
(1)Represents an allocation of joint venture earnings to redeemable noncontrolling interests primarily in one property in our South San Francisco submarket. These redeemable noncontrolling interests earn a fixed return on their investment rather than participate in the operating results of the property.
(2)Refer to “Funds from operations and funds from operations per share” in our Earnings Press Release and “Funds from operations and funds from operations, as adjusted, attributable to Alexandria’s common stockholders” in “Definitions and reconciliations” in this Supplemental Information for the definition and reconciliation from the most directly comparable GAAP measure.
| | | | | |
| |
| Investments | |
| June 30, 2020 | |
| (Dollars in thousands) | |
| |
We present our equity investments at fair value whenever fair value or net asset value (“NAV”) is readily available. Adjustments for our limited partnership investments represent changes in reported NAV as a practical expedient to estimate fair value. For investments without readily available fair values, we adjust the carrying amount whenever such investments have an observable price change, and further adjustments are not made until another price change, if any, is observed. Refer to “Investments” in the “Definitions and reconciliations” of this Supplemental Information for additional details.
| | | | | | | | | | | | | | | | | | | | | | | | | | | | | |
| | June 30, 2020 | | | | | | | |
| | Three Months Ended | | | Six Months Ended | | | Year Ended December 31, 2019 | |
| Realized gains | | $ | 13,005 | | (1) | | $ | 8,328 | | (1) | | $ | 33,158 | | (2) |
| Unrealized gains | | 171,652 | | | | 154,508 | | | | 161,489 | | |
| Investment income | | $ | 184,657 | | | | $ | 162,836 | | | | $ | 194,647 | | |
| | | | | | | | | |
| | | | | | | | | | | | | | | | | | | | | | | | | | | | | |
| Investments | | Cost | | | Unrealized
Gains | | | Carrying Amount | |
| Fair value: | | | | | | | | | |
| Publicly traded companies | | $ | 159,129 | | | | $ | 262,841 | | (3) | | $ | 421,970 | | |
| Entities that report NAV | | 302,954 | | | | 218,602 | | | | 521,556 | | |
| | | | | | | | | |
| Entities that do not report NAV: | | | | | | | | | |
| Entities with observable price changes | | 48,565 | | | | 74,708 | | | | 123,273 | | |
| Entities without observable price changes | | 251,666 | | | | — | | | | 251,666 | | |
| June 30, 2020 | | $ | 762,314 | | (4) | | $ | 556,151 | | | | $ | 1,318,465 | | |
| | | | | | | | | |
| March 31, 2020 | | $ | 738,983 | | | | $ | 384,499 | | | | $ | 1,123,482 | | |
(1)Includes realized gains for the three and six months ended June 30, 2020, of $17.7 million and $32.8 million, respectively, and impairments related to investments in privately held entities that do not report NAV of $4.7 million and $24.5 million, respectively.
(2)Includes realized gains of $50.3 million and impairments related to investments in privately held entities that do not report NAV of $17.1 million for the year ended December 31, 2019.
(3)Includes gross unrealized gains and losses of $279.7 million and $16.9 million, respectively, as of June 30, 2020.
(4)Represents 3.3% of gross assets as of June 30, 2020.
| | | | | | | | |
| Public/Private
Mix (Cost) | |
| | |
| | |
| Tenant/Non-Tenant
Mix (Cost) | |
| | |
| | | | | |
| |
| |
| Key Credit Metrics | |
| June 30, 2020 | |
| |
| | | | | | | | | | | | | | | | | | | | | | | | | | |
| Liquidity | | | | | Significant Availability on Unsecured Senior Lines of Credit | | | |
| | | | | (in millions) | | | |
| $4.2B | | | | | | | | |
| | | | | | | | |
| | | | | | | | |
| | | | | | | | |
| | | | | | | | |
| | | | | | | | |
| | | | | | | | |
| (in millions) | | | | | | | | |
| Availability under our unsecured senior lines of credit | | $ | 2,510 | | | | | | | |
Outstanding forward equity sales agreements(1) | | 520 | | | | | | | |
| Cash, cash equivalents, and restricted cash | | 242 | | | | | | | |
| Investments in publicly traded companies | | 422 | | | | | | | |
| Liquidity as of June 30, 2020 | | 3,694 | | | | | | | |
Outstanding forward equity sales agreements(2) | | 532 | | | | | | | |
| Total | | $ | 4,226 | | | | | | | |
| | | | | | | | |
Net Debt and Preferred Stock to Adjusted EBITDA(4) | | | | | Fixed-Charge Coverage Ratio(4) | | | |
| | | | | | | | |
| | | | | | | | |
| | | | | | | | |
| | | | | | | | |
| | | | | | | | |
| | | | | | | | |
| | | | | | | | |
| | | | | | | | |
| | | | | | | | |
| | | | | | | | |
| | | | | | | | |
| | | | | | | | |
| | | | | | | | |
| | | | | | | | |
(1)Represents expected net proceeds from the future settlement of the remaining 3.5 million shares outstanding under our January 2020 forward equity sales agreements.
(2)Represents expected net proceeds from the future settlement of 6.9 million shares outstanding under our July 2020 forward equity sales agreements, net of the reduction in availability for borrowing under our $750 million unsecured senior line of credit. Pursuant to the terms of the $750 million unsecured senior line of credit agreement, the outstanding commitments will be reduced in the future by 50% of the net proceeds from any equity offerings entered into subsequent to the execution of this line of credit in April 2020. As of July 27, 2020, none of our forward equity sales agreements entered into in July 2020 have been settled.
(3)Total outstanding availability on our unsecured senior lines of credit reduced by the expected net proceeds from the future settlement of 6.9 million shares outstanding under our July 2020 forward equity sales agreements.
(4)Quarter annualized.
| | | | | |
| |
| |
| Summary of Debt | |
| June 30, 2020 | |
| |
Debt maturities chart
(In millions)
Weighted-Average Remaining Term of 9.9 Years
| | | | | |
| |
| Summary of Debt (continued) | |
| June 30, 2020 | |
| (Dollars in thousands) | |
| |
| | | | | | | | | | | | | | | | | | | | | | | | | | | | | | | | | | | | | | |
| Fixed-rate and variable-rate debt | Fixed-Rate
Debt | | Variable-Rate Debt | | Total | | Percentage | | Weighted-Average | | | |
| | | | | | | | | Interest Rate(1) | | Remaining Term
(in years) | |
| | | | | | | | | | | | |
| Secured notes payable | $ | 344,784 | | | $ | — | | | $ | 344,784 | | | 4.6 | % | | 3.57 | % | | 3.5 | |
| Unsecured senior notes payable | 6,738,486 | | | — | | | 6,738,486 | | | 89.6 | | | 4.10 | | | 10.6 | |
Unsecured senior lines of credit(2) | — | | | 440,000 | | | 440,000 | | | 5.8 | | | 1.33 | | | 3.6 | |
| Total/weighted average | $ | 7,083,270 | | | $ | 440,000 | | | $ | 7,523,270 | | | 100.0 | % | | 3.91 | % | | 9.9 | |
| Percentage of total debt | 94 | % | | 6 | % | | 100 | % | | | | | | | |
| | | | | | | | | | | | |
(1)Represents the weighted-average interest rate as of the end of the applicable period, including expense/income related to the amortization of loan fees, amortization of debt premiums (discounts), and other bank fees.
(2)Includes our commercial paper program, which had no outstanding balance as of June 30, 2020.
| | | | | | | | | | | | | | | | | | | | | | | | | | | | | |
| Debt covenants | | Unsecured Senior Notes Payable | | | | Unsecured Senior Lines of Credit | | | |
Debt Covenant Ratios(1) | | Requirement | | June 30, 2020 | | Requirement | | June 30, 2020 | |
| Total Debt to Total Assets | | ≤ 60% | | 34% | | ≤ 60.0% | | 30.7% | |
| Secured Debt to Total Assets | | ≤ 40% | | 2% | | ≤ 45.0% | | 1.4% | |
| Consolidated EBITDA to Interest Expense | | ≥ 1.5x | | 6.9x | | ≥ 1.50x | | 3.77x | |
| Unencumbered Total Asset Value to Unsecured Debt | | ≥ 150% | | 273% | | N/A | | N/A | |
| Unsecured Interest Coverage Ratio | | N/A | | N/A | | ≥ 1.75x | | 5.98x | |
| | | | | | | | | |
(1)All covenant ratio titles utilize terms as defined in the respective debt and credit agreements. EBITDA is not calculated pursuant to the definition set forth by the SEC in Exchange Act Release No. 47226.
| | | | | | | | | | | | | | | | | | | | | | | | | | | | | | | | | | | | | | | | | | | | | | | |
| Unconsolidated real estate joint ventures’ debt | | | | | | | | | | | | | | | |
| Unconsolidated Joint Venture | | Our Share | | | | Maturity Date | | Stated Rate | | Interest Rate(1) | | | | 100% at JV Level Debt Balance(2) | |
| 704 Quince Orchard Road | | | 56.8% | | | 3/16/23 | | L+1.95% | | | 2.40% | | | $ | 11,602 | | |
| 1655 and 1725 Third Street | | | 10.0% | | | 3/10/25 | | 4.50% | | | 4.57% | | | 598,020 | | |
| Menlo Gateway, Phase II | | | 49.0% | | | 5/1/35 | | 4.53% | | | 4.59% | | | 106,580 | | |
| Menlo Gateway, Phase I | | | 49.0% | | | 8/10/35 | | 4.15% | | | 4.18% | | | 140,843 | | |
| | | | | | | | | | | | | | $ | 857,045 | | |
| | | | | | | | | | | | | | | |
(1)Includes interest expense and amortization of loan fees.
(2)Represents outstanding principal, net of unamortized deferred financing costs, as of June 30, 2020.
| | | | | |
| |
| Summary of Debt (continued) | |
| June 30, 2020 | |
| (Dollars in thousands) | |
| |
| | | | | | | | | | | | | | | | | | | | | | | | | | | | | | | | | | | | | | | | | | | | | | | | | | | | | | | | | | | | | | | | | | | | | | | | | | | | | | | | |
| Debt | | Stated
Rate | | Interest Rate(1) | | | Maturity Date(2) | | Principal Payments Remaining for the Periods Ending December 31, | | | | | | | | | | | | Principal | | Unamortized (Deferred Financing Cost), (Discount)/Premium | | Total | |
| | | | | | | | | 2020 | | 2021 | | 2022 | | 2023 | | 2024 | | Thereafter | | | | | | | |
| Secured notes payable | | | | | | | | | | | | | | | | | | | | | | | | | | |
| San Diego | | 4.66 | % | | 4.90 | % | | | 1/1/23 | | $ | 893 | | | $ | 1,852 | | | $ | 1,942 | | | $ | 26,259 | | | $ | — | | | $ | — | | | $ | 30,946 | | | $ | (164) | | | $ | 30,782 | | |
| Greater Boston | | 3.93 | % | | 3.19 | | | | 3/10/23 | | 790 | | | 1,628 | | | 1,693 | | | 74,517 | | | — | | | — | | | 78,628 | | | 1,503 | | | 80,131 | | |
| Greater Boston | | 4.82 | % | | 3.40 | | | | 2/6/24 | | 1,623 | | | 3,394 | | | 3,564 | | | 3,742 | | | 183,527 | | | — | | | 195,850 | | | 9,688 | | | 205,538 | | |
| San Francisco | | 4.14 | % | | 4.42 | | | | 7/1/26 | | — | | | — | | | — | | | — | | | — | | | 28,200 | | | 28,200 | | | (595) | | | 27,605 | | |
| San Francisco | | 6.50 | % | | 6.50 | | | | 7/1/36 | | 25 | | | 26 | | | 28 | | | 30 | | | 32 | | | 587 | | | 728 | | | — | | | 728 | | |
| Secured debt weighted-average interest rate/subtotal | | 4.55 | % | | 3.57 | | | | | | 3,331 | | | 6,900 | | | 7,227 | | | 104,548 | | | 183,559 | | | 28,787 | | | 334,352 | | | 10,432 | | | 344,784 | | |
| | | | | | | | | | | | | | | | | | | | | | | | | | |
Commercial paper program(3) | | N/A | | N/A | (3) | | N/A | | — | | | — | | | — | | | — | | | — | | | — | | | — | | | — | | | — | | |
$750 million unsecured senior line of credit(4) | | L+1.05 | % | | N/A | (4) | | 4/14/22 | | — | | | — | | | — | | | — | | | — | | | — | | | — | | | — | | | — | | |
| $2.2 billion unsecured senior line of credit | | L+0.825 | % | | 1.33 | | | | 1/28/24 | | — | | | — | | | — | | | — | | | 440,000 | | | — | | | 440,000 | | | — | | | 440,000 | | |
| Unsecured senior notes payable | | 3.90 | % | | 4.04 | | | | 6/15/23 | | — | | | — | | | — | | | 500,000 | | | — | | | — | | | 500,000 | | | (1,769) | | | 498,231 | | |
| Unsecured senior notes payable – green bond | | 4.00 | % | | 4.03 | | | | 1/15/24 | | — | | | — | | | — | | | — | | | 650,000 | | | — | | | 650,000 | | | (449) | | | 649,551 | | |
| Unsecured senior notes payable | | 3.45 | % | | 3.62 | | | | 4/30/25 | | — | | | — | | | — | | | — | | | — | | | 600,000 | | | 600,000 | | | (4,236) | | | 595,764 | | |
| Unsecured senior notes payable | | 4.30 | % | | 4.50 | | | | 1/15/26 | | — | | | — | | | — | | | — | | | — | | | 300,000 | | | 300,000 | | | (2,704) | | | 297,296 | | |
| Unsecured senior notes payable – green bond | | 3.80 | % | | 3.96 | | | | 4/15/26 | | — | | | — | | | — | | | — | | | — | | | 350,000 | | | 350,000 | | | (2,840) | | | 347,160 | | |
| Unsecured senior notes payable | | 3.95 | % | | 4.13 | | | | 1/15/27 | | — | | | — | | | — | | | — | | | — | | | 350,000 | | | 350,000 | | | (3,308) | | | 346,692 | | |
| Unsecured senior notes payable | | 3.95 | % | | 4.07 | | | | 1/15/28 | | — | | | — | | | — | | | — | | | — | | | 425,000 | | | 425,000 | | | (3,194) | | | 421,806 | | |
| Unsecured senior notes payable | | 4.50 | % | | 4.60 | | | | 7/30/29 | | — | | | — | | | — | | | — | | | — | | | 300,000 | | | 300,000 | | | (2,017) | | | 297,983 | | |
| Unsecured senior notes payable | | 2.75 | % | | 2.87 | | | | 12/15/29 | | — | | | — | | | — | | | — | | | — | | | 400,000 | | | 400,000 | | | (3,889) | | | 396,111 | | |
| Unsecured senior notes payable | | 4.70 | % | | 4.81 | | | | 7/1/30 | | — | | | — | | | — | | | — | | | — | | | 450,000 | | | 450,000 | | | (3,719) | | | 446,281 | | |
| Unsecured senior notes payable | | 4.90 | % | | 5.05 | | | | 12/15/30 | | — | | | — | | | — | | | — | | | — | | | 700,000 | | | 700,000 | | | (8,230) | | | 691,770 | | |
| Unsecured senior notes payable | | 3.38 | % | | 3.48 | | | | 8/15/31 | | — | | | — | | | — | | | — | | | — | | | 750,000 | | | 750,000 | | | (7,212) | | | 742,788 | | |
| Unsecured senior notes payable | | 4.85 | % | | 4.93 | | | | 4/15/49 | | — | | | — | | | — | | | — | | | — | | | 300,000 | | | 300,000 | | | (3,389) | | | 296,611 | | |
| Unsecured senior notes payable | | 4.00 | % | | 3.91 | | | | 2/1/50 | | — | | | — | | | — | | | — | | | — | | | 700,000 | | | 700,000 | | | 10,442 | | | 710,442 | | |
| Unsecured debt weighted average/subtotal | | | | 3.93 | | | | | | — | | | — | | | — | | | 500,000 | | | 1,090,000 | | | 5,625,000 | | | 7,215,000 | | | (36,514) | | | 7,178,486 | | |
| Weighted-average interest rate/total | | | | 3.91 | % | | | | | $ | 3,331 | | | $ | 6,900 | | | $ | 7,227 | | | $ | 604,548 | | | $ | 1,273,559 | | | $ | 5,653,787 | | | $ | 7,549,352 | | | $ | (26,082) | | | $ | 7,523,270 | | |
| | | | | | | | | | | | | | | | | | | | | | | | | | |
| Balloon payments | | | | | | | | | $ | — | | | $ | — | | | $ | — | | | $ | 600,487 | | | $ | 1,273,221 | | | $ | 5,653,200 | | | $ | 7,526,908 | | | $ | — | | | $ | 7,526,908 | | |
| Principal amortization | | | | | | | | | 3,331 | | | 6,900 | | | 7,227 | | | 4,061 | | | 338 | | | 587 | | | 22,444 | | | (26,082) | | | (3,638) | | |
| Total debt | | | | | | | | | $ | 3,331 | | | $ | 6,900 | | | $ | 7,227 | | | $ | 604,548 | | | $ | 1,273,559 | | | $ | 5,653,787 | | | $ | 7,549,352 | | | $ | (26,082) | | | $ | 7,523,270 | | |
| | | | | | | | | | | | | | | | | | | | | | | | | | |
| Fixed-rate/hedged variable-rate debt | | | | | | | | | $ | 3,331 | | | $ | 6,900 | | | $ | 7,227 | | | $ | 604,548 | | | $ | 833,559 | | | $ | 5,653,787 | | | $ | 7,109,352 | | | $ | (26,082) | | | $ | 7,083,270 | | |
| Unhedged variable-rate debt | | | | | | | | | — | | | — | | | — | | | — | | | 440,000 | | | — | | | 440,000 | | | — | | | 440,000 | | |
| Total debt | | | | | | | | | $ | 3,331 | | | $ | 6,900 | | | $ | 7,227 | | | $ | 604,548 | | | $ | 1,273,559 | | | $ | 5,653,787 | | | $ | 7,549,352 | | | $ | (26,082) | | | $ | 7,523,270 | | |
| | | | | | | | | | | | | | | | | | | | | | | | | | |
| Weighted-average stated rate on maturing debt | | | | | | | | | N/A | | N/A | | N/A | | 3.94% | | 3.09% | | 4.01% | | | | | | | |
| | | | | | | | | | | | | | | | | | | | | | | | | | |
(1)Represents the weighted-average interest rate as of the end of the applicable period, including amortization of loan fees, amortization of debt premiums (discounts), and other bank fees.
(2)Reflects any extension options that we control.
(3)Under our commercial paper program, we have the ability to issue up to $1.0 billion. This program provides us with the ability to issue commercial paper notes bearing interest at short-term fixed rates, generally with a maturity of 30 days or less and with a maximum maturity of 397 days from the date of issuance. Borrowings under the program will be used to fund short-term capital needs and are backed by our $2.2 billion unsecured senior line of credit. In the event we are unable to issue commercial paper notes or refinance outstanding commercial paper notes under terms equal to or more favorable than those under the $2.2 billion unsecured senior line of credit, we expect to borrow under the $2.2 billion unsecured senior line of credit at L+0.825%. The commercial paper notes sold during the three months ended June 30, 2020, were issued at a weighted-average yield to maturity of 0.79%.
(4)During the three months ended June 30, 2020, we did not draw on our $750 million unsecured senior line of credit. Pursuant to the terms of the $750 million unsecured senior line of credit agreement, the outstanding commitments will be reduced by 100% of net proceeds from the issuance of new corporate debt and 50% of the net proceeds from the settlement of our forward equity sales agreements entered into in July 2020. As of July 27, 2020, none of our forward equity sales agreements entered into in July 2020 have been settled.
| | | | | |
| |
| |
| Definitions and Reconciliations | |
| June 30, 2020 | |
| |
This section contains additional details for sections throughout this Supplemental Information package and the accompanying Earnings Press Release, as well as explanations and reconciliations of certain non-GAAP financial measures and the reasons why we use these supplemental measures of performance and believe they provide useful information to investors. Additional detail can be found in our most recent annual report on Form 10-K and subsequent quarterly reports on Form 10-Q, as well as other documents filed with or furnished to the SEC from time to time.
Adjusted EBITDA and Adjusted EBITDA margin
The following table reconciles net income (loss) and revenues, the most directly comparable financial measures calculated and presented in accordance with GAAP, to Adjusted EBITDA and revenues, as adjusted, respectively:
| | | | | | | | | | | | | | | | | | | | | | | | | | | | | |
| | Three Months Ended | | | | | | | | |
| (Dollars in thousands) | 6/30/20 | | 3/31/20 | | 12/31/19 | | 9/30/19 | | 6/30/19 |
| Net income (loss) | $ | 243,561 | | | $ | 30,678 | | | $ | 216,053 | | | $ | (36,003) | | | $ | 87,179 | |
| Interest expense | 45,014 | | | 45,739 | | | 45,493 | | | 46,203 | | | 42,879 | |
| Income taxes | 1,406 | | | 1,341 | | | 1,269 | | | 887 | | | 890 | |
| Depreciation and amortization | 168,027 | | | 175,496 | | | 140,518 | | | 135,570 | | | 134,437 | |
| Stock compensation expense | 9,185 | | | 9,929 | | | 10,239 | | | 10,935 | | | 11,437 | |
| Loss on early extinguishment of debt | — | | | — | | | — | | | 40,209 | | | — | |
| Gain on sales of real estate | — | | | — | | | (474) | | | — | | | — | |
| Unrealized (gains) losses on non-real estate investments | (171,652) | | | 17,144 | | | (148,268) | | | 70,043 | | | (11,058) | |
| Impairment of real estate | 13,218 | | | 9,647 | | | 12,334 | | | — | | | — | |
| Impairment of non-real estate investments | 4,702 | | | 19,780 | | | 9,991 | | | 7,133 | | | — | |
| Adjusted EBITDA | $ | 313,461 | | | $ | 309,754 | | | $ | 287,155 | | | $ | 274,977 | | | $ | 265,764 | |
| | | | | | | | | |
| Revenues | $ | 436,956 | | | $ | 439,919 | | | $ | 408,114 | | | $ | 390,484 | | | $ | 373,856 | |
| Non-real estate investments – total realized gains (losses) | 13,005 | | | (4,677) | | | 4,399 | | | 6,967 | | | 10,442 | |
| Impairment of non-real estate investments | 4,702 | | | 19,780 | | | 9,991 | | | 7,133 | | | — | |
| Revenues, as adjusted | $ | 454,663 | | | $ | 455,022 | | | $ | 422,504 | | | $ | 404,584 | | | $ | 384,298 | |
| | | | | | | | | |
| Adjusted EBITDA margin | 69% | | 68% | | 68% | | 68% | | 69% |
We use Adjusted EBITDA as a supplemental performance measure of our operations, for financial and operational decision-making, and as a supplemental means of evaluating period-to-period comparisons on a consistent basis. Adjusted EBITDA is calculated as earnings before interest, taxes, depreciation, and amortization (“EBITDA”), excluding stock compensation expense, gains or losses on early extinguishment of debt, gains or losses on sales of real estate, and impairments of real estate. Adjusted EBITDA also excludes unrealized gains or losses and significant realized gains and impairments that result from our non-real estate investments. These non-real estate investment amounts are classified in our consolidated statements of operations outside of revenues.
We believe Adjusted EBITDA provides investors with relevant and useful information as it allows investors to evaluate the operating performance of our business activities without having to account for differences recognized because of real estate and non-real estate investment and disposition decisions, financing decisions, capital structure, capital market transactions, and variances resulting from the volatility of market conditions outside of our control. For example, we exclude gains or losses on the early extinguishment of debt to allow investors to measure our performance independent
of our indebtedness and capital structure. We believe that adjusting for the effects of impairments and gains or losses on sales of real estate, and significant impairments and significant gains on the sale of non-real estate investments allows investors to evaluate performance from period to period on a consistent basis without having to account for differences recognized because of real estate and non-real estate investment and disposition decisions. We believe that excluding charges related to stock compensation and unrealized gains or losses facilitates for investors a comparison of our business activities across periods without the volatility resulting from market forces outside of our control. Adjusted EBITDA has limitations as a measure of our performance. Adjusted EBITDA does not reflect our historical expenditures or future requirements for capital expenditures or contractual commitments. While Adjusted EBITDA is a relevant measure of performance, it does not represent net income (loss) or cash flows from operations calculated and presented in accordance with GAAP, and it should not be considered as an alternative to those indicators in evaluating performance or liquidity.
Our calculation of Adjusted EBITDA margin divides Adjusted EBITDA by our revenues, as adjusted. We believe that revenues, as adjusted, provides a denominator for Adjusted EBITDA margin that is calculated on a basis more consistent with that of the Adjusted EBITDA numerator. Specifically, revenues, as adjusted, includes the same realized gains on, and impairments of, non-real estate investments that are included in the reconciliation of Adjusted EBITDA. We believe that the consistent application of results from our non-real estate investments to both the numerator and denominator of Adjusted EBITDA margin provides a more useful calculation for the comparison across periods.
Annual rental revenue
Annual rental revenue represents the annualized fixed base rental obligations, calculated in accordance with GAAP, for leases in effect as of the end of the period, related to our operating RSF. Annual rental revenue is presented using 100% of the annual rental revenue of our consolidated properties and our share of annual rental revenue for our unconsolidated real estate joint ventures. Annual rental revenue per RSF is computed by dividing annual rental revenue by the sum of 100% of the RSF of our consolidated properties and our share of the RSF of properties held in unconsolidated real estate joint ventures. As of June 30, 2020, approximately 93% of our leases (on an RSF basis) were triple net leases, which require tenants to pay substantially all real estate taxes, insurance, utilities, repairs and maintenance, common area expenses, and other operating expenses (including increases thereto) in addition to base rent. Annual rental revenue excludes these operating expenses recovered from our tenants. Amounts recovered from our tenants related to these operating expenses, along with base rent, are classified in income from rentals in our consolidated statements of operations.
Cash interest
Cash interest is equal to interest expense calculated in accordance with GAAP plus capitalized interest, less amortization of loan fees and debt premiums (discounts). Refer to the definition of fixed-charge coverage ratio for a reconciliation of interest expense, the most directly comparable financial measure calculated and presented in accordance with GAAP, to cash interest.
| | | | | |
| |
| |
| Definitions and Reconciliations (continued) | |
| June 30, 2020 | |
| |
Class A properties and AAA locations
Class A properties are properties clustered in AAA locations that provide innovative tenants with highly dynamic and collaborative environments that enhance their ability to successfully recruit and retain world-class talent and inspire productivity, efficiency, creativity, and success. Class A properties generally command higher annual rental rates than other classes of similar properties.
AAA locations are in close proximity to concentrations of specialized skills, knowledge, institutions, and related businesses. Such locations are generally characterized by high barriers to entry for new landlords, high barriers to exit for tenants, and a limited supply of available space.
Development, redevelopment, and pre-construction
A key component of our business model is our disciplined allocation of capital to the development and redevelopment of new Class A properties, and property enhancements identified during the underwriting of certain acquired properties, located in collaborative life science, technology, and agtech campuses in AAA urban innovation clusters. These projects are generally focused on providing high-quality, generic, and reusable spaces that meet the real estate requirements of, and are reusable by, a wide range of tenants. Upon completion, each value-creation project is expected to generate a significant increase in rental income, net operating income, and cash flows. Our development and redevelopment projects are generally in locations that are highly desirable to high-quality entities, which we believe results in higher occupancy levels, longer lease terms, higher rental income, higher returns, and greater long-term asset value.
Development projects generally consist of the ground-up development of generic and reusable facilities. Redevelopment projects consist of the permanent change in use of office, warehouse, and shell space into office/laboratory, tech office, or agtech space. We generally will not commence new development projects for aboveground construction of new Class A office/laboratory, tech office, and agtech space without first securing significant pre-leasing for such space, except when there is solid market demand for high-quality Class A properties.
Pre-construction activities include entitlements, permitting, design, site work, and other activities preceding commencement of construction of aboveground building improvements. The advancement of pre-construction efforts is focused on reducing the time required to deliver projects to prospective tenants. These critical activities add significant value for future ground-up development and are required for the vertical construction of buildings. Ultimately, these projects will provide high-quality facilities and are expected to generate significant revenue and cash flows.
Development, redevelopment, and pre-construction spending also includes the following costs: (i) certain tenant improvements and renovations that will be reimbursed, (ii) amounts to bring certain acquired properties up to market standard and/or other costs identified during the acquisition process (generally within two years of acquisition), and (iii) permanent conversion of space for highly flexible, move-in-ready office/laboratory space to foster the growth of promising early- and growth-stage life science companies.
Revenue-enhancing and repositioning capital expenditures represent spending to reposition or significantly change the use of property, including through improvement in the asset quality from Class B to Class A.
Non-revenue-enhancing capital expenditures represent costs required to maintain the current revenues of a stabilized property, including the associated costs for renewed and re-leased space.
Dividend payout ratio (common stock)
Dividend payout ratio (common stock) is the ratio of the absolute dollar amount of dividends on our common stock (shares of common stock outstanding on the respective record dates multiplied by the related dividend per share) to funds from operations attributable to Alexandria’s common stockholders – diluted, as adjusted.
Dividend yield
Dividend yield for the quarter represents the annualized quarter dividend divided by the closing common stock price at the end of the quarter.
Fixed-charge coverage ratio
Fixed-charge coverage ratio is a non-GAAP financial measure representing the ratio of Adjusted EBITDA to fixed charges. We believe this ratio is useful to investors as a supplemental measure of our ability to satisfy fixed financing obligations and preferred stock dividends. Cash interest is equal to interest expense calculated in accordance with GAAP plus capitalized interest, less amortization of loan fees and debt premiums (discounts).
The following table reconciles interest expense, the most directly comparable financial measure calculated and presented in accordance with GAAP, to cash interest and fixed charges:
| | | | | | | | | | | | | | | | | | | | | | | | | | | | | |
| | Three Months Ended | | | | | | | | |
| (Dollars in thousands) | 6/30/20 | | 3/31/20 | | 12/31/19 | | 9/30/19 | | 6/30/19 |
| Adjusted EBITDA | $ | 313,461 | | | $ | 309,754 | | | $ | 287,155 | | | $ | 274,977 | | | $ | 265,764 | |
| | | | | | | | | |
| Interest expense | $ | 45,014 | | | $ | 45,739 | | | $ | 45,493 | | | $ | 46,203 | | | $ | 42,879 | |
| Capitalized interest | 30,793 | | | 24,680 | | | 23,822 | | | 24,558 | | | 21,674 | |
| Amortization of loan fees | (2,737) | | | (2,247) | | | (2,241) | | | (2,251) | | | (2,380) | |
| Amortization of debt premiums | 888 | | | 888 | | | 907 | | | 1,287 | | | 782 | |
| Cash interest | 73,958 | | | 69,060 | | | 67,981 | | | 69,797 | | | 62,955 | |
| Dividends on preferred stock | — | | | — | | | — | | | 1,173 | | | 1,005 | |
| Fixed charges | $ | 73,958 | | | $ | 69,060 | | | $ | 67,981 | | | $ | 70,970 | | | $ | 63,960 | |
| | | | | | | | | |
| Fixed-charge coverage ratio: | | | | | | | | | |
| – quarter annualized | 4.2x | | 4.5x | | 4.2x | | 3.9x | | 4.2x |
| – trailing 12 months | 4.2x | | 4.2x | | 4.2x | | 4.1x | | 4.2x |
| | | | | | | | | |
| | | | | |
| |
| |
| Definitions and Reconciliations (continued) | |
| June 30, 2020 | |
| |
Funds from operations and funds from operations, as adjusted, attributable to Alexandria’s common stockholders
GAAP-basis accounting for real estate assets utilizes historical cost accounting and assumes that real estate values diminish over time. In an effort to overcome the difference between real estate values and historical cost accounting for real estate assets, the Nareit Board of Governors established funds from operations as an improved measurement tool. Since its introduction, funds from operations has become a widely used non-GAAP financial measure among equity REITs. We believe that funds from operations is helpful to investors as an additional measure of the performance of an equity REIT. Moreover, we believe that funds from operations, as adjusted, allows investors to compare our performance to the performance of other real estate companies on a consistent basis, without having to account for differences recognized because of real estate investment and disposition decisions, financing decisions, capital structure, capital market transactions, and variances resulting from the volatility of market conditions outside of our control. On January 1, 2019, we adopted standards established by the Nareit Board of Governors in its November 2018 White Paper (the “Nareit White Paper”) on a prospective basis. The Nareit White Paper defines funds from operations as net income (computed in accordance with GAAP), excluding gains or losses on sales of real estate, and impairments of real estate, plus depreciation and amortization of operating real estate assets, and after adjustments for our share of consolidated and unconsolidated partnerships and real estate joint ventures. Impairments represent the write-down of assets when fair value over the recoverability period is less than the carrying value due to changes in general market conditions and do not necessarily reflect the operating performance of the properties during the corresponding period.
We compute funds from operations, as adjusted, as funds from operations calculated in accordance with the Nareit White Paper, excluding significant gains, losses, and impairments realized on non-real estate investments, unrealized gains or losses on non-real estate investments, gains or losses on early extinguishment of debt, gains or losses on early termination of interest rate hedge agreements, preferred stock redemption charges, deal costs, the income tax effect related to such items, and the amount of such items that is allocable to our unvested restricted stock awards. Neither funds from operations nor funds from operations, as adjusted, should be considered as alternatives to net income (determined in accordance with GAAP) as indications of financial performance, or to cash flows from operating activities (determined in accordance with GAAP) as measures of liquidity, nor are they indicative of the availability of funds for our cash needs, including our ability to make distributions.
The following table reconciles net income to funds from operations for the share of consolidated real estate joint ventures attributable to noncontrolling interests and our share of unconsolidated real estate joint ventures:
| | | | | | | | | | | | | | | | | | | | | | | |
| | | | | | | |
| Noncontrolling Interest Share of Consolidated Real Estate JVs | | | | Our Share of Unconsolidated
Real Estate JVs | | |
| June 30, 2020 | | | | June 30, 2020 | | |
| (In thousands) | Three Months Ended | | Six Months Ended | | Three Months Ended | | Six Months Ended |
| Net income | $ | 13,907 | | | $ | 25,820 | | | $ | 3,893 | | | $ | 777 | |
| Depreciation and amortization | 15,775 | | | 31,645 | | | 2,858 | | | 5,501 | |
| Impairment of real estate | — | | | — | | | — | | | 7,644 | |
| Funds from operations | $ | 29,682 | | | $ | 57,465 | | | $ | 6,751 | | | $ | 13,922 | |
Initial stabilized yield (unlevered)
Initial stabilized yield is calculated as the estimated amounts of net operating income at stabilization divided by our investment in the property. Our initial stabilized yield excludes the benefit of leverage. Our cash rents related to our value-creation projects are generally expected to increase over time due to contractual annual rent escalations. Our estimates for initial stabilized yields, initial stabilized yields (cash basis), and total costs at completion represent our initial estimates at the commencement of the project. We expect to update this information upon completion of the project, or sooner if there are significant changes to the expected project yields or costs.
•Initial stabilized yield reflects rental income, including contractual rent escalations and any rent concessions over the term(s) of the lease(s), calculated on a straight-line basis.
•Initial stabilized yield (cash basis) reflects cash rents at the stabilization date after initial rental concessions, if any, have elapsed and our total cash investment in the property.
Investment-grade or publicly traded large cap tenants
Investment-grade or publicly traded large cap tenants represent tenants that are investment-grade rated or publicly traded companies with an average daily market capitalization greater than $10 billion for the twelve months ended June 30, 2020, as reported by Bloomberg Professional Services. In addition, we monitor the credit quality and related material changes of our tenants. Material changes that cause a tenant’s market capitalization to decline below $10 billion, which are not immediately reflected in the twelve-month average, may result in their exclusion from this measure.
Investments
We hold investments in publicly traded companies and privately held entities primarily involved in the life science, technology, and agtech industries. We recognize, measure, present, and disclose these investments as follows:
| | | | | | | | | | | | | | | | | | | | |
| | | | Statements of Operations | | |
| | Balance Sheet | | Gains and Losses | | |
| | Carrying Amount | | Unrealized | | Realized |
| | | | | | |
| | | | | | Difference between proceeds received upon disposition and historical cost |
| Publicly traded companies | | Fair value | | Changes in fair value | | |
| Privately held entities without readily determinable fair values that: | | | | | | |
| Report NAV | | Fair value, using NAV as a practical expedient | | Changes in NAV, as a practical expedient to fair value | | |
| | | | | | |
| | | | | | |
| Do not report NAV | | Cost, adjusted for observable price changes and impairments | | Observable price changes | | Impairments to reduce costs to fair value, which result in an adjusted cost basis and the differences between proceeds received upon disposition and adjusted or historical cost |
| | | | | |
| |
| |
| Definitions and Reconciliations (continued) | |
| June 30, 2020 | |
| |
For investments in privately held entities that do not report NAV per share, an observable price is a price observed in an orderly transaction for an identical or similar investment of the same issuer. Observable price changes result from, among other things, equity transactions for the same issuer executed during the reporting period, including subsequent equity offerings or other reported equity transactions related to the same issuer. For these transactions to be considered observable price changes of the same issuer, we evaluate whether these transactions have similar rights and obligations, including voting rights, distribution preferences, conversion rights, and other factors, to the investments we hold.
Investments in real estate
The following table reconciles our investments in real estate as of June 30, 2020:
| | | | | | | | | | | |
| (In thousands) | | Investments in Real Estate | |
| Gross investments in real estate | | $ | 19,218,619 | | |
| | | |
| Less: accumulated depreciation | | (2,967,150) | | |
| Net investments in real estate – North America | | 16,251,469 | | |
| Net investments in real estate – Asia | | 29,656 | | |
| Investments in real estate | | $ | 16,281,125 | | |
The following table represents RSF of buildings in operation as of June 30, 2020, that will be redeveloped or replaced with new development RSF upon commencement of future construction:
| | | | | | | | | | | |
| Property/Submarket | | RSF | |
| Intermediate-term projects: | | | |
| 651 Gateway Boulevard/South San Francisco | | 300,010 | | |
| 3825 Fabian Way/Greater Stanford | | 250,000 | | |
| 960 Industrial Road/Greater Stanford | | 110,000 | | |
| 10931 and 10933 North Torrey Pines Road/Torrey Pines | | 92,450 | | |
| 10260 Campus Point Drive/University Town Center | | 109,164 | | |
| 9363 and 9393 Towne Centre Drive/University Town Center | | 71,961 | | |
| 4555 Executive Drive/University Town Center | | 41,475 | | |
| | 975,060 | | |
| Future projects: | | | |
| 3875 Fabian Way/Greater Stanford | | 228,000 | | |
| 987 and 1075 Commercial Street/Greater Stanford | | 26,738 | | |
| 219 East 42nd Street/New York City | | 349,947 | | |
| 4161 Campus Point Court/University Town Center | | 159,884 | | |
| 4110 Campus Point Court/University Town Center | | 12,375 | | |
| 4075 Sorrento Valley Boulevard/Sorrento Valley | | 40,000 | | |
| 4045 Sorrento Valley Boulevard/Sorrento Valley | | 10,926 | | |
| 601 Dexter Avenue North/Lake Union | | 18,680 | | |
| | 846,550 | | |
| Total value-creation RSF currently included in rental properties | | 1,821,610 | | |
Joint venture financial information
We present components of balance sheet and operating results information related to our real estate joint ventures, which are not presented, or intended to be presented, in accordance with GAAP. We present the proportionate share of certain financial line items as follows: (i) for each real estate joint venture that we consolidate in our financial statements, which are controlled by us through contractual rights or majority voting rights, but of which we own less than 100%, we apply the noncontrolling interest economic ownership percentage to each financial item to arrive at the amount of such cumulative noncontrolling interest share of each component presented; and (ii) for each real estate joint venture that we do not control and do not consolidate, and are instead controlled jointly or by our joint venture partners through contractual rights or majority voting rights, we apply our economic ownership percentage to each financial item to arrive at our proportionate share of each component presented.
The components of balance sheet and operating results information related to our real estate joint ventures do not represent our legal claim to those items. For each entity that we do not wholly own, the joint venture agreement generally determines what equity holders can receive upon capital events, such as sales or refinancing, or in the event of a liquidation. Equity holders are normally entitled to their respective legal ownership of any residual cash from a joint venture only after all liabilities, priority distributions, and claims have been repaid or satisfied.
We believe this information can help investors estimate the balance sheet and operating results information related to our partially owned entities. Presenting this information provides a perspective not immediately available from consolidated financial statements and one that can supplement an understanding of the joint venture assets, liabilities, revenues, and expenses included in our consolidated results.
The components of balance sheet and operating results information related to our real estate joint ventures are limited as an analytical tool as the overall economic ownership interest does not represent our legal claim to each of our joint ventures’ assets, liabilities, or results of operations. In addition, joint venture financial information may include financial information related to the unconsolidated real estate joint ventures that we do not control. We believe that in order to facilitate for investors a clear understanding of our operating results and our total assets and liabilities, joint venture financial information should be examined in conjunction with our consolidated statements of operations and balance sheets. Joint venture financial information should not be considered an alternative to our consolidated financial statements, which are prepared in accordance with GAAP.
Key items included in net income attributable to Alexandria’s common stockholders
We present a tabular comparison of items, whether gain or loss, that may facilitate a high-level understanding of our results and provide context for the disclosures included in this Supplemental Information, our most recent annual report on Form 10-K, and our subsequent quarterly reports on Form 10-Q. We believe such tabular presentation promotes a better understanding for investors of the corporate-level decisions made and activities performed that significantly affect comparison of our operating results from period to period. We also believe this tabular presentation will supplement for investors an understanding of our disclosures and real estate operating results. Gains or losses on sales of real estate and impairments of held for sale assets are related to corporate-level decisions to dispose of real estate. Gains or losses on early extinguishment of debt, gains or losses on early termination of interest rate hedge agreements, and preferred stock redemption charges are related to corporate-level financing decisions focused on our capital structure strategy. Significant realized and unrealized gains or losses on non-real estate investments and impairments of real estate and non-real estate investments are not related to the operating performance of our real estate assets as they result from strategic, corporate-level non-real estate investment decisions and external market conditions. Impairments of non-real estate investments are not related to the operating performance of our real estate as they
| | | | | |
| |
| |
| Definitions and Reconciliations (continued) | |
| June 30, 2020 | |
| |
represent the write-down of non-real estate investments when their fair values decline below their respective carrying values due to changes in general market or other conditions outside of our control. Significant items, whether a gain or loss, included in the tabular disclosure for current periods are described in further detail in this Supplemental Information.
Lease accounting
On January 1, 2019, we adopted new lease accounting standards that set out the principles for the recognition, measurement, presentation, and disclosure of leases for both parties to a lease agreement (i.e., lessees and lessors). The new lease accounting standards did not result in material changes in neither the amount nor the timing of lease-related revenues that we recognized from our tenants. However, the new standards affected our financial statement presentation primarily in three specific areas.
Key differences between the prior accounting standard and the new lease accounting standards:
Prior to January 1, 2019, we classified rental revenues and tenant recoveries as separate line items on our consolidated statements of operations. Effective January 1, 2019, based on our election of a practical expedient, we are required to disclose the combined components of rental revenues and tenant recoveries as a single lease component, which is classified on our consolidated statements of operations as income from rentals. As a result, we do not disclose tenant recoveries as a separate GAAP revenue measure. Refer to the definition of tenant recoveries below for additional details on tenant recoveries revenue and its usefulness to investors.
The new lease accounting standard requires that lessors and lessees capitalize, as initial direct costs, only incremental costs of a lease that would not have been incurred if the lease had not been obtained. Effective January 1, 2019, costs that we incur to negotiate or arrange a lease, regardless of its outcome, such as for fixed employee compensation, tax, or legal advice to negotiate lease terms, and other costs, are expensed as incurred.
Under the package of practical expedients and optional transition method that we elected on January 1, 2019, we are not required to reassess whether initial direct leasing costs capitalized prior to the adoption of the new lease accounting standard in connection with the leases that commenced prior to January 1, 2019, qualify for capitalization under the new lease accounting standard. Therefore, we continue to amortize these initial direct leasing costs over the respective lease term.
In addition, the new lease accounting standards require companies to recognize a lease liability and a corresponding right-of-use asset on the consolidated balance sheets, and to represent the net present value of future rental payments related to operating leases in which we are the lessee. As a result, on January 1, 2019, we recognized a lease liability classified in accounts payable, accrued expenses, and other liabilities on our consolidated balance sheets, and a corresponding right-of-use asset included in other assets on our consolidated balance sheets, related to our ground leases existing as of January 1, 2019, for which we are the lessee. The net present value of the remaining future rental payments of our ground leases was calculated for each operating lease using the respective remaining lease term and a corresponding estimated incremental borrowing rate, which is the estimated interest rate that we would have to pay to borrow on a collateralized basis over a similar term for an amount equal to the lease payments.
Net cash provided by operating activities after dividends
Net cash provided by operating activities after dividends includes the deduction for distributions to noncontrolling interests. For purposes of this calculation, changes in operating assets and liabilities are excluded as they represent timing differences.
Net debt to Adjusted EBITDA and net debt and preferred stock to Adjusted EBITDA
Net debt to Adjusted EBITDA and net debt and preferred stock to Adjusted EBITDA are non-GAAP financial measures that we believe are useful to investors as supplemental measures in evaluating our balance sheet leverage. Net debt is equal to the sum of total consolidated debt less cash, cash equivalents, and restricted cash. Net debt and preferred stock is equal to the sum of net debt, as discussed above, plus preferred stock outstanding as of the end of the period. Refer to the definition of Adjusted EBITDA and Adjusted EBITDA margin for further information on the calculation of Adjusted EBITDA.
The following table reconciles debt to net debt, and to net debt and preferred stock, and computes the ratio of each to Adjusted EBITDA:
| | | | | | | | | | | | | | | | | | | | | | | | | | | | | | | | |
| (Dollars in thousands) | | 6/30/20 | | 3/31/20 | | 12/31/19 | | 9/30/19 | | 6/30/19 |
| Secured notes payable | | $ | 344,784 | | | $ | 347,136 | | | $ | 349,352 | | | $ | 351,852 | | | $ | 354,186 | |
| Unsecured senior notes payable | | 6,738,486 | | | 6,736,999 | | | 6,044,127 | | | 6,042,831 | | | 5,140,914 | |
| Unsecured senior lines of credit | | 440,000 | | | 221,000 | | | 384,000 | | | 343,000 | | | 514,000 | |
| Unsecured senior bank term loan | | — | | | — | | | — | | | — | | | 347,105 | |
| Unamortized deferred financing costs | | 52,175 | | | 53,807 | | | 47,299 | | | 48,746 | | | 36,905 | |
| Cash and cash equivalents | | (206,860) | | | (445,255) | | | (189,681) | | | (410,675) | | | (198,909) | |
| Restricted cash | | (34,680) | | | (43,116) | | | (53,008) | | | (42,295) | | | (39,316) | |
| Net debt | | $ | 7,333,905 | | | $ | 6,870,571 | | | $ | 6,582,089 | | | $ | 6,333,459 | | | $ | 6,154,885 | |
| | | | | | | | | | |
| Net debt | | $ | 7,333,905 | | | $ | 6,870,571 | | | $ | 6,582,089 | | | $ | 6,333,459 | | | $ | 6,154,885 | |
| 7.00% Series D Convertible Preferred Stock | | — | | | — | | | — | | | 57,461 | | | 57,461 | |
| Net debt and preferred stock | | $ | 7,333,905 | | | $ | 6,870,571 | | | $ | 6,582,089 | | | $ | 6,390,920 | | | $ | 6,212,346 | |
| | | | | | | | | | |
| Adjusted EBITDA: | | | | | | | | | | |
| – quarter annualized | | $ | 1,253,844 | | | $ | 1,239,016 | | | $ | 1,148,620 | | | $ | 1,099,908 | | | $ | 1,063,056 | |
| – trailing 12 months | | $ | 1,185,347 | | | $ | 1,137,650 | | | $ | 1,085,382 | | | $ | 1,040,449 | | | $ | 1,004,724 | |
| Net debt to Adjusted EBITDA: | | | | | | | | | | |
| – quarter annualized | | 5.8x | | | 5.5x | | | 5.7x | | | 5.8x | | | 5.8x | |
| – trailing 12 months | | 6.2x | | | 6.0x | | | 6.1x | | | 6.1x | | | 6.1x | |
| Net debt and preferred stock to Adjusted EBITDA: | | | | | | | | | | |
| – quarter annualized | | 5.8x | | | 5.5x | | | 5.7x | | | 5.8x | | | 5.8x | |
| – trailing 12 months | | 6.2x | | | 6.0x | | | 6.1x | | | 6.1x | | | 6.2x | |
| | | | | | | | | | |
| | | | | |
| |
| |
| Definitions and Reconciliations (continued) | |
| June 30, 2020 | |
| |
Net operating income, net operating income (cash basis), and operating margin
The following table reconciles net income to net operating income, and to net operating income (cash basis):
| | | | | | | | | | | | | | | | | | | | | | | | | | |
| | Three Months Ended | | | | Six Months Ended | | |
| (Dollars in thousands) | | 6/30/20 | | 6/30/19 | | 6/30/20 | | 6/30/19 |
| Net income | | $ | 243,561 | | | $ | 87,179 | | | $ | 274,239 | | | $ | 223,997 | |
| | | | | | | | |
| Equity in earnings of unconsolidated real estate joint ventures | | (3,893) | | | (1,262) | | | (777) | | | (2,408) | |
| General and administrative expenses | | 31,775 | | | 26,434 | | | 63,738 | | | 51,111 | |
| Interest expense | | 45,014 | | | 42,879 | | | 90,753 | | | 81,979 | |
| Depreciation and amortization | | 168,027 | | | 134,437 | | | 343,523 | | | 268,524 | |
| Impairment of real estate | | 13,218 | |
| — | | | 15,221 | | | — | |
| Loss on early extinguishment of debt | | — | | | — | | | — | | | 7,361 | |
| Investment income | | (184,657) | | | (21,500) | | | (162,836) | | | (105,056) | |
| Net operating income | | 313,045 | | | 268,167 | | | 623,861 | | | 525,508 | |
| Straight-line rent revenue | | (23,367) | | | (25,476) | | | (43,964) | | | (52,441) | |
| Amortization of acquired below-market leases | | (13,787) | | | (8,054) | | | (29,751) | | | (15,202) | |
| Net operating income (cash basis) | | $ | 275,891 | | | $ | 234,637 | | | $ | 550,146 | | | $ | 457,865 | |
| | | | | | | | |
Net operating income (cash basis) – annualized | | $ | 1,103,564 | | | $ | 938,548 | | | $ | 1,100,292 | | | $ | 915,730 | |
| | | | | | | | |
| Net operating income (from above) | | $ | 313,045 | | | $ | 268,167 | | | $ | 623,861 | | | $ | 525,508 | |
| Total revenues | | $ | 436,956 | | | $ | 373,856 | | | $ | 876,875 | | | $ | 732,698 | |
| Operating margin | | 72% | | 72% | | 71% | | 72% |
Net operating income is a non-GAAP financial measure calculated as net income, the most directly comparable financial measure calculated and presented in accordance with GAAP, excluding equity in the earnings of our unconsolidated real estate joint ventures, general and administrative expenses, interest expense, depreciation and amortization, impairments of real estate, gains or losses on early extinguishment of debt, gains or losses on sales of real estate, and investment income or loss. We believe net operating income provides useful information to investors regarding our financial condition and results of operations because it primarily reflects those income and expense items that are incurred at the property level. Therefore, we believe net operating income is a useful measure for investors to evaluate the operating performance of our consolidated real estate assets. Net operating income on a cash basis is net operating income adjusted to exclude the effect of straight-line rent and amortization of acquired above- and below-market lease revenue adjustments required by GAAP. We believe that net operating income on a cash basis is helpful to investors as an additional measure of operating performance because it eliminates straight-line rent revenue and the amortization of acquired above- and below-market leases.
Furthermore, we believe net operating income is useful to investors as a performance measure for our consolidated properties because, when compared across periods, net operating income reflects trends in occupancy rates, rental rates, and operating costs, which provide a perspective not immediately apparent from net income or loss. Net operating income can be used to measure the initial stabilized yields of our properties by calculating net operating income generated by a property divided by our investment in the property. Net operating income excludes certain components from net income in
order to provide results that are more closely related to the results of operations of our properties. For example, interest expense is not necessarily linked to the operating performance of a real estate asset and is often incurred at the corporate level rather than at the property level. In addition, depreciation and amortization, because of historical cost accounting and useful life estimates, may distort comparability of operating performance at the property level. Impairments of real estate have been excluded in deriving net operating income because we do not consider impairments of real estate to be property-level operating expenses. Impairments of real estate relate to changes in the values of our assets and do not reflect the current operating performance with respect to related revenues or expenses. Our impairments of real estate represent the write-down in the value of the assets to the estimated fair value less cost to sell. These impairments result from investing decisions or a deterioration in market conditions. We also exclude realized and unrealized investment income or loss, which results from investment decisions that occur at the corporate level related to non-real estate investments in publicly traded companies and certain privately held entities. Therefore, we do not consider these activities to be an indication of operating performance of our real estate assets at the property level. Our calculation of net operating income also excludes charges incurred from changes in certain financing decisions, such as losses on early extinguishment of debt, as these charges often relate to corporate strategy. Property operating expenses included in determining net operating income primarily consist of costs that are related to our operating properties, such as utilities, repairs, and maintenance; rental expense related to ground leases; contracted services, such as janitorial, engineering, and landscaping; property taxes and insurance; and property-level salaries. General and administrative expenses consist primarily of accounting and corporate compensation, corporate insurance, professional fees, office rent, and office supplies that are incurred as part of corporate office management. We calculate operating margin as net operating income divided by total revenues.
We believe that in order to facilitate for investors a clear understanding of our operating results, net operating income should be examined in conjunction with net income or loss as presented in our consolidated statements of operations. Net operating income should not be considered as an alternative to net income or loss as an indication of our performance, nor as an alternative to cash flows as a measure of our liquidity or our ability to make distributions.
Operating statistics
We present certain operating statistics related to our properties, including number of properties, RSF, occupancy percentage, leasing activity, and contractual lease expirations as of the end of the period. We believe these measures are useful to investors because they facilitate an understanding of certain trends for our properties. We compute the number of properties, RSF, occupancy percentage, leasing activity, and contractual lease expirations at 100% for all properties in which we have an investment, including properties owned by our consolidated and unconsolidated real estate joint ventures. For operating metrics based on annual rental revenue, refer to our discussion of annual rental revenue herein.
Same property comparisons
As a result of changes within our total property portfolio during the comparative periods presented, including changes from assets acquired or sold, properties placed into development or redevelopment, and development or redevelopment properties recently placed into service, the consolidated total income from rentals, as well as rental operating expenses in our operating results, can show significant changes from period to period. In order to supplement an evaluation of our results of operations over a given quarterly or annual period, we analyze the operating performance for all consolidated properties that were fully operating for the entirety of the comparative periods presented, referred to as same properties. We separately present quarterly and year-to-date same property results to align with the interim financial information required by the SEC in our management’s discussion and analysis of our financial condition and results of operations. These same properties are analyzed
| | | | | |
| |
| |
| Definitions and Reconciliations (continued) | |
| June 30, 2020 | |
| |
separately from properties acquired subsequent to the first day in the earliest comparable quarterly or year-to-date period presented, properties that underwent development or redevelopment at any time during the comparative periods, unconsolidated real estate joint ventures, properties classified as held for sale, and corporate entities (legal entities performing general and administrative functions), which are excluded from same property results. Additionally, lease termination fees, if any, are excluded from the results of same properties.
The following table reconciles the number of same properties to total properties for the six months ended June 30, 2020:
| | | | | | | | | | | | | | | | | | | | | | | |
| Development – under construction | | Properties | | Acquisitions after January 1, 2019 | | Properties | |
| 9804 Medical Center Drive | | 1 | | | 25, 35, and 45 West Watkins Mill | | | |
| 9950 Medical Center Drive | | 1 | | | Road | | 3 | | |
| Alexandria District for Science | | | | 3170 Porter Drive | | 1 | | |
| and Technology | | 2 | | | Shoreway Science Center | | 2 | | |
| 201 Haskins Way | | 1 | | | 3911, 3931, and 4075 Sorrento Valley | | | |
| 1165 Eastlake Avenue East | | 1 | | | Boulevard | | 3 | | |
| 4150 Campus Point Court | | 1 | | | 260 Townsend Street | | 1 | | |
Alexandria Center® for AgTech, Phase II | | 1 | | | 5 Necco Street | | 1 | | |
| | 8 | | | 601 Dexter Avenue North | | 1 | | |
| | | | 4224/4242 Campus Point Court and | | | |
| Development – placed into | | | | 10210 Campus Point Drive | | 3 | | |
| service after January 1, 2019 | | Properties | | 3825 and 3875 Fabian Way | | 2 | | |
| 399 Binney Street | | 1 | | | SD Tech by Alexandria | | 11 | | |
| 279 East Grand Avenue | | 1 | | | The Arsenal on the Charles | | 6 | | |
| 188 East Blaine Street | | 1 | | | 275 Grove Street | | 1 | | |
| | 3 | | | 601, 611, and 651 Gateway | | | |
| | | | Boulevard | | 3 | | |
| | | | 3330 and 3412 Hillview Avenue | | 2 | | |
| Redevelopment – under construction | | Properties | | 9605 Medical Center Drive | | 1 | | |
Alexandria Center® – Long Island City | | 1 | | | 220 2nd Avenue South | | 1 | | |
| 945 Market Street | | 1 | | | 987 and 1075 Commercial Street | | 2 | | |
| 3160 Porter Drive | | 1 | | | 4555 Executive Drive | | 1 | | |
| The Arsenal on the Charles | | 5 | | | Other | | 8 | | |
| 9877 Waples Street | | 1 | | | | | 53 | | |
| | 9 | | | | | | |
| | | | Unconsolidated real estate JVs | | 6 | | |
| Redevelopment – placed into | | | | Properties held for sale | | 3 | | |
| service after January 1, 2019 | | Properties | | Total properties excluded from same | | | |
| Alexandria PARC | | 4 | | | properties | | 91 | | |
| 681 and 685 Gateway Boulevard | | 2 | | | Same properties | | 213 | | (1) |
| 266 and 275 Second Avenue | | 2 | | | Total properties in North America as of | | | |
Alexandria Center® for AgTech, Phase I | | 1 | | | June 30, 2020 | | 304 | | |
| | 9 | | | | | | |
| | | | | | | |
(1)Includes 9880 Campus Point Drive and 3545 Cray Court. The 9880 Campus Point Drive building was occupied through January 2018 and is currently in active development, and 3545 Cray Court is currently undergoing renovations.
Stabilized occupancy date
The stabilized occupancy date represents the estimated date on which the project is expected to reach occupancy of 95% or greater.
Tenant recoveries
Tenant recoveries represent revenues comprising reimbursement of real estate taxes, insurance, utilities, repairs and maintenance, common area expenses, and other operating expenses and earned in the period during which the applicable expenses are incurred and the tenant’s obligation to reimburse us arises.
We classify rental revenues and tenant recoveries generated through the leasing of real estate assets within revenue in income from rentals in our consolidated statements of operations. We provide investors with a separate presentation of rental revenues and tenant recoveries in “Same Property Performance” of this Supplemental Information because we believe it promotes investors’ understanding of our operating results. We believe that the presentation of tenant recoveries is useful to investors as a supplemental measure of our ability to recover operating expenses under our triple net leases, including recoveries of utilities, repairs and maintenance, insurance, property taxes, common area expenses, and other operating expenses, and of our ability to mitigate the effect to net income for any significant variability to components of our operating expenses.
The following table reconciles income from rentals to tenant recoveries:
| | | | | | | | | | | | | | | | | | | | | | | | | | | | | | | | | | | | | | | | | |
| Three Months Ended | | | | | | | | | | Six Months Ended | | |
| (In thousands) | 06/30/20 | | 03/31/20 | | 12/31/19 | | 09/30/19 | | 06/30/19 | | 6/30/20 | | 6/30/19 |
| Income from rentals | $ | 435,856 | | | $ | 437,605 | | | $ | 404,721 | | | $ | 385,776 | | | $ | 371,618 | | | $ | 873,461 | | | $ | 726,367 | |
| Rental revenues | (341,555) | | | (337,942) | | | (308,418) | | | (293,182) | | | (289,625) | | | (679,497) | | | (564,188) | |
| Tenant recoveries | $ | 94,301 | | | $ | 99,663 | | | $ | 96,303 | | | $ | 92,594 | | | $ | 81,993 | | | $ | 193,964 | | | $ | 162,179 | |
| | | | | | | | | | | | | |
Total equity capitalization
Total equity capitalization is equal to the sum of outstanding shares of 7.00% Series D cumulative convertible preferred stock (“Series D Convertible Preferred Stock”) and common stock multiplied by the related closing price of each class of security at the end of each period presented.
Total market capitalization
Total market capitalization is equal to the sum of total equity capitalization and total debt.
| | | | | |
| |
| |
| Definitions and Reconciliations (continued) | |
| June 30, 2020 | |
| |
Unencumbered net operating income as a percentage of total net operating income
Unencumbered net operating income as a percentage of total net operating income is a non-GAAP financial measure that we believe is useful to investors as a performance measure of the results of operations of our unencumbered real estate assets as it reflects those income and expense items that are incurred at the unencumbered property level. Unencumbered net operating income is derived from assets classified in continuing operations, which are not subject to any mortgage, deed of trust, lien, or other security interest, as of the period for which income is presented.
The following table summarizes unencumbered net operating income as a percentage of total net operating income:
| | | | | | | | | | | | | | | | | | | | | | | | | | | | | |
| | Three Months Ended | | | | | | | | |
| (Dollars in thousands) | 6/30/20 | | 3/31/20 | | 12/31/19 | | 9/30/19 | | 6/30/19 |
| Unencumbered net operating income | $ | 296,358 | | | $ | 295,001 | | | $ | 270,903 | | | $ | 259,128 | | | $ | 251,397 | |
| Encumbered net operating income | 16,687 | | | 15,815 | | | 15,359 | | | 14,906 | | | 16,770 | |
| Total net operating income | $ | 313,045 | | | $ | 310,816 | | | $ | 286,262 | | | $ | 274,034 | | | $ | 268,167 | |
| Unencumbered net operating income as a percentage of total net operating income | 95% | | 95% | | 95% | | 95% | | 94% |
Weighted-average interest rate for capitalization of interest
The weighted-average interest rate required for calculating capitalization of interest pursuant to GAAP represents a weighted-average rate based on the rates applicable to borrowings outstanding during the period, including expense/income related to interest rate hedge agreements, amortization of loan fees, amortization of debt premiums (discounts), and other bank fees. A separate calculation is performed to determine our weighted-average interest rate for capitalization for each month. The rate will vary each month due to changes in variable interest rates, outstanding debt balances, the proportion of variable-rate debt to fixed-rate debt, the amount and terms of interest rate hedge agreements, and the amount of loan fee and premium (discount) amortization.
The following table presents the weighted-average interest rate for capitalization of interest:
| | | | | | | | | | | | | | | | | | | | | | | | | | | | | |
| | Three Months Ended | | | | | | | | |
| 6/30/20 | | 3/31/20 | | 12/31/19 | | 9/30/19 | | 6/30/19 |
| Weighted-average interest rate for capitalization of interest | 4.03% | | 3.80% | | 3.88% | | 4.00% | | 4.14% |
Weighted-average shares of common stock outstanding – diluted
From time to time, we enter into capital market transactions, including forward equity sales agreements (“Forward Agreements”), to fund acquisitions, to fund construction of our highly leased development and redevelopment projects, and for general working capital purposes. We are required to consider the potential dilutive effect of our forward equity sales agreements under the treasury stock method while the forward equity sales agreements are outstanding. As of June 30, 2020, we had Forward Agreements outstanding to sell an aggregate of 3.5 million shares of common stock.
Prior to the conversion of our remaining outstanding shares in October 2019, we considered the effect of assumed conversion of our outstanding 7.00% Series D Convertible Preferred Stock when determining potentially dilutive incremental shares to our common stock. When calculating the assumed conversion, we add back to net income or loss the dividends paid on our Series D Convertible Preferred Stock to the numerator and then include additional common shares assumed to have been issued (as displayed in the table below) to the denominator of the per share calculation. The effect of the assumed conversion is considered separately for our per share calculations of net income or loss; funds from operations, computed in accordance with the definition in the Nareit White Paper; and funds from operations, as adjusted. Prior to the conversion of our remaining outstanding shares in October 2019, our Series D Convertible Preferred Stock was dilutive and assumed to be converted when quarterly and annual basic EPS, funds from operations, or funds from operations, as adjusted, exceeded approximately $1.75 and $7.00 per share, respectively, subject to conversion ratio adjustments and the impact of repurchases of our Series D Convertible Preferred Stock. The effect of the assumed conversion was included when it was dilutive on a per share basis. The dilutive effect to both numerator and denominator may result in a per share effect of less than a half cent, which would appear as zero in our per share calculation, even when the dilutive effect to the numerator alone appears in our reconciliation.
The weighted-average shares of common stock outstanding used in calculating EPS – diluted, FFO per share – diluted, and FFO per share – diluted, as adjusted, during each period are calculated as follows:
| | | | | | | | | | | | | | | | | | | | | | | | | | | | | | | | | | | | | | | | | |
| Three Months Ended | | | | | | | | | | Six Months Ended | | |
| (In thousands) | 6/30/20 | | 3/31/20 | | 12/31/19 | | 9/30/19 | | 6/30/19 | | 6/30/20 | | 6/30/19 |
| | | | | | | | | | | | | |
| Basic shares for EPS | 124,333 | | | 121,433 | | | 114,175 | | | 112,120 | | | 111,433 | | | 122,883 | | | 111,245 | |
| Forward Agreements | 115 | | | 352 | | | 761 | | | — | | | 68 | | | 234 | | | 34 | |
| Series D Convertible Preferred Stock | — | | | — | | | 38 | | | — | | | — | | | — | | | — | |
| Diluted shares for EPS | 124,448 | | | 121,785 | | | 114,974 | | | 112,120 | | | 111,501 | | | 123,117 | | | 111,279 | |
| | | | | | | | | | | | | |
| Basic shares for EPS | 124,333 | | | 121,433 | | | 114,175 | | | 112,120 | | | 111,433 | | | 122,883 | | | 111,245 | |
| Forward Agreements | 115 | | | 352 | | | 761 | | | 442 | | | 68 | | | 234 | | | 34 | |
| Series D Convertible Preferred Stock | — | | | — | | | 38 | | | — | | | 576 | | | — | | | 578 | |
| Diluted shares for FFO | 124,448 | | | 121,785 | | | 114,974 | | | 112,562 | | | 112,077 | | | 123,117 | | | 111,857 | |
| | | | | | | | | | | | | |
| Basic shares for EPS | 124,333 | | | 121,433 | | | 114,175 | | | 112,120 | | | 111,433 | | | 122,883 | | | 111,245 | |
| Forward Agreements | 115 | | | 352 | | | 761 | | | 442 | | | 68 | | | 234 | | | 34 | |
| Series D Convertible Preferred Stock | — | | | — | | | 38 | | | — | | | — | | | — | | | — | |
| Diluted shares for FFO, as adjusted | 124,448 | | | 121,785 | | | 114,974 | | | 112,562 | | | 111,501 | | | 123,117 | | | 111,279 | |