2023 Guidance
The following introduces our 2023 guidance based on our current view of existing market conditions and other assumptions for the year ending December 31, 2023. There can be no assurance that actual amounts will not be materially higher or lower than these expectations.
| | | | | | | | |
| Projected 2023 earnings per share and funds from operations per share attributable to Alexandria's common stockholders – diluted |
Earnings per share(1) | | $3.41 to $3.61 |
| Depreciation and amortization of real estate assets | | 5.50 |
| Allocation to unvested restricted stock awards | | (0.05) |
Funds from operations per share(2) | | $8.86 to $9.06 |
| Midpoint | | $8.96 |
| | |
(1)Excludes unrealized gains or losses after December 31, 2022, that are required to be recognized in earnings and are excluded from funds from operations per share, as adjusted.
(2)Refer to “Funds from operations and funds from operations, as adjusted, attributable to Alexandria’s common stockholders” in the “Definitions and Non-GAAP measures” section of this exhibit for additional details.
| | | | | | | | |
| Key credit metrics | | 2023 Guidance |
| Net debt and preferred stock to Adjusted EBITDA – 4Q23 annualized | | Less than or equal to 5.1x |
| Fixed-charge coverage ratio – 4Q23 annualized | | 4.5x to 5.0x |
Guidance ranges for 2023 rental rate increases on lease renewals and re-leasing of space
Our outlook for 2023 rental rate increases includes a mix of renewals and re-leasing of life science/laboratory spaces and non-life science/laboratory spaces. The table below provides additional information on our projected 2023 rental rate increases, including our guidance ranges for 2023 rental rate increases on lease renewals and re-leasing of space.
| | | | | | | | | | | | | | |
| | 2023 Rental rate increases | | 2023 Rental rate increases
(cash basis) |
| Space type: | | | | |
| Life science/laboratory spaces | | Approximately 40% | | Approximately 20% |
Non-life science/laboratory spaces(1) | | Approximately 10% | | Approximately 5% |
| | | | |
| Guidance ranges for 2023 rental rate increases on lease renewals and re-leasing of space | | 27.0% to 32.0% | | 11.0% to 16.0% |
| | | | |
(1)Approximately 30% of non-life science/laboratory spaces consist of future life science/laboratory conversion opportunities.
2023 Guidance (continued)
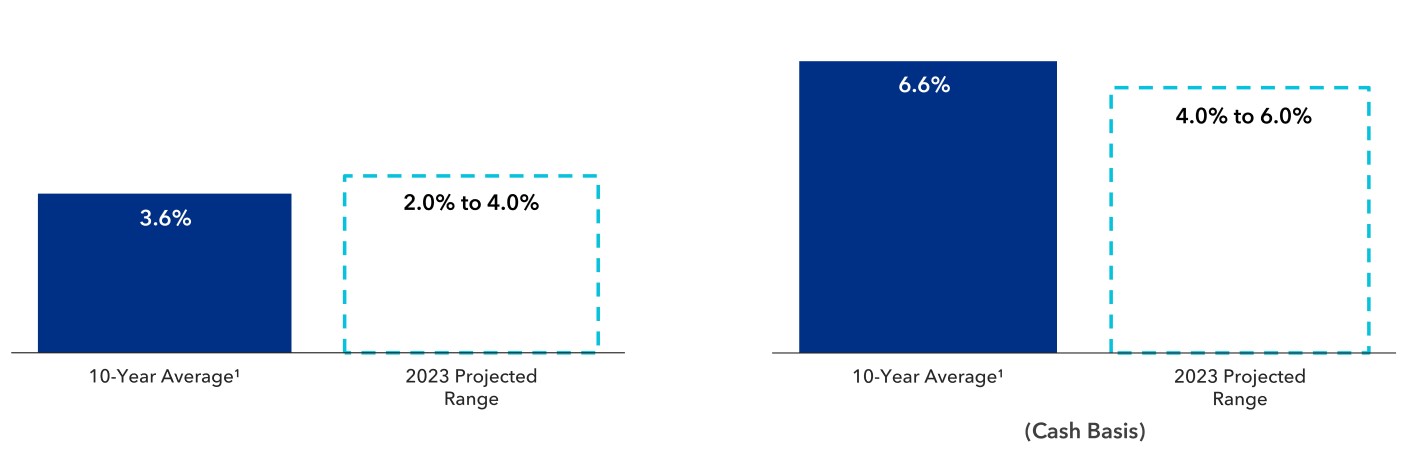
Guidance ranges for 2023 same property net operating income increases
The charts below summarize our historical and guidance ranges for 2023 same property net operating income increases.
(1)Represents the average same property net operating income and same property net operating income (cash basis) increases for each for the years ending December 31, 2013 through December 31, 2021 and the nine months ended September 30, 2022.
Same property occupancy for each of the years from 2017 to 2021 was high and stable, with no change in the average same property occupancy in each of the years within that same period. We expect 2023 same property occupancy to have no change compared to 2022 same property occupancy.
Other key 2023 guidance assumptions
| | | | | | | | | | | | | | |
| Other key assumptions (dollars in millions) | | Low | | High |
| Occupancy percentage in North America as of December 31, 2023 | | 94.8 | % | | 95.8 | % |
| Straight-line rent revenue | | $ | 130 | | | $ | 145 | |
| General and administrative expenses | | $ | 183 | | | $ | 193 | |
Capitalization of interest(1) | | $ | 342 | | | $ | 362 | |
| Interest expense | | $ | 74 | | | $ | 94 | |
| | | | |
(1)We expect capitalized interest to peak in the first half of 2023. See additional discussion below.
Non-real estate investments
Our venture investments are an integral component of our uniquely differentiated and multifaceted business strategy. As of September 30, 2022, our investments had a cost basis of $1.1 billion and had unrealized gains aggregating $529.0 million, of which $102.2 million were from our investments in publicly traded companies and $426.8 million were from our investments in privately held entities. From 4Q20 to 3Q22, our average realized gains included in funds from operations per share – diluted, as adjusted, was approximately $25 million. We expect the quarterly realized gains for 2023 be flat to slightly up when compared with the prior eight-quarter average.
2023 Guidance (continued)
Key 2023 sources and uses of capital
Our 2023 strategic capital plan continues to focus on balance sheet strength, flexibility, and liquidity, and includes the following:
•Maintain a fortress balance sheet with strong corporate credit ratings;
•Maintain significant liquidity and strong net debt and preferred stock to Adjusted EBITDA and fixed-charge coverage ratios;
•Continue to focus on the completion of our highly leased development and redevelopment projects; and
•Remain flexible and ready to adapt to the macroenvironment.
| | | | | | | | | | | | | | | | | | | | | | | |
| Key 2023 sources and uses of capital (in millions) | | Range | | Midpoint | |
| Sources of capital: | | | | | | | |
| Incremental debt | | $ | 650 | | | $ | 850 | | | $ | 750 | | |
| Excess 2022 bond capital expected to be held as cash at December 31, 2022 | | 200 | | | 300 | | | 250 | | |
| Net cash provided by operating activities after dividends | | 350 | | | 400 | | | 375 | | |
| Real estate dispositions, sales of partial interest, and common equity | | 1,400 | | | 2,400 | | | 1,900 | | |
| | | | | | | |
| Total sources of capital | | $ | 2,600 | | | $ | 3,950 | | | $ | 3,275 | | |
| Uses of capital: | | | | | | | |
| Construction | | $ | 2,400 | | | $ | 3,550 | | | $ | 2,975 | | |
| Acquisitions | | 200 | | | 400 | | | 300 | | |
| Total uses of capital | | $ | 2,600 | | | $ | 3,950 | | | $ | 3,275 | | |
| Incremental debt (included above): | | | | | | | |
| Issuance of unsecured senior notes payable | | $ | 500 | | | $ | 1,000 | | | $ | 750 | | |
| Unsecured senior line of credit, commercial paper program, and other | | 150 | | | (150) | | | — | | |
| Incremental debt | | $ | 650 | | | $ | 850 | | | $ | 750 | | |
| | | | | | | |
One of our primary uses of capital is construction spend related to the development, redevelopment, pre-construction, and construction of properties. We also incur additional project costs, including interest, property taxes, insurance, and other costs directly related and essential to the development, redevelopment, pre-construction, or construction of a project, during periods when activities necessary to prepare an asset for its intended use are in progress.
As of September 30, 2022, we had incurred construction costs aggregating $8.4 billion related to our under construction, near term, intermediate term, and future projects, including projects aggregating 7.6 million RSF under construction and seven near term projects of Class A life science/laboratory space that are 78% leased, which are expected to generate incremental annual net operating income of $645 million primarily commencing from the fourth quarter of 2022 through the third quarter of 2025. We expect that the total construction cost at completion, related to the aforementioned 7.6 million RSF, to aggregate $10.1 billion, comprising $4.4 billion in construction costs incurred through September 30, 2022, and $5.7 billion of additional costs to complete these projects.
| | | | | | | | | | | |
| Allocation of projected 2023 construction spend | | Percentage of total(1) | |
| | | |
| Construction of Class A properties: | | | |
| $645 million in incremental net operating income | | | |
Under construction and seven near term projects aggregating 7.6 million RSF (78% leased)(2) | | 67 | % | |
| Value-added pre-construction | | | |
| Primarily mega campus expansion pre-construction work (entitlement, design, and site work) | | 27 | | |
| Revenue and non-revenue-enhancing capital expenditures | | 6 | | |
| | 100 | % | |
| | | |
(1)Based on construction spend before contributions from noncontrolling interests (consolidated real estate joint ventures).
(2)As of September 30, 2022 and relates to projects aggregating 7.6 million RSF under construction and seven near-term projects of Class A life science/laboratory space that are 78% leased which are expected to generate incremental annual net operating income of $645 million primarily commencing from the fourth quarter of 2022 through the third quarter of 2025.
2023 Guidance (continued)
Our existing real estate joint ventures provide significant equity capital to fund a portion of our future construction spend. Over the next three years, we have $1.6 billion in contractual funding commitments from our existing consolidated real estate joint ventures. The chart below provides additional information on our guidance for 2023 construction spend, including projected contributions from noncontrolling interests.
| | | | | | | | | | | |
| Midpoint of guidance range for projected 2023 construction spend (in millions) | | Amount | |
| Development, redevelopments, and pre-construction projects | | $ | 3,610 | | |
| Contributions from noncontrolling interests (consolidated real estate joint ventures) | | (875) | | (1) |
| Revenue and non-revenue-enhancing capital expenditures | | 240 | | |
| | $ | 2,975 | | |
| | | |
(1)Approximately 55% of this amount represents contractual funding commitments from our existing consolidated real estate joint ventures.
Our projected 2023 capitalization of interest will be focused on value-added activities as noted in the table below.
| | | | | | | | | | | |
| Key components of projected 2023 capitalization of interest | | Percentage
of total | |
| | | |
| Construction of Class A properties: | | | |
| $645 million in incremental net operating income | | | |
Under construction and seven near term projects aggregating 7.6 million RSF (78% leased)(1) | | 43 | % | |
| Value-added pre-construction | | | |
| Primarily mega campus expansion pre-construction work (entitlement, design, and site work) | | 47 | | |
| Other | | 10 | | |
| | 100 | % | |
| | | |
(1)As of September 30, 2022 and relates to projects aggregating 7.6 million RSF under construction and seven near-term projects of Class A life science/laboratory space that are 78% leased which are expected to generate incremental annual net operating income of $645 million primarily commencing from the fourth quarter of 2022 through the third quarter of 2025.
We capitalize interest cost as a cost of the project only during the period for which activities necessary to prepare an asset for its intended use are ongoing, provided that expenditures for the asset have been made and interest cost has been incurred. Indirect project costs, including construction administration, legal fees, and office costs that clearly relate to projects under development or construction, are capitalized as incurred during the period an asset is undergoing activities to prepare it for its intended use. We also capitalize payroll and other indirect project costs related to development, redevelopment, pre-construction, and construction projects. Pre-construction activities include entitlements, permitting, design, site work, and other activities preceding commencement of construction of aboveground building improvements. The advancement of pre-construction efforts is focused on reducing the time required to deliver projects to prospective tenants. These critical activities add significant value for future ground-up development and are required for the vertical construction of buildings. Should we cease activities necessary to prepare an asset for its intended use, the interest, taxes, insurance, and certain other direct project costs related to this asset would be expensed as incurred. Expenditures for repairs and maintenance are expensed as incurred.
Definitions and Non-GAAP Measures
Adjusted EBITDA
We use Adjusted EBITDA as a supplemental performance measure of our operations, for financial and operational decision-making, and as a supplemental means of evaluating period-to-period comparisons on a consistent basis. Adjusted EBITDA is calculated as earnings before interest, taxes, depreciation, and amortization (“EBITDA”), excluding stock compensation expense, gains or losses on early extinguishment of debt, gains or losses on sales of real estate, impairments of real estate, and significant termination fees. Adjusted EBITDA also excludes unrealized gains or losses and significant realized gains and impairments that result from our non-real estate investments. These non-real estate investment amounts are classified in our consolidated statements of operations outside of revenues.
We believe Adjusted EBITDA provides investors with relevant and useful information as it allows investors to evaluate the operating performance of our business activities without having to account for differences recognized because of investing and financing decisions related to our real estate and non-real estate investments, our capital structure, capital market transactions, and variances resulting from the volatility of market conditions outside of our control. For example, we exclude gains or losses on the early extinguishment of debt to allow investors to measure our performance independent of our indebtedness and capital structure. We believe that adjusting for the effects of impairments and gains or losses on sales of real estate, significant impairments and realized gains or losses on non-real estate investments, and significant termination fees allows investors to evaluate performance from period to period on a consistent basis without having to account for differences recognized because of investing and financing decisions related to our real estate and non-real estate investments or other corporate activities that may not be representative of the operating performance of our properties.
Definitions and Non-GAAP Measures (continued)
In addition, we believe that excluding charges related to stock compensation and unrealized gains or losses facilitates for investors a comparison of our business activities across periods without the volatility resulting from market forces outside of our control. Adjusted EBITDA has limitations as a measure of our performance. Adjusted EBITDA does not reflect our historical expenditures or future requirements for capital expenditures or contractual commitments. While Adjusted EBITDA is a relevant measure of performance, it does not represent net income (loss) or cash flows from operations calculated and presented in accordance with GAAP, and it should not be considered as an alternative to those indicators in evaluating performance or liquidity.
Fixed-charge coverage ratio
Fixed-charge coverage ratio is a non-GAAP financial measure representing the ratio of Adjusted EBITDA to fixed charges. We believe this ratio is useful to investors as a supplemental measure of our ability to satisfy fixed financing obligations and preferred stock dividends. Cash interest is equal to interest expense calculated in accordance with GAAP plus capitalized interest, less amortization of loan fees and debt premiums (discounts).
Funds from operations and funds from operations, as adjusted, attributable to Alexandria’s common stockholders
GAAP-basis accounting for real estate assets utilizes historical cost accounting and assumes that real estate values diminish over time. In an effort to overcome the difference between real estate values and historical cost accounting for real estate assets, the Nareit Board of Governors established funds from operations as an improved measurement tool. Since its introduction, funds from operations has become a widely used non-GAAP financial measure among equity REITs. We believe that funds from operations is helpful to investors as an additional measure of the performance of an equity REIT. Moreover, we believe that funds from operations, as adjusted, allows investors to compare our performance to the performance of other real estate companies on a consistent basis, without having to account for differences recognized because of real estate acquisition and disposition decisions, financing decisions, capital structure, capital market transactions, variances resulting from the volatility of market conditions outside of our control, or other corporate activities that may not be representative of the operating performance of our properties.
The 2018 White Paper published by the Nareit Board of Governors (the “Nareit White Paper”) defines funds from operations as net income (computed in accordance with GAAP), excluding gains or losses on sales of real estate, and impairments of real estate, plus depreciation and amortization of operating real estate assets, and after adjustments for our share of consolidated and unconsolidated partnerships and real estate joint ventures. Impairments represent the write-down of assets when fair value over the recoverability period is less than the carrying value due to changes in general market conditions and do not necessarily reflect the operating performance of the properties during the corresponding period.
We compute funds from operations, as adjusted, as funds from operations calculated in accordance with the Nareit White Paper, excluding significant gains, losses, and impairments realized on non-real estate investments, unrealized gains or losses on non-real estate investments, gains or losses on early extinguishment of debt, significant termination fees, acceleration of stock compensation expense due to the resignation of an executive officer, deal costs, the income tax effect related to such items, and the amount of such items that is allocable to our unvested restricted stock awards. Neither funds from operations nor funds from operations, as adjusted, should be considered as alternatives to net income (determined in accordance with GAAP) as indications of financial performance, or to cash flows from operating activities (determined in accordance with GAAP) as measures of liquidity, nor are they indicative of the availability of funds for our cash needs, including our ability to make distributions.
Net cash provided by operating activities after dividends
Net cash provided by operating activities after dividends includes the deduction for distributions to noncontrolling interests. For purposes of this calculation, changes in operating assets and liabilities are excluded as they represent timing differences.
Net debt and preferred stock to Adjusted EBITDA
Net debt and preferred stock to Adjusted EBITDA is a non-GAAP financial measure that we believe is useful to investors as a supplemental measure of evaluating our balance sheet leverage. Net debt and preferred stock is equal to the sum of total consolidated debt less cash, cash equivalents, and restricted cash, plus preferred stock outstanding as of the end of the period. Refer to the definition of Adjusted EBITDA.
Definitions and Non-GAAP Measures (continued)
Net operating income and net operating income (cash basis)
Net operating income is a non-GAAP financial measure calculated as net income, the most directly comparable financial measure calculated and presented in accordance with GAAP, excluding equity in the earnings of our unconsolidated real estate joint ventures, general and administrative expenses, interest expense, depreciation and amortization, impairments of real estate, gains or losses on early extinguishment of debt, gains or losses on sales of real estate, and investment income or loss. We believe net operating income provides useful information to investors regarding our financial condition and results of operations because it primarily reflects those income and expense items that are incurred at the property level. Therefore, we believe net operating income is a useful measure for investors to evaluate the operating performance of our consolidated real estate assets. Net operating income on a cash basis is net operating income adjusted to exclude the effect of straight-line rent and amortization of acquired above- and below-market lease revenue adjustments required by GAAP. We believe that net operating income on a cash basis is helpful to investors as an additional measure of operating performance because it eliminates straight-line rent revenue and the amortization of acquired above- and below-market leases.
Operating statistics
We present certain operating statistics related to our properties, including number of properties, RSF, occupancy percentage, leasing activity, and contractual lease expirations as of the end of the period. We believe these measures are useful to investors because they facilitate an understanding of certain trends for our properties. We compute the number of properties, RSF, occupancy percentage, leasing activity, and contractual lease expirations at 100% for all properties in which we have an investment, including properties owned by our consolidated and unconsolidated real estate joint ventures.
Same property
Same property refers to all consolidated properties that were fully operating for the entirety of the comparative periods presented. Properties that underwent development or redevelopment at any time during the comparative periods, unconsolidated real estate joint ventures, properties classified as held for sale, and corporate entities (legal entities performing general and administrative functions) are excluded from same property results. Additionally, termination fees, if any, are excluded from the results of same properties.