Exhibit 99.2
| | 
SUPPLEMENTAL FINANCIAL, OPERATING,
& PROPERTY INFORMATION QUARTER ENDED MARCH 31, 2010 Conference Call Information: Thursday, April 29, 2010 3:00PM Eastern Time/12:00PM Noon Pacific Time Number: (719) 457-2668 Confirmation Code: 1945679 385 EAST COLORADO BOULEVARD, SUITE 299 PASADENA, CALIFORNIA 91101 (626) 578-9693 www.labspace.com |
ALEXANDRIA REAL ESTATE EQUITIES, INC.
Table of Contents
March 31, 2010
(Unaudited)
| Page |
Company Profile | | 3 |
Investor Information | | 4 |
Equity Research Coverage | | 5 |
First Quarter Ended March 31, 2010 Operating and Financial Results | | 6 |
Condensed Consolidated Income Statements | | 10 |
Condensed Consolidated Balance Sheets | | 11 |
Earnings per Share | | 12 |
Funds from Operations | | 13 |
Adjusted Funds from Operations | | 14 |
Financial and Asset Base Highlights | | 15 |
Debt Information | | 18 |
Summary of Occupancy Percentage and Properties | | 22 |
Same Property Comparisons | | 23 |
Summary of Leasing Activity | | 24 |
Summary of Lease Expirations | | 26 |
20 Largest Client Tenants | | 27 |
Client Tenant Mix | | 28 |
Summary of Additions and Dispositions of Properties | | 29 |
Real Estate and Value Added Activities | | 30 |
Summary of Capital Expenditures | | 35 |
Definitions and Other Information | | 36 |
This Supplemental Financial, Operating, & Property Information package includes “forward-looking statements” within the meaning of Section 27A of the Securities Act of 1933, as amended, and Section 21E of the Securities Exchange Act of 1934, as amended. You can identify the forward-looking statements by their use of forward-looking words, such as “believes,” “expects,” “may,” “will,” “should,” “seeks,” “approximately,” “intends,” “plans,” “estimates,” or “anticipates,” or the negative of those words or similar words. Our actual results may differ materially from those projected in such forward-looking statements. Factors that might cause such a difference include, without limitation, our failure to obtain capital (debt, construction financing, and/or equity) or refinance debt maturities, increased interest rates and operating costs, adverse economic or real estate developments in our markets, our failure to successfully complete and lease our existing space held for redevelopment and new properties acquired for that purpose and any properties undergoing development, our failure to successfully operate or lease acquired properties, decreased rental rates or increased vacancy rates or failure to renew or replace expiring leases, defaults on or non-renewal of leases by tenants, general and local economic conditions, and other risks and uncertainties detailed in our filings with the Securities and Exchange Commission (“SEC”). All forward-looking statements are made as of April 29, 2010, the date this Supplemental Financial, Operating, & Property Information package is first made available on our website, and we assume no obligation to update this information. For more discussion relating to risks and uncertainties that could cause actual results to differ materially from those anticipated in our forward-looking statements, and risks to our business in general, please refer to our SEC filings, including our most recent annual report on Form 10-K and any subsequent quarterly reports on Form 10-Q.
This Supplemental Financial, Operating, & Property Information package is not an offer to sell or solicitation to buy securities of Alexandria Real Estate Equities, Inc. Any offers to sell or solicitations to buy securities of Alexandria Real Estate Equities, Inc. shall be made only by means of a prospectus approved for that purpose. Unless otherwise indicated, the “Company,” “we,” “us,” and “our” refer to Alexandria Real Estate Equities, Inc. and its consolidated subsidiaries.
2
ALEXANDRIA REAL ESTATE EQUITIES, INC.
Company Profile
March 31, 2010
The Company
Alexandria Real Estate Equities, Inc. (the “Company” or “Alexandria”), a self-administered and self-managed real estate investment trust (“REIT”), is the largest owner and preeminent REIT focused principally on science-driven cluster formation. Our operating platform is based on the principle of “clustering” with assets and operations located in key life science markets. The Company has significant real estate assets adjacent to key life science entities which we believe results in higher occupancy levels, longer lease terms, and higher rental income and returns. These locations are in the best submarkets in each of the top life science cluster destinations, including San Francisco and San Diego, California, Eastern Massachusetts, New Jersey and Suburban Philadelphia, New York City, Southeast, Suburban Washington, D.C., Seattle, Washington, and international locations. Client tenants include institutional (universities and independent not-for-profit institutions), pharmaceutical, biotechnology, medical device, product, service, and translational entities, as well as government agencies. The Company was founded in 1994 by Jerry M. Sudarsky and Joel S. Marcus and the Company executed its initial public offering in 1997. Alexandria is well-known for its very well located high-quality environmentally sustainable real estate, technical infrastructure, and unique expertise it provides to its broad and diverse life science industry client tenant base.
Management
Alexandria’s executive and senior management team is highly experienced in the REIT industry (with both real estate and life science experience and expertise) and is the most accomplished team focused on providing high-quality environmentally sustainable real estate, technical infrastructure, and unique expertise to the broad and diverse life science industry. Our deep and talented team has decades of real estate and life science industry experience. We believe that our expertise, experience, reputation, and key life science relationships provide Alexandria significant competitive advantages in attracting new business opportunities. Our management team also includes highly experienced regional market directors each averaging over 20 years of real estate experience and over 10 years with Alexandria. Our regional market directors have tremendous experience and valuable relationships that enable Alexandria to develop long-term relationships with preeminent life science entities.
Strategy
Alexandria’s primary business objective is to maximize shareholder value by providing its shareholders and employees with the greatest possible total return. The key elements to our strategy include our consistent focus on the top life science cluster destinations with our properties located adjacent to life science entities driving growth and technological advances within each cluster. These adjacency locations are characterized by high barriers to entry, limited supply of available space, and represent highly desirable locations for tenancy by life science entities. Alexandria’s strategy also includes leveraging on its deep and broad life science and real estate relationships in order to attract new and leading life science client tenants and value added real estate opportunities through acquisitions, redevelopment, and development.
Summary (as of March 31, 2010)
Corporate headquarters | Pasadena, California | |
Markets | San Diego, San Francisco Bay, Eastern Massachusetts, New Jersey/Suburban Philadelphia,
New York City, Southeast, Suburban Washington, D.C., Seattle, and International | |
Fiscal year-end | December 31 | |
Total properties | 161 | |
Total rentable square feet | 12.7 million | |
Common shares outstanding | 43.9 million | |
Dividend – quarter/annualized | $0.35/$1.40 | |
Dividend yield | 2.1% | |
Total market capitalization | $6.1 billion | |
3
ALEXANDRIA REAL ESTATE EQUITIES, INC.
Investor Information
March 31, 2010
Executive/Senior Management |
| | | |
Joel S. Marcus | Chairman & Chief Executive Officer | Thomas J. Andrews | SVP-Regional Market Director-Massachusetts |
Dean A. Shigenaga | Chief Financial Officer & Treasurer | Vincent R. Ciruzzi | SVP-Construction and Development |
James H. Richardson | Director and Senior Management Consultant | John J. Cox | SVP-Regional Market Director-Seattle |
Peter J. Nelson | Corporate Secretary/Senior Management Consultant | John H. Cunningham | SVP-Regional Market Director-NY/Strategic Operations |
Jennifer J. Pappas | SVP-General Counsel/Assistant Secretary | Larry J. Diamond | SVP-Regional Market Director-Mid Atlantic |
Peter M. Moglia | Chief Investment Officer | Stephen A. Richardson | SVP-Regional Market Director-San Francisco Bay |
| | Jeff J. Ryan | SVP-Regional Market Director-San Diego |
Company Information |
| | | | |
Corporate Headquarters | | Trading Symbol | | Information Requests |
385 East Colorado Boulevard, Suite 299 | | ARE | | Phone: (626) 396-4828 |
Pasadena, California 91101 | | New York Stock Exchange | | E-mail: corporateinformation@labspace.com |
| | | | Web: www.labspace.com |
Common Stock Data (NYSE: ARE) |
| | | | | | | | | | |
| | 1Q 2010 | | 4Q 2009 | | 3Q 2009 | | 2Q 2009 | | 1Q 2009 |
High trading price | | $ | 69.03 | | $ | 68.24 | | $ | 62.49 | | $ | 43.76 | | $ | 66.69 |
Low trading price | | $ | 55.54 | | $ | 51.35 | | $ | 30.33 | | $ | 30.48 | | $ | 31.19 |
Average closing price | | $ | 62.97 | | $ | 57.67 | | $ | 46.57 | | $ | 36.31 | | $ | 48.64 |
Closing stock price, at the end of the quarter | | $ | 67.60 | | $ | 64.29 | | $ | 54.35 | | $ | 35.79 | | $ | 36.40 |
Dividends per share – annualized | | $ | 1.40 | | $ | 1.40 | | $ | 1.40 | | $ | 1.40 | | $ | 3.20 |
Dividend yield – annualized | | 2.1% | | 2.2% | | 2.6% | | 3.9% | | 8.8% |
Common shares outstanding at the end of the quarter | | 43,919,968 | | 43,846,050 | | 43,715,900 | | 39,040,518 | | 38,974,166 |
Market value of outstanding common shares (in thousands) | | $ | 2,968,990 | | $ | 2,818,863 | | $ | 2,375,959 | | $ | 1,397,260 | | $ | 1,418,660 |
Timing |
|
Quarterly results for 2010 are expected to be announced according to the following schedule: |
Second quarter | Late July 2010 | |
Third quarter | Early November 2010 | |
Fourth quarter | Early February 2011 | |
4
ALEXANDRIA REAL ESTATE EQUITIES, INC.
Equity Research Coverage
March 31, 2010
Argus Research | Green Street Advisors | Morningstar |
William L. Eddleman, Jr. | (212) 425-7500 | John Stewart | (949) 640-8780 | David Rodziewicz | (312) 244-7037 |
| | Michael Knott | (949) 640-8780 | | |
| | | | | |
Banc of America Securities-Merrill Lynch | International Strategy & Investment Group Inc | RW Baird |
James Feldman | (212) 449-6339 | Steve Sakwa | (212) 446-9462 | David AuBuchon | (314) 863-4235 |
Jana Galan | (212) 449-5151 | George Auerbach | (212) 446-9459 | Justin Pelham-Webb | (314) 863-6413 |
| | | | | |
Barclays Capital | JMP Securities | Standard & Poor’s |
Ross L. Smotrich | (212) 526-2306 | William C. Marks | (415) 835-8944 | Robert McMillan | (212) 438-9522 |
Jeffrey S. Langbaum | (212) 526-0971 | Susan Gutierrez | (415) 835-3909 | | |
| | | | | |
Citigroup Global Markets | JP Morgan Securities | UBS |
Michael Bilerman | (212) 816-1383 | Anthony Paolone | (212) 622-6682 | Ross Nussbaum | (212) 713-2484 |
Quentin Velleley | (212) 816-6981 | Joseph Dazio | (212) 622-6416 | Robert Salisbury | (212) 713-4760 |
| | | | | |
| | Keefe, Bruyette & Woods | | |
| | Sheila McGrath | (212) 887-7793 | | |
| | Kristin Brown | (212) 887-3810 | | |
Alexandria Real Estate Equities, Inc. is currently covered by the equity research analysts listed above. This list may not be complete and is subject to change as firms initiate or discontinue coverage of our company. Please note that any opinions, estimates or forecasts regarding our historical or predicted performance made by these analysts are theirs alone and do not represent opinions, forecasts, or predictions of Alexandria Real Estate Equities, Inc. or its management. Alexandria Real Estate Equities, Inc. does not by its reference above or distribution imply its endorsement of or concurrence with such information, conclusions, or recommendations. Interested persons may obtain copies of analysts’ reports on their own as we do not distribute these reports. Several of these firms may from time-to-time own our stock and/or hold other long or short positions in our stock, and may provide compensated services to us.
5
ALEXANDRIA REAL ESTATE EQUITIES, INC.
First Quarter Ended March 31, 2010 Operating and Financial Results
Highlights
First Quarter 2010:
· First Quarter 2010 Funds from Operations Per Share (Diluted) Attributable to Alexandria Real Estate Equities, Inc.’s Common Stockholders of $1.09
· First Quarter 2010 Earnings Per Share (Diluted) Attributable to Alexandria Real Estate Equities, Inc.’s Common Stockholders of $0.47
· First Quarter 2010 GAAP Same Property Revenues Less Operating Expenses Up Approximately 1%
· Executed 42 Leases for 564,000 Rentable Square Feet, Including 137,000 Rentable Square Feet of Redevelopment and Development Space
· First Quarter 2010 GAAP Rental Rate Increase of 1.8% on Renewed/Released Space
· First Quarter 2010 Occupancy Remains Steady at 94.0%
· Completed Ground-Up Development of One Property in Seattle, Washington Aggregating 115,000 Rentable Square Feet Pursuant to a 10-Year Lease with Gilead Sciences, Inc.
· Completed Redevelopment of Space Aggregating 56,000 Rentable Square Feet; 100% Leased
· Repaid Two Secured Loans Aggregating $11 Million
· Sold One Property Aggregating 71,000 Rentable Square Feet Previously Classified as “Held For Sale”
· One Land Parcel for Future Ground-Up Development of an 80,000 Square Foot Building Classified as “Held for Sale” as of March 31, 2010
· Received LEED® Silver Certifications for Two Buildings in San Francisco Bay Market
Other:
· In April 2010, Executed a 10-Year Lease with Large Cap Life Science Company for 49,000 Rentable Square Feet at The Alexandria Center for Science and Technology at Mission Bay
Financial Results
For the first quarter of 2010, we reported funds from operations (“FFO”) attributable to Alexandria Real Estate Equities, Inc.’s common stockholders of $53,980,000, or $1.09 per share (diluted), compared to FFO attributable to Alexandria Real Estate Equities, Inc.’s common stockholders of $61,329,000, or $1.89 per share (diluted), for the first quarter of 2009. Comparing the first quarter of 2010 to the first quarter of 2009, FFO attributable to Alexandria Real Estate Equities, Inc.’s common stockholders decreased 12% and FFO per share (diluted) attributable to Alexandria Real Estate Equities, Inc.’s common stockholders decreased 42%. In the first quarter of 2009, we recognized additional rental income of approximately $18,509,000 related to a modification of a lease for a property in South San Francisco, California. Excluding the property in South San Francisco, California, FFO attributable to Alexandria Real Estate Equities, Inc.’s common stockholders was $43,424,000, or $1.34 per share (diluted), for the first quarter of 2009. The weighted average number of common stock outstanding for calculating FFO per share (diluted) attributable to Alexandria Real Estate Equities, Inc.’s common stockholders totaled 49,654,614 and 32,498,107 for the first quarter of 2010 and 2009, respectively.
6
ALEXANDRIA REAL ESTATE EQUITIES, INC.
First Quarter Ended March 31, 2010 Operating and Financial Results
Financial Results (continued)
FFO is a non-GAAP measure widely used by publicly traded real estate investment trusts. We compute FFO in accordance with standards established by the Board of Governors of the National Association of Real Estate Investment Trusts (“NAREIT”) in its April 2002 White Paper and related implementation guidance. A reconciliation of net income attributable to Alexandria Real Estate Equities, Inc.’s common stockholders in accordance with United States generally accepted accounting principles (“GAAP”) to FFO attributable to Alexandria Real Estate Equities, Inc.’s common stockholders is included in the financial information accompanying this press release. The primary reconciling item between GAAP net income attributable to Alexandria Real Estate Equities, Inc.’s common stockholders and FFO attributable to Alexandria Real Estate Equities, Inc.’s common stockholders is depreciation and amortization expense. Depreciation and amortization expense for the three months ended March 31, 2010 and 2009 was $29,738,000 and $31,446,000, respectively. Net income attributable to Alexandria Real Estate Equities, Inc.’s common stockholders for the first quarter of 2010 was $20,542,000, or $0.47 per share (diluted), compared to net income attributable to Alexandria Real Estate Equities, Inc.’s common stockholders of $32,769,000, or $1.01 per share (diluted), for the first quarter of 2009. The weighted average number of common stock outstanding for calculating earnings per share (diluted) attributable to Alexandria Real Estate Equities, Inc.’s common stockholders totaled 43,857,513 and 32,498,107 for the first quarter of 2010 and 2009, respectively.
Leasing Activity
For the first quarter of 2010, we executed a total of 42 leases for approximately 564,000 rentable square feet of space at 28 different properties (excluding month-to-month leases). Of this total, approximately 348,000 rentable square feet related to new or renewal leases of previously leased space (renewed/released space) and approximately 216,000 rentable square feet related to developed, redeveloped or previously vacant space. Of the 216,000 rentable square feet, approximately 137,000 rentable square feet were related to our development or redevelopment programs, with the remaining approximately 79,000 rentable square feet related to previously vacant space. Rental rates for these new or renewal leases (renewed/released space) were on average approximately 1.8% higher (on a GAAP basis) than rental rates for expiring leases.
As of March 31, 2010, approximately 88% of our leases (on a rentable square footage basis) were triple net leases, requiring tenants to pay substantially all real estate taxes and insurance, common area and other operating expenses, including increases thereto. In addition, approximately 8% of our leases (on a rentable square footage basis) required the tenants to pay a majority of operating expenses. Additionally, approximately 92% of our leases (on a rentable square footage basis) provided for the recapture of certain capital expenditures, and approximately 94% of our leases (on a rentable square footage basis) contained effective annual rent escalations that were either fixed or indexed based on the consumer price index or another index.
Dispositions and Properties “Held for Sale”
In the first quarter of 2010, we sold one property located in the Seattle, Washington market aggregating 70,647 rentable square feet for approximately $11.8 million at a gain. This property was located outside of our primary submarket location in Seattle. The buyer of this building intends to invest a significant amount of capital prior to occupancy of it for their own use. As of March 31, 2010, one land parcel for future ground-up development of an 80,000 square foot building was classified as “held for sale.”
Other Recent Events
In April 2010, we executed a 10-year lease with a large cap life science company for approximately 49,000 rentable square feet at The Alexandria Center for Science and Technology at Mission Bay.
7
ALEXANDRIA REAL ESTATE EQUITIES, INC.
First Quarter Ended March 31, 2010 Operating and Financial Results
Earnings Outlook
Based on our current view of existing market conditions and certain current assumptions, our updated guidance for FFO per share (diluted) attributable to Alexandria Real Estate Equities, Inc.’s common stockholders and earnings per share (diluted) attributable to Alexandria Real Estate Equities, Inc.’s common stockholders is as follows:
| | 2010 |
FFO per share (diluted) | | $4.43 |
Earnings per share (diluted) | | $1.80 |
Client Tenant Base
The quality, diversity, breadth, and depth of our significant relationships with our life science client tenants provide Alexandria Real Estate Equities, Inc. (“Alexandria”) with consistent and solid cash flows. As of March 31, 2010, Alexandria’s multinational pharmaceutical client tenants represented approximately 28% of our annualized base rent, led by Novartis AG, Roche Holding Ltd, GlaxoSmithKline plc, Pfizer Inc., Johnson & Johnson, and Merck & Co., Inc.; revenue-producing life science product and service companies represented approximately 19%, led by Quest Diagnostics Incorporated, Qiagen N.V., Laboratory Corporation of America Holdings, and Monsanto Company; public biotechnology companies represented approximately 18% and included the three largest in the sector, Amgen Inc., Gilead Sciences, Inc., and Celgene Corporation; government agencies and renowned medical and research institutions represented approximately 15% and included The Scripps Research Institute, Massachusetts Institute of Technology, Fred Hutchinson Cancer Research Center, University of Washington, Sanford-Burnham Medical Research Institute, and the United States Government; private biotechnology companies represented approximately 13% and included high-quality, leading-edge companies with blue-chip venture and institutional investors, including Ambrx, Inc., Intellikine, Inc., MacroGenics, Inc., and Tolerx, Inc.; and the remaining approximately 7% consisted of traditional office tenants. Two of the fastest-growing client tenant sectors by revenue currently include leading institutional and multinational pharmaceutical entities. Alexandria’s strong life science underwriting skills, long-term life science industry relationships, and sophisticated management with both real estate and life science operating expertise set the Company apart from all other publicly traded REITs and real estate companies.
Earnings Call Information
We will host a conference call on Thursday, April 29, 2010 at 3:00 p.m. Eastern Time (“ET”)/12:00 p.m. noon Pacific Time (“PT”) that is open to the general public to discuss our financial and operating results for the first quarter ended March 31, 2010. To participate in this conference call, dial (719) 457-2668 and confirmation code 1945679, shortly before 3:00 p.m ET/12:00 p.m. noon PT. The audio web cast can be accessed at: www.labspace.com, in the Corporate Information section. A replay of the call will be available for a limited time from 6:00 p.m. ET/3:00 p.m. PT on Thursday, April 29, 2010. The replay number is (719) 457-0820 and the confirmation code is 1945679.
Additionally, a copy of Alexandria Real Estate Equities, Inc.’s Supplemental Financial, Operating, & Property Information for the quarter ended March 31, 2010 and this press release are available in the Corporate Information section of our website at www.labspace.com.
8
ALEXANDRIA REAL ESTATE EQUITIES, INC.
First Quarter Ended March 31, 2010 Operating and Financial Results
About the Company
Alexandria Real Estate Equities, Inc., Landlord of Choice to the Life Science Industry®, is the largest owner and preeminent REIT focused principally on cluster development through the ownership, operation, management, selective redevelopment, development, and acquisition of properties containing life science laboratory space. Alexandria is the leading provider of high-quality, environmentally sustainable real estate, technical infrastructure, and services to the broad and diverse life science industry. Client tenants include institutional (universities and independent not-for-profit institutions), pharmaceutical, biotechnology, medical device, product, service, and translational entities, as well as government agencies. Alexandria’s operating platform is based on the principle of “clustering,” with assets and operations located in key life science markets. Our asset base contains 161 properties approximating 12.7 million rentable square feet consisting of 156 properties approximating 11.8 million rentable square feet (including spaces undergoing active redevelopment) and five properties undergoing ground-up development approximating an additional 865,000 rentable square feet. In addition, our asset base will enable us to grow to approximately 24.0 million rentable square feet through additional ground-up development of approximately 11.3 million rentable square feet.
9
ALEXANDRIA REAL ESTATE EQUITIES, INC.
Condensed Consolidated Income Statements
(Dollars in thousands, except per share data)
(Unaudited)
| | | Three Months Ended (1) | |
| | 3/31/2010 | | 12/31/2009 | | 9/30/2009 | | 6/30/2009 (2) | | 3/31/2009 (3) |
Revenues | | | | | | | | | | |
Rental | | $ | 88,858 | | $ | 88,702 | | $ | 88,419 | | $ | 87,461 | | $ | 104,011 |
Tenant recoveries | | 26,558 | | 25,414 | | 26,230 | | 24,668 | | 26,796 |
Other income | | 1,071 | | 1,009 | | 1,177 | | 8,910 | | 752 |
Total revenues | | 116,487 | | 115,125 | | 115,826 | | 121,039 | | 131,559 |
| | | | | | | | | | |
Expenses | | | | | | | | | | |
Rental operations | | 31,651 | | 29,451 | | 31,218 | | 29,224 | | 32,434 |
General and administrative | | 9,481 | | 8,468 | | 9,611 | | 8,804 | | 9,418 |
Interest | | 17,562 | | 19,452 | | 21,225 | | 21,373 | | 20,199 |
Depreciation and amortization | | 29,735 | | 29,007 | | 28,112 | | 29,500 | | 31,242 |
Total expenses | | 88,429 | | 86,378 | | 90,166 | | 88,901 | | 93,293 |
| | | | | | | | | | |
Gain on early extinguishment of debt | | – | | – | | – | | 11,254 | | – |
Income from continuing operations | | 28,058 | | 28,747 | | 25,660 | | 43,392 | | 38,266 |
Income from discontinued operations, net | | 727 | | 1,158 | | 718 | | 724 | | 2,983 |
Net income | | 28,785 | | 29,905 | | 26,378 | | 44,116 | | 41,249 |
| | | | | | | | | | |
Net income attributable to noncontrolling interests | | 935 | | 924 | | 886 | | 4,362 | | 875 |
Dividends on preferred stock | | 7,089 | | 7,089 | | 7,090 | | 7,089 | | 7,089 |
Net income attributable to unvested restricted stock awards | | 219 | | 242 | | 199 | | 367 | | 517 |
Net income attributable to Alexandria Real Estate Equities, Inc.’s common stockholders | | $ | 20,542 | | $ | 21,650 | | $ | 18,203 | | $ | 32,298 | | $ | 32,768 |
| | | | | | | | | | |
Earnings per share attributable to Alexandria Real Estate Equities, Inc.’s common stockholders – basic | | | | | | | | | | |
Continuing operations | | $ | 0.45 | | $ | 0.47 | | $ | 0.45 | | $ | 0.81 | | $ | 0.92 |
Discontinued operations, net | | 0.02 | | 0.03 | | 0.02 | | 0.02 | | 0.09 |
Earnings per share – basic | | $ | 0.47 | | $ | 0.50 | | $ | 0.47 | | $ | 0.83 | | $ | 1.01 |
| | | | | | | | | | |
Earnings per share attributable to Alexandria Real Estate Equities, Inc.’s common stockholders – diluted | | | | | | | | | | |
Continuing operations | | $ | 0.45 | | $ | 0.46 | | $ | 0.45 | | $ | 0.80 | | $ | 0.92 |
Discontinued operations, net | | 0.02 | | 0.03 | | 0.02 | | 0.02 | | 0.09 |
Earnings per share – diluted | | $ | 0.47 | | $ | 0.49 | | $ | 0.47 | | $ | 0.82 | | $ | 1.01 |
(1) Certain prior year amounts have been reclassified to conform to current year presentation related to discontinued operations.
(2) During the second quarter of 2009, we recognized additional income approximating $7.2 million for a cash receipt related to real estate acquired in November 2007. Additionally during the second quarter of 2009, we recognized a gain on early extinguishment of debt of approximately $11.3 million related to the repurchase, in privately negotiated transactions, of approximately $75 million (par value) of our 3.7% unsecured convertible notes.
(3) During the first quarter of 2009, we recognized approximately $18.5 million of additional rental income related to the modification of a lease in South San Francisco.
10
ALEXANDRIA REAL ESTATE EQUITIES, INC.
Condensed Consolidated Balance Sheets
(In thousands)
(Unaudited)
| | March 31, | | December 31, | | September 30, | | June 30, | | March 31, | |
| | 2010 | | 2009 | | 2009 | | 2009 | | 2009 | |
Assets | | | | | | | | | | | |
Investments in real estate: | | | | | | | | | | | |
Rental properties | | $ | 3,937,876 | | $ | 3,903,955 | | $ | 3,867,725 | | $ | 3,720,238 | | $ | 3,683,249 | |
Less: accumulated depreciation | | (538,570 | ) | (520,647 | ) | (500,765 | ) | (476,970 | ) | (452,539 | ) |
Rental properties, net | | 3,399,306 | | 3,383,308 | | 3,366,960 | | 3,243,268 | | 3,230,710 | |
Land held for future development | | 294,631 | | 255,025 | | 254,549 | | 240,411 | | 109,561 | |
Construction in progress | | 1,326,865 | | 1,400,795 | | 1,349,656 | | 1,406,451 | | 1,452,434 | |
Investment in unconsolidated real estate entity (1) | | 34,421 | | – | | – | | – | | – | |
Investments in real estate, net | | 5,055,223 | | 5,039,128 | | 4,971,165 | | 4,890,130 | | 4,792,705 | |
Cash and cash equivalents | | 70,980 | | 70,628 | | 68,280 | | 70,313 | | 125,281 | |
Restricted cash | | 35,832 | | 47,291 | | 60,002 | | 51,683 | | 54,770 | |
Tenant receivables | | 2,710 | | 3,902 | | 3,789 | | 4,665 | | 5,992 | |
Deferred rent | | 99,248 | | 96,700 | | 92,022 | | 87,697 | | 85,970 | |
Investments | | 76,918 | | 72,882 | | 71,080 | | 66,068 | | 64,788 | |
Other assets | | 127,623 | | 126,696 | | 126,999 | | 116,097 | | 112,669 | |
| | | | | | | | | | | |
Total assets | | $ | 5,468,534 | | $ | 5,457,227 | | $ | 5,393,337 | | $ | 5,286,653 | | $ | 5,242,175 | |
| | | | | | | | | | | |
Liabilities and Equity | | | | | | | | | | | |
Secured notes payable | | $ | 884,839 | | $ | 937,017 | | $ | 837,177 | | $ | 941,600 | | $ | 1,041,854 | |
Unsecured line of credit and unsecured term loan | | 1,291,000 | | 1,226,000 | | 1,248,000 | | 1,307,000 | | 1,355,000 | |
Unsecured convertible notes | | 586,975 | | 583,929 | | 580,919 | | 577,984 | | 433,408 | |
Accounts payable, accrued expenses, and tenant security deposits | | 284,830 | | 282,516 | | 325,720 | | 312,313 | | 331,715 | |
Dividends payable | | 21,709 | | 21,686 | | 21,665 | | 20,005 | | 37,701 | |
Total liabilities | | 3,069,353 | | 3,051,148 | | 3,013,481 | | 3,158,902 | | 3,199,678 | |
| | | | | | | | | | | |
Redeemable noncontrolling interests | | 17,490 | | 41,441 | | 41,232 | | 41,012 | | 32,887 | |
| | | | | | | | | | | |
Alexandria Real Estate Equities, Inc. stockholders’ equity: | | | | | | | | | | | |
Series C preferred stock | | 129,638 | | 129,638 | | 129,638 | | 129,638 | | 129,638 | |
Series D cumulative convertible preferred stock | | 250,000 | | 250,000 | | 250,000 | | 250,000 | | 250,000 | |
Common stock | | 439 | | 438 | | 437 | | 390 | | 390 | |
Additional paid-in capital | | 1,987,512 | | 1,977,062 | | 1,961,421 | | 1,718,737 | | 1,668,546 | |
Accumulated other comprehensive loss | | (26,990 | ) | (33,730 | ) | (44,162 | ) | (53,013 | ) | (79,868 | ) |
Total Alexandria Real Estate Equities, Inc. stockholders’ equity | | 2,340,599 | | 2,323,408 | | 2,297,334 | | 2,045,752 | | 1,968,706 | |
Noncontrolling interests | | 41,092 | | 41,230 | | 41,290 | | 40,987 | | 40,904 | |
Total equity | | 2,381,691 | | 2,364,638 | | 2,338,624 | | 2,086,739 | | 2,009,610 | |
Total | | $ | 5,468,534 | | $ | 5,457,227 | | $ | 5,393,337 | | $ | 5,286,653 | | $ | 5,242,175 | |
(1) See page 40 for additional information.
11
ALEXANDRIA REAL ESTATE EQUITIES, INC.
Earnings per Share
(Dollars in thousands, except per share data)
(Unaudited)
Earnings per Share
| | Three Months Ended | |
| | 3/31/2010 | | 12/31/2009 | | 9/30/2009 | | 6/30/2009 (1) | | 3/31/2009 (2) | |
Net income attributable to Alexandria Real Estate Equities, Inc.’s common stockholders – numerator for basic earnings per share | | $ | 20,542 | | $ | 21,650 | | $ | 18,203 | | $ | 32,298 | | $ | 32,768 | |
Assumed conversion of 8% unsecured convertible notes | | – | | – | | – | | 3,197 | | – | |
Effect of dilutive securities and assumed conversion attributable to unvested restricted stock awards | | – | | – | | – | | 3 | | 1 | |
Net income attributable to Alexandria Real Estate Equities, Inc.’s common stockholders assuming effect of dilutive securities and assumed conversion – numerator for diluted earnings per share | | $ | 20,542 | | $ | 21,650 | | $ | 18,203 | | $ | 35,498 | | $ | 32,769 | |
| | | | | | | | | | | |
Weighted average shares of common stock outstanding for calculating earnings per share attributable to Alexandria Real Estate Equities, Inc.’s common stockholders – denominator for basic earnings per share | | 43,821,765 | | 43,715,462 | | 39,094,018 | | 38,929,971 | | 32,478,671 | |
Effect of dilutive securities and assumed conversion: | | | | | | | | | | | |
Dilutive effect of stock options | | 35,748 | | 34,839 | | 11,932 | | 1,167 | | 19,436 | |
Assumed conversion of 8% unsecured convertible notes | | – | | – | | – | | 4,140,787 | | – | |
Weighted average shares of common stock outstanding for calculating earnings per share attributable to Alexandria Real Estate Equities, Inc.’s common stockholders assuming effect of dilutive securities and assumed conversion – denominator for diluted earnings per share | | 43,857,513 | | 43,750,301 | | 39,105,950 | | 43,071,925 | | 32,498,107 | |
| | | | | | | | | | | |
Earnings per share attributable to Alexandria Real Estate Equities, Inc.’s common stockholders | | | | | | | | | | | |
Basic | | $ | 0.47 | | $ | 0.50 | | $ | 0.47 | | $ | 0.83 | | $ | 1.01 | |
Diluted | | $ | 0.47 | | $ | 0.49 | | $ | 0.47 | | $ | 0.82 | | $ | 1.01 | |
(1) During the second quarter of 2009, we recognized additional income approximating $7.2 million for a cash receipt related to real estate acquired in November 2007. Additionally during the second quarter of 2009, we recognized a gain on early extinguishment of debt of approximately $11.3 million related to the repurchase, in privately negotiated transactions, of approximately $75 million (par value) of our 3.7% unsecured convertible notes.
(2) During the first quarter of 2009, we recognized approximately $18.5 million of additional rental income related to the modification of a lease in South San Francisco.
See “Definitions and Other Information” section of this report starting on page 36.
12
ALEXANDRIA REAL ESTATE EQUITIES, INC.
Funds from Operations
(Dollars in thousands, except per share data)
(Unaudited)
Funds from Operations (“FFO”)
The following table presents a reconciliation of net income attributable to Alexandria Real Estate Equities, Inc.’s common stockholders, the most directly comparable financial measure calculated and presented in accordance with United States generally accepted accounting principles (“GAAP”), to FFO attributable to Alexandria Real Estate Equities, Inc.’s common stockholders for the three month periods below:
| | Three Months Ended | |
| | 3/31/2010 | | 12/31/2009 | | 9/30/2009 | | 6/30/2009 (1) | | 3/31/2009 (2) | |
Net income attributable to Alexandria Real Estate Equities, Inc.’s common stockholders | | $ | 20,542 | | $ | 21,650 | | $ | 18,203 | | $ | 32,298 | | $ | 32,768 | |
Add: Depreciation and amortization (3) | | 29,738 | | 29,004 | | 28,336 | | 29,722 | | 31,446 | |
Add: Net income attributable to noncontrolling interests | | 935 | | 924 | | 886 | | 4,362 | | 875 | |
Add: Net income attributable to unvested restricted stock awards | | 219 | | 242 | | 199 | | 367 | | 517 | |
Subtract: Gain on sales of property | | (24 | ) | (393 | ) | – | | – | | (2,234 | ) |
Subtract: FFO attributable to noncontrolling interests | | (1,098 | ) | (1,006 | ) | (918 | ) | (842 | ) | (1,077 | ) |
Subtract: FFO attributable to unvested restricted stock awards | | (530 | ) | (558 | ) | (505 | ) | (740 | ) | (966 | ) |
FFO attributable to Alexandria Real Estate Equities, Inc.’s common stockholders – numerator for basic FFO per share | | 49,782 | | 49,863 | | 46,201 | | 65,167 | | 61,329 | |
Add: Assumed conversion of 8% unsecured convertible notes | | 4,194 | | 4,362 | | 4,384 | | 3,197 | | – | |
Add: Effect of dilutive securities and assumed conversion attributable to unvested restricted stock awards | | 4 | | 22 | | 24 | | 37 | | – | |
FFO attributable to Alexandria Real Estate Equities, Inc.’s common stockholders assuming effect of dilutive securities and assumed conversion – numerator for diluted FFO per share | | $ | 53,980 | | $ | 54,247 | | $ | 50,609 | | $ | 68,401 | | $ | 61,329 | |
| | | | | | | | | | | |
Weighted average shares of common stock outstanding for calculating FFO per share attributable to Alexandria Real Estate Equities, Inc.’s common stockholders – denominator for basic FFO per share | | 43,821,765 | | 43,715,462 | | 39,094,018 | | 38,929,971 | | 32,478,671 | |
Effect of dilutive securities and assumed conversion: | | | | | | | | | | | |
Dilutive effect of stock options | | 35,748 | | 34,839 | | 11,932 | | 1,167 | | 19,436 | |
Assumed conversion of 8% unsecured convertible notes | | 5,797,101 | | 5,797,101 | | 5,797,101 | | 4,140,787 | | – | |
Weighted average shares of common stock outstanding for calculating FFO per share attributable to Alexandria Real Estate Equities, Inc.’s common stockholders assuming effect of dilutive securities and assumed conversion – denominator for diluted FFO per share | | 49,654,614 | | 49,547,402 | | 44,903,051 | | 43,071,925 | | 32,498,107 | |
| | | | | | | | | | | |
FFO per share attributable to Alexandria Real Estate Equities, Inc.’s common stockholders | | | | | | | | | | | |
Basic | | $ | 1.14 | | $ | 1.14 | | $ | 1.18 | | $ | 1.67 | | $ | 1.89 | |
| | | | | | | | | | | |
Diluted | | $ | 1.09 | | $ | 1.09 | | $ | 1.13 | | $ | 1.59 | | $ | 1.89 | |
(1) During the second quarter of 2009, we recognized additional income approximating $7.2 million for a cash receipt related to real estate acquired in November 2007. Additionally during the second quarter of 2009, we recognized a gain on early extinguishment of debt of approximately $11.3 million related to the repurchase, in privately negotiated transactions, of approximately $75 million (par value) of our 3.7% unsecured convertible notes.
(2) During the first quarter of 2009, we recognized approximately $18.5 million of additional rental income related to the modification of a lease in South San Francisco.
(3) Includes depreciation and amortization for assets “held for sale” classified as discontinued operations for the periods prior to when such assets were designated as “held for sale.”
See “Definitions and Other Information” section of this report starting on page 36.
13
ALEXANDRIA REAL ESTATE EQUITIES, INC.
Adjusted Funds from Operations
(Dollars in thousands)
(Unaudited)
Adjusted Funds from Operations
The following table presents a reconciliation of FFO attributable to Alexandria Real Estate Equities, Inc.’s common stockholders to adjusted funds from operations (“AFFO”) attributable to Alexandria Real Estate Equities, Inc.’s common stockholders:
| | Three Months Ended | |
| | | |
| | 3/31/2010 | | 12/31/2009 | | 9/30/2009 | | 6/30/2009 (1) | | 3/31/2009 (2) | |
FFO attributable to Alexandria Real Estate Equities, Inc.’s common stockholders | | $ | 49,782 | | $ | 49,863 | | $ | 46,201 | | $ | 65,167 | | $ | 61,329 | |
Add/(deduct): | | | | | | | | | | | |
Capital expenditures | | (303 | ) | (607 | ) | (565 | ) | (270 | ) | (492 | ) |
Second generation tenant improvements and leasing costs | | (1,485 | ) | (2,334 | ) | (819 | ) | (894 | ) | (691 | ) |
Amortization of loan fees | | 2,072 | | 2,081 | | 2,061 | | 2,023 | | 1,793 | |
Amortization of debt premiums/discounts | | 3,026 | | 2,998 | | 2,923 | | 2,605 | | 2,262 | |
Amortization of acquired above and below market leases | | (2,247 | ) | (1,457 | ) | (1,510 | ) | (1,736 | ) | (4,745 | ) |
Deferred rent | | (4,135 | ) | (7,064 | ) | (3,106 | ) | (2,700 | ) | (1,509 | ) |
Net stock compensation | | 2,731 | | 3,194 | | 4,141 | | 3,694 | | 3,022 | |
Capitalized income from development projects | | 1,356 | | 1,660 | | 1,545 | | 1,631 | | 1,662 | |
Deferred rent on ground leases | | 1,432 | | 1,400 | | 1,564 | | 1,478 | | 1,124 | |
Gain on early extinguishment of debt | | – | | – | | – | | (11,254 | ) | – | |
Allocation to unvested restricted stock awards | | (25 | ) | 1 | | (67 | ) | 61 | | (38 | ) |
AFFO attributable to Alexandria Real Estate Equities, Inc.’s common stockholders | | $ | 52,204 | | $ | 49,735 | | $ | 52,368 | | $ | 59,805 | | $ | 63,717 | |
| | | | | | | | | | | |
Weighted average shares of common stock outstanding for calculating earnings per share attributable to Alexandria Real Estate Equities, Inc.’s common stockholders assuming effect of dilutive securities and assumed conversion – denominator for diluted earnings per share | | 43,857,513 | | 43,750,301 | | 39,105,950 | | 43,071,925 | | 32,498,107 | |
Less: Assumed conversion of 8% unsecured convertible notes | | – | | – | | – | | 4,140,787 | | – | |
| | 43,857,513 | | 43,750,301 | | 39,105,950 | | 38,931,138 | | 32,498,107 | |
(1) During the second quarter of 2009, we recognized additional income approximating $7.2 million for a cash receipt related to real estate acquired in November 2007. Additionally during the second quarter of 2009, we recognized a gain on early extinguishment of debt of approximately $11.3 million related to the repurchase, in privately negotiated transactions, of approximately $75 million (par value) of our 3.7% unsecured convertible notes.
(2) During the first quarter of 2009, we recognized approximately $18.5 million of additional rental income related to the modification of a lease in South San Francisco.
See “Definitions and Other Information” section of this report starting on page 36.
14
ALEXANDRIA REAL ESTATE EQUITIES, INC.
Financial and Asset Base Highlights
(Dollars in thousands, except per share amounts)
(Unaudited)
| | 3/31/2010 | | 12/31/2009 | | 9/30/2009 | | 6/30/2009 | | 3/31/2009 | |
Balance Sheet Data | | | | | | | | | | | |
Rental properties, net | | $ | 3,399,306 | | $ | 3,383,308 | | $ | 3,366,960 | | $ | 3,243,268 | | $ | 3,230,710 | |
Land held for future development | | $ | 294,631 | | $ | 255,025 | | $ | 254,549 | | $ | 240,411 | | $ | 109,561 | |
Construction in progress | | $ | 1,326,865 | | $ | 1,400,795 | | $ | 1,349,656 | | $ | 1,406,451 | | $ | 1,452,434 | |
Investment in unconsolidated real estate entity | | $ | 34,421 | | $ | – | | $ | – | | $ | – | | $ | – | |
Gross book value of real estate | | $ | 5,593,793 | | $ | 5,559,775 | | $ | 5,471,930 | | $ | 5,367,100 | | $ | 5,245,244 | |
Tangible non-real estate assets | | $ | 222,248 | | $ | 227,440 | | $ | 239,076 | | $ | 224,016 | | $ | 283,306 | |
Total assets | | $ | 5,468,534 | | $ | 5,457,227 | | $ | 5,393,337 | | $ | 5,286,653 | | $ | 5,242,175 | |
Secured notes payable | | $ | 884,839 | | $ | 937,017 | | $ | 837,177 | | $ | 941,600 | | $ | 1,041,854 | |
Outstanding balance on unsecured line of credit | | $ | 541,000 | | $ | 476,000 | | $ | 498,000 | | $ | 557,000 | | $ | 605,000 | |
Outstanding balance on unsecured term loan | | $ | 750,000 | | $ | 750,000 | | $ | 750,000 | | $ | 750,000 | | $ | 750,000 | |
3.7% unsecured convertible notes | | $ | 369,961 | | $ | 368,027 | | $ | 366,120 | | $ | 364,242 | | $ | 433,408 | |
8.0% unsecured convertible notes | | $ | 217,014 | | $ | 215,902 | | $ | 214,799 | | $ | 213,742 | | $ | – | |
Total debt | | $ | 2,762,814 | | $ | 2,746,946 | | $ | 2,666,096 | | $ | 2,826,584 | | $ | 2,830,262 | |
Total liabilities | | $ | 3,069,353 | | $ | 3,051,148 | | $ | 3,013,481 | | $ | 3,158,902 | | $ | 3,199,678 | |
Common shares outstanding | | 43,919,968 | | 43,846,050 | | 43,715,900 | | 39,040,518 | | 38,974,166 | |
Total market capitalization | | $ | 6,112,219 | | $ | 5,946,639 | | $ | 5,417,648 | | $ | 4,580,406 | | $ | 4,600,039 | |
| | Three Months Ended | |
| | 3/31/2010 | | 12/31/2009 | | 9/30/2009 | | 6/30/2009 (1) | | 3/31/2009 (2) | |
Operating Data | | | | | | | | | | | |
Total revenue | | $ | 116,487 | | $ | 115,125 | | $ | 115,826 | | $ | 121,039 | | $ | 131,559 | |
Deferred rent | | $ | 4,135 | | $ | 7,064 | | $ | 3,106 | | $ | 2,700 | | $ | 1,509 | |
Amortization of acquired above and below market leases | | $ | 2,247 | | $ | 1,457 | | $ | 1,510 | | $ | 1,736 | | $ | 4,745 | |
Non-cash amortization of discount on unsecured convertible notes | | $ | 3,046 | | $ | 3,009 | | $ | 2,935 | | $ | 2,612 | | $ | 2,263 | |
Net income attributable to Alexandria Real Estate Equities, Inc.’s common stockholders | | $ | 20,542 | | $ | 21,650 | | $ | 18,203 | | $ | 32,298 | | $ | 32,768 | |
Earnings per share – diluted | | $ | 0.47 | | $ | 0.49 | | $ | 0.47 | | $ | 0.82 | | $ | 1.01 | |
FFO attributable to Alexandria Real Estate, Inc.’s common stockholders – diluted | | $ | 53,980 | | $ | 54,247 | | $ | 50,609 | | $ | 68,401 | | $ | 61,329 | |
FFO per share – diluted | | $ | 1.09 | | $ | 1.09 | | $ | 1.13 | | $ | 1.59 | | $ | 1.89 | |
Weighted average common shares outstanding – EPS – diluted | | 43,857,513 | | 43,750,301 | | 39,105,950 | | 43,071,925 | | 32,498,107 | |
Weighted average common shares outstanding – FFO – diluted | | 49,654,614 | | 49,547,402 | | 44,903,051 | | 43,071,925 | | 32,498,107 | |
(1) During the second quarter of 2009, we recognized additional income approximating $7.2 million for a cash receipt related to real estate acquired in November 2007. Additionally during the second quarter of 2009, we recognized a gain on early extinguishment of debt of approximately $11.3 million related to the repurchase, in privately negotiated transactions, of approximately $75 million (par value) of our 3.7% unsecured convertible notes.
(2) During the first quarter of 2009, we recognized approximately $18.5 million of additional rental income related to the modification of a lease in South San Francisco.
See “Definitions and Other Information” section of this report starting on page 36.
15
ALEXANDRIA REAL ESTATE EQUITIES, INC.
Financial and Asset Base Highlights (continued)
(Dollars in thousands, except per share amounts)
(Unaudited)
| | Three Months Ended |
| | 3/31/2010 | | 12/31/2009 | | 9/30/2009 | | 6/30/2009 (1) | | 3/31/2009 (2) |
Financial, Debt, and Other Ratios | | | | | | | | | | |
Unencumbered net operating income as a percentage of total net operating income | | 57% | | 55% | | 60% | | 61% | | 64% |
Unencumbered assets gross book value | | $ | 4,250,976 | | $ | 4,166,066 | | $ | 4,092,300 | | $ | 3,971,718 | | $ | 3,912,462 |
Unencumbered assets gross book value as a percentage of gross assets | | 71% | | 70% | | 69% | | 69% | | 69% |
Percentage outstanding on unsecured line of credit at end of period | | 47% | | 41% | | 43% | | 48% | | 53% |
Operating margin | | 73% | | 74% | | 73% | | 74% | | 75% |
Adjusted EBITDA margin | | 68% | | 70% | | 69% | | 72% | | 71% |
General and administrative expense as a percentage of total revenues | | 8.1% | | 7.4% | | 8.3% | | 7.3% | | 7.2% |
EBITDA – trailing 12 months (1)(2) | | $ | 325,596 | | $ | 342,428 | | $ | 341,639 | | $ | 342,624 | | $ | 321,518 |
Adjusted EBITDA – trailing 12 months (1)(2) | | $ | 327,685 | | $ | 342,598 | | $ | 353,831 | | $ | 354,198 | | $ | 343,525 |
Capitalized interest | | $ | 19,509 | | $ | 18,976 | | $ | 17,933 | | $ | 18,240 | | $ | 16,919 |
Weighted average interest rate used for capitalization during period | | 5.20% | | 5.42% | | 5.16% | | 5.23% | | 4.89% |
Net debt to gross assets (3) | | 45.0% | | 44.9% | | 44.0% | | 47.9% | | 48.1% |
Secured debt as a percentage of gross assets (3) | | 15% | | 16% | | 14% | | 16% | | 18% |
Net debt to Adjusted EBITDA – trailing 12 months (1)(2) | | 8.1 | | 7.7 | | 7.2 | | 7.6 | | 7.7 |
Dividends per share on common stock | | $ | 0.35 | | $ | 0.35 | | $ | 0.35 | | $ | 0.35 | | $ | 0.80 |
Dividend payout ratio (common stock) | | 29% | | 29% | | 31% | | 20% | | 51% |
| | | | | | | | | | |
| | 1Q 2010 | | 4Q 2009 | | 3Q 2009 | | 2Q 2009 | | 1Q 2009 |
Asset Base Statistics | | | | | | | | | | |
Number of properties (3) | | 161 | | 162 | | 163 | | 163 | | 163 |
Rentable square feet (3) | | 12,675,439 | | 12,746,086 | | 12,793,644 | | 12,793,644 | | 12,793,644 |
Occupancy of operating properties (3) | | 94.0% | | 94.1% | | 94.4% | | 94.5% | | 94.3% |
Occupancy including redevelopment properties (3) | | 88.9% | | 89.4% | | 89.1% | | 89.4% | | 89.6% |
Leasing activity – YTD rentable square feet | | 563,901 | | 1,864,347 | | 1,349,098 | | 935,580 | | 464,603 |
Leasing activity – Qtr rentable square feet | | 563,901 | | 489,079 | | 449,515 | | 472,822 | | 464,603 |
Leasing activity – YTD GAAP rental rate increase | | 1.8% | | 3.5% | | 4.9% | | 4.0% | | 5.4% |
Leasing activity – Qtr GAAP rental rate increase | | 1.8% | | 1.5% | | 5.6% | | 3.3% | | 5.4% |
Leasing activity – YTD Cash rental rate increase | | 0.7% | | 0.1% | | 2.8% | | 2.5% | | 3.1% |
Leasing activity – Qtr Cash rental rate increase | | 0.7% | | (8.0% | ) | 1.6% | | 2.1% | | 3.1% |
Same property YTD revenue less operating expenses – GAAP basis | | 0.8% | | 2.8% | | 3.7% | | 4.0% | | 3.6% |
Same property Qtr revenue less operating expenses – GAAP basis | | 0.8% | | 1.1% | | 0.8% | | 2.2% | | 3.6% |
Same property YTD revenue less operating expenses – Cash basis | | 0.4% | | 4.7% | | 7.1% | | 7.1% | | 5.3% |
Same property Qtr revenue less operating expenses – Cash basis | | 0.4% | | 1.3% | | 4.3% | | 5.8% | | 5.3% |
(1) During the second quarter of 2009, we recognized additional income approximating $7.2 million for a cash receipt related to real estate acquired in November 2007. Additionally during the second quarter of 2009, we recognized a gain on early extinguishment of debt of approximately $11.3 million related to the repurchase, in privately negotiated transactions, of approximately $75 million (par value) of our 3.7% unsecured convertible notes.
(2) During the first quarter of 2009, we recognized approximately $18.5 million of additional rental income related to the modification of a lease in South San Francisco.
(3) At end of period.
See “Definitions and Other Information” section of this report starting on page 36.
16
ALEXANDRIA REAL ESTATE EQUITIES, INC.
Financial and Asset Base Highlights (continued)
(Unaudited)
Summary of Occupancy Percentage
| | December 31, | | | | | |
| | 1998 | | 1999 | | 2000 | | 2001 | | 2002 | | 2003 | | 2004 | | 2005 | | 2006 | | 2007 | | 2008 | | 2009 | | 1Q10 | | Average | |
Occupancy of operating properties –
end of period | | 96.2% | | 95.7% | | 98.4% | | 99.0% | | 96.3% | | 93.9% | | 95.2% | | 93.2% | | 93.1% | | 93.8% | | 94.8% | | 94.1% | | 94.0% | | 95.2% | |
Occupancy including redevelopment properties – end of period | | 92.9% | | 91.5% | | 90.8% | | 88.6% | | 89.2% | | 88.4% | | 87.0% | | 87.7% | | 88.0% | | 87.8% | | 90.0% | | 89.4% | | 88.9% | | 89.2% | |
Quarterly Percentage Change in GAAP and Cash Same Property Revenues Less Operating Expenses

Summary of GAAP and Cash Rental Rate Increases on Renewed/Released Space
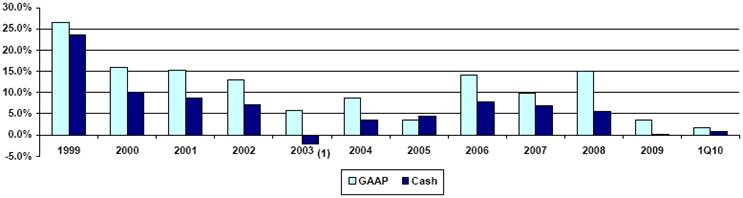
(1) Excluding a lease for 21,310 rentable square feet in the San Francisco Bay market, rental rates for renewed or released space in 2003 were on average 2.5% higher than expiring rates on a cash basis and 9.7% higher than expiring rates on a GAAP basis,
17
ALEXANDRIA REAL ESTATE EQUITIES, INC.
Summary of Debt
March 31, 2010
(Dollars in thousands)
(Unaudited)
Debt Maturities
| | Secured Debt | | Unsecured Debt | |
Year | | Our Share | | Noncontrolling
Interests’
Share | | Total
Consolidated
Secured Debt | | Credit Facility | | Unsecured
Convertible Notes | |
2010 | | $ | 22,045 | | $ | 203 | | $ | 22,248 | | $ | – | | $ | – | |
2011 | | 134,790 | | 284 | | 135,074 | | 541,000 | (1) | – | |
2012 | | 40,817 | | 300 | | 41,117 | | 750,000 | (1) | 369,961 | |
2013 | | 52,382 | | 318 | | 52,700 | | – | | – | |
2014 | | 196,106 | | 20,846 | | 216,952 | | – | | 217,014 | |
Thereafter | | 416,748 | | – | | 416,748 | | – | | – | |
Total | | $ | 862,888 | | $ | 21,951 | | $ | 884,839 | (2) | $ | 1,291,000 | | $ | 586,975 | (3) |
Secured and Unsecured Debt Analysis
| | Balance | | Percentage
of
Balance | | Weighted Average
Interest Rate at
End of Period (4) | | Weighted Average
Remaining Term | |
Secured Notes Payable | | $ | 884,839 | (2) | 32.0 | % | | 5.93 | % | | 6.4 Years | |
Unsecured Line of Credit | | 541,000 | | 19.6 | | | 1.25 | | | 1.6 Years | (5) |
Unsecured Term Loan | | 750,000 | | 27.1 | | | 5.43 | | | 2.6 Years | (5) |
Unsecured Convertible Notes | | 369,961 | (3) | 13.4 | | | 3.70 | | | 1.8 Years | |
Unsecured Convertible Notes | | 217,014 | (3) | 7.9 | | | 8.00 | | | 4.0 Years | |
Total Debt | | $ | 2,762,814 | | 100.0 | % | | 4.74 | % | | 3.6 Years | |
(1) Assumes we exercise our sole right to extend the maturity date of our unsecured line of credit from October 2010 to October 2011 and our unsecured term loan from October 2011 to October 2012. Our multi-year capital plan assumes that we will successfully amend and renegotiate our $1.9 billion unsecured credit facility to a significant availability level that will take into account our business needs, including a portion of the total commitment allocated to an unsecured line of credit and an unsecured term loan. See our Annual Report on Form 10-K for the year ended December 31, 2009 for additional disclosures on our unsecured line of credit and unsecured term loan.
(2) Includes unamortized discount of approximately $2.2 million as of March 31, 2010.
(3) Includes unamortized discount of approximately $37.7 million as of March 31, 2010.
(4) Represents the weighted average contractual interest rate as of the end of the period plus the impact of debt premiums/discounts and our interest rate hedge agreements on our secured notes payable, unsecured line of credit and unsecured term loan and the contractual rates of 3.7% and 8% on our unsecured convertible notes. The weighted average interest rate excludes bank fees and amortization of loan fees. See also the “Summary of Interest Rate Hedge Agreements” section of this report.
(5) Assumes we exercise our sole right to extend the maturity date of our unsecured line of credit and unsecured term loan by twelve months to October 2011 and October 2012, respectively. The interest rate related to outstanding borrowings for our unhedged floating rate debt is based upon one-month LIBOR. The interest rate resets periodically and will vary in future periods.
18
ALEXANDRIA REAL ESTATE EQUITIES, INC.
Summary of Secured Debt Principal Maturities Through 2014
March 31, 2010
(Dollars in thousands)
(Unaudited)
Description | | Maturity Date | | Type | | Stated Rate | | Effective Rate (1) | | Amount | |
| | | | | | | | | | | |
California – San Diego #1 | | 10/1/2010 | | CMBS | | 8.23 | % | | 5.71 | % | | $ | 13,540 | |
Other scheduled principal repayments/amortization | | | | | | | | | | | | 8,708 | |
2010 Total | | | | | | | | | | | | $ | 22,248 | |
| | | | | | | | | | | | | |
California – San Francisco Bay #1 | | 1/3/2011 | | Bank | | 1.55 | % | | 1.55 | % | | $ | 29,558 | (2) |
Eastern Massachusetts #1 | | 2/1/2011 | | Bank | | 7.52 | | | 5.82 | | | 5,050 | |
California – San Diego #2 | | 8/2/2011 | | Not-for-Profit | | 7.50 | | | 7.50 | | | 8,500 | |
Eastern Massachusetts #2 | | 10/1/2011 | | Bank | | 8.10 | | | 5.69 | | | 2,237 | |
Suburban Washington, D.C. #1 | | 11/1/2011 | | CMBS | | 7.25 | | | 5.82 | | | 2,978 | |
Suburban Washington, D.C. #2 | | 12/22/2011 | | Bank | | 3.57 | | | 3.57 | | | 76,000 | (3) |
Other scheduled principal repayments/amortization | | | | | | | | | | | | 10,751 | |
2011 Total | | | | | | | | | | | | $ | 135,074 | |
| | | | | | | | | | | | | |
Washington – Seattle #1 | | 1/1/2012 | | Bank | | 6.15 | % (4) | | 6.15 | % | | $ | 28,500 | (2)(5) |
Eastern Massachusetts #3 | | 3/1/2012 | | Insurance Co. | | 7.14 | | | 5.83 | | | 1,358 | |
Other scheduled principal repayments/amortization | | | | | | | | | | | | 11,259 | |
2012 Total | | | | | | | | | | | | $ | 41,117 | |
| | | | | | | | | | | | | |
California – San Diego #3 | | 3/1/2013 | | Insurance Co. | | 6.21 | % | | 6.21 | % | | $ | 7,940 | |
Suburban Washington, D.C. #3 | | 9/1/2013 | | CMBS | | 6.36 | | | 6.36 | | | 26,093 | |
California – San Francisco Bay #2 | | 11/16/2013 | | Other | | 6.14 | | | 6.14 | | | 7,527 | |
Other scheduled principal repayments/amortization | | | | | | | | | | | | 11,140 | |
2013 Total | | | | | | | | | | | | $ | 52,700 | |
| | | | | | | | | | | | | |
Eastern Massachusetts #4 | | 4/1/2014 | | Insurance Co. | | 5.26 | % | | 5.59 | % | | $ | 208,457 | |
Washington – Seattle #2 | | 11/18/2014 | | Other | | 6.37 | | | 6.37 | | | 240 | |
Other scheduled principal repayments/amortization | | | | | | | | | | | | 8,255 | |
2014 Total | | | | | | | | | | | | $ | 216,952 | |
(1) Represents the contractual interest rate as of the end of the period plus the impact of debt premiums/discounts and interest rate hedge agreements. The effective rate excludes bank fees and amortization of loan fees.
(2) Variable rate loan based on one month LIBOR plus an applicable spread. The interest rate resets periodically and will vary in future periods.
(3) We have ongoing discussions with lenders to extend or refinance the debt secured by this property.
(4) Represents the stated rate of 1.38% as of March 31, 2010 and the impact of an interest rate hedge agreement.
(5) Assumes we exercise our sole right to extend the maturity date of this secured debt from January 1, 2011 to January 1, 2012.
19
ALEXANDRIA REAL ESTATE EQUITIES, INC.
Fixed/Floating Rate Debt and Leverage
(Dollars in thousands, except per share data)
(Unaudited)
Fixed/Floating Rate Debt Analysis
| | March 31, 2010 | | Percentage
of
Balance | | Weighted Average Interest Rate at
End of Period (1) | | Weighted
Average
Maturity | |
Fixed Rate Debt | | $ | 1,412,145 | | 51.1 | % | | 5.75 | % | | 5.0 Years | |
Floating Rate Debt – Hedged | | 728,500 | | 26.4 | | | 5.75 | | | 2.6 Years | (2) |
Floating Rate Debt – Unhedged | | 622,169 | | 22.5 | | | 1.27 | | | 1.6 Years | (2) |
Total Debt | | $ | 2,762,814 | | 100.0 | % | | 4.74 | % | | 3.6 Years | (2) |
Leverage
| | 3/31/2010 | | 12/31/2009 | | 9/30/2009 | | 6/30/2009 | | 3/31/2009 | |
Total debt | | $ | 2,762,814 | | $ | 2,746,946 | | $ | 2,666,096 | | $ | 2,826,584 | | $ | 2,830,262 | |
Less: cash, cash equivalents, and restricted cash | | (106,812 | ) | (117,919 | ) | (128,282 | ) | (121,996 | ) | (180,051 | ) |
Net debt | | $ | 2,656,002 | | $ | 2,629,027 | | $ | 2,537,814 | | $ | 2,704,588 | | $ | 2,650,211 | |
| | | | | | | | | | | |
Adjusted EBITDA – trailing 12 months (3)(4) | | $ | 327,685 | | $ | 342,598 | | $ | 353,831 | | $ | 354,198 | | $ | 343,525 | |
Gross Assets (excluding cash and restricted cash) | | $ | 5,900,292 | | $ | 5,859,955 | | $ | 5,765,820 | | $ | 5,641,627 | | $ | 5,514,663 | |
Net debt to Adjusted EBITDA – trailing 12 months (3)(4) | | 8.1 | | 7.7 | | 7.2 | | 7.6 | | 7.7 | |
Net debt to Gross Assets (excluding cash and restricted cash) | | 45.0% | | 44.9% | | 44.0% | | 47.9% | | 48.1% | |
Unencumbered net operating income as a percentage of total net operating income – trailing 12 months | | 57% | | 55% | | 60% | | 61% | | 64% | |
Unencumbered assets gross book value as a percentage of gross assets | | 71% | | 70% | | 69% | | 69% | | 69% | |
(1) | Represents the contractual interest rate as of the end of the period plus the impact of debt premiums/discounts and our interest rate hedge agreements on our secured notes payable, unsecured line of credit, and unsecured term loan and the contractual rates of 3.7% and 8% on our unsecured convertible notes. The weighted average interest rate excludes bank fees and amortization of loan fees. See also the “Summary of Interest Rate Hedge Agreements” section of this report. |
(2) | Assumes we exercise our sole right to extend the maturity date of our unsecured line of credit and unsecured term loan by twelve months to October 2011 and October 2012, respectively. The interest rate related to outstanding borrowings for our unhedged floating rate debt is based upon one-month LIBOR. The interest rate resets periodically and will vary in future periods. |
(3) | During the second quarter of 2009, we recognized additional income approximating $7.2 million for a cash receipt related to real estate acquired in November 2007. Additionally during the second quarter of 2009, we recognized a gain on early extinguishment of debt of approximately $11.3 million related to the repurchase, in privately negotiated transactions, of approximately $75 million (par value) of our 3.7% unsecured convertible notes. |
(4) | During the first quarter of 2009, we recognized approximately $18.5 million of additional rental income related to the modification of a lease in South San Francisco. |
See “Definitions and Other Information” section of this report starting on page 36.
20
ALEXANDRIA REAL ESTATE EQUITIES, INC.
Summary of Interest Rate Hedge Agreements
March 31, 2010
(Dollars in thousands)
(Unaudited)
Transaction
Date | | Effective
Date | | Termination
Date | | Interest Pay
Rate | | Notional
Amount | | Effective at
March 31, 2010 | |
| | | | | | | | | | | |
December 2006 | | December 29, 2006 | | March 31, 2014 | | 4.990 | % | | $ | 50,000 | | $ | 50,000 | |
December 2006 | | January 2, 2007 | | January 3, 2011 | | 5.003 | | | 28,500 | | 28,500 | |
October 2007 | | October 31, 2007 | | September 30, 2012 | | 4.546 | | | 50,000 | | 50,000 | |
October 2007 | | October 31, 2007 | | September 30, 2013 | | 4.642 | | | 50,000 | | 50,000 | |
December 2005 | | January 2, 2008 | | December 31, 2010 | | 4.768 | | | 50,000 | | 50,000 | |
June 2006 | | June 30, 2008 | | June 30, 2010 | | 5.325 | | | 50,000 | | 50,000 | |
June 2006 | | June 30, 2008 | | June 30, 2010 | | 5.325 | | | 50,000 | | 50,000 | |
October 2007 | | July 1, 2008 | | March 31, 2013 | | 4.622 | | | 25,000 | | 25,000 | |
October 2007 | | July 1, 2008 | | March 31, 2013 | | 4.625 | | | 25,000 | | 25,000 | |
June 2006 | | October 31, 2008 | | December 31, 2010 | | 5.340 | | | 50,000 | | 50,000 | |
June 2006 | | October 31, 2008 | | December 31, 2010 | | 5.347 | | | 50,000 | | 50,000 | |
October 2008 | | September 30, 2009 | | January 31, 2011 | | 3.119 | | | 100,000 | | 100,000 | |
December 2006 | | November 30, 2009 | | March 31, 2014 | | 5.015 | | | 75,000 | | 75,000 | |
December 2006 | | November 30, 2009 | | March 31, 2014 | | 5.023 | | | 75,000 | | 75,000 | |
December 2006 | | December 31, 2010 | | October 31, 2012 | | 5.015 | | | 100,000 | | – | |
Total | | | | | | | | | | | $ | 728,500 | |
| | | | | | | | | | | | | | |
Interest pay rate represents the interest rate we will pay for one month LIBOR under the applicable interest rate swap agreement. This rate does not include any spread in addition to one month LIBOR that is due monthly as interest expense.
21
ALEXANDRIA REAL ESTATE EQUITIES, INC.
Summary of Occupancy Percentage and Properties
(Dollars in thousands)
(Unaudited)
Summary of Occupancy Percentage
| | December 31, | | | | | |
| | 1998 | | 1999 | | 2000 | | 2001 | | 2002 | | 2003 | | 2004 | | 2005 | | 2006 | | 2007 | | 2008 | | 2009 | | 1Q10 | | Average | |
Occupancy of operating properties –
end of period | | 96.2% | | 95.7% | | 98.4% | | 99.0% | | 96.3% | | 93.9% | | 95.2% | | 93.2% | | 93.1% | | 93.8% | | 94.8% | | 94.1% | | 94.0% | | 95.2% | |
Occupancy including redevelopment properties – end of period | | 92.9% | | 91.5% | | 90.8% | | 88.6% | | 89.2% | | 88.4% | | 87.0% | | 87.7% | | 88.0% | | 87.8% | | 90.0% | | 89.4% | | 88.9% | | 89.2% | |
Summary of Properties
| | March 31, 2010 | | December 31, 2009 | |
| | Rentable Square Feet | | Number of | | Annualized | | Occupancy | | Occupancy | |
Markets | | Operating | | Redevelopment | | Development | | Total | | Properties | | Base Rent (1) | | Percentage (1) (2) | | Percentage (3) | |
California – San Diego | | 1,467,228 | | 198,247 | | – | | 1,665,475 | | 32 | | $ | 40,281 | | 87.4 | % | | 89.2 | % | |
California – San Francisco Bay | | 1,580,943 | | – | | 555,000 | | 2,135,943 | | 22 | | 53,854 | | 95.8 | | | 95.4 | | |
Eastern Massachusetts | | 3,168,242 | | 292,750 | | – | | 3,460,992 | | 38 | | 113,643 | | 94.9 | | | 94.3 | | |
New Jersey/Suburban Philadelphia | | 459,904 | | – | | – | | 459,904 | | 8 | | 9,302 | | 83.5 | | | 88.0 | | |
New York City | | – | | – | | 310,000 | | 310,000 | | 1 | | – | | – | | | – | | |
Southeast | | 741,732 | | 21,191 | | – | | 762,923 | | 13 | | 16,144 | | 93.5 | | | 93.7 | | |
Suburban Washington, D.C. | | 2,311,760 | | 135,843 | | – | | 2,447,603 | | 30 | | 48,863 | | 95.4 | | | 94.3 | | |
Washington – Seattle | | 1,090,205 | | – | | – | | 1,090,205 | | 13 | | 35,609 | | 98.1 | | | 99.1 | | |
International – Canada | | 342,394 | | – | | – | | 342,394 | | 4 | | 8,907 | | 100.0 | | | 100.0 | | |
Total Properties (Continuing Operations) | | 11,162,408 | | 648,031 | | 865,000 | | 12,675,439 | | 161 | | $ | 326,603 | | 94.0 | % | | 94.1 | % | |
(1) | Represents annualized base rent and occupancy percentages related to our operating properties aggregating 11,162,408 rentable square feet. |
(2) | Including spaces undergoing a permanent change in use to life science laboratory space through redevelopment, including the conversion of single-tenancy space to multi-tenancy space or multi-tenancy space to single-tenancy space, occupancy as of March 31, 2010 was 88.9%. See also the “Value Added Activities” section of this report for additional information on our redevelopment program. |
(3) | Represents annualized base rent and occupancy percentages related to our operating properties aggregating 10,962,853 rentable square feet. Including spaces undergoing a permanent change in use to life science laboratory space through redevelopment, including the conversion of single-tenancy space to multi-tenancy space or multi-tenancy space to single-tenancy space, occupancy as of December 31, 2009 was 89.4%. See also the “Value Added Activities” section of this report for additional information on our redevelopment program. |
22
ALEXANDRIA REAL ESTATE EQUITIES, INC.
Summary of Same Property Comparisons
(Dollars in thousands)
(Unaudited)
| | GAAP Basis | | Cash Basis | |
| | Three Months Ended | | Three Months Ended | |
| | 3/31/2010 | | 3/31/2009 | | % Change | | 3/31/2010 | | 3/31/2009 | | % Change | |
Revenues | | $ | 95,758 | | $ | 96,192 | | (0.5 | )% | | $ | 93,797 | | $ | 94,502 | | (0.7 | )% | |
Operating expenses | | 25,580 | | 26,553 | | (3.7 | ) | | 25,580 | | 26,553 | | (3.7 | ) | |
Revenues less operating expenses | | $ | 70,178 | | $ | 69,639 | | 0.8 | % | | $ | 68,217 | | $ | 67,949 | | 0.4 | % | |
Quarterly Percentage Change in GAAP and Cash Same Property Revenues Less Operating Expenses
See “Definitions and Other Information” section of this report starting on page 36.
23
ALEXANDRIA REAL ESTATE EQUITIES, INC.
Summary of Leasing Activity
Three Months Ended March 31, 2010
(Unaudited)
| | | | | | | | | | | | TI’s/Lease | | |
| | | | Rentable | | | | | | Rental | | Commissions | | Average |
| | Number | | Square | | Expiring | | New | | Rate | | Per | | Lease |
| | of Leases | | Footage | | Rates | | Rates | | Changes | | Square Foot | | Terms |
Leasing Activity | | | | | | | | | | | | | | |
Lease Expirations | | | | | | | | | | | | | | |
Cash Basis | | 48 | | 594,955 | | $28.83 | | – | | – | | – | | – |
GAAP Basis | | 48 | | 594,955 | | $29.62 | | – | | – | | – | | – |
| | | | | | | | | | | | | | |
Renewed/Released Space Leased | | | | | | | | | | | | | | |
Cash Basis | | 27 | | 348,388 | | $30.30 | | $30.51 | | 0.7% | | $4.26 | | 4.2 years |
GAAP Basis | | 27 | | 348,388 | | $29.82 | | $30.37 | | 1.8% | | $4.26 | | 4.2 years |
| | | | | | | | | | | | | | |
Developed/Redeveloped/Vacant Space Leased | | | | | | | | | | | | | | |
Cash Basis | | 15 | | 215,513 | | – | | $26.83 | | – | | $11.52 | | 8.1 years |
GAAP Basis | | 15 | | 215,513 | | – | | $29.01 | | – | | $11.52 | | 8.1 years |
| | | | | | | | | | | | | | |
Month-to-Month Leases in Effect | | | | | | | | | | | | | | |
Cash Basis | | 7 | | 21,076 | | $31.81 | | $21.09 | | – | | – | | – |
GAAP Basis | | 7 | | 21,076 | | $30.49 | | $21.09 | | – | | – | | – |
| | | | | | | | | | | | | | |
Leasing Activity Summary | | | | | | | | | | | | | | |
Excluding Month-to-Month Leases | | | | | | | | | | | | | | |
Cash Basis | | 42 | | 563,901 | | – | | $29.11 | | – | | $7.04 | | 5.7 years |
GAAP Basis | | 42 | | 563,901 | | – | | $29.85 | | – | | $7.04 | | 5.7 years |
| | | | | | | | | | | | | | |
Including Month-to-Month Leases | | | | | | | | | | | | | | |
Cash Basis | | 49 | | 584,977 | | – | | $28.82 | | – | | – | | – |
GAAP Basis | | 49 | | 584,977 | | – | | $29.53 | | – | | – | | – |
24
ALEXANDRIA REAL ESTATE EQUITIES, INC.
Summary of Leasing Activity
(Unaudited)
| | Three Months Ended | | Year Ended |
| | | | | | | | | | | | | | | | | | | | | | | | |
| | March 31, 2010 | | | December 31, 2009 | | | December 31, 2008 | | | December 31, 2007 | | | December 31, 2006 |
| | GAAP | | Cash | | | GAAP | | Cash | | | GAAP | | Cash | | | GAAP | | Cash | | | GAAP | | Cash |
| | | | | | | | | | | | | | | | | | | | | | | | |
Lease Expirations | | | | | | | | | | | | | | | | | | | | | | | | |
Rentable Square Footage | | 594,955 | | 594,955 | | | 1,842,597 | | 1,842,597 | | | 1,664,944 | | 1,664,944 | | | 1,626,033 | | 1,626,033 | | | 1,224,143 | | 1,224,143 |
Expiring Rates | | $29.62 | | $28.83 | | | $30.70 | | $30.61 | | | $25.52 | | $26.88 | | | $26.97 | | $25.98 | | | $22.42 | | $24.62 |
| | | | | | | | | | | | | | | | | | | | | | | | |
Renewed/Released Space | | | | | | | | | | | | | | | | | | | | | | | | |
Leased Rentable Square Footage | | 348,388 | | 348,388 | | | 1,188,184 | | 1,188,184 | | | 1,254,285 | | 1,254,285 | | | 895,894 | | 895,894 | | | 704,826 | | 704,826 |
New Rates | | $30.37 | | $30.51 | | | $27.72 | | $28.11 | | | $29.34 | | $28.60 | | | $31.48 | | $31.41 | | | $23.67 | | $23.64 |
Expiring Rates | | $29.82 | | $30.30 | | | $26.78 | | $28.07 | | | $25.51 | | $27.08 | | | $28.66 | | $29.38 | | | $20.74 | | $21.94 |
Rental Rate Changes | | 1.8% | | 0.7% | | | 3.5% | | 0.1% | | | 15.0% | | 5.6% | | | 9.8% | | 6.9% | | | 14.1% | | 7.7% |
| | | | | | | | | | | | | | | | | | | | | | | | |
Developed/Redeveloped/Vacant Space Leased | | | | | | | | | | | | | | | | | | | | | | | | |
Rentable Square Footage | | 215,513 | | 215,513 | | | 676,163 | | 676,163 | | | 906,859 | | 906,859 | | | 686,856 | | 686,856 | | | 883,503 | | 883,503 |
New Rates | | $29.01 | | $26.83 | | | $36.00 | | $33.57 | | | $37.64 | | $35.04 | | | $33.68 | | $31.59 | | | $32.89 | | $31.02 |
| | | | | | | | | | | | | | | | | | | | | | | | |
Totals | | | | | | | | | | | | | | | | | | | | | | | | |
Rentable Square Footage | | 563,901 | | 563,901 | | | 1,864,347 | | 1,864,347 | | | 2,161,144 | | 2,161,144 | | | 1,582,750 | | 1,582,750 | | | 1,588,329 | | 1,588,329 |
New Rates | | $29.85 | | $29.11 | | | $30.73 | | $30.09 | | | $32.82 | | $31.30 | | | $32.44 | | $31.49 | | | $28.80 | | $27.74 |
TI’s/Lease Commissions per Square Foot | | $7.04 | | $7.04 | | | $5.49 | | $5.49 | | | $7.23 | | $7.23 | | | $6.95 | | $6.95 | | | $5.13 | | $5.13 |
Average Lease Terms | | 5.7 years | | 5.7 years | | | 4.5 years | | 4.5 years | | | 5.5 years | | 5.5 years | | | 5.1 years | | 5.1 years | | | 6.3 years | | 6.3 years |
25
ALEXANDRIA REAL ESTATE EQUITIES, INC.
Summary of Lease Expirations
March 31, 2010
(Unaudited)
Year of Lease
Expiration | | Number of
Leases Expiring | | Rentable Square
Footage (“RSF”) of
Expiring Leases | | Percentage of
Aggregate
Total RSF | | Annualized Base Rent
of Expiring Leases
(per RSF) |
2010 | | 51 | (1) | | 685,496 | (1) | | 5.8 | % | | $25.93 | |
2011 | | 80 | | | 1,753,855 | | | 14.9 | | | 27.51 | |
2012 | | 70 | | | 1,421,922 | | | 12.0 | | | 32.88 | |
2013 | | 63 | | | 1,133,913 | | | 9.6 | | | 29.02 | |
2014 | | 48 | | | 1,102,628 | | | 9.3 | | | 28.33 | |
2015 | | 35 | | | 699,122 | | | 5.9 | | | 26.55 | |
2016 | | 20 | | | 1,033,893 | | | 8.8 | | | 31.53 | |
2017 | | 13 | | | 684,973 | | | 5.8 | | | 34.63 | |
2018 | | 11 | | | 737,172 | | | 6.2 | | | 44.29 | |
2019 | | 6 | | | 254,703 | | | 2.2 | | | 34.64 | |
| | 2010 RSF of Expiring Leases | | Annualized Base Rent |
Markets | | Leased (2) | | Targeted for Redevelopment (3) | | Negotiating/
Anticipating | | Remaining
Expiring Leases | | Total | | of Expiring Leases
(per RSF) |
California – San Diego | | 7,941 | | 34,723 | (4) | 8,504 | | 40,746 | | 91,914 | | $26.62 | |
California – San Francisco Bay | | 114,433 | | – | | 25,644 | | 67,876 | | 207,953 | | 28.84 | |
Eastern Massachusetts | | 63,828 | | – | | 21,282 | | 56,123 | | 141,233 | | 28.58 | |
New Jersey/Suburban Philadelphia | | – | | – | | – | | 27,588 | | 27,588 | | 14.98 | |
Southeast | | 45,403 | | – | | 19,546 | | 8,934 | | 73,883 | | 23.06 | |
Suburban Washington, D.C. | | 2,952 | | – | | 4,457 | | 14,446 | | 21,855 | | 15.40 | |
Washington – Seattle | | 14,187 | | 93,000 | (5) | 1,989 | | 11,894 | | 121,070 | | 23.47 | |
International – Canada | | – | | – | | – | | – | | – | | – | |
Total | | 248,744 | | 127,723 | | 81,422 | | 227,607 | | 685,496 | (1) | $25.93 |
Percentage of expiring leases | | 36% | | 19% | | 12% | | 33% | | 100% | | |
| | 2011 RSF of Expiring Leases | | Annualized Base Rent |
Markets | | Leased (2) | | Targeted for Redevelopment (3) | | Negotiating/
Anticipating | | Remaining
Expiring Leases | | Total | | of Expiring Leases
(per RSF) |
California – San Diego | | 56,489 | | – | | 30,487 | | 114,996 | | 201,972 | | $25.88 | |
California – San Francisco Bay | | 25,508 | | 32,074 | (6) | 45,608 | | 161,364 | | 264,554 | | 35.05 | |
Eastern Massachusetts | | 83,561 | | 222,662 | (7) | 263,357 | | 187,004 | | 756,584 | | 29.96 | |
New Jersey/Suburban Philadelphia | | – | | – | | 14,872 | | 19,149 | | 34,021 | | 15.82 | |
Southeast | | – | | – | | 25,373 | | 15,302 | | 40,675 | | 18.87 | |
Suburban Washington, D.C. | | – | | – | | 151,601 | | 48,207 | | 199,808 | | 22.14 | |
Washington – Seattle | | – | | 181,790 | (8) | 39,427 | | 35,024 | | 256,241 | | 20.91 | |
International – Canada | | – | | – | | – | | – | | – | | – | |
Total | | 165,558 | | 436,526 | | 570,725 | | 581,046 | | 1,753,855 | | $27.51 | |
Percentage of expiring leases | | 9% | | 25% | | 33% | | 33% | | 100% | | | |
(1) Excludes seven month-to-month leases for approximately 21,000 rentable square feet.
(2) Represents leases that have been either (a) executed subsequent to March 31, 2010 as a renewal/extension, or (b) leased to another tenant.
(3) We selectively redevelop existing office/warehouse/shell space or newly acquired properties into generic laboratory space that can be leased at higher rental rates to our target life science cluster markets.
(4) Represents a 34,723 rentable square foot core and shell building with no interior improvements targeted for redevelopment into laboratory space.
(5) Represents a 93,000 rentable square foot industrial building targeted for redevelopment into single or multi-tenancy laboratory space.
(6) Represents a 32,074 rentable square foot single-tenancy space targeted for redevelopment into multi-tenancy laboratory space.
(7) Represents a 177,662 rentable square foot office building targeted for redevelopment into single or multi-tenancy laboratory space and a 45,000 rentable square foot single-tenancy space targeted for redevelopment into multi-tenancy laboratory space.
(8) Represents a 60,000 rentable square foot industrial building targeted for redevelopment into single or multi-tenancy laboratory space and a 121,790 rentable square foot office building targeted for redevelopment into single or multi-tenancy laboratory space.
26
ALEXANDRIA REAL ESTATE EQUITIES, INC.
20 Largest Client Tenants
March 31, 2010
(Unaudited)
| | | | | | | | Approximate | | Percentage of | | | | Percentage of | | Investment Grade Entities | | | |
| | | | | | Remaining Lease | | Aggregate | | Aggregate | | Annualized | | Aggregate | | | | | | | | | |
| | | | Number | | Term in Years | | Rentable | | Total Square | | Base Rent (3) | | Annualized | | Fitch | | Moody’s | | S&P Rating | | Education/ | |
| | Tenant | | of Leases | | (1) | | (2) | | Square Feet | | Feet | | (in thousands) | | Base Rent | | Rating (4) | | Rating (4) | | (4) | | Research | |
1 | | Novartis AG | | 6 | | 5.9 | | 6.2 | | | 442,621 | | 3.7 | % | | $ | 26,246 | | 8.0 | % | | AA | | Aa2 | | AA- | | – | |
2 | | Roche Holding Ltd | | 5 | | 7.5 | | 7.8 | | | 387,813 | | 3.3 | | | 14,850 | | 4.5 | | | AA- | | A2 | | AA- | | – | |
3 | | GlaxoSmithKline plc | | 6 | | 5.2 | | 6.2 | | | 350,278 | | 3.0 | | | 14,456 | | 4.4 | | | A+ | | A1 | | A+ | | – | |
4 | | ZymoGenetics, Inc. (5) | | 2 | | 9.1 | | 9.1 | | | 203,369 | | 1.7 | | | 8,747 | | 2.7 | | | – | | – | | – | | – | |
5 | | United States Government | | 6 | | 3.4 | | 3.4 | | | 308,205 | | 2.6 | | | 8,495 | | 2.6 | | | AAA | | Aaa | | AAA | | – | |
6 | | Massachusetts Institute of Technology | | 3 | | 2.2 | | 2.5 | | | 178,952 | | 1.5 | | | 7,882 | | 2.4 | | | – | | Aaa | | AAA | | ü | |
7 | | Gilead Sciences, Inc. | | 3 | | 8.3 | | 8.6 | | | 131,405 | | 1.1 | | | 6,810 | | 2.1 | | | – | | – | | – | | – | |
8 | | Theravance, Inc. (6) | | 2 | | 2.0 | | 2.0 | | | 170,244 | | 1.4 | | | 6,137 | | 1.9 | | | – | | – | | – | | – | |
9 | | Pfizer Inc. | | 2 | | 9.7 | | 9.7 | | | 120,140 | | 1.0 | | | 5,647 | | 1.7 | | | AA- | | A1 | | AA | | – | |
10 | | Amylin Pharmaceuticals, Inc. | | 3 | | 6.2 | | 6.4 | | | 158,983 | | 1.3 | | | 5,467 | | 1.7 | | | – | | – | | – | | – | |
11 | | The Scripps Research Institute | | 2 | | 6.7 | | 6.6 | | | 96,500 | | 0.8 | | | 5,193 | | 1.6 | | | – | | – | | – | | ü | |
12 | | Forrester Research, Inc. | | 1 | | 1.5 | | 1.5 | | | 145,551 | | 1.2 | | | 4,987 | | 1.5 | | | – | | – | | – | | – | |
13 | | Alnylam Pharmaceuticals, Inc. (7) | | 1 | | 6.5 | | 6.5 | | | 95,410 | | 0.8 | | | 4,466 | | 1.4 | | | – | | – | | – | | – | |
14 | | Dyax Corp. | | 1 | | 1.9 | | 1.9 | | | 67,373 | | 0.6 | | | 4,361 | | 1.3 | | | – | | – | | – | | – | |
15 | | Quest Diagnostics Incorporated | | 1 | | 6.8 | | 6.8 | | | 248,186 | | 2.1 | | | 4,341 | | 1.3 | | | BBB+ | | Baa2 | | BBB+ | | – | |
16 | | Infinity Pharmaceuticals, Inc. | | 2 | | 2.8 | | 2.8 | | | 67,167 | | 0.6 | | | 4,302 | | 1.3 | | | – | | ��� | | – | | – | |
17 | | Johnson & Johnson | | 2 | | 3.5 | | 2.9 | | | 170,451 | | 1.4 | | | 3,917 | | 1.2 | | | AAA | | Aaa | | AAA | | – | |
18 | | UMass Memorial Health Care, Inc. | | 6 | | 5.9 | | 5.5 | | | 189,722 | | 1.6 | | | 3,916 | | 1.2 | | | – | | – | | – | | ü | |
19 | | Monsanto Company | | 3 | | 9.1 | | 10.7 | | | 126,409 | | 1.2 | | | 3,902 | | 1.2 | | | A+ | | A2 | | A+ | | – | |
20 | | Fred Hutchinson Cancer Research Center | | 2 | | 4.3 | | 4.4 | | | 123,322 | | 1.1 | | | 3,854 | | 1.2 | | | – | | – | | – | | ü | |
| | Total/Weighted Average: | | 59 | | 5.6 | | 5.9 | | | 3,782,101 | | 32.0 | % | | $ | 147,976 | | 45.2 | % | | | | | | | | | |
(1) | Represents remaining lease term in years based on percentage of leased square feet. |
(2) | Represents remaining lease term in years based on percentage of annualized base rent in effect as of March 31, 2010. |
(3) | Annualized base rent means the annualized fixed base rental amount in effect as of March 31, 2010 (using rental revenue computed on a straight-line basis in accordance with GAAP). |
(4) | Ratings obtained from each respective rating agency (Fitch Ratings, Moody’s Investors Service, and Standard & Poor’s, respectively). |
(5) | As of December 31, 2009, Novo A/S owned approximately 30% of ZymoGenetics, Inc. |
(6) | As of February 16, 2010, GlaxoSmithKline plc owned approximately 15% of the outstanding stock of Theravance, Inc. |
(7) | As of December 31, 2009, Novartis AG owned approximately 13% of the outstanding stock of Alnylam Pharmaceuticals, Inc. |
27
ALEXANDRIA REAL ESTATE EQUITIES, INC.
Client Tenant Mix
March 31, 2010
(Unaudited)
| | Multinational Pharmaceutical | | Institutional: Independent Not-for-Profit/
Universities/Translational Research
Entities/Government |
Client tenant mix by annualized base rent | | ·Abbott Laboratories
·Astellas Pharma Inc.
·AstraZeneca plc
·Baxter International Inc.
·Bayer AG
·Bristol-Myers Squibb Company
·Eisai Co., Ltd.
·Eli Lilly and Company
·GlaxoSmithKline plc
·Johnson & Johnson
·Merck & Co., Inc.
·Novartis AG
·Pfizer Inc.
·Roche Holding Ltd
·Sanofi-Aventis | | ·Bill & Melinda Gates Foundation
·Duke University
·Environmental Protection Agency
·Fred Hutchinson Cancer Research Center
·Massachusetts Institute of Technology
·National Institutes of Health
·Sanford-Burham Medical Research Institute
·The Scripps Research Institute
·University of California, San Francisco
·University of Massachusetts
·UMass Memorial Health Care, Inc.
·University of Washington |
| | | |
| Biotechnology: Public & Private | | Medical Device, Life Science
Product, Service, and Biofuels |
| ·Alnylam Pharmaceuticals, Inc.
·Ambrx, Inc.
·Amgen Inc.
·Amylin Pharmaceuticals, Inc.
·Anaphore, Inc.
·Avila Therapeutics, Inc.
·Biogen Idec Inc.
·BrainCells Inc.
·Celegene Corporation
·Fate Therapeutics, Inc.
·Gilead Sciences, Inc.
·Ikaria Holdings, Inc.
·Intellikine, Inc.
·Intercell AG
·MacroGenics, Inc.
·Presidio Pharmaceuticals, Inc.
·Proteostasis Therapeutics, Inc.
·Theravance, Inc.
·Tolerx, Inc.
·ZymoGenetics, Inc. | | ·Bio-Rad Laboratories, Inc.
·Becton, Dickinson and Company
·Canon U.S. Life Sciences, Inc.
·Laboratory Corporation Of America Holdings
·Life Technologies Corporation
·Monsanto Company
·Pharmaceutical Product Development, Inc.
·Qiagen N.V.
·Quest Diagnostics Incorporated
·Sapphire Energy |
28
ALEXANDRIA REAL ESTATE EQUITIES, INC.
Summary of Additions and Dispositions of Properties
Three Months Ended March 31, 2010
(Dollars in thousands)
(Unaudited)
| | Acquisition | | Month of | | Rentable |
Markets | | Amount | | Acquisition | | Square Feet |
| | | | | | |
Additions to Operating Properties: | | N/A | | N/A | | N/A |
| | | | | | |
| | | | | | |
| | Acquisition | | Month of | | Developable |
Markets | | Amount | | Acquisition | | Square Feet |
| | | | | | |
Additions to Land: | | N/A | | N/A | | N/A |
| | | | | | |
| | | | | | |
| | Disposition | | Month of | | Rentable |
Markets | | Amount | | Disposition | | Square Feet |
| | | | | | |
Dispositions: | | | | | | |
| | | | | | |
Washington – Seattle | | $ | 11,780 | | March | | 70,647 |
| | | | | | | |
29
ALEXANDRIA REAL ESTATE EQUITIES, INC.
Real Estate
March 31, 2010
(Dollars in thousands)
(Unaudited)
| | Book Value | | Square Footage | |
| | | | | |
Land | | $ | 470,976 | | | |
Buildings and building improvements | | 3,290,318 | | | |
Other improvements | | 176,582 | | | |
Rental properties | | 3,937,876 | | 11,162,408 | |
Less: accumulated depreciation | | (538,570 | ) | | |
Rental properties, net | | 3,399,306 | | | |
Land held for future development (1) | | 294,631 | | 5,115,000 | |
Construction in progress: | | | | | |
Redevelopment | | 174,734 | | 648,031 | |
Development | | 353,695 | | 865,000 | |
Preconstruction | | 503,137 | | 4,649,000 | |
New markets and other projects (2) | | 295,299 | | 1,091,000 | |
Construction in progress (3) | | 1,326,865 | | 7,253,031 | |
Investment in unconsolidated real estate entity (4) | | 34,421 | | 428,000 | |
Real estate, net | | 5,055,223 | | 23,958,439 | |
Add: accumulated depreciation | | 538,570 | | | |
Gross book value of real estate | | $ | 5,593,793 | | 23,958,439 | |
(1) Our objective is to advance preconstruction efforts to reduce the time to deliver projects to prospective tenants. Since all efforts have been advanced to appropriate stages and no further preconstruction activities are ongoing, interest, property taxes, insurance, and other costs are expensed as incurred. Represents land and land improvements (site work and piles for foundation) related to land parcels that have been advanced through entitlement and certain levels of design. Amounts exclude a parcel supporting ground-up development of approximately 442,000 rentable square feet in New York City that we have an option to ground lease for future development, and land parcels supporting ground-up development of 924,000 rentable square feet in Edinburgh, Scotland that we have a long-term right to purchase.
(2) Includes site of future building approximating 410,000 rentable square feet related to our project in New York City and four buildings aggregating 547,000 rentable square feet related to two ground-up development projects in China.
(3) Represents costs related to assets undergoing preconstruction and construction activities including development and redevelopment. Preconstruction activities include entitlements, permitting, design, site work, and other activities prior to commencement of vertical construction of aboveground shell and core. We are required to capitalize interest and other direct project costs during the period an asset is undergoing activities to prepare it for its intended use. Capitalization of interest and other direct project costs cease after a project is substantially complete and ready for its intended use. In addition, should activities necessary to prepare an asset for its intended use cease, interest, taxes, insurance, and certain other costs would be expensed as incurred.
(4) Book value represents our equity investment in a real estate entity that owns a land parcel supporting ground-up development of approximately 428,000 rentable square feet in the Longwood Medical Area of Boston.
30
ALEXANDRIA REAL ESTATE EQUITIES, INC.
Value Added Activities
March 31, 2010
(Unaudited)
The following table summarizes our current and embedded future development and redevelopment square footage including preconstruction projects.
| | Square Footage | |
| | Construction in Progress | | Investment in | | | | | | | |
Markets | | Redevelopment | | Development | | Preconstruction | | New Markets and
Other Projects (1) | | Unconsolidated
Real Estate
Entity | | Land | | Future
Redevelopment | | Total Value
Added Square
Footage | |
| | | | | | | | | | | | | | | | | |
California – San Diego | | 198,247 | | – | | 298,000 | | – | | – | | 145,000 | | 178,000 | | 819,247 | |
| | | | | | | | | | | | | | | | | |
California – San Francisco Bay/ Mission Bay | | – | | 263,000 | | 2,030,000 | | – | | – | | 290,000 | | – | | 2,583,000 | |
| | | | | | | | | | | | | | | | | |
California – San Francisco Bay/ So. San Francisco | | – | | 292,000 | | 144,000 | | – | | – | | 1,051,000 | | 25,000 | | 1,512,000 | |
| | | | | | | | | | | | | | | | | |
Eastern Massachusetts | | 292,750 | | – | | 1,669,000 | | – | | 428,000 | | 225,000 | | 522,000 | | 3,136,750 | |
| | | | | | | | | | | | | | | | | |
Suburban Washington, D.C. | | 135,843 | | – | | – | | – | | – | | 787,000 | | 408,000 | | 1,330,843 | |
| | | | | | | | | | | | | | | | | |
Washington – Seattle | | – | | – | | 248,000 | | – | | – | | 1,049,000 | | 318,000 | | 1,615,000 | |
| | | | | | | | | | | | | | | | | |
International – Canada | | – | | – | | – | | – | | – | | 827,000 | | – | | 827,000 | |
| | | | | | | | | | | | | | | | | |
Other | | 21,191 | | 310,000 | | 260,000 | | 1,091,000 | | – | | 741,000 | | 222,000 | | 2,645,191 | |
| | | | | | | | | | | | | | | | | |
Total | | 648,031 | | 865,000 | | 4,649,000 | | 1,091,000 | | 428,000 | (2) | 5,115,000 | (3) | 1,673,000 | (4) | 14,469,031 | |
(1) | A component of our business model includes ground-up development projects in new markets and other unique projects. We have two development parcels in China. One development parcel is located in South China where a two-building project aggregating approximately 275,000 rentable square feet is under construction. The second development parcel is located in North China where a two-building project aggregating approximately 272,000 rentable square feet is under construction. Additionally, other projects include construction related to site work, plaza, park and underground parking at the Alexandria CenterTM for Life Science – New York City, a unique one-of-a-kind highly advanced state-of-the-art urban science park in the city and in the adjoining future building approximating 410,000 rentable square feet. |
(2) | Represents a parcel supporting approximately 428,000 rentable square feet in the Longwood Medical Area of Boston held by an unconsolidated real estate entity. |
(3) | Our objective is to advance preconstruction efforts to reduce the time to deliver projects to prospective tenants. Since all efforts have been advanced to appropriate stages and no further preconstruction activities are ongoing, interest, property taxes, insurance, and other costs are expensed as incurred. Represents land and land improvements (site work and piles for foundation) related to land parcels that have been advanced through entitlement and certain levels of design. Amounts exclude a parcel supporting ground-up development of approximately 442,000 rentable square feet in New York City that we have an option to ground lease for future development, and land parcels supporting ground-up development of 924,000 rentable square feet in Edinburgh, Scotland that we have a long-term right to purchase. |
(4) | Square footage related to future redevelopment is included in our operating asset base and represents non-laboratory uses (office, industrial, or warehouse) for future conversion to life science laboratory space. |
31
ALEXANDRIA REAL ESTATE EQUITIES, INC.
Value Added Activities
March 31, 2010
(continued)
(Unaudited)
Construction in progress includes the following value added activities (dollars in thousands, except cost per square foot):
Value Added Activities | | Amount (1) | | Square Feet | | Cost per Square Foot | |
| | | | | | | |
Redevelopment projects | | $ | 174,734 | | 648,031 | | $ | 270 | |
| | | | | | | |
Development projects | | 353,695 | | 865,000 | | 409 | |
| | | | | | | |
Preconstruction projects | | 503,137 | | 4,649,000 | | 108 | |
| | | | | | | |
New markets and other projects | | 295,299 | | 1,091,000 | | 271 | |
| | | | | | | |
Total | | $ | 1,326,865 | | 7,253,031 | | $ | 183 | |
A key component of our business model is our value added redevelopment and development programs. These programs are focused on providing high quality, generic, and reusable life science laboratory space to meet the real estate requirements of a wide range of clients in the life science industry. Upon completion, each value added project is expected to generate significant revenues and cash flows. Our redevelopment and development projects are generally in locations highly desirable by life science entities which we believe results in higher occupancy levels, longer lease terms, and higher rental income and returns. Redevelopment projects consist of the permanent change in use of office, warehouse, and shell space into generic life science laboratory space, including the conversion of single-tenancy space to multi-tenancy space or multi-tenancy space to single-tenancy space. Our incremental investment in redevelopment projects for the conversion of non-laboratory space to laboratory space generally range from $75 to $150 per square foot depending on the nature of the existing building improvement and laboratory design. Development projects consist of the ground-up development of generic life science laboratory facilities. We also have certain significant value added projects undergoing important and substantial preconstruction activities to bring these assets to their intended use. These critical activities add significant value for future ground-up development (which are projected to yield substantial revenues) and are required for the ultimate vertical construction of buildings.
(1) | Represents costs related to assets undergoing preconstruction and construction activities including development and redevelopment. Preconstruction activities include entitlements, permitting, design, site work, and other activities prior to commencement of vertical construction of aboveground shell and core. We are required to capitalize interest and other direct project costs during the period an asset is undergoing activities to prepare it for its intended use. Capitalization of interest and other direct project costs cease after a project is substantially complete and ready for its intended use. In addition, should activities necessary to prepare an asset for its intended use cease, interest, taxes, insurance, and certain other costs would be expensed as incurred. |
32
ALEXANDRIA REAL ESTATE EQUITIES, INC.
Value Added Activities
March 31, 2010
(continued)
(Unaudited)
The following table summarizes total rentable square footage (“RSF”) undergoing redevelopment:
Markets/Submarkets | | Placed in
Redevelopment | | Estimated
In-Service
Dates | | RSF
Undergoing
Redevelopment | | Total
Property
RSF | | Leased | | Negotiating/
Committed | | Marketing | | Redevelopment/Leasing Status | |
| | | | | | | | | | | | | | | | | |
California – San Diego/Torrey Pines | | 2007 | | 2010 | | 84,504 | | 84,504 | | – | | – | | 100% | | Construction/Marketing; Negotiating | |
| | | | | | | | | | | | | | | | | |
California – San Diego/Torrey Pines | | 2007 | | 2010 | | 31,927 | | 76,084 | | 74% | | – | | 26% | | Construction/74% Leased; Marketing Remainder | |
| | | | | | | | | | | | | | | | | |
California – San Diego/Torrey Pines | | 2010 | | 2012 | | 81,816 | | 81,816 | | – | | – | | 100% | | Design/Marketing | |
| | | | | | | | | | | | | | | | | |
Eastern Massachusetts/Cambridge | | 2007 | | 2010 | | 85,091 | | 366,412 | | 61% | | 39% | | – | | Construction/Leased; Committed | |
| | | | | | | | | | | | | | | | | |
Eastern Massachusetts/Cambridge | | 2009 | | 2011 | | 17,114 | | 194,776 | | – | | – | | 100% | | Design/Marketing | |
| | | | | | | | | | | | | | | | | |
Eastern Massachusetts/Suburban | | 2010 | | 2012 | | 47,500 | | 92,500 | | – | | – | | 100% | | Design/Marketing | |
| | | | | | | | | | | | | | | | | |
Eastern Massachusetts/Suburban | | 2007 | | 2010 | | 113,045 | | 113,045 | | – | | – | | 100% | | Construction/Marketing | |
| | | | | | | | | | | | | | | | | |
Eastern Massachusetts/Suburban | | 2008 | | 2010 | | 30,000 | | 30,000 | | – | | – | | 100% | | Design; Construction/Marketing | |
| | | | | | | | | | | | | | | | | |
Southeast/Florida | | 2006 | | 2010 | | 21,191 | | 44,855 | | – | | 14% | | 86% | | Construction/Marketing; Negotiating | |
| | | | | | | | | | | | | | | | | |
Suburban Washington, D.C./Shady Grove | | 2009 | | 2010 | | 58,632 | | 58,632 | | 100% | | – | | – | | Design; Construction/Leased | |
| | | | | | | | | | | | | | | | | |
Suburban Washington, D.C./Shady Grove | | 2009 | | 2011 | | 77,211 | | 225,096 | | – | | 100% | | – | | Design/Negotiating for Full Bldg User | |
| | | | | | | | | | | | | | | | | |
| | | | | | 648,031 | | 1,367,720 | | 21% | | 17% | | 62% | | | |
As of December 31, 2009, our estimated cost to complete was approximately $69 per rentable square foot for the 648,031 rentable square feet undergoing a permanent change in use to life science laboratory space through redevelopment. Our final costs for these projects will ultimately depend on many factors, including construction and infrastructure requirements for each tenant, final lease negotiations, and the amount of costs funded by each tenant.
33
ALEXANDRIA REAL ESTATE EQUITIES, INC.
Value Added Activities
March 31, 2010
(continued)
(Unaudited)
The following table summarizes our properties undergoing ground-up development (dollars in thousands):
Markets/Submarkets | | Building
Description | | Estimated
In-Service
Dates | | Leased | | Negotiating/
Committed | | Marketing | | Rentable
Square Feet | | Leasing Status | |
| | | | | | | | | | | | | | | |
California – San Francisco Bay/Mission Bay | | Multi-tenant Bldg.
with 3% Retail | | 2010 | | 71% | | 29% | | – | | 158,000 | | 158,000 Rentable Square Feet Leased or Committed to UCSF and a Large Cap Life Science Company | |
| | | | | | | | | | | | | | | |
California – San Francisco Bay/Mission Bay | | Single or Multi-tenant
Bldg. with 4% Retail | | 2011 | | 47% | | 23% | | 30% | | 105,000 | | 49,000 Rentable Square Feet Leased to a Large Cap Life Science Company | |
| | | | | | | | | | | | | | | |
California – San Francisco Bay/So. San Francisco | | Two Bldgs.,
Single or Multi-tenant | | 2010 | | – | | – | | 100% | | 162,000 | | Redesign for Multi-Tenancy at Both Buildings/Marketing | |
| | | | | | | | | | | | | | | |
California – San Francisco Bay/So. San Francisco | | Single Tenant Bldg. | | 2010 | | 55% | | 45% | | – | | 130,000 | | 72,000 Rentable Square Feet Leased to Exelixis Inc.; Negotiating Lease for All Remaining Space | |
| | | | | | | | | | | | | | | |
New York – New York City – East Tower | | Multi-tenant Bldg.
with 6% Retail | | 2010/2011 | | 53% | | 42% | | 5% | | 310,000 | | 104,000 Rentable Square Feet Leased to Eli Lilly and Company; Leased 60,000 Rentable Square Feet for Restaurant/Food, Conference Center, and Core Services; Current Life Science Laboratory and Office Negotiations for Substantially All Remaining Space | |
| | | | | | | | | | | | | |
Total Properties Undergoing Ground-Up Development | | | | 46% | | 30% | | 24% | | 865,000 | | | |
As of March 31, 2010, our estimated cost to complete the approximately 865,000 rentable square feet undergoing ground-up development was approximately $139 per rentable square foot. This estimate includes costs related to tenant infrastructure costs, including requirements for executed leases with Eli Lilly and Company, UCSF, and a large cap life science company. This estimate also includes certain costs related to incremental investment by the Company with incremental returns which are beyond the original estimated investment anticipated at the beginning of each project. Our final costs for these projects will ultimately depend on many factors, including construction and infrastructure requirements for each tenant, final lease negotiations, and the amount of costs funded by each tenant.
34
ALEXANDRIA REAL ESTATE EQUITIES, INC.
Summary of Capital Expenditures
(Unaudited)
| | | | Three Months
Ended | | Year Ended December 31, | |
| | Average (1) | | March 31, 2010 | | 2009 | | 2008 | | 2007 | | 2006 | | 2005 | |
| | | | | | | | | | | | | | | |
Capital expenditures (2): | | | | | | | | | | | | | | | |
| | | | | | | | | | | | | | | |
Major capital expenditures | | $ | 643,000 | | $ | – | | $ | 529,000 | | $ | 405,000 | | $ | 1,379,000 | | $ | 575,000 | | $ | 972,000 | |
| | | | | | | | | | | | | | | |
Recurring capital expenditures | | $ | 1,023,000 | | $ | 303,000 | | $ | 1,405,000 | | $ | 955,000 | | $ | 648,000 | | $ | 639,000 | | $ | 1,278,000 | |
| | | | | | | | | | | | | | | |
Square feet in asset base | | 10,776,882 | | 11,754,295 | | 11,740,993 | | 11,770,769 | | 11,476,217 | | 9,790,326 | | 8,128,690 | |
| | | | | | | | | | | | | | | |
Per square foot: | | | | | | | | | | | | | | | |
| | | | | | | | | | | | | | | |
Major capital expenditures | | $ | 0.06 | | $ | – | | $ | 0.05 | | $ | 0.03 | | $ | 0.12 | | $ | 0.06 | | $ | 0.12 | |
| | | | | | | | | | | | | | | |
Recurring capital expenditures | | $ | 0.09 | | $ | 0.03 | | $ | 0.12 | | $ | 0.08 | | $ | 0.06 | | $ | 0.07 | | $ | 0.16 | |
| | | | | | | | | | | | | | | |
Tenant improvements and leasing costs: | | | | | | | | | | | | | | | |
| | | | | | | | | | | | | | | |
Re-tenanted space (3) | | | | | | | | | | | | | | | |
| | | | | | | | | | | | | | | |
Tenant improvements and leasing costs | | $ | 1,767,000 | | $ | 626,000 | | $ | 1,475,000 | | $ | 3,481,000 | | $ | 1,446,000 | | $ | 1,370,000 | | $ | 324,000 | |
| | | | | | | | | | | | | | | |
Re-tenanted square feet | | 298,807 | | 117,733 | | 211,638 | | 505,773 | | 224,767 | | 248,846 | | 130,887 | |
| | | | | | | | | | | | | | | |
Per square foot | | $ | 5.91 | | $ | 5.32 | | $ | 6.97 | | $ | 6.88 | | $ | 6.43 | | $ | 5.51 | | $ | 2.48 | |
| | | | | | | | | | | | | | | |
Renewal space | | | | | | | | | | | | | | | |
| | | | | | | | | | | | | | | |
Tenant improvements and leasing costs | | $ | 2,123,000 | | $ | 859,000 | | $ | 3,263,000 | | $ | 2,364,000 | | $ | 1,942,000 | | $ | 957,000 | | $ | 778,000 | |
| | | | | | | | | | | | | | | |
Renewal square feet | | 740,314 | | 230,655 | | 976,546 | | 748,512 | | 671,127 | | 455,980 | | 666,058 | |
| | | | | | | | | | | | | | | |
Per square foot | | $ | 2.87 | | $ | 3.72 | | $ | 3.34 | | $ | 3.16 | | $ | 2.89 | | $ | 2.10 | | $ | 1.17 | |
The table above shows the average per square foot property-related capital expenditures, tenant improvements, and leasing costs (excluding capital expenditures and tenant improvements that are recoverable from tenants, revenue-enhancing, or related to properties that have undergone redevelopment).
(1) | Average includes annualized amounts for the three months ended March 31, 2010. |
(2) | Property-related capital expenditures include all major capital and recurring capital expenditures except capital expenditures that are recoverable from tenants, revenue-enhancing capital expenditures, or costs related to the redevelopment of a property. Major capital expenditures consist of roof replacements and heavy-duty heating, ventilation, and air conditioning systems that are typically identified and considered at the time a property is acquired. |
(3) | Excludes space that has undergone redevelopment before re-tenanting. |
35
ALEXANDRIA REAL ESTATE EQUITIES, INC.
Definitions and Other Information
March 31, 2010
(Unaudited)
This section contains additional information for sections throughout this supplemental information package as well as explanations of certain non-GAAP financial measures in sections of this document and the reasons why management believes these measures provide useful information to investors about our financial condition, results of operations, or liquidity. Additional detail can be found in our most recent annual report on Form 10-K and subsequent quarterly reports on Form 10-Q, as well as other documents filed with or furnished to the SEC from time to time.
Adjusted EBITDA and Adjusted EBITDA Margin
EBITDA represents earnings before interest, taxes, depreciation and amortization (“EBITDA”), a non-GAAP financial measure, and is used as a supplemental measure of operating performance. Adjusted EBITDA is calculated as EBITDA excluding impairments, gains or losses from sales of real estate, gains or losses on early extinguishment of debt, and net stock compensation expenses. We use EBITDA and Adjusted EBITDA as a supplemental measure of our operating performance. We consider Adjusted EBITDA to provide investors relevant and useful information because it permits investors to view income from our operations on an unleveraged basis before the effects of taxes, non-cash depreciation and amortization, impairments, gains or losses from sales of real estate, gains or losses on early extinguishment of debt, and net stock compensation expenses. By excluding interest expense, EBITDA and Adjusted EBITDA allow investors to measure our operating performance independent of our capital structure and indebtedness and, therefore, allow for a more meaningful comparison of our operating performance to that of other companies, both in the real estate industry and in other industries. We believe investors should consider EBITDA and Adjusted EBITDA, in conjunction with net income (the primary measure of our performance) and the other required United States generally accepted accounting principles (“GAAP”) measures of our performance, to improve their understanding of our operating results, and to make more meaningful comparisons of our performance between periods and against other companies. EBITDA and Adjusted EBITDA have limitations as analytical tools and should be used in conjunction with our required GAAP presentations. EBITDA and Adjusted EBITDA do not reflect our historical cash expenditures or future cash requirements for capital expenditures or contractual commitments. While EBITDA and Adjusted EBITDA are relevant and widely used measures of operating performance, it does not represent net income or cash flow from operations as defined by GAAP, and it should not be considered as an alternative to those indicators in evaluating operating performance or liquidity. Further, our computation of EBITDA and Adjusted EBITDA may not be comparable to similar measures reported by other companies.
36
ALEXANDRIA REAL ESTATE EQUITIES, INC.
Definitions and Other Information
March 31, 2010
(Unaudited)
Adjusted EBITDA and Adjusted EBITDA Margin (continued)
The following table reconciles net income to EBITDA and Adjusted EBITDA (dollars in thousands):
| | Three Months Ended | |
| | 3/31/2010 | | 12/31/2009 | | 9/30/2009 | | 6/30/2009 (1) | | 3/31/2009 (2) | |
Net income | | $ | 28,785 | | $ | 29,905 | | $ | 26,378 | | $ | 44,116 | | $ | 41,249 | |
Add: Interest expense (3) | | 17,562 | | 19,452 | | 21,225 | | 21,373 | | 20,222 | |
Add: Depreciation and amortization (3) | | 29,738 | | 29,004 | | 28,336 | | 29,722 | | 31,446 | |
EBITDA | | 76,085 | | 78,361 | | 75,939 | | 95,211 | | 92,917 | |
Add: Stock compensation expense | | 2,731 | | 3,194 | | 4,141 | | 3,694 | | 3,022 | |
Subtract: Gain on sales of property | | (24 | ) | (393 | ) | – | | – | | (2,234 | ) |
Subtract: Gain on early extinguishment of debt | | – | | – | | – | | (11,254 | ) | – | |
Adjusted EBITDA | | $ | 78,792 | | $ | 81,162 | | $ | 80,080 | | $ | 87,651 | | $ | 93,705 | |
| | | | | | | | | | | |
Total revenues | | $ | 116,487 | | $ | 115,125 | | $ | 115,826 | | $ | 121,039 | | $ | 131,559 | |
Adjusted EBITDA margin | | 68% | | 70% | | 69% | | 72% | | 71% | |
(1) | During the second quarter of 2009, we recognized additional income approximating $7.2 million for a cash receipt related to real estate acquired in November 2007. Additionally during the second quarter of 2009, we recognized a gain on early extinguishment of debt of approximately $11.3 million related to the repurchase, in privately negotiated transactions, of approximately $75 million (par value) of our 3.7% unsecured convertible notes. |
(2) | During the first quarter of 2009, we recognized approximately $18.5 million of additional rental income related to the modification of a lease in South San Francisco. |
(3) | Includes interest expense, depreciation and amortization for assets “held for sale” reflected as discontinued operations (for the periods prior to when such assets were designated as “held for sale”). |
Adjusted Funds from Operations
Adjusted Funds from Operations (“AFFO”) is a non-GAAP financial measure we believe is a useful supplemental measure of our performance. We compute AFFO attributable to Alexandria Real Estate Equities, Inc.’s common stockholders by adding to or deducting from FFO attributable to Alexandria Real Estate Equities, Inc.’s common stockholders (i) recurring and non-recurring capital expenditures required to maintain and re-tenant our properties, (ii) second generation tenant improvements and leasing costs on re-tenanted and renewal space (excludes redevelopment expenditures), (iii) capitalized income from development projects, (iv) gain on early extinguishment of debt, (v) amortization of loan fees, debt premiums/discounts and acquired above and below market leases, (vi) effects of deferred rent and deferred rent on ground leases, (vii) non-cash compensation expense related to restricted stock awards, and (viii) other non-cash income or charges, including impairment charges. AFFO is not intended to represent cash flow for the period, and is only intended to provide an additional measure of performance by adjusting the effect of certain items noted above included in FFO, as well as recurring capital expenditures and leasing costs. We believe that net income attributable to Alexandria Real Estate Equities, Inc.’s common stockholders is the most directly comparable GAAP financial measure to AFFO attributable to Alexandria Real Estate Equities, Inc.’s common stockholders. We also believe that AFFO attributable to Alexandria Real Estate Equities, Inc.’s common stockholders provides useful performance information to the investment community about our financial position as compared to other REITs since AFFO is a widely reported measure used by other REITs. However, other REITs may use different methodologies for calculating AFFO and, accordingly, our AFFO may not be comparable to other REITs.
37
ALEXANDRIA REAL ESTATE EQUITIES, INC.
Definitions and Other Information (continued)
March 31, 2010
(Unaudited)
Capitalized interest
A key component of our business model is our value added redevelopment and development programs. These programs are focused on providing high quality generic life science laboratory space to meet the real estate requirements and are reusable by various life science industry tenants. Upon completion, each value added project is expected to generate significant revenues and cash flows. Our redevelopment and development projects are generally in locations highly desirable by life science entities which we believe results in higher occupancy levels, longer lease terms, and higher rental income and returns. Redevelopment projects consist of the permanent change in use of office, warehouse, and shell space into generic life science laboratory space, including the conversion of single-tenancy space to multi-tenancy space or multi-tenancy space to single-tenancy space. Development projects consist of the ground-up development of generic life science laboratory facilities. We also have certain significant value added projects undergoing important and substantial preconstruction activities to bring these assets to their intended use. These critical activities add significant value for future ground-up development and are required for the ultimate vertical construction of buildings. Ultimately, these land parcels will provide valuable opportunities for new ground-up construction projects. The projects will provide high quality facilities for the life science industry and will generate significant revenue and cash flows for the Company. We are required to capitalize construction, redevelopment, and development costs, including preconstruction costs, interest, property taxes, insurance, and other costs directly related and essential to the project while activities are ongoing to prepare an asset for its intended use. Capitalized interest for the three months ended March 31, 2010 assuming conversion of our 8% unsecured convertible notes was approximately $19.5 million. The average interest rate for the three months ended March 31, 2010 required for the purpose of calculating capitalization of interest was approximately 5.20%, assuming conversion of our 8% unsecured convertible notes. Capitalized interest assumes the conversion of our 8% unsecured convertible notes for all periods shown except for the three months ended March 31, 2009 since we did not issue the notes until April 2009.
Dividend Payout Ratio
Dividend payout ratio (common stock) is the ratio of the absolute dollar amount of dividends on our common stock (shares of common stock outstanding on the respective record date multiplied by the related dividend per share) to FFO attributable to Alexandria Real Estate Equities, Inc.’s common stockholders on a diluted basis.
Dividend Yield
Dividend yield for the quarter represents the annualized quarter dividend divided by the closing common stock price at the end of the quarter.
Earnings per Share
We account for unvested restricted stock awards which contain nonforfeitable rights to dividends as participating securities and include these securities in the computation of earnings per share pursuant to the two-class method. Under the two-class method, we allocate net income after preferred stock dividends and amounts attributable to noncontrolling interests to common stockholders and unvested restricted stock awards based on their respective participation rights to dividends declared (or accumulated) and undistributed earnings. Diluted earnings per share is computed using the weighted average shares of common stock outstanding determined for the basic earnings per share computation plus the effect of any dilutive securities, including the dilutive effect of stock options using the treasury stock method.
38
ALEXANDRIA REAL ESTATE EQUITIES, INC.
Definitions and Other Information (continued)
March 31, 2010
(Unaudited)
Earnings per Share (continued)
We applied the if-converted method for our 8% unsecured senior convertible notes (“8% Unsecured Convertible Notes”). In applying the if-converted method, conversion is assumed for purposes of calculating diluted earnings per share if the effect would be dilutive to earnings per share. A separate calculation is performed for FFO per share. If the assumed conversion pursuant to the if-converted method is dilutive, diluted earnings per share would be calculated by adding back interest charges applicable to our 8% Unsecured Convertible Notes to the numerator and our 8% Unsecured Convertible Notes would be assumed to have been converted at the beginning of the period presented (if outstanding for the entire period) and the resulting incremental shares associated with the assumed conversion would be included in the denominator. For purposes of calculating diluted earnings per share, the if-converted method was dilutive to diluted earnings per share only for the three months ended June 30, 2009. We did not assess the impact of our 8% Unsecured Convertible Notes for the three months ended March 31, 2009 since we did not issue the notes until April 2009.
EBITDA
See Adjusted EBITDA.
Funds from Operations
GAAP basis accounting for real estate assets utilizes historical cost accounting and assumes real estate values diminish over time. In an effort to overcome the difference between real estate values and historical cost accounting for real estate assets, the Board of Governors of NAREIT established the measurement tool of Funds from Operations (“FFO”). Since its introduction, FFO has become a widely used non-GAAP financial measure among real estate investment trusts (“REITs”). We believe that FFO is helpful to investors as an additional measure of the performance of an equity REIT. We compute FFO in accordance with standards established by the Board of Governors of NAREIT in its April 2002 White Paper (the “White Paper”) and related implementation guidance, which may differ from the methodology for calculating FFO utilized by other equity REITs, and, accordingly, may not be comparable to such other REITs. The White Paper defines FFO as net income (loss) (computed in accordance with GAAP), excluding gains (or losses) from sales, plus real estate related depreciation and amortization, and after adjustments for unconsolidated partnerships and joint ventures.
FFO should not be considered as an alternative to net income (determined in accordance with GAAP) as an indication of financial performance, or to cash flows from operating activities (determined in accordance with GAAP) as a measure of our liquidity, nor is it indicative of funds available to fund our cash needs, including our ability to make distributions.
Gross Assets (excluding cash and restricted cash)
Gross assets (excluding cash and restricted cash) is equal to total assets plus accumulated depreciation, less cash, cash equivalents, and restricted cash.
39
ALEXANDRIA REAL ESTATE EQUITIES, INC.
Definitions and Other Information (continued)
March 31, 2010
(Unaudited)
Investment in Unconsolidated Real Estate Entity
In June 2009, the Financial Accounting Standards Board (the “FASB”) issued new accounting literature with respect to variable interest entities (“VIEs”). The new guidance impacts the consolidation guidance applicable to VIEs and among other things requires a qualitative rather than a quantitative analysis to determine the primary beneficiary of a VIE, continuous assessments of whether a company is the primary beneficiary of a VIE, and enhanced disclosures about a company’s involvement with a VIE. We prospectively adopted the new guidance on January 1, 2010.
In 2007, we formed an entity with a development partner for the purpose of owning, developing, leasing, managing, and operating a development parcel supporting a future building aggregating 428,000 rentable square feet. The development parcel serves as collateral for a non-recourse secured loan due in 2012 with a balance of $38.4 million loan balance as of March 31, 2010 and December 31, 2009. In 2009, the entity entered into an interest rate cap agreement related to the secured note with a notional amount approximating $38.4 million effective May 15, 2009 and terminating on January 3, 2012. The agreement sets a ceiling on one month LIBOR at 2.50% related to the secured note. Prior to the adoption of the new VIE guidance, we determined that the entity qualified as a VIE for which we were also the entity’s primary beneficiary since we would absorb the majority of the entity’s expected losses and receive a majority of the entity’s expected residual returns. As a result, we had consolidated the entity since its inception in 2007. The new VIE literature cites two criteria to determine the primary beneficiary of a VIE, both of which must be met to be deemed the primary beneficiary of a VIE. Upon adoption of the new VIE guidance on January 1, 2010, we determined that we did not meet both criteria since we do not have the power to direct the activities of the VIE that most significantly impact the VIE’s economic performance. The decisions that most significantly impact the VIE’s economic performance require both our consent and that of our partner including all major operating, investing, and financing decisions as well as decisions over major expenditures. Because we share power over the decisions that most significantly impact the VIE’s economic performance, we determined that we are not the primary beneficiary of the VIE. As of January 1, 2010, we prospectively deconsolidated the VIE at its carrying amounts and recorded a corresponding entry to investment in unconsolidated real estate entity pursuant to the equity method. As of March 31, 2010, our investment in the unconsolidated entity was approximately $34.4 million.
Net Debt
Net debt is equal to the sum of secured notes payable, unsecured line of credit, unsecured term loan, and unsecured convertible notes, less cash, cash equivalents, and restricted cash.
40
ALEXANDRIA REAL ESTATE EQUITIES, INC.
Definitions and Other Information (continued)
March 31, 2010
(Unaudited)
Same Property Comparisons
The summary of same property comparisons represents operating data for all properties that were fully operating for the entire periods presented for the quarter periods (the “First Quarter Same Properties”). Same property occupancy for the quarters ended March 31, 2010 and 2009 was 93.2% and 93.5%, respectively.
Revenue less operating expenses computed in accordance with GAAP is total revenue associated with the First Quarter Same Properties (excluding lease termination fees, if any), less property operating expenses. Under GAAP, rental revenue is recognized on a straight-line basis over the respective lease terms. Revenue less operating expenses on a cash basis is total revenue associated with the First Quarter Same Properties (excluding lease termination fees, if any), less property operating expenses, adjusted to exclude the effect of straight-line rent adjustments required by GAAP. Straight-line rent adjustments for the quarters ended March 31, 2010 and 2009 for the First Quarter Same Properties were $1,961,000 and $1,690,000, respectively. We believe that revenue less operating expenses on a cash basis is helpful to investors as an additional measure of operating performance because it eliminates straight-line rent adjustments to rental revenue.
Same property results for 2010 excludes approximately $18.5 million of additional rental income in the first quarter of 2009 in connection with a modification of a lease for one property in the South San Francisco market. The lease with the prior tenant was terminated in order to deliver this building to Roche Holding Ltd under a ten-year lease and this $18.5 million consideration was part of our overall returns for this property. Our same property results assuming additional rental income from the prior lease was amortized over the lease term with Roche Holding Ltd would have been 0.8% and 0.4% on a GAAP and cash basis, respectively.
Fees received from tenants in connection with termination of their leases, if any, are excluded from revenue in the Summary of Same Property Comparisons. As of March 31, 2010, approximately 88% of our leases (on a rentable square footage basis) were triple net leases, requiring tenants to pay substantially all real estate taxes and insurance, common area and other operating expenses, including increases thereto. In addition, approximately 8% of our leases (on a rentable square footage basis) required the tenants to pay a majority of operating expenses.
41
ALEXANDRIA REAL ESTATE EQUITIES, INC.
Definitions and Other Information (continued)
March 31, 2010
(Unaudited)
Tangible Non-Real Estate Assets
Tangible non-real estate assets include the following as of each period presented (in thousands):
| | 3/31/2010 | | 12/31/2009 | | 9/30/2009 | | 6/30/2009 | | 3/31/2009 | |
Cash and cash equivalents | | $ | 70,980 | | $ | 70,628 | | $ | 68,280 | | $ | 70,313 | | $ | 125,281 | |
Restricted cash | | 35,832 | | 47,291 | | 60,002 | | 51,683 | | 54,770 | |
Tenant receivables | | 2,710 | | 3,902 | | 3,789 | | 4,665 | | 5,992 | |
Investments | | 76,918 | | 72,882 | | 71,080 | | 66,068 | | 64,788 | |
Other tangible non-real estate assets | | 35,808 | | 32,737 | | 35,925 | | 31,287 | | 32,475 | |
Total tangible non-real estate assets | | $ | 222,248 | | $ | 227,440 | | $ | 239,076 | | $ | 224,016 | | $ | 283,306 | |
Total Market Capitalization
Total market capitalization is equal to the sum of outstanding shares of series C preferred stock and common stock multiplied by the related closing price at the end of each period presented, the liquidation value of the series D cumulative convertible preferred stock, and total debt (secured notes payable, unsecured line of credit, unsecured term loan, and unsecured convertible notes less).
Weighted Average Interest Rate for Capitalization
The weighted average interest rate for calculating capitalization of interest required pursuant to GAAP represents a weighted average rate based on the rates applicable to borrowings outstanding during the period and includes the impact of our interest rate hedge agreements, amortization of debt discounts/premiums, and amortization of loan fees. A separate calculation is performed each month to determine our weighted average interest rate for capitalization for the month. The rate will vary each month due to changes in variable interest rates, the outstanding debt balances, the proportion of variable rate debt to fixed rate debt, the amount and terms of effective interest rate hedge agreements, and the amount of loan fee amortization. Unhedged LIBOR-based debt outstanding under our credit facility had a weighted average interest rate of 1.3% and hedged variable rate debt and fixed rate debt had a weighted average interest rate of 5.8% as of March 31, 2010. The weighted average interest rate for capitalization shown on page 16 represents the average rates for each reporting period. This average rate for each reporting period is different than the interest rate in effect as of the balance sheet date for each quarter end (i.e. one point in time as opposed to an average over three months during the quarter) shown on page 20. Additionally, the weighted average interest rate for capitalization shown on page 16 assumes the conversion of our 8% unsecured convertible notes for all periods except for the three months ended March 31, 2009 since we did not issue the notes until April 2009.
42