Exhibit 99.2
ALEXANDRIA REAL ESTATE EQUITIES, INC.
Table of Contents
September 30, 2012
| Page |
Company Profile | ii |
Investor Information | iii |
| |
EARNINGS PRESS RELEASE | |
Third Quarter Ended September 30, 2012, Financial and Operating Results | 1 |
Guidance | 5 |
Condensed Consolidated Statements of Income | 9 |
Condensed Consolidated Balance Sheets | 10 |
Funds From Operations and Adjusted Funds From Operations | 11 |
Non-GAAP Measures | 12 |
| |
SUPPLEMENTAL INFORMATION | |
Financial and Asset Base Highlights | 13 |
| |
Core Operating Metrics | |
Core Operating Metrics | 14 |
Summary of Same Property Comparisons | 15 |
Summary of Leasing Activity | 16 |
Summary of Lease Expirations | 17 |
Summary of Properties and Occupancy | 18 |
Property Listing | 19 |
Top 20 Client Tenants and Client Tenant Mix | 22 |
| |
Value-Added Opportunities and External Growth | |
Significant Future Growth Opportunities | 23 |
Summary of Investments in Real Estate | 24 |
Development and Redevelopment Projects in North America | 25 |
Investment in Unconsolidated Real Estate Entity and Future Value-Added Projects in North America | 26 |
Summary of Capital Expenditures | 27 |
Summary of Real Estate Investment in Asia | 28 |
| |
Balance Sheet | |
Credit Metrics | 29 |
Summary of Debt | 30 |
| |
Definitions and Other Information | |
Definitions and Other Information | 32 |
This document includes “forward-looking statements” within the meaning of Section 27A of the Securities Act of 1933, as amended, and Section 21E of the Securities Exchange Act of 1934, as amended. You can identify the forward-looking statements by their use of forward-looking words, such as “believes,” “expects,” “may,” “will,” “should,” “seeks,” “approximately,” “intends,” “plans,” “estimates,” or “anticipates,” or the negative of those words or similar words. Our actual results may differ materially from those projected in such forward-looking statements. Factors that might cause such a difference include, without limitation, our failure to obtain capital (debt, construction financing, and/or equity) or refinance debt maturities, increased interest rates and operating costs, adverse economic or real estate developments in our markets, our failure to successfully complete and lease our existing space held for redevelopment and new properties acquired for that purpose and any properties undergoing development, our failure to successfully operate or lease acquired properties, lower rental rates or higher vacancy rates or failure to renew or replace expiring leases, defaults on or non-renewal of leases by client tenants, general and local economic conditions, and other risks and uncertainties detailed in our filings with the Securities and Exchange Commission (“SEC”). All forward-looking statements are made as of October 26, 2012, the date this document was first made available on our website, and we assume no obligation to update this information. For more discussion relating to risks and uncertainties that could cause actual results to differ materially from those anticipated in our forward-looking statements, and risks to our business in general, please refer to our SEC filings, including our most recent annual report on Form 10-K and any subsequent quarterly reports on Form 10-Q. Note that certain figures are rounded to the nearest thousands throughout this document, which may impact footing and/or crossfooting of totals and subtotals.
This document is not an offer to sell or solicitation to buy securities of Alexandria Real Estate Equities, Inc. Any offers to sell or solicitations to buy securities of Alexandria Real Estate Equities, Inc. shall be made only by means of a prospectus approved for that purpose. Unless otherwise indicated, the “Company,” “Alexandria,” “we,” “us,” and “our” refer to Alexandria Real Estate Equities, Inc. and its consolidated subsidiaries.

| ALEXANDRIA REAL ESTATE EQUITIES, INC.
ALL RIGHTS RESERVED © 2012 | i |
ALEXANDRIA REAL ESTATE EQUITIES, INC.
Company Profile
September 30, 2012
The Company
Alexandria Real Estate Equities, Inc. (NYSE: ARE), a self-administered and self-managed real estate investment trust (“REIT”), is the largest and leading investment-grade REIT focused principally on owning, operating, developing, redeveloping, and acquiring high-quality, sustainable real estate for the broad and diverse life science industry. Founded in 1994, Alexandria was the first REIT to identify and pursue the laboratory niche and has since had the first-mover advantage in the core life science cluster locations including Greater Boston, San Francisco Bay, San Diego, New York City, Seattle, Suburban Washington, D.C., and Research Triangle Park. Alexandria’s high-credit client tenants span the life science industry, including renowned academic and medical institutions, multinational pharmaceutical companies, public and private biotechnology entities, United States government research agencies, medical device companies, industrial biotech companies, venture capital firms, and life science product and service companies. As the recognized real estate partner of the life science industry, Alexandria has a superior track record in driving client tenant productivity and innovation through its best-in-class laboratory and office space, collaborative locations adjacent to leading academic and medical institutions, unparalleled life science real estate expertise and services, and longstanding and expansive network in the life science community, which we believe result in higher occupancy levels, longer lease terms, higher rental income, higher returns, and greater long-term asset value. For additional information on Alexandria Real Estate Equities, Inc., please visit www.are.com.
Unique Niche Strategy
Alexandria’s primary business objective is to maximize stakeholder value by providing its stakeholders with the greatest possible total return and long-term asset value based on a multifaceted platform of internal and external growth. The key elements to our strategy include our consistent focus on high-quality assets and operations in the top life science cluster locations with our properties located adjacent to life science entities driving growth and technological advances within each cluster. These adjacency locations are characterized by high barriers to entry and exit, limited supply of available space, and represent highly desirable locations for tenancy by life science entities. Alexandria’s strategy also includes drawing on its deep and broad life science and real estate relationships in order to attract new and leading life science client tenants and value-added real estate opportunities. Alexandria was founded in 1994 by Jerry M. Sudarsky and Joel S. Marcus. Alexandria executed its initial public offering in 1997 and received its investment-grade ratings in 2011.
Management
Alexandria’s executive and senior management team is highly experienced in the REIT industry (uniquely with life science and real estate development, construction, operations, ownership, and expertise) and is the most accomplished team focused on providing high-quality, environmentally sustainable real estate, technical infrastructure, and unique expertise to the broad and diverse life science industry. Our deep and talented team has decades of life science industry experience. Our management team also includes highly experienced regional market directors averaging over 20 years of real estate experience, including approximately 10 years with Alexandria. We believe that our expertise, experience, reputation, and key life science relationships provide Alexandria significant competitive advantages in attracting new business opportunities.
Client Tenant Base
The quality, diversity, breadth, and depth of our significant relationships with our life science client tenants provide Alexandria with solid and stable cash flows. Investment-grade client tenants represented 48% of Alexandria’s annualized base rent as of September 30, 2012. As of September 30, 2012, our multinational pharmaceutical client tenants represented approximately 27.5% of our annualized base rent, led by Bristol-Myers Squibb Company, Eli Lilly and Company, GlaxoSmithKline plc, Novartis AG, Pfizer Inc., and Roche; revenue-producing life science product and service, medical device, and industrial biotech companies represented approximately 22.2%, led by Illumina, Inc., Laboratory Corporation of America Holdings, Monsanto Company, Qiagen N.V., and Quest Diagnostics Incorporated; non-profit, renowned medical and research institutions, and government agencies represented approximately 15.7% and included Fred Hutchinson Cancer Research Center, Massachusetts Institute of Technology, The Regents of the University of California, Sanford-Burnham Medical Research Institute, The Scripps Research Institute, the United States Government, and University of Washington; public biotechnology companies represented approximately 16.3% and included Amgen Inc., Biogen Idec Inc., Celgene Corporation, and Gilead Sciences, Inc.; private biotechnology companies represented approximately 14.1% and included high-quality, leading-edge companies with blue-chip venture and institutional investors, including Constellation Pharmaceuticals, Inc., Epizyme, Inc., FibroGen, Inc., and FORMA Therapeutics, Inc.; and the remaining approximately 4.2% consisted of traditional office client tenants. Alexandria’s strong life science underwriting skills, long-term life science industry relationships, and sophisticated management with both real estate and life science operating expertise positively distinguish Alexandria from all other publicly traded real estate investment trusts and real estate companies.
Company Information
Corporate Headquarters | | Trading Symbols | | Information Requests |
385 East Colorado Boulevard, Suite 299 | | New York Stock Exchange | | Phone: (626) 396-4828 |
Pasadena, California 91101 | | Common stock: ARE | | E-mail: corporateinformation@are.com |
| | Series E preferred stock: ARE–E | | Web: www.are.com |
Summary Data
Cluster markets | Greater Boston, San Francisco Bay, San Diego, Greater NYC, Suburban Washington, D.C., Seattle, Research Triangle Park, Canada, India, and China |
| |
Fiscal year-end | December 31 |
| |
Total properties | 177 |
| |
Total rentable square feet | 16.6 million |
Common Stock Data
| | 3Q12 | | 2Q12 | | 1Q12 | | 4Q11 | | 3Q11 | |
High trading price | | $ | 77.10 | | $ | 76.50 | | $ | 74.45 | | $ | 71.07 | | $ | 85.33 | |
Low trading price | | $ | 70.97 | | $ | 67.40 | | $ | 66.90 | | $ | 56.10 | | $ | 59.33 | |
Closing stock price, average for period | | $ | 73.65 | | $ | 71.67 | | $ | 71.70 | | $ | 65.83 | | $ | 72.68 | |
Closing stock price, at the end of the quarter | | $ | 73.52 | | $ | 72.72 | | $ | 73.13 | | $ | 68.97 | | $ | 61.39 | |
Dividend per share – quarter/annualized | | $ | 0.53/2.12 | | $ | 0.51/2.04 | | $ | 0.49/1.96 | | $ | 0.49/1.96 | | $ | 0.47/1.88 | |
Closing dividend yield – annualized | | 2.9% | | 2.8% | | 2.7% | | 2.8% | | 3.1% | |
Common shares outstanding at the end of the quarter | | 63,161,177 | | 62,249,973 | | 61,634,645 | | 61,560,472 | | 61,463,839 | |
Closing market value of outstanding common shares (in thousands) | | $ | 4,643,610 | | $ | 4,526,818 | | $ | 4,507,342 | | $ | 4,245,826 | | $ | 3,773,265 | |
Total market capitalization (in thousands) | | $ | 8,064,386 | | $ | 7,912,286 | | $ | 7,673,553 | | $ | 7,412,402 | | $ | 6,815,380 | |
| ALEXANDRIA REAL ESTATE EQUITIES, INC.
ALL RIGHTS RESERVED © 2012 | ii |
ALEXANDRIA REAL ESTATE EQUITIES, INC.
Investor Information
September 30, 2012
Executive/Senior Management |
Joel S. Marcus | Chairman, Chief Executive Officer, & Founder | Thomas J. Andrews | EVP – Regional Market Director-Greater Boston |
Dean A. Shigenaga | Chief Financial Officer, EVP, & Treasurer | Daniel J. Ryan | EVP – Regional Market Director-San Diego & Strategic Operations |
Stephen A. Richardson | Chief Operating Officer & Regional Market Director-San Francisco | John J. Cox | SVP – Regional Market Director-Seattle |
Peter M. Moglia | Chief Investment Officer | John H. Cunningham | SVP – Regional Market Director-NY & Strategic Operations |
Jennifer J. Pappas | SVP, General Counsel, & Corporate Secretary | Larry J. Diamond | SVP – Regional Market Director-Mid Atlantic |
Marc E. Binda | SVP – Finance | Vincent R. Ciruzzi | SVP – Construction & Development |
Andres R. Gavinet | Chief Accounting Officer | | |
Alexandria Real Estate Equities, Inc. is currently covered by the following research analysts. This list may not be complete and is subject to change as firms initiate or discontinue coverage of our company. Please note that any opinions, estimates, or forecasts regarding our historical or predicted performance made by these analysts are theirs alone and do not represent opinions, forecasts, or predictions of Alexandria Real Estate Equities, Inc. or its management. Alexandria Real Estate Equities, Inc. does not by its reference below or distribution imply its endorsement of or concurrence with such information, conclusions, or recommendations. Interested persons may obtain copies of analysts’ reports on their own as we do not distribute these reports. Several of these firms may from time-to-time own our stock and/or hold other long or short positions in our stock, and may provide compensated services to us.
Argus Research Group, Inc. | | | | Evercore Partners | | | | Morningstar Inc. | | |
William Eddleman, Jr. | | (212) 425-7500 | | Sheila McGrath | | (212) 497-0882 | | Philip Martin | | (312) 384-3920 |
| | | | | | | | | | |
Banc of America Securities-Merrill Lynch | | Green Street Advisors, Inc. | | | | Robert W. Baird & Company |
James Feldman | | (646) 855-5808 | | John Stewart | | (949) 640-8780 | | Mathew R. Spencer | | (414) 298-5053 |
Jeffrey Spector | | (646) 855-1363 | | John Hornbeak | | (949) 640-8780 | | | | |
Ji Zhang | | (646) 855-2926 | | | | | | | | |
| | | | | | | | | | |
Barclays Capital Inc. | | | | International Strategy & Investment Group Inc. | | Standard & Poor’s | | |
Ross Smotrich | | (212) 526-2306 | | George Auerbach | | (212) 446-9459 | | Ray Sheppard | | (212) 438-1947 |
Michael R. Lewis | | (212) 526-3098 | | Steve Sakwa | | (212) 446-9462 | | | | |
| | | | Gwen Clark | | (212) 446-5611 | | | | |
| | | | | | | | | | |
Citigroup Global Markets Inc. | | | | JMP Securities – JMP Group, Inc. | | UBS Financial Services Inc. |
Michael Bilerman | | (212) 816-1383 | | William Marks | | (415) 835-8944 | | Ross Nussbaum | | (212) 713-2484 |
Quentin Velleley | | (212) 816-6981 | | Whitney Stevenson | | (415) 835-8948 | | Gabriel Hilmoe | | (212) 713-3876 |
| | | | | | | | Weina Hou | | (212) 713-4057 |
Cowen and Company, LLC | | | | JP Morgan Securities, LLC | | | | | | |
James Sullivan | | (646) 562-1380 | | Anthony Paolone | | (212) 622-6682 | | | | |
Michael Gorman | | (646) 562-1381 | | Joseph Dazio | | (212) 622-6416 | | | | |
Rating Agencies
Moody’s Investors Service | | | | Standard & Poor’s | | | | | | |
Philip Kibel | | (212) 553-4569 | | Lisa Sarajian | | (212) 438-2597 | | | | |
Maria Maslovsky | | (212) 553-4831 | | George Skoufis | | (212) 438-2608 | | | | |
Rating
Moody’s Investors Service | | | | Standard & Poor’s | | | | | | |
Issuer Rating | | Baa2
Stable Outlook | | Corporate Credit Rating | | BBB-
Stable Outlook | | | | |
| ALEXANDRIA REAL ESTATE EQUITIES, INC.
ALL RIGHTS RESERVED © 2012 | iii |

Contact: | Joel S. Marcus |
| Chairman, Chief Executive Officer, & Founder |
| Alexandria Real Estate Equities, Inc. |
| (626) 578-9693 |
Alexandria Real Estate Equities, Inc.
Reports
Third Quarter Ended September 30, 2012
Financial and Operating Results
FFO Per Share – Diluted of $1.08 and $3.18 for Three and Nine Months Ended 3Q12
EPS – Diluted of $0.17 and $0.75 for Three and Nine Months Ended 3Q12
Significant Progress Converting Non-Income-Producing Assets into Income-Producing Operating Assets
PASADENA, CA. – October 26, 2012 – Alexandria Real Estate Equities, Inc. (NYSE: ARE) today announced financial and operating results for the third quarter ended September 30, 2012.
Third Quarter Ended September 30, 2012, Highlights
Results
· Funds From Operations (“FFO”) Attributable to Alexandria Real Estate Equities, Inc.’s Common Stockholders – Diluted, for the Three Months Ended September 30, 2012, was $67.1 Million, or $1.08 Per Share; FFO Attributable to Alexandria Real Estate Equities, Inc.’s Common Stockholders – Diluted, for the Nine Months Ended September 30, 2012, was $196.8 Million, or $3.18 Per Share
· Adjusted Funds From Operations (“AFFO”) Attributable to Alexandria Real Estate Equities, Inc.’s Common Stockholders – Diluted, for the Three Months Ended September 30, 2012, was $65.0 Million, or $1.04 Per Share; AFFO Attributable to Alexandria Real Estate Equities, Inc.’s Common Stockholders – Diluted, for the Nine Months Ended September 30, 2012, was $191.4 Million, or $3.09 Per Share
· Net Income Attributable to Alexandria Real Estate Equities, Inc.’s Common Stockholders – Diluted, for the Three Months Ended September 30, 2012, was $10.6 Million, or $0.17 Per Share; Net Income Attributable to Alexandria Real Estate Equities, Inc.’s Common Stockholders – Diluted, for the Three Months Ended September 30, 2012, Excluding $9.8 Million, or $0.16 Per Share, Related to Impairment of Real Estate, and Excluding $1.6 Million, or $0.03 Per Share, Related to Gain on Sale of Real Estate, was $18.8 Million, or $0.30 Per Share; Net Income Attributable to Alexandria Real Estate Equities, Inc.’s Common Stockholders – Diluted, for the Nine Months Ended September 30, 2012, was $46.6 Million, or $0.75 Per Share; Net Income Attributable to Alexandria Real Estate Equities, Inc.’s Common Stockholders – Diluted, for the Nine Months Ended September 30, 2012, Excluding $9.8 Million, or $0.16 Per Share, Related to Impairment of Real Estate, Excluding $2.2 Million, or $0.03 Per Share, Related to Loss on Early Extinguishment of Debt, and Excluding $1.6 Million, or $0.03 Per Share, Related to Gain on Sale of Real Estate, was $57.0 Million, or $0.91 Per Share
Core Operating Metrics
· Total Revenues for the Three Months Ended September 30, 2012, were $145.5 Million, Compared to Total Revenues for the Three Months Ended September 30, 2011, of $138.1 Million; Total Revenues for the Nine Months Ended September 30, 2012, were $431.9 Million, Compared to Total Revenues for the Nine Months Ended September 30, 2011, of $409.0 Million
· Net Operating Income (“NOI”) for the Three Months Ended September 30, 2012, was $100.8 Million, Compared to NOI for the Three Months Ended September 30, 2011, of $97.2 Million; NOI for the Nine Months Ended September 30, 2012, was $304.0 Million, Compared to NOI for the Nine Months Ended September 30, 2011, of $291.0 Million
· Operating Margins at 69% for the Three Months Ended September 30, 2012
· Cash and GAAP Same Property Net Operating Income Increase of 4.3% and Decrease of 0.9%, Respectively, for the Three Months Ended September 30, 2012
· Cash and GAAP Same Property Net Operating Income Increase of 2.6% and Decrease of 0.8%, Respectively, for the Nine Months Ended September 30, 2012
· 48% of Annualized Base Rent from Investment-Grade Client Tenants
· During the Three Months Ended September 30, 2012, Executed 47 Leases for 732,000 Rentable Square Feet, Including 266,000 Rentable Square Feet of Development and Redevelopment Space; Rental Rate Decrease of 2.9% and Increase of 7.6% on a Cash and GAAP Basis, Respectively, on Renewed/Re-Leased Space
· During the Nine Months Ended September 30, 2012, Executed 146 Leases for 2,603,000 Rentable Square Feet, Including 829,000 Rentable Square Feet of Development and Redevelopment Space; Rental Rate Decrease of 1.9% and Increase of 5.9% on a Cash and GAAP Basis, Respectively, on Renewed/Re-Leased Space; Excluding One Lease for 48,000 Rentable Square Feet Related to One Client Tenant in the Research Triangle Park Market and One Lease for 71,000 Rentable Square Feet Related to One Client Tenant in the Suburban Washington, D.C. Market, Rental Rates for Renewed/Re-Leased Space were, on Average, 0.1% Higher and 7.3% Higher than Rental Rates for Expiring Leases on a Cash and GAAP Basis, Respectively
· Occupancy Percentage for North America Operating Properties of 94.2% and Occupancy Percentage for North America Operating and Redevelopment Properties of 90.0%; Occupancy Percentage for All Operating Properties of 93.0%, Including Asia Properties, and Occupancy Percentage for All Operating and Redevelopment Properties of 88.3%, Including Asia Properties
Value-Added Opportunities and External Growth
· From November 2011 to September 2012, Completed Redevelopment of 10300 Campus Point Drive, Located in the San Diego Market, a 96% Leased Project with 279,138 Rentable Square Feet, Including the Completion of 189,562 Rentable Square Feet in September 2012
· In September 2012, Completed Development of 4755 Nexus Center Drive, Located in the San Diego Market, a 100% Leased Project with 45,255 Rentable Square Feet
· In June 2012, Completed Redevelopment of 3530/3550 John Hopkins Court, Located in the San Diego Market, a 100% Leased Project with 98,320 Rentable Square Feet
· In April 2012, Completed Development Located in the Canadian Market, a 100% Leased Project with 26,426 Rentable Square Feet
· In April 2012, Commenced Unconsolidated Joint Venture Development of 360 Longwood Avenue, Located in the Greater Boston Market, a 37% Pre-Leased Project with 414,000 Rentable Square Feet
· In January 2012, Commenced Development of 259 East Grand Avenue, Located in the San Francisco Bay Market, a 100% Pre-Leased Building with 170,618 Rentable Square Feet

| ALEXANDRIA REAL ESTATE EQUITIES, INC.
ALL RIGHTS RESERVED © 2012 | 1 |
ALEXANDRIA REAL ESTATE EQUITIES, INC.
Third Quarter Ended September 30, 2012, Financial and Operating Results
(Unaudited)
Significant Balance Sheet Milestones
· Completed $75.1 Million of Asset Sales Year to Date with Additional $34.0 Million of Land Sales Forecasted in Fourth Quarter 2012 for a Total of $109.1 Million; Additional $84.5 Million Sales of Income-Producing Assets in Process
· Established an “At The Market” Common Stock Offering Program Under Which We May Sell Up to $250.0 Million of Our Common Stock; and Raised $98.4 Million in Net Proceeds from Sales Under This Program for the Nine Months Ended September 30, 2012, including $58.5 Million in Net Proceeds from Sales Under This Program for the Three Months Ended September 30, 2012
· In June 2012, Closed a Secured Construction Loan with Aggregate Commitments of $55 Million for a Development Project at 259 East Grand Avenue located in the San Francisco Bay Market
· In April 2012, Amended Our $1.5 Billion Unsecured Senior Line of Credit to Reduce Its Interest Rate and Extend Its Maturity Date to April 2017, Assuming We Exercise Our Sole Right to Extend the Maturity Date Twice
· In April 2012, Redeemed All $129.6 Million of Our Outstanding 8.375% Series C Preferred Stock
· In March 2012, Completed a 6.45% Series E Preferred Stock Offering with Net Proceeds of $124.9 Million
· In February 2012, Completed Our Debut 4.60% Unsecured Senior Notes Offering with Net Proceeds of $544.6 Million; Net Proceeds from the Offering Were Used to Repay Certain Outstanding Variable Rate Bank Debt
· In February 2012, Repaid All $250 Million of Our 2012 Unsecured Senior Bank Term Loan
· In January and April 2012, Retired All $84.8 Million of Our 3.70% Unsecured Senior Convertible Notes
Events Subsequent to Quarter End
· In the Fourth Quarter of 2012, We Expect to Commence Vertical Construction of the Ground-Up Development of 430 East 29th Street, the West Tower of the Alexandria Center™ for Life Science – New York City, a Project with 419,806 Rentable Square Feet Located in the Greater NYC Market
VALUE-ADDED OPPORTUNITIES AND EXTERNAL GROWTH
Development and redevelopment
As of September 30, 2012, 96% of our overall leases contained annual rent escalations that were either fixed or based on a consumer price index or another index. Our initial stabilized yield on a cash basis reflects cash rents upon stabilization and does not reflect contractual rent escalations beyond the stabilization date. We expect, on average, our contractual cash rents related to our value-added projects to increase over time. Initial stabilized yield is calculated as the quotient of net operating income and our investment in the property at stabilization (“Initial Stabilized Yield”).
During the three and nine months ended September 30, 2012, we executed leases aggregating 266,000 and 829,000 rentable square feet, respectively, related to our development and redevelopment projects.
In the fourth quarter of 2012, we expect to commence a ground-up development of a multi-tenant laboratory building with 419,806 rentable square feet at 430 East 29th Street, the West Tower of the Alexandria Center™ for Life Science – New York City. We expect to provide an estimate of our Initial Stabilized Yields next quarter upon commencement of ground-up development.
From November 2011 to September 2012, we completed the redevelopment of 279,138 rentable square feet, including the completion of 189,562 rentable square feet in September 2012, at 10300 Campus Point Drive, located in the San Diego market. This property is a multi-tenant campus with 449,759 rentable square feet that is 96% leased to (1) Eli Lilly and Company, (2) The Regents of the University of California, (3) Celgene Corporation, and (4) Covance Inc. The Initial Stabilized Yield on a cash and GAAP basis for the 279,138 rentable square feet redevelopment project was approximately 7.9% and 7.7%, respectively.
In September 2012, we completed the development of 4755 Nexus Center Drive, located in the San Diego market, a single-tenant building with 45,255 rentable square feet that is 100% leased to Optimer Pharmaceuticals, Inc. The Initial Stabilized Yield on a cash and GAAP basis for this project was approximately 6.8% and 7.5%, respectively.
In June 2012, we completed the redevelopment of 3530/3550 John Hopkins Court, located in the San Diego market, a multi-tenant campus with 98,320 rentable square feet that is 100% leased to (1) Genomics Institute of the Novartis Research Foundation, a non-profit research institute, and (2) a leading industrial biotechnology company. The Initial Stabilized Yield on a cash and GAAP basis for this project was approximately 8.9% and 9.1%, respectively.
In April 2012, we completed the development of a building located in the Canadian market with 26,426 rentable square feet that is 100% leased to GlaxoSmithKline plc. The Initial Stabilized Yield on a cash and GAAP basis for this project was approximately 7.7% and 8.3%, respectively.
In April 2012, we commenced ground-up development of 360 Longwood Avenue, located in the Longwood Medical Area of the Greater Boston market, our 414,000 rentable square feet unconsolidated joint venture development project that is 37% pre-leased to the Dana-Farber Cancer Institute, Inc. Dana-Farber Cancer Institute, Inc. also has an option to lease an additional two floors of approximately 99,000 rentable square feet, or an additional 24% of the total rentable square feet of the project. We expect to achieve an unlevered Initial Stabilized Yield on a cash and GAAP basis in a range from 8.1% to 8.5% and 8.7% to 9.1%, respectively. Funding for this project is provided primarily by capital from our joint venture partner and a $213.2 million non-recourse secured construction loan. Additionally, our share of the future funding is expected to be less than the $22.3 million distribution we received in March 2012, upon admittance of the new partner and refinancing of the project.
In January 2012, we commenced a ground-up development of a single-tenant building with 170,618 rentable square feet at 259 East Grand Avenue, located in the San Francisco Bay market, which is 100% pre-leased to Onyx Pharmaceuticals Inc. We expect to achieve an Initial Stabilized Yield on both a cash and GAAP basis for this property in a range from 7.8% to 8.2%. Funding for this project will be provided primarily by the $55 million secured construction loan we closed in June 2012.
Acquisitions
In April 2012, we acquired 3013/3033 Science Park Road located in the San Diego market, which consists of two life science laboratory buildings aggregating 176,500 rentable square feet, for approximately $13.7 million. The property was 100% leased on a short-term basis, and thereafter, we expect to redevelop approximately 98,000 rentable square feet. The remaining square footage will be classified as future developable square feet once the existing client tenant vacates. We expect to provide an estimate of our Initial Stabilized Yields in the future upon commencement of development/redevelopment activity.
| ALEXANDRIA REAL ESTATE EQUITIES, INC.
ALL RIGHTS RESERVED © 2012 | 2 |
ALEXANDRIA REAL ESTATE EQUITIES, INC.
Third Quarter Ended September 30, 2012, Financial and Operating Results
(Tabular dollar amounts in thousands, except per square foot amounts)
(Unaudited)
SIGNIFICANT BALANCE SHEET MILESTONES
Real estate asset sales
In September 2012, four properties aggregating 504,130 rentable square feet met the classification requirements for held for sale. The current buyers are expected to reposition these assets and/or incur significant investments to re-tenant the properties. During the three months ended September 30, 2012, we recorded impairment charges aggregating approximately $9.8 million to reduce the aggregate carrying value of the properties to the estimated sales price less costs to sell.
| | | | | | Rentable/ | | Sales | | Occupancy | | Annualized | | | | | |
| | | | Date | | Developable | | Price | | at Date | | GAAP | | Sales | | Gain | |
Description | | Location | | of Sale | | Square Feet | | per SF | | of Sale | | NOI (1) | | Price (2) | | on Sale | |
Land parcels and assets with a previous operating component: | | | | | | | | | | | | | | | | | |
1201/1209 Mercer Street (3) | | Seattle | | September 2012 | | 76,029 | | $ | 73 | | 0% | | $ | 45 | | $ | 5,570 | | $ | 54 | |
801 Dexter Avenue North (3) | | Seattle | | August 2012 | | 120,000 | | $ | 72 | | 0% | | $ | (96 | ) | 8,600 | | $ | 55 | |
Land parcel | | Greater Boston | | March 2012 | | (4) | | $ | 275 | | N/A | | N/A | | 31,360 | | $ | 1,864 | |
Sale of land parcels and assets with a previous operating component | | | | | | | | | | | | | | 45,530 | | | |
| | | | | | | | | | | | | | | | | |
Income-producing properties: | | | | | | | | | | | | | | | | | |
200 Lawrence Drive/210 Welsh Pool Road | | Pennsylvania | | July 2012 | | 210,866 | | $ | 94 | | 100% | | $ | 2,193 | | 19,750 | (5) | $ | 103 | |
155 Fortune Boulevard (6) | | Route 495/Worcester | | July 2012 | | 36,000 | | $ | 222 | | 100% | | $ | 804 | | 8,000 | | $ | 1,350 | |
5110 Campus Drive (6) | | Pennsylvania | | May 2012 | | 21,000 | | $ | 86 | | 71% | | $ | 77 | | 1,800 | | $ | 2 | |
Sales of income-producing properties | | | | | | | | | | | | | | 29,550 | (7) | | |
| | | | | | | | | | | | | | | | | |
Completed sales subtotal | | | | | | | | | | | | | | 75,080 | | | |
| | | | | | | | | | | | | | | | | |
Sales in process | | Various | | Pending | | 261,000 | | $ | 130 | | N/A | | $ | (470 | ) | 34,000 | (8) | TBD | |
Subtotal | | | | | | | | | | | | | | 109,080 | | | |
| | | | | | | | | | | | | | | | | |
Other incremental dispositions: | | | | | | | | | | | | | | | | | |
Sales in process (9) | | Various | | Pending | | 504,130 | | $ | 174 | | N/A | | $ | 12,798 | | 84,500 | | TBD | |
| | | | | | | | | | | | | | | | | |
Total projected dispositions | | | | | | | | | | | | | | $ | 193,580 | | | |
(1) | Annualized using actual year to date results as of the quarter end prior to date of sale or September 30, 2012. |
(2) | Represents contractual sales price for assets sold or contractual/estimated sale price for sales in process. |
(3) | Properties sold to residential developers. |
(4) | In March 2012, we sold one-half of our 55% interest in a land parcel supporting a 414,000 rentable square feet project for approximately $31.4 million, or approximately $275 per rentable square foot. |
(5) | Sales price reflects the near-term lease expiration of a client tenant occupying 38,513 rentable square feet, or 18% of the total rentable square feet, on the date of sale. In connection with the sale, we received an interest-only secured note receivable for $6.1 million due in 2018. |
(6) | Properties were sold to client tenants. |
(7) | The weighted average capitalization rate (Annualized GAAP NOI divided by Sales Price) related to sales of income-producing assets in the nine months ended September 30, 2012, was 10.4%. |
(8) | Includes a $13.3 million amortizing secured note receivable due in 2014. |
(9) | Includes four properties, which the buyers expect to renovate. During the three months ended September 30, 2012, we recognized an aggregate charge for impairment of real estate of approximately $9.8 million to adjust the carrying values of the four properties to their fair value, less costs to sell. We may receive a note receivable in connection with sale of one property. One sale ranging from $42 million to $47 million may close during the three months ended December 31, 2012. |
Sale of land parcel
In March 2012, we contributed our 55% ownership interest in a land parcel supporting a future building with 414,000 rentable square feet in the Longwood Medical Area of the Greater Boston market to a newly formed joint venture (the “Restated JV”) with National Development and Charles River Realty Investors, and admitted as a 50% member, Clarion Partners, LLC, resulting in a reduction of our ownership interest from 55% to 27.5%. The transfer of one-half of our 55% ownership interest in this real estate venture to Clarion Partners, LLC, was accounted for as an in-substance partial sale of an interest in the underlying real estate. In connection with the sale of one-half of our 55% ownership interest in the land parcel, we received a special distribution of approximately $22.3 million, which included the recognition of a $1.9 million gain on sale of land and approximately $5.4 million from our share of loan refinancing proceeds. The land parcel we sold in March 2012 did not meet the criteria for discontinued operations since the parcel did not have any significant operations prior to disposition. Pursuant to the presentation and disclosure literature on gains/losses on sales or disposals by REITs required by the Securities and Exchange Commission (“SEC”), gains or losses on sales or disposals by a REIT that do not qualify as discontinued operations are classified below (loss) income from discontinued operations in the income statement. Accordingly, we classified the $1.9 million gain on sale of land below (loss) income from discontinued operations, net, in the condensed consolidated statements of income. Our 27.5% share of the land was sold at approximately $31 million (including closing costs), or approximately $275 per rentable square foot. Upon formation of the Restated JV, the existing $38.4 million secured loan was refinanced with a seven-year (including two one-year extension options) non-recourse $213 million secured construction loan with initial loan proceeds of $50 million. As of September 30, 2012, the outstanding balance on the construction loan was $56.4 million. We do not expect our share of capital contributions through the completion of the project to exceed the approximate $22.3 million in net proceeds received in this transaction. Construction of this $350 million project commenced in April 2012. The initial occupancy date for this project is expected to be in the fourth quarter of 2014. The project is 37% pre-leased to Dana-Farber Cancer Institute, Inc. In addition, Dana-Farber Cancer Institute, Inc. has an option to lease an additional two floors approximating 99,000 rentable square feet, or 24% of the total rentable square feet of the project. In addition to our economic share of the joint venture, we also expect to earn development and other fees of approximately $3.5 million through 2015, and recurring annual property management fees thereafter, from this project.
| ALEXANDRIA REAL ESTATE EQUITIES, INC.
ALL RIGHTS RESERVED © 2012 | 3 |
ALEXANDRIA REAL ESTATE EQUITIES, INC.
Third Quarter Ended September 30, 2012, Financial and Operating Results
(Unaudited)
“At the market” common stock offering program
In June 2012, we established an “at the market” common stock offering program under which we may sell, from time to time, up to an aggregate of $250.0 million of our common stock through our sales agents, BNY Mellon Capital Markets, LLC and Credit Suisse Securities (USA) LLC, during a three-year period. During the nine months ended September 30, 2012, we sold an aggregate of 1,366,977 shares of common stock for gross proceeds of approximately $100.0 million at an average stock price of $73.15 and net proceeds of approximately $98.4 million. This includes the sale of an aggregate of 793,291 shares of common stock for gross proceeds of approximately $59.5 million at an average stock price of $74.97 and net proceeds of approximately $58.5 million during the three months ended September 30, 2012. As of September 30, 2012, approximately $150.0 million of our common stock remained available for issuance under the “at the market” common stock offering program.
Secured construction loan for development project in San Francisco Bay market
In June 2012, we closed a secured construction loan with aggregate commitments of $55 million. The construction loan matures in July 2015, and we have an option to extend the stated maturity date of July 1, 2015, by one year, twice, to July 1, 2017. The construction loan will be used to fund the majority of the cost to complete the development of a 100% pre-leased life science laboratory building with 170,618 rentable square feet at 259 East Grand Avenue in the San Francisco Bay market. The construction loan bears interest at the London Interbank Offered Rate (“LIBOR”) or the base rate specified in the construction loan agreement, defined as the higher of either the prime rate being offered by our lender or the federal funds rate in effect on the day of borrowing (“Base Rate”), plus in either case a specified margin of 1.50% for LIBOR borrowings or 0.25% for Base Rate borrowings. As of September 30, 2012, commitments of $53.0 million were available.
Debut 4.60% unsecured senior notes payable offering
In February 2012, we completed the issuance of our 4.60% unsecured senior notes payable due in February 2022. Net proceeds of approximately $544.6 million were used to repay certain outstanding variable rate bank debt, including the entire $250 million of our 2012 unsecured senior bank term loan (“2012 Unsecured Senior Bank Term Loan”), and approximately $294.6 million of outstanding borrowings under our unsecured senior line of credit. In connection with the retirement of our 2012 Unsecured Senior Bank Term Loan, we recognized a loss on early extinguishment of debt of approximately $0.6 million related to the write-off of unamortized loan fees for the three months ended March 31, 2012.
Retirement of 3.70% unsecured senior convertible notes
During January 2012, we repurchased approximately $83.8 million in principal amount of our 3.70% unsecured senior convertible notes (“3.70% Unsecured Senior Convertible Notes”) at par, pursuant to options exercised by holders thereof under the indenture governing the notes. During April 2012, we repurchased the remaining outstanding $1.0 million in principal amount of the notes. In aggregate, we repurchased approximately $84.8 million in principal amount of the notes and we did not recognize a gain or loss as a result during the six months ended June 30, 2012.
Amendment of $1.5 billion unsecured senior line of credit
In April 2012, we amended our $1.5 billion unsecured senior line of credit with Merrill Lynch, Pierce, Fenner & Smith Incorporated, J.P. Morgan Securities Inc., and Citigroup Global Markets Inc. as joint lead arrangers, and certain lenders, to extend the maturity date of our unsecured senior line of credit, provide an accordion option for up to an additional $500 million, and reduce the interest rate for outstanding borrowings. The maturity date of the unsecured senior line of credit was extended to April 2017, assuming we exercise our sole right to extend the stated maturity date twice by an additional six months after each exercise. Borrowings under the unsecured senior line of credit bear interest at LIBOR or the base rate specified in the amended unsecured senior line of credit agreement, plus in either case a specified margin (the “Applicable Margin”). The Applicable Margin for LIBOR borrowings under the unsecured senior line of credit was set at 1.20%, down from 2.40% in effect immediately prior to the modification. In addition to the Applicable Margin, our unsecured senior line of credit is subject to an annual facility fee of 0.25%. In connection with the modification of our unsecured senior line of credit in April 2012, we recognized a loss on early extinguishment of debt of approximately $1.6 million related to the write-off of a portion of unamortized loan fees for the three months ended June 30, 2012.
6.45% series E preferred stock offering
In March 2012, we completed a public offering of 5,200,000 shares of our 6.45% series E cumulative redeemable preferred stock (“Series E Preferred Stock”). The shares were issued at a price of $25.00 per share, resulting in net proceeds of approximately $124.9 million (after deducting underwriters’ discounts and other offering costs). The proceeds were initially used to reduce the outstanding borrowings under our unsecured senior line of credit. We then borrowed funds under our unsecured senior line of credit to redeem our 8.375% series C cumulative redeemable preferred stock (“Series C Preferred Stock”) in April 2012. The dividends on our Series E Preferred Stock are cumulative and accrue from the date of original issuance. We pay dividends quarterly in arrears at an annual rate of 6.45%, or $1.6125 per share. Our Series E Preferred Stock has no stated maturity date, is not subject to any sinking fund or mandatory redemption provisions, and is not redeemable before March 15, 2017, except to preserve our status as a REIT. On and after March 15, 2017, we may, at our option, redeem the Series E Preferred Stock, in whole or in part, at any time for cash at a redemption price of $25.00 per share, plus any accrued and unpaid dividends on the Series E Preferred Stock up to, but excluding, the redemption date. In addition, upon the occurrence of a change of control, we may, at our option, redeem the Series E Preferred Stock, in whole or in part within 120 days after the first date on which such change of control occurred, by paying $25.00 per share, plus any accrued and unpaid dividends up to, but excluding, the date of redemption. Investors in our Series E Preferred Stock generally have no voting rights.
8.375% series C preferred stock redemption
In April 2012, we redeemed all 5,185,500 outstanding shares of our Series C Preferred Stock at a price equal to $25.00 per share, or approximately $129.6 million in aggregate, and paid $0.5234375 per share, representing accumulated and unpaid dividends to the redemption date on such shares. We recognized a charge of approximately $6.0 million to net income attributable to Alexandria Real Estate Equities, Inc.’s common stockholders in March 2012, related to the write-off of original issuance costs of the Series C Preferred Stock.
| ALEXANDRIA REAL ESTATE EQUITIES, INC.
ALL RIGHTS RESERVED © 2012 | 4 |
ALEXANDRIA REAL ESTATE EQUITIES, INC.
Third Quarter Ended September 30, 2012, Financial and Operating Results
(Unaudited)
GUIDANCE
Earnings outlook
Based on our current view of existing market conditions and certain current assumptions, we expect that our earnings per share attributable to Alexandria Real Estate Equities, Inc.’s common stockholders – diluted and FFO per share attributable to Alexandria Real Estate Equities, Inc.’s common stockholders – diluted for the year ended December 31, 2012, will be as set forth in the table below. The table below provides a reconciliation of FFO per share attributable to Alexandria Real Estate Equities, Inc.’s common stockholders – diluted, as adjusted, a non-GAAP measure, to earnings per share, the most directly comparable GAAP measure.
Guidance for the Year Ended December 31, 2012 | | Reported on October 26, 2012 | | Reported on July 30, 2012 | |
Earnings per share attributable to Alexandria Real Estate Equities, Inc.’s common stockholders – diluted | | $1.16 - $1.26 | | $1.36 - $1.46 | |
Depreciation and amortization | | $3.00 - $3.06 | | $2.93 - $2.99 | |
Gain on sales of property | | $(0.06) | | $(0.03) | |
Impairment of real estate | | $0.16 | | – | |
FFO per share attributable to Alexandria Real Estate Equities, Inc.’s common stockholders – diluted | | $4.32 - $4.36 | | $4.32 - $4.36 | |
Write-off of unamortized loan fees upon early retirement of the 2012 Unsecured Senior Bank Term Loan | | $0.01 | | $0.01 | |
Write-off of unamortized loan fees upon modification of unsecured senior line of credit | | $0.03 | | $0.03 | |
Preferred stock redemption charge | | $0.10 | | $0.10 | |
Realized gain on equity investment primarily related to one non-tenant life science entity | | $ (0.09) | | $(0.09) | |
FFO per share attributable to Alexandria Real Estate Equities, Inc.’s common stockholders – diluted, as adjusted | | $4.37 - $4.41 | | $4.37 - $4.41 | |
| | | | | |
Key net operating income projection assumptions: | | | | | |
Same property net operating income growth – cash basis | | 3% to 4% | | 3% to 5% | |
Same property net operating income growth – GAAP basis | | Slightly negative/positive | | 0% to 2% | |
Rental rate steps on lease renewals and re-leasing of space – cash basis | | Slightly negative/positive | | Slightly negative/positive | |
Rental rate steps on lease renewals and re-leasing of space – GAAP basis | | Up to 5% | | Up to 5% | |
Straight-line rents | | $6.5 million/qtr | | $6.5 million/qtr | |
Amortization of above and below market leases | | $0.8 million/qtr | | $0.8 million/qtr | |
Realized gain on equity investment primarily related to one non-tenant life science entity | | $5.8 million | | $5.8 million | |
Net operating income, net income, and FFO for the three months ended December 31, 2012
As of September 30, 2012, we had approximately $304.6 million and $277.5 million of construction in progress related to our five North American development and eight North American redevelopment projects, respectively. The completion of these projects, along with recently delivered projects, certain future projects, and contributions from same properties, are expected to contribute significant increases in rental income, net operating income, and cash flows. Net operating income from continuing operations is projected to increase from $100.8 million for the three months ended September 30, 2012, to a range from $107.5 million to $109.5 million for the three months ended December 31, 2012 (after considering approximately $3.0 million in required reclassifications for discontinued operations). Operating performance assumptions related to the completion of our North America development and redevelopment projects, including the timing of initial occupancy, stabilization dates, and Initial Stabilized Yields, are included on page 7. Certain key assumptions regarding our projections, including the impact of various development and redevelopment projects, are included in the tables above, below, and on the following page.
The completion of our development and redevelopment projects will result in increased interest expense and other direct project costs, because these project costs will no longer qualify for capitalization and these costs will be expensed as incurred. Our projections for general and administrative expenses, capitalization of interest, and interest expense, net, are included in the tables on this page. Our projections of net operating income are subject to a number of variables and uncertainties, including those discussed under the “Forward-looking Statements” section of Part I, the “Risk Factors” section of Item 1A, and the “Management’s Discussion and Analysis of Financial Condition and Results of Operations” section under Item 7, of our annual report on Form 10-K for the year ended December 31, 2011. To the extent our full year earnings guidance is updated during the year, we will provide additional disclosure supporting reasons for any significant changes to such guidance. Further, we believe net operating income is a key performance indicator and is useful to investors as a performance measure because, when compared across periods, net operating income reflects the impact on operations from trends in occupancy rates, rental rates, and operating costs, providing perspective not immediately apparent from income from continuing operations.
Three Months Ended December 31, 2012 (in millions, except per share amounts) | | Reported on October 26, 2012 | | Reported on July 30, 2012 | |
Net operating income: | | | | | |
Continuing operations | | $107.5 - $109.5 | | $110.5 - $112.5 | |
Incremental dispositions classified in discontinued operations | | $3.0 | | – | |
Total net operating income | | $110.5 - $112.5 | | $110.5 - $112.5 | |
General and administrative | | $11.0 - $12.0 | | $11.0 - $12.0 | |
Capitalization of interest | | $13.6 - $14.6 | | N/A | |
Interest | | $18.0 - $20.0 | | $19.5 - $22.5 | |
Depreciation and amortization | | $42.6 - $47.7 | | $42.6 - $47.7 | |
Preferred stock dividends | | $6.5 | | $6.5 | |
Other | | $1.0 - $1.4 | | $1.0 - $1.4 | |
Net income attributable to Alexandria Real Estate Equities, Inc.’s common stockholders | | $26.9 - $30.9 | | $26.9 - $30.9 | |
FFO | | $72.0 - $73.0 | | $71.1 - $73.0 | |
FFO per share – diluted | | $1.15 - $1.17 | | $1.15 - $1.17 | |

| ALEXANDRIA REAL ESTATE EQUITIES, INC.
ALL RIGHTS RESERVED © 2012 | 5 |
ALEXANDRIA REAL ESTATE EQUITIES, INC.
Third Quarter Ended September 30, 2012, Financial and Operating Results
(Unaudited)
Sources and uses of capital
We expect that our principal liquidity needs for the year ended December 31, 2012, will be satisfied by the following multiple sources of capital as shown in the table below. There can be no assurance that our sources and uses of capital will not be materially higher or lower than these expectations. Our liquidity available under our unsecured senior line of credit and from cash equivalents was approximately $1.2 billion as of September 30, 2012.
| | Reported on
October 26, 2012 | | Reported on
July 30, 2012 | |
Sources and Uses of Capital for the Year Ended December 31, 2012 (in millions) | | Completed | | Projected | | Total | | Total | |
Sources of capital: | | | | | | | | | |
Net cash provided by operating activities less dividends | | $ | 53 | | $ | 28 | | $ | 81 | (1) | $ | 81 | |
Asset and land sales | | 75 | | 76 - 81 | (2) | 151 - 156 | | 112 | |
Unsecured senior notes payable | | 550 | | – | | 550 | | 550 | |
Borrowings on secured construction financing | | 2 | | 22 | | 24 | | 24 | |
Series E Preferred Stock issuance | | 125 | | – | | 125 | | 125 | |
Issuances under “at the market” common stock offering program | | 98 | | – | (3) | 98 | | 40 | |
Debt, equity, and joint venture capital | | 51 | (4) | 57 - 84 | (4) | 108 - 135 | | 236 | |
Total sources of capital | | $ | 954 | | $ | 183 - 215 | | $ | 1,137 - 1,169 | | $ | 1,168 | |
| | | | | | | | | |
Uses of capital: | | | | | | | | | |
Development, redevelopment, and construction | | $ | 429 | | $ | 167 | | $ | 596 | (5) | $ | 646 | |
Notes receivable from asset and land sales | | 6 | | 13 - 45 | | 19 - 51 | | – | |
Acquisitions | | 46 | | – | | 46 | | 46 | |
Secured debt repayments | | 8 | | 3 | | 11 | (6) | 11 | |
2012 Unsecured Senior Bank Term Loan repayment | | 250 | | – | | 250 | | 250 | |
3.70% Unsecured Senior Convertible Notes repurchase | | 85 | | – | | 85 | | 85 | |
Series C Preferred Stock redemption | | 130 | | – | | 130 | | 130 | |
Total uses of capital | | $ | 954 | | $ | 183 - 215 | | $ | 1,137 - 1,169 | | $ | 1,168 | |
(1) | See table of “Key Net Operating Income Projection Assumptions” and projections table in the “Net Operating Income, Net Income, and FFO for the Three Months Ended December 31, 2012” section on the preceding page. |
(2) | Represents an estimate of sources of capital from pending asset and land sales. As noted in “Real Estate Asset Sales” on page 3, we have other incremental dispositions in process aggregating $84.5 million, a portion of which may close during the three months ended December 31, 2012. |
(3) | See “Debt, equity, and joint venture capital.” |
(4) | Represents an estimate of sources of capital primarily consisting of borrowings under our unsecured senior line of credit and proceeds from our “at the market” common stock offering program. |
(5) | See “Investment to Complete” columns in the “Development and Redevelopment Projects in North America” table on the following page for additional details underlying this estimate. The decrease of approximately $50 million from the approximately $646 million previously reported on July 30, 2012, is primarily attributable to the timing of the spending moving from the three months ended December 31, 2012, to the year ended December 31, 2013. |
(6) | Based upon contractually scheduled payments or maturity dates. |
The key assumptions behind the sources and uses of capital in the table above are a favorable capital market environment and performance of our core operations in areas such as delivery of current and future development and redevelopment projects, leasing activity, and renewals. Our expected sources and uses of capital are subject to a number of variables and uncertainties, including those discussed under the “Forward-looking statements” section of Part I, the “Risk Factors” section of Item 1A, and the “Management’s Discussion and Analysis of Financial Condition and Results of Operations” section under Item 7, of our annual report on Form 10-K for the year ended December 31, 2011. We expect to update our forecast of sources and uses of capital on a quarterly basis.
| ALEXANDRIA REAL ESTATE EQUITIES, INC.
ALL RIGHTS RESERVED © 2012 | 6 |
ALEXANDRIA REAL ESTATE EQUITIES, INC.
Development and Redevelopment Projects in North America
September 30, 2012
(Tabular dollar amounts in thousands)
(Unaudited)
| | Project RSF | | Leased Status RSF | | Investment | | Initial Stabilized | | Project | | Occu- | | Stabili- | |
Market – Submarket/ | | In | | | | | | | | | | | | | | % Leased/ | | September 30, 2012 | | To Complete | | Total at | | Yield (1) | | Start | | pancy | | zation | |
Property | | Service | | CIP | | Total | | Leased | | Negotiating | | Marketing | | Total | | Negotiating | | In Service | | CIP | | 2012 | | Thereafter | | Completion | | Cash | | GAAP | | Date | | Date | | Date | |
Development projects in North America | | | | | | | | | | | | | | | | | | | | | | | | | | | | | | | | | | | | | | |
Greater Boston – Cambridge | | | | | | | | | | | | | | | | | | | | | | | | | | | | | | | | | | | | | | |
225 Binney Street | | – | | 303,143 | | 303,143 | | 303,143 | | – | | – | | 303,143 | | 100 | % | | $ | – | | $ | 84,163 | | $ | 8,788 | | $ | 87,322 | | $ | 180,273 | | 7.5% | | 8.1% | | 4Q11 | | 4Q13 | | 4Q13 | |
| | | | | | | | | | | | | | | | | | | | | | | | | | | | | | | | | | | | | | |
San Francisco Bay – Mission Bay | | | | | | | | | | | | | | | | | | | | | | | | | | | | | | | | | | | | | | |
499 Illinois Street (2) | | – | | 222,780 | | 222,780 | | – | | – | | 222,780 | | 222,780 | | – | | | $ | – | | $ | 111,219 | | $ | 2,867 | | $ | 39,123 | | $ | 153,209 | | 6.4% | | 7.2% | | 2Q11 | | 2Q14 | | 1Q15 | |
| | | | | | | | | | | | | | | | | | | | | | | | | | | | | | | | | | | | | | |
San Francisco Bay – South SF | | | | | | | | | | | | | | | | | | | | | | | | | | | | | | | | | | | | | | |
259 East Grand Avenue (3) | | – | | 170,618 | | 170,618 | | 170,618 | | – | | – | | 170,618 | | 100 | % | | $ | – | | $ | 45,226 | | $ | 13,498 | (3) | $ | 22,137 | (3) | $ | 80,861 | | 7.8-8.2% | | 7.8-8.2% | | 1Q12 | | 4Q12 | | 4Q12 | |
400/450 East Jamie Court | | 99,694 | | 63,342 | | 163,036 | | 127,732 | | – | | 35,304 | | 163,036 | | 78 | % | | $ | 58,481 | | $ | 39,340 | | $ | 5,962 | | $ | 9,230 | | $ | 113,013 | | 4.2% | | 4.3% | | 4Q06 | | 3Q11 | | 2Q13 | |
Other - 400/450 East Jamie Court (4) | | | | | | | | | | | | | | | | | | | $ | 20,659 | | $ | (20,659 | ) | | | | | | | | | | | | | | | | |
| | | | | | | | | | | | | | | | | | | | | | | | | | | | | | | | | | | | | | |
San Diego – University Town Center | | | | | | | | | | | | | | | | | | | | | | | | | | | | | | | | | | | | | | |
5200 Illumina Way | | – | | 127,373 | | 127,373 | | 127,373 | | – | | – | | 127,373 | | 100 | % | | $ | – | | $ | 45,330 | | $ | 2,229 | | $ | 1,741 | | $ | 49,300 | | 7.0% | | 10.8% | | 4Q10 | | 4Q12 | | 4Q12 | |
Development projects in North America | | 99,694 | | 887,256 | | 986,950 | | 728,866 | | – | | 258,084 | | 986,950 | | 74 | % | | $ | 79,140 | | $ | 304,619 | | $ | 33,344 | | $ | 159,553 | | $ | 576,656 | | | | | | | | | | | |
| | | | | | | | | | | | | | | | | | | | | | | | | | | | | | | | | | | | | | |
Redevelopment projects in North America | | | | | | | | | | | | | | | | | | | | | | | | | | | | | | | | | | | | | | |
Greater Boston – Cambridge | | | | | | | | | | | | | | | | | | | | | | | | | | | | | | | | | | | | | | |
400 Technology Square | | – | | 212,123 | | 212,123 | | 169,939 | | – | | 42,184 | | 212,123 | | 80 | % | | $ | – | | $ | 111,297 | | $ | 15,891 | | $ | 17,500 | | $ | 144,688 | | 8.1% | | 8.9% | | 4Q11 | | 4Q12 | | 4Q13 | |
| | | | | | | | | | | | | | | | | | | | | | | | | | | | | | | | | | | | | | |
Seattle – Lake Union | | | | | | | | | | | | | | | | | | | | | | | | | | | | | | | | | | | | | | |
1551 Eastlake Avenue | | 65,342 | | 52,141 | | 117,483 | | 74,914 | | 8,000 | | 34,569 | | 117,483 | | 71 | % | | $ | 36,148 | | $ | 20,366 | | $ | 2,730 | | $ | 4,766 | | $ | 64,010 | | 6.7% | | 6.7% | | 4Q11 | | 4Q11 | | 4Q13 | |
| | | | | | | | | | | | | | | | | | | | | | | | | | | | | | | | | | | | | | |
Suburban and other redevelopment projects | | 18,461 | | 326,262 | | 344,723 | | 211,388 | | 55,270 | | 78,065 | | 344,723 | | 77 | % | | $ | 11,840 | | $ | 151,650 | | $ | 7,504 | | $ | 37,590 | | $ | 208,584 | | | | | | | | | | | |
Other – suburban and other redevelopment projects (4) | | | | | | | | | | | | | | | | | | | $ | 5,807 | | $ | (5,807 | ) | | | | | | | | | | | | | | | | |
Redevelopment projects in North America | | 83,803 | | 590,526 | | 674,329 | | 456,241 | | 63,270 | | 154,818 | | 674,329 | | 77 | % | | $ | 53,795 | | $ | 277,506 | | $ | 26,125 | | $ | 59,856 | | $ | 417,282 | | | | | | | | | | | |
| | | | | | | | | | | | | | | | | | | | | | | | | | | | | | | | | | | | | | |
Total development and redevelopment projects in North America | | 183,497 | | 1,477,782 | | 1,661,279 | | 1,185,107 | | 63,270 | | 412,902 | | 1,661,279 | | 75 | % | | $ | 132,935 | | $ | 582,125 | | $ | 59,469 | | $ | 219,409 | | $ | 993,938 | | | | | | | | | | | |
(1) | As of September 30, 2012, 96% of our overall leases contained annual rent escalations that were either fixed or based on a consumer price index or another index. Our Initial Stabilized Yield on a cash basis reflects cash rents upon stabilization and does not reflect contractual rent escalations beyond the stabilization date. We expect, on average, our contractual cash rents related to our value-added projects to increase over time. |
(2) | The cash and GAAP Initial Stabilized Yields related to the development of 499 Illinois Street declined by approximately 0.3% and 0.2%, respectively, to allow for a slightly longer absorption period. Despite this change, we still expect to achieve overall yields for the entire project (including the occupied portion of 409 Illinois) within our original expectations of 6.5%-7.0% and 7.2%-7.6% for cash and GAAP, respectively. |
(3) | Funding for this project will be provided primarily by the $55 million secured construction loan we closed in June 2012. |
(4) | As of the period end, some portion of the real estate basis associated with the rentable square feet under development or redevelopment was classified as in service because activities necessary to prepare the asset for its intended use were no longer in process. In the near future, we anticipate recommencing activities necessary to prepare the asset for its intended use upon execution of leasing and final decisions related to design of each space. |

| ALEXANDRIA REAL ESTATE EQUITIES, INC.
ALL RIGHTS RESERVED © 2012 | 7 |
ALEXANDRIA REAL ESTATE EQUITIES, INC.
Third Quarter Ended September 30, 2012, Financial and Operating Results
EARNINGS CALL INFORMATION
We will host a conference call on Monday, October 29, 2012, at 3:00 p.m. Eastern Time (“ET”)/12:00 p.m. noon Pacific Time (“PT”) that is open to the general public to discuss our financial and operating results for the three months and nine months ended September 30, 2012. To participate in this conference call, dial (800) 447-0521 or (847) 413-3238 and confirmation code 33218271, shortly before 3:00 p.m. ET/12:00 p.m. noon PT. The audio web cast can be accessed at: www.are.com, in the “For Investors” section. A replay of the call will be available for a limited time from 5:30 p.m. ET/2:30 p.m. PT on Monday, October 29, 2012. The replay number is (888) 843-7419 or (630) 652-3042 and the confirmation code is 33218271.
Additionally, a copy of this Earnings Press Release and Supplemental Information for the third quarter ended September 30, 2012, are available in the “For Investors” section of our website at www.are.com.
About the Company
Alexandria Real Estate Equities, Inc. (NYSE: ARE), a self-administered and self-managed REIT, is the largest and leading investment-grade REIT focused principally on owning, operating, developing, redeveloping, and acquiring high-quality, sustainable real estate for the broad and diverse life science industry. Founded in 1994, Alexandria was the first REIT to identify and pursue the laboratory niche and has since had the first-mover advantage in every core life science cluster location including Greater Boston, San Francisco Bay, San Diego, New York City, Seattle, Suburban Washington, D.C., and Research Triangle Park. Alexandria’s high-credit client tenants span the life science industry, including renowned academic and medical institutions, multinational pharmaceutical companies, public and private biotechnology entities, United States government research agencies, medical device companies, industrial biotech companies, venture capital firms, and life science product and service companies. As the recognized real estate partner of the life science industry, Alexandria has a superior track record in driving client tenant productivity and innovation through its best-in-class laboratory and office space, collaborative locations adjacent to leading academic and medical institutions, unparalleled life science real estate expertise and services, and longstanding and expansive network in the life science community, which we believe result in higher occupancy levels, longer lease terms, higher rental income, higher returns, and greater long-term asset value. For additional information on Alexandria Real Estate Equities, Inc., please visit www.are.com.
***********
This press release includes “forward-looking statements” within the meaning of Section 27A of the Securities Act of 1933, as amended, and Section 21E of the Securities Exchange Act of 1934, as amended. Such forward-looking statements include, without limitation, statements regarding our 2012 earnings per share attributable to Alexandria Real Estate Equities, Inc.’s common stockholders – diluted, 2012 FFO per share attributable to Alexandria Real Estate Equities, Inc.’s common stockholders – diluted, net operating income, and net income, for the year ended December 31, 2012, and our projected sources and uses of capital in 2012. Our actual results may differ materially from those projected in such forward-looking statements. Factors that might cause such a difference include, without limitation, our failure to obtain capital (debt, construction financing, and/or equity) or refinance debt maturities, increased interest rates and operating costs, adverse economic or real estate developments in our markets, our failure to successfully complete and lease our existing space held for redevelopment and new properties acquired for that purpose and any properties undergoing development, our failure to successfully operate or lease acquired properties, decreased rental rates or increased vacancy rates or failure to renew or replace expiring leases, defaults on or non-renewal of leases by client tenants, general and local economic conditions, and other risks and uncertainties detailed in our filings with the SEC. All forward-looking statements are made as of the date of this press release, and we assume no obligation to update this information. For more discussion relating to risks and uncertainties that could cause actual results to differ materially from those anticipated in our forward-looking statements, and risks to our business in general, please refer to our SEC filings, including our most recent annual report on Form 10-K and any subsequent quarterly reports on Form 10-Q.

| ALEXANDRIA REAL ESTATE EQUITIES, INC.
ALL RIGHTS RESERVED © 2012 | 8 |
ALEXANDRIA REAL ESTATE EQUITIES, INC.
Condensed Consolidated Statements of Income
(Dollars in thousands, except per share amounts)
(Unaudited)
| | Three Months Ended | | Nine Months Ended | |
| | 9/30/12 | | 6/30/12 | | 3/31/12 | | 12/31/11 | | 9/30/11 | | 9/30/12 | | 9/30/11 | |
Revenues: | | | | | | | | | | | | | | | |
Rental | | $ | 108,367 | | $ | 106,463 | | $ | 103,417 | | $ | 104,634 | | $ | 102,353 | | $ | 318,247 | | $ | 309,532 | |
Tenant recoveries | | 34,448 | | 32,172 | | 32,386 | | 33,031 | | 33,226 | | 99,006 | | 95,270 | |
Other income | | 2,640 | | 9,381 | | 2,629 | | 1,584 | | 2,475 | | 14,650 | | 4,178 | |
Total revenues | | 145,455 | | 148,016 | | 138,432 | | 139,249 | | 138,054 | | 431,903 | | 408,980 | |
| | | | | | | | | | | | | | | |
Expenses: | | | | | | | | | | | | | | | |
Rental operations | | 44,614 | | 42,359 | | 40,911 | | 41,553 | | 40,859 | | 127,884 | | 118,014 | |
General and administrative | | 12,485 | | 12,309 | | 10,358 | | 10,601 | | 10,289 | | 35,152 | | 30,528 | |
Interest | | 17,094 | | 17,922 | | 16,227 | | 14,757 | | 14,273 | | 51,243 | | 48,621 | |
Depreciation and amortization | | 47,176 | | 51,276 | | 42,326 | | 39,762 | | 38,747 | | 140,778 | | 113,326 | |
Total expenses | | 121,369 | | 123,866 | | 109,822 | | 106,673 | | 104,168 | | 355,057 | | 310,489 | |
Income from continuing operations before loss on early extinguishment of debt | | 24,086 | | 24,150 | | 28,610 | | 32,576 | | 33,886 | | 76,846 | | 98,491 | |
| | | | | | | | | | | | | | | |
Loss on early extinguishment of debt | | – | | (1,602 | ) | (623 | ) | – | | (2,742 | ) | (2,225 | ) | (6,485 | ) |
Income from continuing operations | | 24,086 | | 22,548 | | 27,987 | | 32,576 | | 31,144 | | 74,621 | | 92,006 | |
| | | | | | | | | | | | | | | |
(Loss) income from discontinued operations: | | | | | | | | | | | | | | | |
Income from discontinued operations before impairment of real estate | | 4,018 | | 3,093 | | 2,924 | | 2,886 | | 2,799 | | 10,035 | | 8,873 | |
Impairment of real estate | | (9,799 | ) | – | | – | | – | | (994 | ) | (9,799 | ) | (994 | ) |
(Loss) income from discontinued operations, net | | (5,781 | ) | 3,093 | | 2,924 | | 2,886 | | 1,805 | | 236 | | 7,879 | |
| | | | | | | | | | | | | | | |
Gain on sale of land parcel | | – | | – | | 1,864 | | – | | 46 | | 1,864 | | 46 | |
Net income | | 18,305 | | 25,641 | | 32,775 | | 35,462 | | 32,995 | | 76,721 | | 99,931 | |
| | | | | | | | | | | | | | | |
Net income attributable to noncontrolling interests | | 828 | | 851 | | 711 | | 1,142 | | 966 | | 2,390 | | 2,833 | |
Dividends on preferred stock | | 6,471 | | 6,903 | | 7,483 | | 7,090 | | 7,089 | | 20,857 | | 21,267 | |
Preferred stock redemption charge | | – | | – | | 5,978 | | – | | – | | 5,978 | | – | |
Net income attributable to unvested restricted stock awards | | 360 | | 271 | | 235 | | 270 | | 278 | | 866 | | 818 | |
Net income attributable to Alexandria Real Estate Equities, Inc.’s common stockholders | | $ | 10,646 | | $ | 17,616 | | $ | 18,368 | | $ | 26,960 | | $ | 24,662 | | $ | 46,630 | | $ | 75,013 | |
| | | | | | | | | | | | | | | |
Earnings per share attributable to Alexandria Real Estate Equities, Inc.’s common stockholders – basic and diluted: | | | | | | | | | | | | | | | |
Continuing operations | | $ | 0.26 | | $ | 0.24 | | $ | 0.25 | | $ | 0.39 | | $ | 0.37 | | $ | 0.75 | | $ | 1.15 | |
Discontinued operations, net | | (0.09 | ) | 0.05 | | 0.05 | | 0.05 | | 0.03 | | – | | 0.14 | |
Earnings per share – basic and diluted | | $ | 0.17 | | $ | 0.29 | | $ | 0.30 | | $ | 0.44 | | $ | 0.40 | | $ | 0.75 | | $ | 1.29 | |
| | | | | | | | | | | | | | | |
Weighted average shares of common stock outstanding for calculating earnings per share attributable to Alexandria Real Estate Equities, Inc.’s common stockholders – basic | | 62,364,210 | | 61,663,367 | | 61,507,807 | | 61,427,495 | | 61,295,659 | | 61,847,023 | | 58,271,270 | |
Dilutive effect of stock options | | – | | 173 | | 1,160 | | 3,939 | | 8,310 | | 448 | | 13,475 | |
Weighted average shares of common stock outstanding for calculating earnings per share attributable to Alexandria Real Estate Equities, Inc.’s common stockholders – diluted | | 62,364,210 | | 61,663,540 | | 61,508,967 | | 61,431,434 | | 61,303,969 | | 61,847,471 | | 58,284,745 | |
| ALEXANDRIA REAL ESTATE EQUITIES, INC.
ALL RIGHTS RESERVED © 2012 | 9 |
ALEXANDRIA REAL ESTATE EQUITIES, INC.
Condensed Consolidated Balance Sheets
(Dollars in thousands)
(Unaudited)
| | September 30, | | June 30, | | March 31, | | December 31, | | September 30, | |
| | 2012 | | 2012 | | 2012 | | 2011 | | 2011 | |
Assets | | | | | | | | | | | |
Investments in real estate, net | | $ | 6,300,027 | | $ | 6,208,354 | | $ | 6,113,252 | | $ | 6,008,440 | | $ | 5,925,292 | |
Cash and cash equivalents | | 94,904 | | 80,937 | | 77,361 | | 78,539 | | 73,056 | |
Restricted cash | | 44,863 | | 41,897 | | 39,803 | | 23,332 | | 27,929 | |
Tenant receivables | | 10,124 | | 6,143 | | 8,836 | | 7,480 | | 6,599 | |
Deferred rent | | 160,914 | | 155,295 | | 150,515 | | 142,097 | | 132,954 | |
Deferred leasing and financing costs, net | | 152,021 | | 151,355 | | 143,754 | | 135,550 | | 134,366 | |
Investments | | 107,808 | | 104,454 | | 98,152 | | 95,777 | | 88,777 | |
Other assets | | 94,356 | | 93,304 | | 86,418 | | 82,914 | | 66,583 | |
Total assets | | $ | 6,965,017 | | $ | 6,841,739 | | $ | 6,718,091 | | $ | 6,574,129 | | $ | 6,455,556 | |
| | | | | | | | | | | |
Liabilities, Noncontrolling Interests, and Equity | | | | | | | | | | | |
Secured notes payable | | $ | 719,350 | | $ | 719,977 | | $ | 721,715 | | $ | 724,305 | | $ | 760,882 | |
Unsecured senior notes payable | | 549,794 | | 549,783 | | 550,772 | | 84,959 | | 84,484 | |
Unsecured senior line of credit | | 413,000 | | 379,000 | | 167,000 | | 370,000 | | 814,000 | |
Unsecured senior bank term loans | | 1,350,000 | | 1,350,000 | | 1,350,000 | | 1,600,000 | | 1,000,000 | |
Accounts payable, accrued expenses, and tenant security deposits | | 376,785 | | 348,037 | | 323,002 | | 325,393 | | 330,044 | |
Dividends payable | | 39,468 | | 38,357 | | 36,962 | | 36,579 | | 35,287 | |
Preferred stock redemption liability | | – | | – | | 129,638 | | – | | – | |
Total liabilities | | 3,448,397 | | 3,385,154 | | 3,279,089 | | 3,141,236 | | 3,024,697 | |
| | | | | | | | | | | |
Commitments and contingencies | | | | | | | | | | | |
| | | | | | | | | | | |
Redeemable noncontrolling interests | | 15,610 | | 15,817 | | 15,819 | | 16,034 | | 15,931 | |
| | | | | | | | | | | |
Alexandria Real Estate Equities, Inc.’s stockholders’ equity: | | | | | | | | | | | |
Series C Preferred Stock | | – | | – | | – | | 129,638 | | 129,638 | |
Series D Convertible Preferred Stock | | 250,000 | | 250,000 | | 250,000 | | 250,000 | | 250,000 | |
Series E Preferred Stock | | 130,000 | | 130,000 | | 130,000 | | – | | – | |
Common stock | | 632 | | 622 | | 616 | | 616 | | 614 | |
Additional paid-in capital | | 3,094,987 | | 3,053,269 | | 3,022,242 | | 3,028,558 | | 3,025,444 | |
Accumulated other comprehensive loss | | (19,729 | ) | (37,370 | ) | (23,088 | ) | (34,511 | ) | (32,202 | ) |
Alexandria Real Estate Equities, Inc.’s stockholders’ equity | | 3,455,890 | | 3,396,521 | | 3,379,770 | | 3,374,301 | | 3,373,494 | |
Noncontrolling interests | | 45,120 | | 44,247 | | 43,413 | | 42,558 | | 41,434 | |
Total equity | | 3,501,010 | | 3,440,768 | | 3,423,183 | | 3,416,859 | | 3,414,928 | |
Total liabilities, noncontrolling interests, and equity | | $ | 6,965,017 | | $ | 6,841,739 | | $ | 6,718,091 | | $ | 6,574,129 | | $ | 6,455,556 | |
| ALEXANDRIA REAL ESTATE EQUITIES, INC.
ALL RIGHTS RESERVED © 2012 | 10 |
ALEXANDRIA REAL ESTATE EQUITIES, INC.
Funds From Operations and Adjusted Funds From Operations
(Dollars in thousands, except per share amounts)
(Unaudited)
The following table presents a reconciliation of net income attributable to Alexandria Real Estate Equities, Inc.’s common stockholders – basic, the most directly comparable financial measure presented in accordance with GAAP, to FFO attributable to Alexandria Real Estate Equities, Inc.’s common stockholders – diluted, FFO attributable to Alexandria Real Estate Equities, Inc.’s common stockholders – diluted, as adjusted, and AFFO attributable to Alexandria Real Estate Equities, Inc.’s common stockholders – diluted for the periods below:
| | Three Months Ended | | Nine Months Ended | |
| | 9/30/12 | | 6/30/12 | | 3/31/12 | | 12/31/11 | | 9/30/11 | | 9/30/12 | | 9/30/11 | |
Net income attributable to Alexandria Real Estate Equities, Inc.’s common stockholders – basic | | $ | 10,646 | | $ | 17,616 | | $ | 18,368 | | $ | 26,960 | | $ | 24,662 | | $ | 46,630 | | $ | 75,013 | |
Depreciation and amortization | | 48,173 | | 52,355 | | 43,405 | | 40,966 | | 39,990 | | 143,933 | | 117,060 | |
Gain on sale of real estate | | (1,562 | ) | (2 | ) | – | | – | | – | | (1,564 | ) | – | |
Impairment of real estate | | 9,799 | | – | | – | | – | | 994 | | 9,799 | | 994 | |
Gain on sale of land parcel | | – | | – | | (1,864 | ) | – | | (46 | ) | (1,864 | ) | (46 | ) |
Amount attributable to noncontrolling interests/unvested stock awards: | | | | | | | | | | | | | | | |
Net income | | 1,188 | | 1,122 | | 946 | | 1,412 | | 1,244 | | 3,256 | | 3,651 | |
FFO | | (1,148 | ) | (1,133 | ) | (1,156 | ) | (1,539 | ) | (1,580 | ) | (3,452 | ) | (4,877 | ) |
FFO attributable to Alexandria Real Estate Equities, Inc.’s common
stockholders – basic | | 67,096 | | 69,958 | | 59,699 | | 67,799 | | 65,264 | | 196,738 | | 191,795 | |
Assumed conversion of 8.00% Unsecured Senior Convertible Notes | | 5 | | 6 | | 5 | | 5 | | 4 | | 16 | | 16 | |
FFO attributable to Alexandria Real Estate Equities, Inc.’s common
stockholders – diluted | | 67,101 | | 69,964 | | 59,704 | | 67,804 | | 65,268 | | 196,754 | | 191,811 | |
Realized gain on equity investment primarily related to one non-tenant
life science entity | | – | | (5,811 | ) | – | | – | | – | | (5,811 | ) | – | |
Loss on early extinguishment of debt | | – | | 1,602 | | 623 | | – | | 2,742 | | 2,225 | | 6,485 | |
Preferred stock redemption charge | | – | | – | | 5,978 | | – | | – | | 5,978 | | – | |
Allocation to unvested restricted stock awards | | – | | 35 | | (53 | ) | – | | (38 | ) | (21 | ) | (59 | ) |
FFO attributable to Alexandria Real Estate Equities, Inc.’s common
stockholders – diluted, as adjusted | | $ | 67,101 | | $ | 65,790 | | $ | 66,252 | | $ | 67,804 | | $ | 67,972 | | $ | 199,125 | | $ | 198,237 | |
| | | | | | | | | | | | | | | |
Non-incremental revenue-enhancing capital expenditures: | | | | | | | | | | | | | | | |
Building improvements | | (935 | ) | (594 | ) | (210 | ) | (675 | ) | (550 | ) | (1,739 | ) | (1,856 | ) |
Tenant improvements and leasing commissions | | (1,844 | ) | (2,148 | ) | (2,019 | ) | (6,083 | ) | (2,119 | ) | (6,011 | ) | (4,517 | ) |
Straight-line rent | | (5,225 | ) | (5,195 | ) | (8,796 | ) | (9,558 | ) | (7,647 | ) | (19,216 | ) | (17,239 | ) |
Straight-line rent on ground leases | | 201 | | 1,207 | | 1,406 | | 1,221 | | 1,143 | | 2,814 | | 3,483 | |
Capitalized income from development projects | | 50 | | 72 | | 478 | | 537 | | 930 | | 600 | | 3,436 | |
Amortization of acquired above and below market leases | | (778 | ) | (778 | ) | (800 | ) | (812 | ) | (940 | ) | (2,356 | ) | (8,520 | ) |
Amortization of loan fees | | 2,470 | | 2,214 | | 2,643 | | 2,551 | | 2,144 | | 7,327 | | 6,749 | |
Amortization of debt premiums/discounts | | 112 | | 110 | | 179 | | 565 | | 750 | | 401 | | 3,254 | |
Stock compensation | | 3,845 | | 3,274 | | 3,293 | | 3,306 | | 3,344 | | 10,412 | | 8,449 | |
Allocation to unvested restricted stock awards | | 19 | | 15 | | 31 | | 80 | | 31 | | 67 | | 61 | |
AFFO attributable to Alexandria Real Estate Equities, Inc.’s common stockholders – diluted | | $ | 65,016 | | $ | 63,967 | | $ | 62,457 | | $ | 58,936 | | $ | 65,058 | | $ | 191,424 | | $ | 191,537 | |
The following table presents a reconciliation of net income per share attributable to Alexandria Real Estate Equities, Inc.’s common stockholders – basic, to FFO per share attributable to Alexandria Real Estate Equities, Inc.’s common stockholders – diluted, FFO per share attributable to Alexandria Real Estate Equities, Inc.’s common stockholders – diluted, as adjusted, and AFFO per share attributable to Alexandria Real Estate Equities, Inc.’s common stockholders – diluted for the periods below. For the computation of the weighted average shares used to compute the per share information, refer to the “Definitions and Other Information” section in our supplemental information:
| | Three Months Ended | | Nine Months Ended | |
| | 9/30/12 | | 6/30/12 | | 3/31/12 | | 12/31/11 | | 9/30/11 | | 9/30/12 | | 9/30/11 | |
Net income per share attributable to Alexandria Real Estate Equities, Inc.’s common stockholders – basic | | $ | 0.17 | | $ | 0.29 | | $ | 0.30 | | $ | 0.44 | | $ | 0.40 | | $ | 0.75 | | $ | 1.29 | |
Depreciation and amortization | | 0.78 | | 0.84 | | 0.70 | | 0.67 | | 0.65 | | 2.34 | | 2.00 | |
Gain on sale of real estate | | (0.03 | ) | – | | – | | – | | – | | (0.03 | ) | – | |
Impairment of real estate | | 0.16 | | – | | – | | – | | 0.02 | | 0.16 | | 0.02 | |
Gain on sale of land parcel | | – | | – | | (0.03 | ) | – | | – | | (0.03 | ) | – | |
Amount attributable to noncontrolling interests/unvested stock awards: | | | | | | | | | | | | | | | |
Net income | | 0.02 | | 0.02 | | 0.02 | | 0.02 | | 0.02 | | 0.05 | | 0.06 | |
FFO | | (0.02 | ) | (0.02 | ) | (0.02 | ) | (0.03 | ) | (0.03 | ) | (0.06 | ) | (0.08 | ) |
FFO per share attributable to Alexandria Real Estate Equities, Inc.’s common stockholders – basic | | 1.08 | | 1.13 | | 0.97 | | 1.10 | | 1.06 | | 3.18 | | 3.29 | |
Assumed conversion of 8.00% Unsecured Senior Convertible Notes | | – | | – | | – | | – | | – | | – | | – | |
FFO per share attributable to Alexandria Real Estate Equities, Inc.’s common stockholders – diluted | | 1.08 | | 1.13 | | 0.97 | | 1.10 | | 1.06 | | 3.18 | | 3.29 | |
Realized gain on equity investment primarily related to one non-tenant life science entity | | – | | (0.09 | ) | – | | – | | – | | (0.09 | ) | – | |
Loss on early extinguishment of debt | | – | | 0.03 | | 0.01 | | – | | 0.05 | | 0.03 | | 0.11 | |
Preferred stock redemption charge | | – | | – | | 0.10 | | – | | – | | 0.10 | | – | |
FFO per share attributable to Alexandria Real Estate Equities, Inc.’s common stockholders – diluted, as adjusted | | $ | 1.08 | | $ | 1.07 | | $ | 1.08 | | $ | 1.10 | | $ | 1.11 | | $ | 3.22 | | $ | 3.40 | |
| | | | | | | | | | | | | | | |
Non-incremental revenue-enhancing capital expenditures: | | | | | | | | | | | | | | | |
Building improvements | | (0.01 | ) | (0.01 | ) | – | | (0.01 | ) | (0.01 | ) | (0.03 | ) | (0.03 | ) |
Tenant improvements and leasing commissions | | (0.03 | ) | (0.03 | ) | (0.03 | ) | (0.10 | ) | (0.03 | ) | (0.10 | ) | (0.08 | ) |
Straight-line rent | | (0.08 | ) | (0.08 | ) | (0.14 | ) | (0.16 | ) | (0.12 | ) | (0.31 | ) | (0.30 | ) |
Straight-line rent on ground leases | | – | | 0.02 | | 0.02 | | 0.02 | | 0.02 | | 0.05 | | 0.06 | |
Capitalized income from development projects | | – | | – | | 0.01 | | 0.01 | | 0.02 | | 0.01 | | 0.06 | |
Amortization of acquired above and below market leases | | (0.01 | ) | (0.01 | ) | (0.01 | ) | (0.01 | ) | (0.02 | ) | (0.04 | ) | (0.15 | ) |
Amortization of loan fees | | 0.03 | | 0.03 | | 0.04 | | 0.05 | | 0.03 | | 0.11 | | 0.13 | |
Amortization of debt premiums/discounts | | – | | – | | – | | 0.01 | | 0.01 | | 0.01 | | 0.06 | |
Stock compensation | | 0.06 | | 0.05 | | 0.05 | | 0.05 | | 0.05 | | 0.17 | | 0.14 | |
AFFO per share attributable to Alexandria Real Estate Equities, Inc.’s common stockholders – diluted | | $ | 1.04 | | $ | 1.04 | | $ | 1.02 | | $ | 0.96 | | $ | 1.06 | | $ | 3.09 | | $ | 3.29 | |

| ALEXANDRIA REAL ESTATE EQUITIES, INC. ALL RIGHTS RESERVED © 2012 | 11 |
ALEXANDRIA REAL ESTATE EQUITIES, INC.
Non-GAAP Measures
(Tabular dollar amounts in thousands)
(Unaudited)
Funds from operations and funds from operations, as adjusted
GAAP basis accounting for real estate assets utilizes historical cost accounting and assumes real estate values diminish over time. In an effort to overcome the difference between real estate values and historical cost accounting for real estate assets, the Board of Governors of the National Association of Real Estate Investment Trusts (“NAREIT”) established the measurement tool of FFO. Since its introduction, FFO has become a widely used non-GAAP financial measure among equity REITs. We believe that FFO is helpful to investors as an additional measure of the performance of an equity REIT. Moreover, we believe that FFO, as adjusted, is also helpful because it allows investors to compare our performance to the performance of other real estate companies between periods, and on a consistent basis, without having to account for differences caused by investment decisions, financing decisions, terms of securities, capital structures, and capital market transactions. We compute FFO in accordance with standards established by the Board of Governors of NAREIT in its April 2002 white paper and related implementation guidance (“NAREIT White Paper”). The NAREIT White Paper defines FFO as net income (computed in accordance with GAAP), excluding gains (losses) from sales and impairments of real estate, plus real estate related depreciation and amortization, and after adjustments for unconsolidated partnerships and joint ventures. Impairments of real estate relate to decreases in the estimated fair value of real estate due to changes in general market conditions and do not necessarily reflect the operating performance of the properties during the corresponding period. Impairments of real estate represent the non-cash write-down of assets when fair value over the recoverability period is less than the carrying value. We compute FFO, as adjusted, as FFO calculated in accordance with the NAREIT White Paper, plus losses from early extinguishment of debt and preferred stock redemption charges, less realized gain on equity investment primarily related to one non-tenant life science entity, and the amount of such items which are allocable to our unvested restricted stock awards. Our calculations of both FFO and FFO, as adjusted, may differ from those methodologies utilized by other equity REITs for similar performance measurements, and, accordingly, may not be comparable to other equity REITs. Neither FFO nor FFO, as adjusted, should be considered as an alternative to net income (determined in accordance with GAAP) as an indication of financial performance, or to cash flows from operating activities (determined in accordance with GAAP) as a measure of liquidity, nor are they indicative of the availability of funds for our cash needs, including funds available to make distributions.
Adjusted funds from operations
AFFO is a non-GAAP financial measure that we use as a supplemental measure of our performance. We compute AFFO by adding to or deducting from FFO, as adjusted: (1) non-incremental revenue-enhancing capital expenditures, tenant improvements, and leasing commissions (excludes redevelopment expenditures); (2) effects of straight-line rent and straight-line rent on ground leases; (3) capitalized income from development projects; (4) amortization of acquired above and below market leases, loan fees, and debt premiums/discounts; (5) non-cash compensation expense; and (6) allocation of AFFO attributable to unvested restricted stock awards.
We believe that AFFO is a useful supplemental performance measure because it further adjusts to: (1) deduct certain expenditures which, although capitalized and included in depreciation expense, do not enhance the revenue or cash flows of our properties; (2) eliminate the effect of straight-lining our rental income and capitalizing income from development projects in order to reflect the actual amount of contractual rents due in the period presented; and (3) eliminate the effect of non-cash items that are not indicative of our core operations and do not actually reduce the amount of cash generated by our operations. We believe that eliminating the effect of non-cash charges related to stock-based compensation facilitates a comparison of our operations across periods and among other equity REITs without the variances caused by different valuation methodologies, the volatility of the expense (which depends on market forces outside of our control), and the assumptions and the variety of award types that a company can use. We believe that AFFO provides useful information by excluding certain items that are not representative of our core operating results because such items are dependent upon historical costs or subject to judgmental valuation inputs and the timing of our decisions.
AFFO is not intended to represent cash flow for the period, and is only intended to provide an additional measure of performance. We believe that net income attributable to Alexandria Real Estate Equities, Inc.’s common stockholders is the most directly comparable GAAP financial measure to AFFO. We believe that AFFO is a widely recognized measure of the operations of equity REITs, and presenting AFFO will enable investors to assess our performance in comparison to other equity REITs. However, other equity REITs may use different methodologies for calculating AFFO and, accordingly, our AFFO may not be comparable to AFFO calculated by other equity REITs. AFFO should not be considered as an alternative to net income (determined in accordance with GAAP) as an indication of financial performance, or to cash flows from operating activities (determined in accordance with GAAP) as a measure of our liquidity, nor is it indicative of funds available to fund our cash needs, including our ability to make distributions.
Net operating income
Net operating income is a non-GAAP financial measure equal to income from continuing operations, the most directly comparable GAAP financial measure, plus loss on early extinguishment of debt, depreciation and amortization, interest expense, and general and administrative expense. We believe net operating income provides useful information to investors regarding our financial condition and results of operations because it reflects primarily those income and expense items that are incurred at the property level. Therefore, we believe net operating income is a useful measure for evaluating the operating performance of our real estate assets. Net operating income on a cash basis is net operating income on a GAAP basis, adjusted to exclude the effect of straight-line rent adjustments required by GAAP. We believe that net operating income on a cash basis is helpful to investors as an additional measure of operating performance because it eliminates straight-line rent adjustments to rental revenue.
Further, we believe net operating income is useful to investors as a performance measure, because when compared across periods, net operating income reflects the impact on operations from trends in occupancy rates, rental rates, and operating costs, providing perspective not immediately apparent from income from continuing operations. Net operating income excludes certain components from income from continuing operations in order to provide results that are more closely related to the results of operations of our properties. For example, interest expense is not necessarily linked to the operating performance of a real estate asset and is often incurred at the corporate level rather than at the property level. In addition, depreciation and amortization, because of historical cost accounting and useful life estimates, may distort operating performance at the property level. Property operating expenses that are included in determining net operating income consist of costs that are related to our operating properties, such as utilities, repairs and maintenance, rental expense related to ground leases, contracted services, such as janitorial, engineering, and landscaping, property taxes and insurance, and property level salaries. General and administrative expenses consist primarily of accounting and corporate compensation, corporate insurance, professional fees, office rent, and office supplies, that are incurred as part of corporate office management. Net operating income presented by us may not be comparable to net operating income reported by other equity REITs that define net operating income differently. We believe that in order to facilitate a clear understanding of our operating results, net operating income should be examined in conjunction with income from continuing operations as presented in our condensed consolidated statements of income. Net operating income should not be considered as an alternative to income from continuing operations as an indication of our performance, or as an alternative to cash flows as a measure of liquidity, or our ability to make distributions. The following table presents a reconciliation of net operating income to income from continuing operations:
| | Three Months Ended | | Nine Months Ended |
| | September 30, 2012 | | September 30, 2011 | | September 30, 2012 | | September 30, 2011 |
Total revenues | | $ | 145,455 | | $ | 138,054 | | $ | 431,903 | | $ | 408,980 |
Rental operating expenses | | 44,614 | | 40,859 | | 127,884 | | 118,014 |
Net operating income | | 100,841 | | 97,195 | | 304,019 | | 290,966 |
Operating margins | | 69% | | 70% | | 70% | | 71% |
General and administrative | | 12,485 | | 10,289 | | 35,152 | | 30,528 |
Interest | | 17,094 | | 14,273 | | 51,243 | | 48,621 |
Depreciation and amortization | | 47,176 | | 38,747 | | 140,778 | | 113,326 |
Loss on early extinguishment of debt | | – | | 2,742 | | 2,225 | | 6,485 |
Income from continuing operations | | $ | 24,086 | | $ | 31,144 | | $ | 74,621 | | $ | 92,006 |
| ALEXANDRIA REAL ESTATE EQUITIES, INC. ALL RIGHTS RESERVED © 2012 | 12 |

ALEXANDRIA REAL ESTATE EQUITIES, INC.
Financial and Asset Base Highlights
(Dollars in thousands, except per share amounts)
(Unaudited)
| | Three Months Ended | |
Key Credit Metrics | | 9/30/12 | | 6/30/12 | | 3/31/12 | | 12/31/11 | | 9/30/11 | |
Unencumbered net operating income as a percentage of total net operating income | | 73% | | 73% | | 70% | | 69% | | 66% | |
Percentage outstanding on unsecured senior line of credit at end of period | | 28% | | 25% | | 11% | | 25% | | 54% | |
Net debt to gross assets (excluding cash and restricted cash) at end of period | | 38% | | 38% | | 36% | | 37% | | 36% | |
Net debt to Adjusted EBITDA (1) | | 7.6x | | 7.1x | (2) | 7.1x | | 7.1x | | 6.8x | |
Fixed charge coverage ratio (1) | | 2.5x | | 2.6x | | 2.6x | | 2.7x | | 2.7x | |
Interest coverage ratio (1) | | 3.1x | | 3.2x | | 3.3x | | 3.4x | | 3.4x | |
Dividend payout ratio (common stock) | | 50% | | 49% | | 46% | | 45% | | 43% | |
| | | | | | | | | | | |
Selected Balance Sheet Information | | | | | | | | | | | |
Investments in real estate (gross) | | $ | 7,154,359 | | $ | 7,030,723 | | $ | 6,892,429 | | $ | 6,750,975 | | $ | 6,635,872 | |
Total assets | | $ | 6,965,017 | | $ | 6,841,739 | | $ | 6,718,091 | | $ | 6,574,129 | | $ | 6,455,556 | |
Total unsecured debt | | $ | 2,312,794 | | $ | 2,278,783 | | $ | 2,067,772 | | $ | 2,054,959 | | $ | 1,898,484 | |
Total debt | | $ | 3,032,114 | | $ | 2,998,760 | | $ | 2,789,487 | | $ | 2,779,264 | | $ | 2,659,366 | |
Net debt | | $ | 2,892,377 | | $ | 2,875,926 | | $ | 2,672,323 | | $ | 2,677,393 | | $ | 2,558,381 | |
Total liabilities | | $ | 3,448,397 | | $ | 3,385,154 | | $ | 3,279,089 | | $ | 3,141,236 | | $ | 3,024,697 | |
Common shares outstanding | | 63,161,177 | | 62,249,973 | | 61,634,645 | | 61,560,472 | | 61,463,839 | |
Total market capitalization | | $ | 8,064,386 | | $ | 7,912,286 | | $ | 7,673,553 | | $ | 7,412,402 | | $ | 6,815,380 | |
| | | | | | | | | | | |
Operating Data | | | | | | | | | | | |
Total revenues | | $ | 145,455 | | $ | 148,016 | | $ | 138,432 | | $ | 139,249 | | $ | 138,054 | |
Rental operations | | $ | 44,614 | | $ | 42,359 | | $ | 40,911 | | $ | 41,553 | | $ | 40,859 | |
Operating margins | | 69% | | 71% | | 70% | | 70% | | 70% | |
General and administrative expense as a percentage of total revenues | | 8.6% | | 8.3% | | 7.5% | | 7.6% | | 7.5% | |
Capitalized interest | | $ | 16,763 | | $ | 15,825 | | $ | 15,266 | | $ | 16,151 | | $ | 16,666 | |
Weighted average interest rate used for capitalization during period | | 4.35% | | 4.41% | | 4.29% | | 4.35% | | 4.54% | |
Adjusted EBITDA – quarter annualized | | $ | 382,616 | | $ | 403,168 | (2) | $ | 377,836 | | $ | 377,964 | | $ | 377,168 | |
Adjusted EBITDA – trailing 12 months | | $ | 385,396 | | $ | 384,034 | (2) | $ | 378,484 | | $ | 376,050 | | $ | 370,998 | |
Adjusted EBITDA margins – quarter annualized | | 66% | | 68% | | 68% | | 68% | | 68% | |
| | | | | | | | | | | |
Net Income, FFO, and AFFO | | | | | | | | | | | |
Net income attributable to Alexandria Real Estate Equities, Inc.’s common
stockholders – diluted | | $ | 10,646 | (3) | $ | 17,616 | | $ | 18,368 | | $ | 26,960 | | $ | 24,662 | |
FFO attributable to Alexandria Real Estate, Inc.’s common stockholders – diluted | | $ | 67,101 | | $ | 69,964 | | $ | 59,704 | | $ | 67,804 | | $ | 65,268 | |
FFO attributable to Alexandria Real Estate, Inc.’s common stockholders – diluted,
as adjusted | | $ | 67,101 | | $ | 65,790 | | $ | 66,252 | | $ | 67,804 | | $ | 67,972 | |
AFFO attributable to Alexandria Real Estate Equities, Inc.’s common
stockholders – diluted | | $ | 65,016 | | $ | 63,967 | | $ | 62,457 | | 58,936 | | $ | 65,058 | |
| | | | | | | | | | | |
Per Share Data | | | | | | | | | | | |
Earnings per share – diluted | | $ | 0.17 | (3) | $ | 0.29 | | $ | 0.30 | | $ | 0.44 | | $ | 0.40 | |
FFO per share – diluted | | $ | 1.08 | | $ | 1.13 | | $ | 0.97 | | $ | 1.10 | | $ | 1.06 | |
FFO per share – diluted, as adjusted | | $ | 1.08 | | $ | 1.07 | | $ | 1.08 | | $ | 1.10 | | $ | 1.11 | |
AFFO per share – diluted | | $ | 1.04 | | $ | 1.04 | | $ | 1.02 | | $ | 0.96 | | $ | 1.06 | |
| | | | | | | | | | | |
Asset Base Statistics | | | | | | | | | | | |
Number of properties at end of period | | 177 | | 182 | | 174 | | 173 | | 171 | |
Rentable square feet at end of period | | 16,638,721 | | 16,922,327 | | 15,548,026 | | 15,312,563 | | 14,877,807 | |
Occupancy of operating properties at end of period | | 93.0% | | 92.9% | | 94.2% | | 94.9% | | 94.6% | |
Occupancy of operating and redevelopment properties at end of period | | 88.3% | | 86.9% | | 87.9% | | 88.5% | | 89.3% | |
| | | | | | | | | | | |
Leasing Activity and Same Property Performance | | | | | | | | | | | |
Leasing activity – Qtr rentable square feet | | 732,094 | | 959,295 | | 911,926 | | 1,142,055 | | 985,337 | |
Leasing activity – Qtr percentage change in rental rates – cash basis | | (2.9% | ) | (0.8% | ) | (2.8% | ) | (4.1% | ) | (3.0% | ) |
Leasing activity – Qtr percentage change in rental rates – GAAP basis | | 7.6% | | 5.8% | | 3.3% | | 7.6% | | 2.8% | |
Same property – Qtr percentage change in net operating income – cash basis | | 4.3% | | 1.6% | | 1.7% | | 3.1% | | 4.8% | |
Same property – Qtr percentage change in net operating income – GAAP basis | | (0.9% | ) | (0.2% | ) | (0.7% | ) | (0.5% | ) | (0.2% | ) |
(1) | Quarter annualized. |
(2) | Excluding $5.8 million recognized in the second quarter of 2012 related to a realized gain on an equity investment primarily related to one non-tenant life science entity, net debt to Adjusted EBITDA was 7.6x, Adjusted EBITDA – quarter annualized was approximately $379.9 million, and Adjusted EBITDA – trailing 12 months was approximately $378.2 million. |
(3) | Net income attributable to Alexandria Real Estate Equities, Inc.’s common stockholders – diluted excluding $9.8 million, or $0.16 per share, impairment of real estate, was $20.4 million, or $0.33 per share. |

| ALEXANDRIA REAL ESTATE EQUITIES, INC.
ALL RIGHTS RESERVED © 2012 | 13 |
ALEXANDRIA REAL ESTATE EQUITIES, INC.
Core Operating Metrics
September 30, 2012
(Unaudited)
Quarterly percentage change in same property net operating income
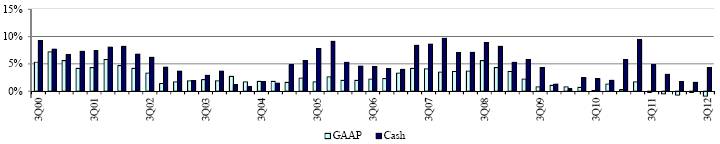
Percentage change in rental rates on renewed/re-leased space
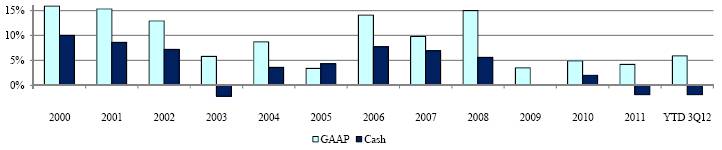
Occupancy percentage

Solid leasing capabilities – rentable square feet leased

| ALEXANDRIA REAL ESTATE EQUITIES, INC.
ALL RIGHTS RESERVED © 2012 | 14 |
ALEXANDRIA REAL ESTATE EQUITIES, INC.
Summary of Same Property Comparisons
September 30, 2012
(Dollars in thousands)
(Unaudited)
| | Three Months Ended | | Nine Months Ended | |
Same property data | | September 30, 2012 | | September 30, 2012 | |
Percentage change in net operating income – cash basis | | 4.3% | | 2.6% | |
Percentage change in net operating income – GAAP basis | | (0.9% | ) | (0.8% | ) |
| | | | | |
Number of properties | | 136 | | 133 | |
Rentable square feet | | 9,988,751 | | 9,809,636 | |
Occupancy – current period | | 93.7% | | 93.7% | |
Occupancy – same period prior year | | 93.2% | | 93.5% | |
The following table presents a comparison of the components of same property and non-same property net operating income for the three months and nine months ended September 30, 2012, compared to the three months and nine months ended September 30, 2011, and a reconciliation of net operating income to income from continuing operations, the most directly comparable GAAP financial measure:
| | Three Months Ended September 30, | | Nine Months Ended September 30, | |
Revenues: | | 2012 | | 2011 | | % Change | | 2012 | | 2011 | | % Change | |
Total revenues – same properties | | $ | 109,310 | | $ | 109,767 | | (0.4 | %) | (1) | $ | 321,613 | | $ | 321,155 | | 0.1 | % | (1) |
Total revenues – non-same properties | | 36,145 | | 28,287 | | 27.8 | | | 110,290 | | 87,825 | | 25.6 | | |
Total revenues – GAAP basis | | 145,455 | | 138,054 | | 5.4 | | | 431,903 | | 408,980 | | 5.6 | | |
| | | | | | | | | | | | | | | |
Expenses: | | | | | | | | | | | | | | | |
Rental operations – same properties | | 32,739 | | 32,473 | | 0.8 | | | 94,360 | | 92,108 | | 2.4 | | |
Rental operations – non-same properties | | 11,875 | | 8,386 | | 41.6 | | | 33,524 | | 25,906 | | 29.4 | | |
Total rental operations | | 44,614 | | 40,859 | | 9.2 | | | 127,884 | | 118,014 | | 8.4 | | |
| | | | | | | | | | | | | | | |
Net operating income: | | | | | | | | | | | | | | | |
Net operating income – same properties | | 76,571 | | 77,294 | | (0.9 | ) | | 227,253 | | 229,047 | | (0.8 | ) | |
Net operating income – non-same properties | | 24,270 | | 19,901 | | 22.0 | | | 76,766 | | 61,919 | | 24.0 | | |
Total net operating income – GAAP basis | | 100,841 | | 97,195 | | 3.8 | | | 304,019 | | 290,966 | | 4.5 | | |
| | | | | | | | | | | | | | | |
Other expenses: | | | | | | | | | | | | | | | |
General and administrative | | 12,485 | | 10,289 | | 21.3 | | | 35,152 | | 30,528 | | 15.1 | | |
Interest | | 17,094 | | 14,273 | | 19.8 | | | 51,243 | | 48,621 | | 5.4 | | |
Depreciation and amortization | | 47,176 | | 38,747 | | 21.8 | | | 140,778 | | 113,326 | | 24.2 | | |
Loss on early extinguishment of debt | | – | | 2,742 | | (100.0 | ) | | 2,225 | | 6,485 | | (65.7 | ) | |
Total other expenses | | 76,755 | | 66,051 | | 16.2 | | | 229,398 | | 198,960 | | 15.3 | | |
Income from continuing operations | | $ | 24,086 | | $ | 31,144 | | (22.7 | %) | | $ | 74,621 | | $ | 92,006 | | (18.9 | %) | |
| | | | | | | | | | | | | | | |
Net operating income – same properties – GAAP basis | | $ | 76,571 | | $ | 77,294 | | (0.9 | %) | | $ | 227,253 | | $ | 229,047 | | (0.8 | %) | |
Less: straight-line rent adjustments | | (990 | ) | (4,824 | ) | (79.5 | ) | (2) | (4,120 | ) | (11,521 | ) | (64.2 | ) | (2) |
Net operating income – same properties – cash basis | | $ | 75,581 | | $ | 72,470 | | 4.3 | % | | $ | 223,133 | | $ | 217,526 | | 2.6 | % | |
(1) Same property revenues were significantly impacted by a temporary decline in occupancy at 300 Technology Square in the Greater Boston market.
(2) The decrease in straight-line rent was primarily related to the commencement of approximately $6.5 million of annual cash rent at 450 East 29th Street in the Greater NYC market in early February 2012.
The following table reconciles same properties to total properties for the nine months ended September 30, 2012:
| Number of
Properties | | | Number of
Properties | | | Number of
Properties | |
Development – active | | | Development – deliveries since January 1, 2011 | | | Development/Redevelopment – Asia | 9 | (3) |
225 Binney Street | 1 | | 455 Mission Bay Boulevard South | 1 | | | | |
259 East Grand Avenue | 1 | | 4755 Nexus Center Drive | 1 | | Properties acquired since January 1, 2011 | | |
400/450 East Jamie Court | 2 | | 7 Triangle Drive | 1 | | 3013/3033 Science Park Road | 1 | |
409/499 Illinois Street | 2 | (1) | Canada | – | (2) | 6 Davis Drive | 1 | |
5200 Illumina Way | 1 | | | 3 | | | 2 | |
| 7 | | | | | | | |
| | | | | | | | |
Redevelopment – active | | | Redevelopment – deliveries since January 1, 2011 | | | Properties held for sale | 4 | |
11119 North Torrey Pines Road | 1 | | 10300 Campus Point Drive | 1 | | Total properties excluded from same properties | 44 | |
1551 Eastlake Avenue | 1 | | 15010 Broschart Road | 1 | | Same properties | 133 | |
20 Walkup Drive | 1 | | 215 First Street | 1 | | Total properties as of September 30, 2012 | 177 | |
285 Bear Hill Road | 1 | (1) | 3530/3550 John Hopkins Court | 2 | | | | |
343 Oyster Point Blvd | 1 | | 3565 General Atomics Court | 1 | | | | |
400 Technology Square | 1 | | 500 Arsenal Street | 1 | | | | |
620 Professional Drive | 1 | | 6101 Quadrangle Drive | 1 | | | | |
6275 Nancy Ridge Drive | 1 | | | 8 | | | | |
9800 Medical Center Drive | 3 | | | | | | | |
| 11 | | | | | | | |
(1) Properties acquired since January 1, 2011.
(2) Property count is included in operating portfolio as of September 30, 2012.
(3) Property count includes two development deliveries, one redevelopment delivery, one property acquired since January 1, 2011, and five active development and redevelopment properties.

| ALEXANDRIA REAL ESTATE EQUITIES, INC.
ALL RIGHTS RESERVED © 2012 | 15 |
ALEXANDRIA REAL ESTATE EQUITIES, INC.
Summary of Leasing Activity
September 30, 2012
(Unaudited)
| | Three Months Ended | | Nine Months Ended | | Year Ended | |
| | September 30, 2012 | | September 30, 2012 | | December 31, 2011 | | December 31, 2010 | | December 31, 2009 | |
Leasing activity: | | Cash | | GAAP | | Cash | | GAAP | | Cash | | GAAP | | Cash | | GAAP | | Cash | | GAAP | |
Lease expirations | | | | | | | | | | | | | | | | | | | | | |
Number of leases | | 47 | | 47 | | 131 | | 131 | | 158 | | 158 | | 129 | | 129 | | 131 | | 131 | |
Rentable square footage | | 441,483 | | 441,483 | | 1,816,548 | | 1,816,548 | | 2,689,257 | | 2,689,257 | | 2,416,291 | | 2,416,291 | | 1,842,597 | | 1,842,597 | |
Expiring rates | | $29.88 | | $28.10 | | $29.42 | | $27.77 | | $29.98 | | $28.42 | | $27.18 | | $28.54 | | $30.61 | | $30.70 | |
| | | | | | | | | | | | | | | | | | | | | |
Renewed/re-leased space | | | | | | | | | | | | | | | | | | | | | |
Number of leases | | 24 | | 24 | | 79 | | 79 | | 109 | | 109 | | 89 | | 89 | | 95 | | 95 | |
Leased rentable square footage | | 352,248 | | 352,248 | | 1,161,049 | | 1,161,049 | | 1,821,866 | | 1,821,866 | | 1,777,966 | | 1,777,966 | | 1,188,184 | | 1,188,184 | |
Expiring rates | | $29.89 | | $28.35 | | $29.99 | | $28.36 | | $30.73 | | $28.79 | | $28.84 | | $30.54 | | $28.07 | | $26.78 | |
New rates | | $29.02 | | $30.51 | | $29.43 | | $30.04 | | $30.16 | | $30.00 | | $29.41 | | $32.04 | | $28.11 | | $27.72 | |
Rental rate changes | | (2.9% | ) | 7.6% | | (1.9% | ) (1) | 5.9% | (1) | (1.9% | ) | 4.2% | | 2.0% | | 4.9% | | 0.1% | | 3.5% | |
TI’s/lease commissions per square foot | | $5.23 | | $5.23 | | $5.18 | | $5.18 | | $5.82 | | $5.82 | | $4.40 | | $4.40 | | $3.99 | | $3.99 | |
Average lease terms | | 4.8 years | | 4.8 years | | 4.6 years | | 4.6 years | | 4.2 years | | 4.2 years | | 8.1 years | | 8.1 years | | 3.3 years | | 3.3 years | |
| | | | | | | | | | | | | | | | | | | | | |
Developed/redeveloped/previously vacant space leased | | | | | | | | | | | | | | | | | | | | | |
Number of leases | | 23 | | 23 | | 67 | | 67 | | 81 | | 81 | | 53 | | 53 | | 47 | | 47 | |
Rentable square footage | | 379,846 | | 379,846 | | 1,442,266 | | 1,442,266 | | 1,585,610 | | 1,585,610 | | 966,273 | | 966,273 | | 676,163 | | 676,163 | |
New rates | | $29.06 | | $29.75 | | $32.71 | | $34.66 | | $33.45 | | $36.00 | | $36.33 | | $39.89 | | $33.57 | | $36.00 | |
TI’s/lease commissions per square foot | | $13.22 | | $13.22 | | $11.94 | | $11.94 | | $12.78 | | $12.78 | | $8.10 | | $8.10 | | $8.12 | | $8.12 | |
Average lease terms | | 8.6 years | | 8.6 years | | 9.1 years | | 9.1 years | | 8.9 years | | 8.9 years | | 9.7 years | | 9.7 years | | 6.6 years | | 6.6 years | |
| | | | | | | | | | | | | | | | | | | | | |
Leasing activity summary: | | | | | | | | | | | | | | | | | | | | | |
Totals (2) | | | | | | | | | | | | | | | | | | | | | |
Number of leases | | 47 | | 47 | | 146 | | 146 | | 190 | | 190 | | 142 | | 142 | | 142 | | 142 | |
Rentable square footage | | 732,094 | | 732,094 | | 2,603,315 | | 2,603,315 | | 3,407,476 | | 3,407,476 | | 2,744,239 | | 2,744,239 | | 1,864,347 | | 1,864,347 | |
New rates | | $29.04 | | $30.12 | | $31.25 | | $32.60 | | $31.69 | | $32.79 | | $31.84 | | $34.80 | | $30.09 | | $30.73 | |
TI’s/lease commissions per square foot | | $9.38 | | $9.38 | | $8.93 | | $8.93 | | $9.06 | | $9.06 | | $5.70 | | $5.70 | | $5.49 | | $5.49 | |
Average lease terms | | 6.8 years | | 6.8 years | | 7.1 years | | 7.1 years | | 6.4 years | | 6.4 years | | 8.7 years | | 8.7 years | | 4.5 years | | 4.5 years | |
Retention rate | | 88% | | 88% | | 78% | | 78% | | 87% | | 87% | | 92% | | 92% | | 81% | | 81% | |
(1) | Excluding one lease for 48,000 rentable square feet related to one client tenant in the Research Triangle Park market, and one lease for 71,000 rentable square feet related to one client tenant in the Suburban Washington, D.C. market, rental rates for renewed/re-leased space were, on average, 0.1% higher and 7.3% higher than rental rates for expiring leases on a cash and GAAP basis, respectively. |
(2) | Excludes 10 month-to-month leases for approximately 25,000 rentable square feet. |
During the three months ended September 30, 2012, we granted tenant concessions/free rent averaging approximately 1.8 months with respect to the 732,094 rentable square feet leased. During the nine months ended September 30, 2012, we granted tenant concessions/free rent averaging approximately 1.7 months with respect to the 2,603,315 rentable square feet leased.
Lease Structure | | September 30, 2012 |
Percentage of triple net leases | | 94% |
Percentage of leases containing annual rent escalations | | 96% |
Percentage of leases providing for the recapture of capital expenditures | | 91% |

| ALEXANDRIA REAL ESTATE EQUITIES, INC.
ALL RIGHTS RESERVED © 2012 | 16 |
ALEXANDRIA REAL ESTATE EQUITIES, INC.
Summary of Lease Expirations
September 30, 2012
(Unaudited)
Year of Lease Expiration | | Number of Leases Expiring | | RSF of Expiring Leases | | Percentage of
Aggregate Total RSF | | Annualized Base Rent of
Expiring Leases (per RSF) | |
2012 | | 21 | (1) | | 490,382 | (1) | | 3.5% | | | $25.84 | | |
2013 | | 88 | | | 953,531 | | | 6.9% | | | $28.31 | | |
2014 | | 86 | | | 1,237,589 | | | 8.9% | | | $30.23 | | |
2015 | | 67 | | | 1,259,426 | | | 9.1% | | | $31.81 | | |
2016 | | 52 | | | 1,432,820 | | | 10.3% | | | $30.33 | | |
2017 | | 59 | | | 1,506,498 | | | 10.9% | | | $30.38 | | |
2018 | | 19 | | | 1,143,754 | | | 8.3% | | | $39.62 | | |
2019 | | 16 | | | 595,324 | | | 4.3% | | | $34.18 | | |
2020 | | 15 | | | 731,680 | | | 5.3% | | | $40.36 | | |
2021 | | 19 | | | 697,828 | | | 5.0% | | | $38.70 | | |
Thereafter | | 32 | | | 2,151,820 | | | 15.5% | | | $39.15 | | |
| | | | | | | | | | | | Annualized | | | |
| | 2012 RSF of Expiring Leases | | Base Rent of | | | |
| | | | Negotiating/ | | Targeted for | | Remaining | | | | Expiring Leases | | Market Rent | |
Market | | Leased | | Anticipating | | Redevelopment | | Expiring Leases | | Total | | (per RSF) | | per RSF (2) | |
Greater Boston | | 13,091 | | 3,169 | | – | | 40,207 | | 56,467 | | $ | 31.58 | | $25.00 - $59.00 | |
San Francisco Bay | | – | | – | | 32,074 | (3) | 21,176 | | 53,250 | | 63.16 | | $20.00 - $47.00 | |
San Diego | | 23,218 | | – | | 243,550 | (4) | 3,000 | | 269,768 | | 21.94 | | $16.00 - $36.00 | |
Greater NYC | | – | | – | | – | | – | | – | | – | | N/A | |
Suburban Washington, D.C. | | – | | – | | – | | – | | – | | – | | $14.00 - $32.00 | |
Seattle | | 14,198 | | – | | 66,776 | (5) | 5,339 | | 86,313 | | 13.38 | | $17.00 - $44.00 | |
Research Triangle Park | | 4,575 | | – | | – | | 10,052 | | 14,627 | | 24.34 | | $10.00 - $32.00 | |
Canada | | – | | – | | – | | – | | – | | – | | N/A | |
Non-cluster markets | | – | | – | | – | | – | | – | | – | | N/A | |
Asia | | – | | – | | – | | 9,957 | | 9,957 | | 9.77 | | $8.00 - $26.00 | |
Total | | 55,082 | | 3,169 | | 342,400 | | 89,731 | | 490,382 | (1) | $ | 25.84 | | | |
Percentage of expiring leases | | 11 | % | 1 | % | 70 | % | 18 | % | 100 | % | | | | |
| | | | | | | | | | | | Annualized | | | |
| | 2013 RSF of Expiring Leases | | Base Rent of | | | |
| | | | Negotiating/ | | Targeted for | | Remaining | | | | Expiring Leases | | Market Rent | |
Market | | Leased | | Anticipating | | Redevelopment | | Expiring Leases | | Total | | (per RSF) | | per RSF (2) | |
Greater Boston | | – | | 102,215 | | – | | 80,290 | | 182,505 | | $ | 39.33 | | $25.00 - $59.00 | |
San Francisco Bay | | – | | 51,281 | | – | | 234,764 | | 286,045 | | 26.18 | | $20.00 - $47.00 | |
San Diego | | 2,835 | | – | | – | | 128,876 | | 131,711 | | 21.73 | | $16.00 - $36.00 | |
Greater NYC | | – | | – | | – | | – | | – | | – | | N/A | |
Suburban Washington, D.C. | | – | | 66,162 | | 54,906 | (6) | 127,190 | | 248,258 | | 30.55 | | $14.00 - $32.00 | |
Seattle | | – | | – | | – | | – | | – | | – | | N/A | |
Research Triangle Park | | – | | 16,560 | | – | | 52,928 | | 69,488 | | 18.62 | | $10.00 - $32.00 | |
Canada | | – | | – | | – | | – | | – | | – | | N/A | |
Non-cluster markets | | – | | 4,006 | | – | | 21,224 | | 25,230 | | 16.85 | | $14.00 - $22.00 | |
Asia | | – | | 2,314 | | – | | 7,980 | | 10,294 | | 15.54 | | $8.00 - $26.00 | |
Total | | 2,835 | | 242,538 | | 54,906 | | 653,252 | | 953,531 | | $ | 28.31 | | | |
Percentage of expiring leases | | – | % | 25 | % | 6 | % | 69 | % | 100 | % | | | | |
(1) | Excludes 10 month-to-month leases for approximately 25,000 rentable square feet. |
(2) | Based upon rental rates achieved in recently executed leases over the trailing 12 months. |
(3) | Represents a future redevelopment project containing 32,074 rentable square feet at 2625/2627/2631 Hanover Street in the Palo Alto submarket. The current lease expiration date is December 31, 2012. The client tenant may extend the lease on a short-term basis. Upon rollover, we expect to commence redevelopment of this property. |
(4) | Represents a project containing 176,500 rentable square feet of non-laboratory space at 3013/3033 Science Park Road, which consists of two buildings acquired in April 2012. The property was 100% leased on a short-term basis and, upon rollover in the fourth quarter of 2012, we expect to redevelop approximately 98,000 rentable square feet. The remaining 78,500 rentable square feet will be classified as future developable square feet. Also, represents a future redevelopment project containing 67,000 rentable square feet at 4757 Nexus Center Drive. The current lease expiration date at 4757 Nexus Center Drive is November 14, 2012. |
(5) | Represents a future redevelopment project containing 66,776 rentable square feet of office space at 1616 Eastlake Boulevard in the Seattle market. Of the 66,776 rentable square feet targeted for redevelopment into laboratory space, approximately 41,000 rentable square feet, or 61% has been pre-leased. Redevelopment of this space began in October 2012. |
(6) | Represents a project containing 54,906 rentable square feet at 5 Research Court in the Rockville submarket. We expect to redevelop the asset into single or multi-tenant laboratory space beginning in the fourth quarter of 2013. |

| ALEXANDRIA REAL ESTATE EQUITIES, INC.
ALL RIGHTS RESERVED © 2012 | 17 |
ALEXANDRIA REAL ESTATE EQUITIES, INC.
Summary of Properties and Occupancy
September 30, 2012
(Dollars in thousands)
(Unaudited)
Summary of properties
| | Rentable Square Feet | | Number of | | | | | |
Market | | Operating | | Development | | Redevelopment | | Total | | % Total | | Properties | | Annualized Base Rent | |
| | | | | | | | | | | | | | | | | |
Greater Boston | | 2,789,481 | | 303,143 | | 329,438 | | 3,422,062 | | 21 | % | | 35 | | | $ | 107,743 | | 26 | % | |
| | | | | | | | | | | | | | | | | | | | |
San Francisco Bay | | 2,252,790 | | 456,740 | | 53,980 | | 2,763,510 | | 16 | | | 25 | | | 88,535 | | 21 | | |
| | | | | | | | | | | | | | | | | | | | |
San Diego | | 2,628,695 | | 127,373 | | 53,784 | | 2,809,852 | | 17 | | | 36 | | | 82,974 | | 20 | | |
| | | | | | | | | | | | | | | | | | | | |
Greater NYC | | 534,827 | | – | | – | | 534,827 | | 3 | | | 6 | | | 31,278 | | 7 | | |
| | | | | | | | | | | | | | | | | | | | |
Suburban Washington, D.C. | | 2,334,863 | | – | | 101,183 | | 2,436,046 | | 15 | | | 31 | | | 48,768 | | 12 | | |
| | | | | | | | | | | | | | | | | | | | |
Seattle | | 694,042 | | – | | 52,141 | | 746,183 | | 4 | | | 10 | | | 27,052 | | 6 | | |
| | | | | | | | | | | | | | | | | | | | |
Research Triangle Park | | 941,807 | | – | | – | | 941,807 | | 6 | | | 14 | | | 19,213 | | 5 | | |
| | | | | | | | | | | | | | | | | | | | |
Canada | | 1,096,077 | | – | | – | | 1,096,077 | | 7 | | | 5 | | | 9,172 | | 2 | | |
| | | | | | | | | | | | | | | | | | | | |
Non-cluster markets | | 61,002 | | – | | – | | 61,002 | | – | | | 2 | | | 599 | | – | | |
| | | | | | | | | | | | | | | | | | | | |
North America | | 13,333,584 | | 887,256 | | 590,526 | | 14,811,366 | | 89 | | | 164 | | | 415,334 | | 99 | | |
| | | | | | | | | | | | | | | | | | | | |
Asia | | 592,188 | | 618,976 | | 112,061 | | 1,323,225 | | 8 | | | 9 | | | 4,588 | | 1 | | |
| | | | | | | | | | | | | | | | | | | | |
Continuing operations | | 13,925,772 | | 1,506,232 | | 702,587 | | 16,134,591 | | 97 | | | 173 | | | $ | 419,922 | | 100 | % | |
| | | | | | | | | | | | | | | | | | | |
Discontinued operations | | 504,130 | | – | | – | | 504,130 | | 3 | | | 4 | | | | | | |
| | | | | | | | | | | | | | | | | | | |
Total | | 14,429,902 | | 1,506,232 | | 702,587 | | 16,638,721 | | 100 | % | | 177 | | | | | | |
Summary of occupancy percentages
| | Operating Properties | | Operating and Redevelopment Properties | |
Market | | September 30, 2012 | | June 30, 2012 | | March 31, 2012 | | September 30, 2012 | | June 30, 2012 | | March 31, 2012 | |
| | | | | | | | | | | | | |
Greater Boston | | 94.3 | % | | 93.1 | % | | 91.7 | % | | 84.3 | % | | 84.1 | % | | 83.0 | % | |
| | | | | | | | | | | | | | | | | | | |
San Francisco Bay | | 98.0 | | | 97.0 | | | 96.2 | | | 95.7 | | | 94.7 | | | 93.9 | | |
| | | | | | | | | | | | | | | | | | | |
San Diego | | 95.2 | | | 95.5 | | | 96.1 | | | 93.3 | | | 85.5 | | | 81.5 | | |
| | | | | | | | | | | | | | | | | | | |
Greater NYC | | 95.0 | | | 94.2 | | | 93.0 | | | 95.0 | | | 94.2 | | | 93.0 | | |
| | | | | | | | | | | | | | | | | | | |
Suburban Washington, D.C. | | 89.4 | | | 90.1 | | | 94.2 | | | 85.7 | | | 86.3 | | | 90.4 | | |
| | | | | | | | | | | | | | | | | | | |
Seattle | | 96.3 | | | 96.1 | | | 96.7 | | | 89.6 | | | 90.8 | | | 91.4 | | |
| | | | | | | | | | | | | | | | | | | |
Research Triangle Park | | 95.5 | | | 95.5 | | | 95.8 | | | 95.5 | | | 95.5 | | | 95.8 | | |
| | | | | | | | | | | | | | | | | | | |
Canada | | 92.7 | | | 92.7 | | | 91.8 | | | 92.7 | | | 92.7 | | | 91.8 | | |
| | | | | | | | | | | | | | | | | | | |
Non-cluster markets | | 51.4 | | | 51.4 | | | 51.4 | | | 51.4 | | | 51.4 | | | 51.4 | | |
| | | | | | | | | | | | | | | | | | | |
North America | | 94.2 | | | 93.9 | | | 94.2 | | | 90.0 | | | 88.4 | | | 87.9 | | |
| | | | | | | | | | | | | | | | | | | |
Asia | | 68.1 | | | 67.4 | | | N/A | | | 57.2 | | | 55.0 | | | N/A | | |
| | | | | | | | | | | | | | | | | | | |
Continuing operations | | 93.0 | % | | 92.9 | % | | 94.2 | % | | 88.3 | % | | 86.9 | % | | 87.9 | % | |
| ALEXANDRIA REAL ESTATE EQUITIES, INC.
ALL RIGHTS RESERVED © 2012 | 18 |
ALEXANDRIA REAL ESTATE EQUITIES, INC.
Property Listing
September 30, 2012
(Dollars in thousands)
(Unaudited)
| | | | | | | | | | | | | | | | Occupancy Percentage | |
| | | | Rentable Square Feet | | Number of | | Annualized | | | | Operating and | |
Address | | Submarket | | Operating | | Development | | Redevelopment | | Total | | Properties | | Base Rent | | Operating | | Redevelopment | |
Greater Boston | | | | | | | | | | | | | | | | | | | | |
100 Technology Square | | Cambridge/Inner Suburbs | | 255,441 | | – | | – | | 255,441 | | 1 | | $ | 17,397 | | 100.0 | % | | 100.0 | % | |
200 Technology Square | | Cambridge/Inner Suburbs | | 177,101 | | – | | – | | 177,101 | | 1 | | 10,191 | | 100.0 | | | 100.0 | | |
300 Technology Square | | Cambridge/Inner Suburbs | | 175,609 | | – | | – | | 175,609 | | 1 | | 7,535 | | 87.5 | | | 87.5 | | |
400 Technology Square | | Cambridge/Inner Suburbs | | – | | – | | 212,123 | | 212,123 | | 1 | | – | | N/A | | | – | | |
500 Technology Square | | Cambridge/Inner Suburbs | | 184,207 | | – | | – | | 184,207 | | 1 | | 10,009 | | 98.4 | | | 98.4 | | |
600 Technology Square | | Cambridge/Inner Suburbs | | 128,224 | | – | | – | | 128,224 | | 1 | | 4,383 | | 99.6 | | | 99.6 | | |
700 Technology Square | | Cambridge/Inner Suburbs | | 48,930 | | – | | – | | 48,930 | | 1 | | 1,891 | | 100.0 | | | 100.0 | | |
161 First Street | | Cambridge/Inner Suburbs | | 46,356 | | – | | – | | 46,356 | | 1 | | 1,960 | | 99.5 | | | 99.5 | | |
167 Sidney Street | | Cambridge/Inner Suburbs | | 26,589 | | – | | – | | 26,589 | | 1 | | 1,392 | | 100.0 | | | 100.0 | | |
215 First Street | | Cambridge/Inner Suburbs | | 366,719 | | – | | – | | 366,719 | | 1 | | 10,651 | | 86.2 | | | 86.2 | | |
225 Binney Street | | Cambridge/Inner Suburbs | | – | | 303,143 | | – | | 303,143 | | 1 | | – | | N/A | | | N/A | | |
300 Third Street | | Cambridge/Inner Suburbs | | 131,963 | | – | | – | | 131,963 | | 1 | | 6,520 | | 100.0 | | | 100.0 | | |
480 Arsenal | | Cambridge/Inner Suburbs | | 140,744 | | – | | – | | 140,744 | | 1 | | 4,673 | | 100.0 | | | 100.0 | | |
500 Arsenal Street | | Cambridge/Inner Suburbs | | 93,516 | | – | | – | | 93,516 | | 1 | | 3,385 | | 100.0 | | | 100.0 | | |
780/790 Memorial Drive | | Cambridge/Inner Suburbs | | 99,350 | | – | | – | | 99,350 | | 2 | | 6,580 | | 100.0 | | | 100.0 | | |
79/96 Charlestown Navy Yard | | Cambridge/Inner Suburbs | | 24,940 | | – | | – | | 24,940 | | 1 | | – | | – | | | – | | |
99 Erie Street | | Cambridge/Inner Suburbs | | 27,960 | | – | | – | | 27,960 | | 1 | | 1,143 | | 100.0 | | | 100.0 | | |
100 Beaver Street | | Route 128 | | 82,330 | | – | | – | | 82,330 | | 1 | | 2,336 | | 100.0 | | | 100.0 | | |
285 Bear Hill Road | | Route 128 | | – | | – | | 26,270 | | 26,270 | | 1 | | – | | N/A | | | – | | |
19 Presidential Way | | Route 128 | | 128,325 | | – | | – | | 128,325 | | 1 | | 3,398 | | 100.0 | | | 100.0 | | |
29 Hartwell Avenue | | Route 128 | | 59,000 | | – | | – | | 59,000 | | 1 | | 2,049 | | 100.0 | | | 100.0 | | |
3 Preston Court | | Route 128 | | 30,123 | | – | | – | | 30,123 | | 1 | | 393 | | 44.4 | | | 44.4 | | |
35 Hartwell Avenue | | Route 128 | | 46,700 | | – | | – | | 46,700 | | 1 | | 1,650 | | 100.0 | | | 100.0 | | |
35 Wiggins Avenue | | Route 128 | | 48,640 | | – | | – | | 48,640 | | 1 | | 879 | | 100.0 | | | 100.0 | | |
44 Hartwell Avenue | | Route 128 | | 26,828 | | – | | – | | 26,828 | | 1 | | 1,105 | | 100.0 | | | 100.0 | | |
45/47 Wiggins Avenue | | Route 128 | | 38,000 | | – | | – | | 38,000 | | 1 | | 1,114 | | 100.0 | | | 100.0 | | |
60 Westview Street | | Route 128 | | 40,200 | | – | | – | | 40,200 | | 1 | | 1,147 | | 100.0 | | | 100.0 | | |
6/8 Preston Court | | Route 128 | | 54,391 | | – | | – | | 54,391 | | 1 | | 753 | | 100.0 | | | 100.0 | | |
111 Forbes Boulevard | | Route 495/Worcester | | 58,280 | | – | | – | | 58,280 | | 1 | | 261 | | 28.6 | | | 28.6 | | |
130 Forbes Boulevard | | Route 495/Worcester | | 97,566 | | – | | – | | 97,566 | | 1 | | 871 | | 100.0 | | | 100.0 | | |
20 Walkup Drive | | Route 495/Worcester | | – | | – | | 91,045 | | 91,045 | | 1 | | – | | N/A | | | – | | |
30 Bearfoot Road | | Route 495/Worcester | | 60,759 | | – | | – | | 60,759 | | 1 | | 2,765 | | 100.0 | | | 100.0 | | |
306 Belmont Street | | Route 495/Worcester | | 78,916 | | – | | – | | 78,916 | | 1 | | 1,139 | | 100.0 | | | 100.0 | | |
350 Plantation Street | | Route 495/Worcester | | 11,774 | | – | | – | | 11,774 | | 1 | | 173 | | 100.0 | | | 100.0 | | |
Greater Boston | | | | 2,789,481 | | 303,143 | | 329,438 | | 3,422,062 | | 35 | | $ | 107,743 | | 94.3 | % | | 84.3 | % | |
| | | | | | | | | | | | | | | | | | | | | |
San Francisco Bay | | | | | | | | | | | | | | | | | | | | | |
1500 Owens Street | | Mission Bay | | 158,267 | | – | | – | | 158,267 | | 1 | | $ | 6,700 | | 93.8 | % | | 93.8 | % | |
1700 Owens Street | | Mission Bay | | 157,340 | | – | | – | | 157,340 | | 1 | | 10,147 | | 99.6 | | | 99.6 | | |
455 Mission Bay Boulevard South | | Mission Bay | | 210,398 | | – | | – | | 210,398 | | 1 | | 8,835 | | 97.8 | | | 97.8 | | |
409/499 Illinois Street | | Mission Bay | | 234,249 | | 222,780 | | – | | 457,029 | | 2 | | 14,197 | | 100.0 | | | 100.0 | | |
249 East Grand Avenue | | South San Francisco | | 129,501 | | – | | – | | 129,501 | | 1 | | 5,086 | | 100.0 | | | 100.0 | | |
259 East Grand Avenue | | South San Francisco | | – | | 170,618 | | – | | 170,618 | | 1 | | – | | N/A | | | N/A | | |
341/343 Oyster Point Blvd | | South San Francisco | | 53,980 | | – | | 53,980 | | 107,960 | | 2 | | 1,189 | | 100.0 | | | 50.0 | | |
400/450 East Jamie Court | | South San Francisco | | 99,694 | | 63,342 | | – | | 163,036 | | 2 | | 2,971 | | 100.0 | | | 100.0 | | |
500 Forbes Boulevard | | South San Francisco | | 155,685 | | – | | – | | 155,685 | | 1 | | 5,540 | | 100.0 | | | 100.0 | | |
600/630/650 Gateway Boulevard | | South San Francisco | | 150,960 | | – | | – | | 150,960 | | 3 | | 3,823 | | 85.1 | | | 85.1 | | |
681 Gateway Boulevard | | South San Francisco | | 126,971 | | – | | – | | 126,971 | | 1 | | 6,161 | | 100.0 | | | 100.0 | | |
7000 Shoreline Court | | South San Francisco | | 136,393 | | – | | – | | 136,393 | | 1 | | 4,167 | | 100.0 | | | 100.0 | | |
901/951 Gateway Boulevard | | South San Francisco | | 170,244 | | – | | – | | 170,244 | | 2 | | 5,573 | | 100.0 | | | 100.0 | | |
2425 Garcia Ave & 2400/2450 Bayshore Parkway | | Peninsula | | 98,964 | | – | | – | | 98,964 | | 1 | | 3,232 | | 96.6 | | | 96.6 | | |
2625/2627/2631 Hanover Street (1) | | Peninsula | | 32,074 | | – | | – | | 32,074 | | 1 | | 1,335 | | 100.0 | | | 100.0 | | |
3165 Porter Drive | | Peninsula | | 91,644 | | – | | – | | 91,644 | | 1 | | 3,929 | | 100.0 | | | 100.0 | | |
3350 West Bayshore Road | | Peninsula | | 60,000 | | – | | – | | 60,000 | | 1 | | 1,531 | | 100.0 | | | 100.0 | | |
75/125 Shoreway Road | | Peninsula | | 82,815 | | – | | – | | 82,815 | | 1 | | 2,044 | | 100.0 | | | 100.0 | | |
849/863 Mitten Road & 866 Malcolm Road | | Peninsula | | 103,611 | | – | | – | | 103,611 | | 1 | | 2,075 | | 95.3 | | | 95.3 | | |
San Francisco Bay | | | | 2,252,790 | | 456,740 | | 53,980 | | 2,763,510 | | 25 | | $ | 88,535 | | 98.0 | % | | 95.7 | % | |
(1) | Represents a future redevelopment project containing 32,074 rentable square feet at 2625/2627/2631 Hanover Street in the Palo Alto submarket. The current lease expiration date is December 31, 2012. The client tenant may extend the lease on a short-term basis. Upon rollover, we expect to commence redevelopment of this property. |
| ALEXANDRIA REAL ESTATE EQUITIES, INC.
ALL RIGHTS RESERVED © 2012 | 19 |
ALEXANDRIA REAL ESTATE EQUITIES, INC.
Property Listing
September 30, 2012
(Dollars in thousands)
(Unaudited)
| | | | | | | | | | | | | | | | Occupancy Percentage | |
| | | | Rentable Square Feet | | Number of | | Annualized | | | | Operating and | |
Address | | Submarket | | Operating | | Development | | Redevelopment | | Total | | Properties | | Base Rent | | Operating | | Redevelopment | |
San Diego | | | | | | | | | | | | | | | | | | | |
10931/10933 North Torrey Pines Road | | Torrey Pines | | 96,641 | | – | | – | | 96,641 | | 1 | | $ | 2,977 | | 98.8% | | 98.8% | |
10975 North Torrey Pines Road | | Torrey Pines | | 44,733 | | – | | – | | 44,733 | | 1 | | 1,595 | | 100.0 | | 100.0 | |
11119 North Torrey Pines Road | | Torrey Pines | | 18,461 | | – | | 53,784 | | 72,245 | | 1 | | 590 | | 100.0 | | 25.6 | |
3010 Science Park Road | | Torrey Pines | | 74,557 | | – | | – | | 74,557 | | 1 | | 3,215 | | 100.0 | | 100.0 | |
3013/3033 Science Park Road (1) | | Torrey Pines | | 176,500 | | – | | – | | 176,500 | | 1 | | 3,055 | | 100.0 | | 100.0 | |
3115/3215 Merryfield Row | | Torrey Pines | | 158,645 | | – | | – | | 158,645 | | 2 | | 7,098 | | 100.0 | | 100.0 | |
3530/3550 John Hopkins Court & 3535/3565 General Atomics Court | | Torrey Pines | | 220,569 | | – | | – | | 220,569 | | 4 | | 7,807 | | 93.4 | | 93.4 | |
10300 Campus Point Drive | | University Town Center | | 449,759 | | – | | – | | 449,759 | | 1 | | 15,761 | | 96.1 | | 96.1 | |
4755/4757/4767 Nexus Center Drive (2) | | University Town Center | | 177,585 | | – | | – | | 177,585 | | 3 | | 6,655 | | 100.0 | | 100.0 | |
5200 Illumina Way | | University Town Center | | 346,581 | | 127,373 | | – | | 473,954 | | 1 | | 13,474 | | 100.0 | | 100.0 | |
9363/9373/9393 Towne Center Drive | | University Town Center | | 122,232 | | – | | – | | 122,232 | | 3 | | 3,523 | | 100.0 | | 100.0 | |
9880 Campus Point Drive | | University Town Center | | 71,510 | | – | | – | | 71,510 | | 1 | | 2,774 | | 100.0 | | 100.0 | |
5810/5820 Nancy Ridge Drive | | Sorrento Mesa | | 87,298 | | – | | – | | 87,298 | | 1 | | 1,740 | | 100.0 | | 100.0 | |
5871 Oberlin Drive | | Sorrento Mesa | | 33,817 | | – | | – | | 33,817 | | 1 | | 478 | | 48.0 | | 48.0 | |
6138/6150 Nancy Ridge Drive | | Sorrento Mesa | | 56,698 | | – | | – | | 56,698 | | 1 | | 1,586 | | 100.0 | | 100.0 | |
6146/6166 Nancy Ridge Drive | | Sorrento Mesa | | 51,273 | | – | | – | | 51,273 | | 2 | | 639 | | 57.2 | | 57.2 | |
6175/6225/6275 Nancy Ridge Drive | | Sorrento Mesa | | 105,812 | | – | | – | | 105,812 | | 3 | | 1,215 | | 55.5 | | 55.5 | |
7330 Carroll Road | | Sorrento Mesa | | 66,244 | | – | | – | | 66,244 | | 1 | | 2,141 | | 89.4 | | 89.4 | |
10505 Roselle Street & 3770 Tansy Street | | Sorrento Valley | | 33,013 | | – | | – | | 33,013 | | 2 | | 1,001 | | 100.0 | | 100.0 | |
11025/11035/11045 Roselle Street | | Sorrento Valley | | 66,442 | | – | | – | | 66,442 | | 3 | | 1,621 | | 100.0 | | 100.0 | |
3985 Sorrento Valley Boulevard | | Sorrento Valley | | 60,545 | | – | | – | | 60,545 | | 1 | | 1,534 | | 100.0 | | 100.0 | |
13112 Evening Creek Drive | | I-15 Corridor | | 109,780 | | – | | – | | 109,780 | | 1 | | 2,495 | | 100.0 | | 100.0 | |
San Diego | | | | 2,628,695 | | 127,373 | | 53,784 | | 2,809,852 | | 36 | | $ | 82,974 | | 95.2% | | 93.3% | |
| | | | | | | | | | | | | | | | | | | |
Greater NYC | | | | | | | | | | | | | | | | | | | |
450 East 29th Street | | Manhattan | | 309,141 | | – | | – | | 309,141 | | 1 | | $ | 24,377 | | 98.7% | | 98.7% | |
100 Phillips Parkway | | Bergen County | | 78,501 | | – | | – | | 78,501 | | 1 | | 2,309 | | 100.0 | | 100.0 | |
102 Witmer Road | | Pennsylvania | | 50,000 | | – | | – | | 50,000 | | 1 | | 3,345 | | 100.0 | | 100.0 | |
5100 Campus Drive | | Pennsylvania | | 21,859 | | – | | – | | 21,859 | | 1 | | 159 | | 64.9 | | 64.9 | |
701 Veterans Circle | | Pennsylvania | | 35,155 | | – | | – | | 35,155 | | 1 | | 735 | | 100.0 | | 100.0 | |
702 Electronic Drive | | Pennsylvania | | 40,171 | | – | | – | | 40,171 | | 1 | | 353 | | 62.3 | | 62.3 | |
Greater NYC | | | | 534,827 | | – | | – | | 534,827 | | 6 | | $ | 31,278 | | 95.0% | | 95.0% | |
| | | | | | | | | | | | | | | | | | | |
Suburban Washington, D.C. | | | | | | | | | | | | | | | | | | | |
12301 Parklawn Drive | | Rockville | | 49,185 | | – | | – | | 49,185 | | 1 | | $ | 1,196 | | 100.0% | | 100.0% | |
1330 Piccard Drive | | Rockville | | 131,511 | | – | | – | | 131,511 | | 1 | | 2,716 | | 88.8 | | 88.8 | |
1405 Research Boulevard | | Rockville | | 71,669 | | – | | – | | 71,669 | | 1 | | 2,315 | | 100.0 | | 100.0 | |
1500/1550 East Gude Drive | | Rockville | | 90,489 | | – | | – | | 90,489 | | 2 | | 1,386 | | 77.3 | | 77.3 | |
14920 Broschart Road | | Rockville | | 48,500 | | – | | – | | 48,500 | | 1 | | 1,073 | | 100.0 | | 100.0 | |
15010 Broschart Road | | Rockville | | 38,203 | | – | | – | | 38,203 | | 1 | | 687 | | 78.1 | | 78.1 | |
5 Research Court (3) | | Rockville | | 54,906 | | – | | – | | 54,906 | | 1 | | 1,425 | | 100.0 | | 100.0 | |
5 Research Place | | Rockville | | 63,852 | | – | | – | | 63,852 | | 1 | | 2,357 | | 100.0 | | 100.0 | |
9800 Medical Center Drive | | Rockville | | 206,530 | | – | | 75,056 | | 281,586 | | 4 | | 6,787 | | 86.1 | | 63.2 | |
9920 Medical Center Drive | | Rockville | | 58,733 | | – | | – | | 58,733 | | 1 | | 455 | | 100.0 | | 100.0 | |
1201 Clopper Road | | Gaithersburg | | 143,585 | | – | | – | | 143,585 | | 1 | | 3,984 | | 100.0 | | 100.0 | |
1300 Quince Orchard Road | | Gaithersburg | | 54,874 | | – | | – | | 54,874 | | 1 | | 812 | | 100.0 | | 100.0 | |
16020 Industrial Drive | | Gaithersburg | | 71,000 | | – | | – | | 71,000 | | 1 | | 1,052 | | 100.0 | | 100.0 | |
19/20/22 Firstfield Road | | Gaithersburg | | 132,639 | | – | | – | | 132,639 | | 3 | | 2,975 | | 95.9 | | 95.9 | |
25/35/45 West Watkins Mill Road | | Gaithersburg | | 138,938 | | – | | – | | 138,938 | | 1 | | 3,640 | | 100.0 | | 100.0 | |
401 Professional Drive | | Gaithersburg | | 63,154 | | – | | – | | 63,154 | | 1 | | 959 | | 78.9 | | 78.9 | |
620 Professional Drive | | Gaithersburg | | – | | – | | 26,127 | | 26,127 | | 1 | | – | | N/A | | – | |
708 Quince Orchard Road | | Gaithersburg | | 49,624 | | – | | – | | 49,624 | | 1 | | 1,145 | | 99.3 | | 99.3 | |
9 West Watkins Mill Road | | Gaithersburg | | 92,449 | | – | | – | | 92,449 | | 1 | | 2,766 | | 100.0 | | 100.0 | |
910 Clopper Road | | Gaithersburg | | 180,650 | | – | | – | | 180,650 | | 1 | | 2,922 | | 79.3 | | 79.3 | |
930/940 Clopper Road | | Gaithersburg | | 104,302 | | – | | – | | 104,302 | | 2 | | 1,654 | | 93.4 | | 93.4 | |
950 Wind River Lane | | Gaithersburg | | 50,000 | | – | | – | | 50,000 | | 1 | | 1,082 | | 100.0 | | 100.0 | |
8000/9000/10000 Virginia Manor Road | | Beltsville | | 191,884 | | – | | – | | 191,884 | | 1 | | 1,039 | | 41.8 | | 41.8 | |
14225 Newbrook Drive | | Northern Virginia | | 248,186 | | – | | – | | 248,186 | | 1 | | 4,341 | | 100.0 | | 100.0 | |
Suburban Washington, D.C. | | | | 2,334,863 | | – | | 101,183 | | 2,436,046 | | 31 | | $ | 48,768 | | 89.4% | | 85.7% | |
(1) | Represents a project containing 176,500 rentable square feet of non-laboratory space at 3013/3033 Science Park Road, which consists of two buildings acquired in April 2012. The property was 100% leased on a short-term basis and, upon rollover in the fourth quarter of 2012, we expect to redevelop approximately 98,000 rentable square feet. The remaining 78,500 rentable square feet will be classified as future developable square feet. |
(2) | Represents a future redevelopment project containing 67,000 rentable square feet at 4757 Nexus Center Drive. The current lease expiration date at 4757 Nexus Center Drive is November 14, 2012. |
(3) | Represents a project containing 54,906 rentable square feet at 5 Research Court in the Rockville submarket. We expect to redevelop the asset into single or multi-tenant laboratory space beginning in the fourth quarter of 2013. |

| ALEXANDRIA REAL ESTATE EQUITIES, INC.
ALL RIGHTS RESERVED © 2012 | 20 |
ALEXANDRIA REAL ESTATE EQUITIES, INC.
Property Listing
September 30, 2012
(Dollars in thousands)
(Unaudited)
| | | | | | | | | | | | | | | | Occupancy Percentage | |
| | | | Rentable Square Feet | | Number of | | Annualized | | | | Operating and | |
Address | | Submarket | | Operating | | Development | | Redevelopment | | Total | | Properties | | Base Rent | | Operating | | Redevelopment | |
Seattle | | | | | | | | | | | | | | | | | | | |
1201/1208 Eastlake Avenue | | Lake Union | | 203,369 | | – | | – | | 203,369 | | 2 | | $ | 8,748 | | 100.0% | | 100.0% | |
1551 Eastlake Avenue | | Lake Union | | 65,342 | | – | | 52,141 | | 117,483 | | 1 | | 2,151 | | 100.0 | | 55.6 | |
1600 Fairview Avenue | | Lake Union | | 27,991 | | – | | – | | 27,991 | | 1 | | 1,520 | | 100.0 | | 100.0 | |
1616 Eastlake Avenue (1) | | Lake Union | | 168,490 | | – | | – | | 168,490 | | 1 | | 4,433 | | 92.9 | | 92.9 | |
199 East Blaine Street | | Lake Union | | 115,084 | | – | | – | | 115,084 | | 1 | | 6,165 | | 100.0 | | 100.0 | |
219 Terry Avenue | | Lake Union | | 30,845 | | – | | – | | 30,845 | | 1 | | 1,422 | | 93.4 | | 93.4 | |
3000/3018 Western Avenue | | Elliott Bay | | 47,746 | | – | | – | | 47,746 | | 1 | | 1,795 | | 100.0 | | 100.0 | |
410 West Harrison & 410 Elliott Avenue West | | Elliott Bay | | 35,175 | | – | | – | | 35,175 | | 2 | | 818 | | 67.4 | | 67.4 | |
Seattle | | | | 694,042 | | – | | 52,141 | | 746,183 | | 10 | | $ | 27,052 | | 96.3% | | 89.6% | |
| | | | | | | | | | | | | | | | | | | |
Research Triangle Park | | | | | | | | | | | | | | | | | | | |
100 Capitola Drive | | Research Triangle Park | | 65,965 | | – | | – | | 65,965 | | 1 | | $ | 1,046 | | 100.0% | | 100.0% | |
108/110/112/114 Alexander Road | | Research Triangle Park | | 158,417 | | – | | – | | 158,417 | | 1 | | 4,896 | | 100.0 | | 100.0 | |
2525 East NC Highway 54 | | Research Triangle Park | | 81,580 | | – | | – | | 81,580 | | 1 | | 1,673 | | 100.0 | | 100.0 | |
5 Triangle Drive | | Research Triangle Park | | 32,120 | | – | | – | | 32,120 | | 1 | | 824 | | 100.0 | | 100.0 | |
601 Keystone Park Drive | | Research Triangle Park | | 77,395 | | – | | – | | 77,395 | | 1 | | 1,306 | | 100.0 | | 100.0 | |
6101 Quadrangle Drive | | Research Triangle Park | | 30,122 | | – | | – | | 30,122 | | 1 | | 440 | | 77.0 | | 77.0 | |
7 Triangle Drive | | Research Triangle Park | | 96,626 | | – | | – | | 96,626 | | 1 | | 3,165 | | 100.0 | | 100.0 | |
7010/7020/7030 Kit Creek | | Research Triangle Park | | 133,654 | | – | | – | | 133,654 | | 3 | | 1,921 | | 77.0 | | 77.0 | |
800/801 Capitola Drive | | Research Triangle Park | | 120,905 | | – | | – | | 120,905 | | 2 | | 2,128 | | 95.9 | | 95.9 | |
6 Davis Drive | | Research Triangle Park | | 100,000 | | – | | – | | 100,000 | | 1 | | 1,062 | | 100.0 | | 100.0 | |
555 Heritage Drive | | Palm Beach | | 45,023 | | – | | – | | 45,023 | | 1 | | 752 | | 100.0 | | 100.0 | |
Research Triangle Park | | | | 941,807 | | – | | – | | 941,807 | | 14 | | $ | 19,213 | | 95.5% | | 95.5% | |
| | | | | | | | | | | | | | | | | | | |
Canada | | | | | | | | | | | | | | | | | | | |
Canada | | | | 46,032 | | – | | – | | 46,032 | | 1 | | $ | 1,891 | | 100.0% | | 100.0% | |
Canada | | | | 66,000 | | – | | – | | 66,000 | | 1 | | 1,212 | | 100.0 | | 100.0 | |
Canada | | | | 132,790 | | – | | – | | 132,790 | | 1 | | 2,897 | | 82.8 | | 82.8 | |
Canada | | | | 68,000 | | – | | – | | 68,000 | | 1 | | 3,172 | | 100.0 | | 100.0 | |
Canada (2) | | | | 783,255 | | – | | – | | 783,255 | | 1 | | N/A | | N/A | | N/A | |
Total Canada | | | | 1,096,077 | | – | | – | | 1,096,077 | | 5 | | $ | 9,172 | | 92.7% | | 92.7% | |
| | | | | | | | | | | | | | | | | | | |
Other market properties | | | | 61,002 | | – | | – | | 61,002 | | 2 | | 599 | | 51.4% | | 51.4% | |
| | | | | | | | | | | | | | | | | | | |
North America | | | | 13,333,584 | | 887,256 | | 590,526 | | 14,811,366 | | 164 | | $ | 415,334 | | 94.2% | | 90.0% | |
| | | | | | | | | | | | | | | | | | | |
Asia | | | | 592,188 | | 618,976 | | 112,061 | | 1,323,225 | | 9 | | $ | 4,588 | | 68.1% | | 57.2% | |
| | | | | | | | | | | | | | | | | | | |
Continuing operations | | | | 13,925,772 | | 1,506,232 | | 702,587 | | 16,134,591 | | 173 | | $ | 419,922 | | 93.0% | | 88.3% | |
| | | | | | | | | | | | | | | | | | | |
Properties “held for sale” | | | | 504,130 | | – | | – | | 504,130 | | 4 | | | | | | | |
| | | | | | | | | | | | | | | | | | | |
Total | | | | 14,429,902 | | 1,506,232 | | 702,587 | | 16,638,721 | | 177 | | | | | | | |
(1) | Represents a future redevelopment project containing 66,776 rentable square feet of office space at 1616 Eastlake Boulevard in the Seattle market. Of the 66,776 rentable square feet targeted for redevelopment into laboratory space, approximately 41,000 rentable square feet, or 61% has been pre-leased. Redevelopment of this space began in October 2012. |
(2) | Represents land and improvements subject to a ground lease with a client tenant. |

| ALEXANDRIA REAL ESTATE EQUITIES, INC.
ALL RIGHTS RESERVED © 2012 | 21 |
ALEXANDRIA REAL ESTATE EQUITIES, INC.
Top 20 Client Tenants and Client Tenant Mix
September 30, 2012
(Tabular dollar amounts in thousands)
(Unaudited)
Top 20 client tenants
| | | | | | Remaining Lease | | Approximate
Aggregate | | Percentage
of
Aggregate | | | | Percentage
of
Aggregate | | Investment-Grade Entities (3) | | | |
| | | | Number | | Term in Years | | Rentable | | Total | | Annualized | | Annualized | | Fitch | | Moody’s | | S&P | | Education/ | |
| | Client Tenant | | of Leases | | (1) | | (2) | | Square Feet | | Square Feet | | Base Rent | | Base Rent | | Rating | | Rating | | Rating | | Research | |
1 | | Novartis AG | | 11 | | 4.1 | | 4.3 | | 608,876 | | 3.7% | | $ | 30,544 | | 7.3% | | AA | | Aa2 | | AA- | | – | |
2 | | Bristol-Myers Squibb Company | | 6 | | 5.1 | | 5.4 | | 419,624 | | 2.5 | | 15,840 | | 3.8 | | A+ | | A2 | | A+ | | – | |
3 | | Eli Lilly and Company | | 5 | | 8.8 | | 10.4 | | 262,182 | | 1.6 | | 15,048 | | 3.6 | | A | | A2 | | AA- | | – | |
4 | | FibroGen, Inc. | | 1 | | 11.1 | | 11.1 | | 234,249 | | 1.4 | | 14,197 | | 3.4 | | – | | – | | – | | – | |
5 | | Roche | | 3 | | 5.5 | | 5.6 | | 348,918 | | 2.1 | | 13,867 | | 3.3 | | AA- | | A1 | | AA- | | – | |
6 | | Illumina, Inc. | | 1 | | 19.1 | | 19.1 | | 346,581 | | 2.1 | | 13,474 | | 3.2 | | – | | – | | – | | – | |
7 | | United States Government | | 8 | | 4.3 | | 5.3 | | 324,577 | | 1.9 | | 12,727 | | 3.0 | | AAA | | Aaa | | AA+ | | – | |
8 | | GlaxoSmithKline plc | | 4 | | 7.2 | | 6.9 | | 207,812 | | 1.2 | | 10,238 | | 2.4 | | A+ | | A1 | | A+ | | – | |
9 | | Celgene Corporation | | 4 | | 9.0 | | 8.9 | | 255,780 | | 1.5 | | 9,565 | | 2.3 | | – | | Baa2 | | BBB+ | | – | |
10 | | Massachusetts Institute of Technology | | 3 | | 4.7 | | 4.9 | | 178,952 | | 1.1 | | 8,230 | | 2.0 | | – | | Aaa | | AAA | | ü | |
11 | | The Regents of the University of California | | 3 | | 8.9 | | 8.9 | | 182,242 | | 1.1 | | 7,435 | | 1.8 | | AA+ | | Aa1 | | AA | | ü | |
12 | | NYU-Neuroscience Translational Research Institute | | 2 | | 13.2 | | 12.4 | | 78,597 | | 0.5 | | 6,993 | | 1.7 | | – | | Aa3 | | AA- | | ü | |
13 | | Alnylam Pharmaceuticals, Inc. (4) | | 1 | | 4.0 | | 4.0 | | 129,424 | | 0.8 | | 6,066 | | 1.4 | | – | | – | | – | | – | |
14 | | Gilead Sciences, Inc. | | 1 | | 7.8 | | 7.8 | | 109,969 | | 0.7 | | 5,824 | | 1.4 | | – | | Baa1 | | A- | | – | |
15 | | Pfizer Inc. | | 2 | | 6.7 | | 6.5 | | 116,518 | | 0.7 | | 5,502 | | 1.3 | | A+ | | A1 | | AA | | – | |
16 | | The Scripps Research Institute | | 2 | | 4.2 | | 4.1 | | 99,377 | | 0.6 | | 5,197 | | 1.2 | | AA- | | Aa3 | | – | | ü | |
17 | | Theravance, Inc. (5) | | 2 | | 7.7 | | 7.7 | | 130,342 | | 0.8 | | 4,895 | | 1.2 | | – | | – | | – | | – | |
18 | | Infinity Pharmaceuticals, Inc. | | 2 | | 2.3 | | 2.3 | | 68,020 | | 0.4 | | 4,423 | | 1.1 | | – | | – | | – | | – | |
19 | | Qiagen N.V. | | 2 | | 3.8 | | 3.8 | | 158,879 | | 0.9 | | 4,380 | | 1.0 | | – | | – | | – | | – | |
20 | | Quest Diagnostics Incorporated | | 1 | | 4.3 | | 4.3 | | 248,186 | | 1.5 | | 4,341 | | 1.0 | | BBB+ | | Baa2 | | BBB+ | | – | |
| | Total/Weighted Average: | | 64 | | 7.1 | | 7.5 | | 4,509,105 | | 27.1% | | $ | 198,786 | | 47.4% | | | | | | | | | |
(1) | Represents remaining lease term in years based on percentage of leased square feet. |
(2) | Represents remaining lease term in years based on percentage of annualized base rent in effect as of September 30, 2012. |
(3) | Ratings obtained from Fitch Ratings, Moody’s Investors Service, and Standard & Poor’s. |
(4) | As of June 30, 2012, Novartis AG owned approximately 11% of the outstanding stock of Alnylam Pharmaceuticals, Inc. |
(5) | As of July 25, 2012, GlaxoSmithKline plc owned approximately 27% of the outstanding stock of Theravance, Inc. |
Client tenant mix by annualized base rent
Multinational Pharmaceutical | | Institutional: University,
Non-Profit, and Government | | Life Science Product and Service,
Medical Device, and Industrial Biotech | | Biotechnology: Public & Private |
· Abbott Laboratories · Astellas Pharma Inc. · AstraZeneca PLC · Bayer AG · Bristol-Myers Squibb Company · Eisai Co., Ltd. · Eli Lilly and Company · Genomics Institute of the Novartis Research Foundation · GlaxoSmithKline plc · Johnson & Johnson · Merck & Co., Inc. · Novartis AG · Pfizer Inc. · Roche · Sanofi · Shire plc · UCB S.A. | | · California Institute of Technology · Dana-Farber Cancer Institute, Inc. · Duke University · Environmental Protection Agency · Fred Hutchinson Cancer Research Center · Massachusetts Institute of Technology · National Institutes of Health · NYU-Neuroscience Translational Research Institute · Sanford-Burnham Medical Research Institute · Stanford University · The Regents of the University of California · The Scripps Research Institute · UMass Memorial Health Care, Inc. · UNC Health Care System · United States Government · University of Washington | | · Canon U.S. Life Sciences, Inc. · Covance Inc. · DSM N.V. · Fluidigm Corporation · Illumina, Inc. · Laboratory Corporation of America Holdings · Life Technologies Corporation · Monsanto Company · Qiagen N.V. · Quest Diagnostics Incorporated · Sapphire Energy, Inc. · Thermo Fisher Scientific, Inc. | | · Alnylam Pharmaceuticals, Inc. · Amgen Inc. · Biogen Idec Inc. · Celgene Corporation · Constellation Pharmaceuticals, Inc. · Epizyme, Inc. · Fate Therapeutics, Inc. · FibroGen, Inc. · FORMA Therapeutics, Inc. · Gilead Sciences, Inc. · Infinity Pharmaceuticals, Inc. · Kadmon Corporation, LLC · Medicago Inc. · Onyx Pharmaceuticals, Inc. · Proteostasis Therapeutics, Inc. · Quanticel Pharmaceuticals, Inc. · Theravance, Inc. · Warp Drive Bio, LLC |

| ALEXANDRIA REAL ESTATE EQUITIES, INC.
ALL RIGHTS RESERVED © 2012 | 22 |

ALEXANDRIA REAL ESTATE EQUITIES, INC.
Significant Future Growth Opportunities
September 30, 2012
(Unaudited)
ALEXANDRIA CENTERTM FOR LIFE SCIENCE – NEW YORK CITY |
| | | |

| | | 
The Alexandria Center™ for Life Science – New York City may consist of three buildings aggregating approximately 1.1 million rentable square feet. The East Tower consists of approximately 309,000 rentable square feet and is 98.7% occupied as of September 30, 2012. This flagship destination for life science innovation also includes 419,806 developable square feet in the future West Tower project, as well as an option parcel supporting the future ground-up development of approximately 385,000 rentable square feet on the north end of the campus. We expect to commence vertical construction for the 419,806 rentable square feet West Tower project in the fourth quarter of 2012. |
| | | |
| | | |
ALEXANDRIA CENTERTM FOR SCIENCE AND TECHNOLOGY – MISSION BAY | | | ALEXANDRIA CENTERTM AT KENDALL SQUARE |
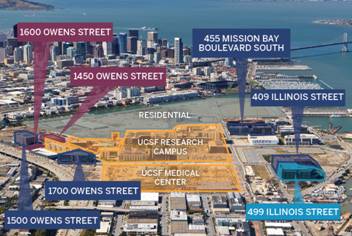
The Alexandria Center™ for Science and Technology – Mission Bay will consist of up to seven high-quality facilities aggregating approximately 1.3 million rentable square feet. We currently have five buildings aggregating approximately 760,000 rentable square feet leased to FibroGen, Inc., Celgene Corporation, Pfizer Inc., Bayer AG, Nektar Therapeutics, Inc., and UCSF as well as other top-tier life science entities, 223,000 rentable square feet undergoing development, and future potential buildings aggregating approximately 290,000 rentable square feet. | | | 
Alexandria owns and operates approximately 2.4 million rentable square feet in Cambridge, including 1.2 million rentable square feet at Cambridge’s flagship destination for life science, Alexandria’s Technology Square. The Alexandria Center™ at Kendall Square represents five future ground-up, build-to-suit life science laboratory developments aggregating 1.9 million rentable square feet, including a 303,000 rentable square feet build-to-suit project for Biogen Idec Inc. currently undergoing ground-up development. |
Legend | 
| Completed | 
| Under development/redevelopment | 
| Future development |

| ALEXANDRIA REAL ESTATE EQUITIES, INC. ALL RIGHTS RESERVED © 2012 | 23 |
ALEXANDRIA REAL ESTATE EQUITIES, INC.
Summary of Investments in Real Estate
September 30, 2012
(Tabular dollar amounts in thousands, except per square foot amounts)
(Unaudited)
Summary of investments in real estate
| | September 30, 2012 | | June 30, 2012 | |
| | Book Value | | Square Feet | | Cost per
Square Foot | | Book Value | | Square Feet | | Cost per
Square Foot | |
Land (related to rental properties) | | $ | 506,823 | | | | | | $ | 520,593 | | | | | |
Buildings and building improvements | | 4,682,998 | | | | | | 4,600,499 | | | | | |
Other improvements | | 184,301 | | | | | | 184,209 | | | | | |
Rental properties | | 5,374,122 | | 14,429,902 | | $ | 372 | | 5,305,301 | | 14,354,168 | | $ | 370 | |
Less: accumulated depreciation | | (854,332 | ) | | | | | (822,369 | ) | | | | |
Rental properties, net | | 4,519,790 | | | | | | 4,482,932 | | | | | |
| | | | | | | | | | | | | |
Construction in progress (“CIP”)/current value-added projects: | | | | | | | | | | | | | |
Active development in North America | | 304,619 | | 887,256 | | 343 | | 290,289 | | 954,702 | | 304 | |
Active redevelopment in North America | | 277,506 | | 590,526 | | 470 | | 275,086 | | 812,505 | | 339 | |
Generic infrastructure/building improvement projects in North America | | 72,739 | | – | | – | | 80,877 | | – | | – | |
Active development and redevelopment in Asia | | 95,301 | | 731,037 | | 130 | | 97,744 | | 800,851 | | 122 | |
| | 750,165 | | 2,208,819 | | 340 | | 743,996 | | 2,568,058 | | 290 | |
| | | | | | | | | | | | | |
Subtotal | | 5,269,955 | | 16,638,721 | | 317 | | 5,226,928 | | 16,922,226 | | 309 | |
| | | | | | | | | | | | | |
Land/future value-added projects: | | | | | | | | | | | | | |
Land held for future development in North America | | 326,932 | | 5,451,000 | | 60 | | 324,586 | | 5,620,000 | | 58 | |
Land undergoing preconstruction activities (additional CIP) in North America | | 597,631 | | 2,370,000 | | 252 | | 569,805 | | 2,350,000 | | 242 | |
Land held for future development/land undergoing preconstruction activities (additional CIP) in Asia | | 78,511 | | 6,789,000 | | 12 | | 60,161 | | 6,700,000 | | 9 | |
| | 1,003,074 | | 14,610,000 | | 69 | | 954,552 | | 14,670,000 | | 65 | |
| | | | | | | | | | | | | |
Investment in unconsolidated real estate entity | | 26,998 | | 414,000 | | 65 | | 26,874 | | 414,000 | | 65 | |
Investments in real estate, net | | 6,300,027 | | 31,662,721 | | $ | 199 | | 6,208,354 | | 32,006,226 | | $ | 194 | |
Add: accumulated depreciation | | 854,332 | | | | | | 822,369 | | | | | |
Gross investments in real estate (1) | | $ | 7,154,359 | | 31,662,721 | | | | $ | 7,030,723 | | 32,006,226 | | | |
(1) In addition to assets included in our gross investments in real estate, we hold options/rights for parcels supporting the future ground-up development of approximately 385,000 rentable square feet in Alexandria Center™ for Life Science – New York City related to an option under our ground lease.
Non-income-producing real estate assets as a percentage of gross investments in real estate
As of September 30, 2012, our active development and redevelopment projects represent 11% of gross investments in real estate, a significant amount of which is pre-leased and expected to be delivered over the next one to five quarters. Land undergoing preconstruction activities represents 9% of gross investment in real estate. The two largest projects included in land undergoing preconstruction consist of our 1.6 million developable square feet at Alexandria Center™ at Kendall Square in East Cambridge, Massachusetts, and our 419,806 developable square feet site for the West Tower at Alexandria Center™ for Life Science – New York City. Land held for future development represent 5% of our non-income producing assets. Over the next few years, we may also identify certain land parcels for potential sale. Over time, our goal is to reduce non-income-producing assets to 15% or less of our gross investments in real estate.

| ALEXANDRIA REAL ESTATE EQUITIES, INC. ALL RIGHTS RESERVED © 2012 | 24 |
ALEXANDRIA REAL ESTATE EQUITIES, INC.
Development and Redevelopment Projects in North America
September 30, 2012
(Tabular dollar amounts in thousands)
(Unaudited)
| | Project RSF | | Leased Status RSF | | Investment | | Initial Stabilized | | Project | | | | | |
Market – Submarket/ | | In | | | | | | | | | | | | | | % Leased/ | | September 30, 2012 | | To Complete | | Total at | | Yield (1) | | Start | | Occupancy | | Stabilization | |
Property | | Service | | CIP | | Total | | Leased | | Negotiating | | Marketing | | Total | | Negotiating | | In Service | | CIP | | 2012 | | Thereafter | | Completion | | Cash | | GAAP | | Date | | Date | | Date | |
Development projects in North America | | | | | | | | | | | | | | | | | | | | | | | | | | | | | | | | | | | | | |
Greater Boston – Cambridge | | | | | | | | | | | | | | | | | | | | | | | | | | | | | | | | | | | | | |
225 Binney Street | | – | | 303,143 | | 303,143 | | 303,143 | | – | | – | | 303,143 | | 100% | | $ | – | | $ | 84,163 | | $ | 8,788 | | $ | 87,322 | | $ | 180,273 | | 7.5% | | 8.1% | | 4Q11 | | 4Q13 | | 4Q13 | |
| | | | | | | | | | | | | | | | | | | | | | | | | | | | | | | | | | | | | |
San Francisco Bay – Mission Bay | | | | | | | | | | | | | | | | | | | | | | | | | | | | | | | | | | | | | |
499 Illinois Street (2) | | – | | 222,780 | | 222,780 | | – | | – | | 222,780 | | 222,780 | | – | | $ | – | | $ | 111,219 | | $ | 2,867 | | $ | 39,123 | | $ | 153,209 | | 6.4% | | 7.2% | | 2Q11 | | 2Q14 | | 1Q15 | |
| | | | | | | | | | | | | | | | | | | | | | | | | | | | | | | | | | | | | |
San Francisco Bay – South SF | | | | | | | | | | | | | | | | | | | | | | | | | | | | | | | | | | | | | |
259 East Grand Avenue (3) | | – | | 170,618 | | 170,618 | | 170,618 | | – | | – | | 170,618 | | 100% | | $ | – | | $ | 45,226 | | $ | 13,498 | (3) | $ | 22,137 | (3) | $ | 80,861 | | 7.8–8.2% | | 7.8–8.2% | | 1Q12 | | 4Q12 | | 4Q12 | |
400/450 East Jamie Court | | 99,694 | | 63,342 | | 163,036 | | 127,732 | | – | | 35,304 | | 163,036 | | 78% | | $ | 58,481 | | $ | 39,340 | | $ | 5,962 | | $ | 9,230 | | $ | 113,013 | | 4.2% | | 4.3% | | 4Q06 | | 3Q11 | | 2Q13 | |
Other - 400/450 East Jamie Court (4) | | | | | | | | | | | | | | | | | | $ | 20,659 | | $ | (20,659 | ) | | | | | | | | | | | | | | | | |
| | | | | | | | | | | | | | | | | | | | | | | | | | | | | | | | | | | | | |
San Diego – University Town Center | | | | | | | | | | | | | | | | | | | | | | | | | | | | | | | | | | | | | |
5200 Illumina Way | | – | | 127,373 | | 127,373 | | 127,373 | | – | | – | | 127,373 | | 100% | | $ | – | | $ | 45,330 | | $ | 2,229 | | $ | 1,741 | | $ | 49,300 | | 7.0% | | 10.8% | | 4Q10 | | 4Q12 | | 4Q12 | |
Development projects in North America | | 99,694 | | 887,256 | | 986,950 | | 728,866 | | – | | 258,084 | | 986,950 | | 74% | | $ | 79,140 | | $ | 304,619 | | $ | 33,344 | | $ | 159,553 | | $ | 576,656 | | | | | | | | | | | |
| | | | | | | | | | | | | | | | | | | | | | | | | | | | | | | | | | | | | |
Redevelopment projects in North America | | | | | | | | | | | | | | | | | | | | | | | | | | | | | | | | | | | | | |
Greater Boston – Cambridge | | | | | | | | | | | | | | | | | | | | | | | | | | | | | | | | | | | | | |
400 Technology Square | | – | | 212,123 | | 212,123 | | 169,939 | | – | | 42,184 | | 212,123 | | 80% | | $ | – | | $ | 111,297 | | $ | 15,891 | | $ | 17,500 | | $ | 144,688 | | 8.1% | | 8.9% | | 4Q11 | | 4Q12 | | 4Q13 | |
| | | | | | | | | | | | | | | | | | | | | | | | | | | | | | | | | | | | | |
Seattle – Lake Union | | | | | | | | | | | | | | | | | | | | | | | | | | | | | | | | | | | | | |
1551 Eastlake Avenue | | 65,342 | | 52,141 | | 117,483 | | 74,914 | | 8,000 | | 34,569 | | 117,483 | | 71% | | $ | 36,148 | | $ | 20,366 | | $ | 2,730 | | $ | 4,766 | | $ | 64,010 | | 6.7% | | 6.7% | | 4Q11 | | 4Q11 | | 4Q13 | |
| | | | | | | | | | | | | | | | | | | | | | | | | | | | | | | | | | | | | |
Suburban and other redevelopment projects | | 18,461 | | 326,262 | | 344,723 | | 211,388 | | 55,270 | | 78,065 | | 344,723 | | 77% | | $ | 11,840 | | $ | 151,650 | | $ | 7,504 | | $ | 37,590 | | $ | 208,584 | | | | | | | | | | | |
Other – suburban and other redevelopment projects (4) | | | | | | | | | | | | | | | | | | $ | 5,807 | | $ | (5,807 | ) | | | | | | | | | | | | | | | | |
Redevelopment projects in North America | | 83,803 | | 590,526 | | 674,329 | | 456,241 | | 63,270 | | 154,818 | | 674,329 | | 77% | | $ | 53,795 | | $ | 277,506 | | $ | 26,125 | | $ | 59,856 | | $ | 417,282 | | | | | | | | | | | |
| | | | | | | | | | | | | | | | | | | | | | | | | | | | | | | | | | | | | |
Total development and redevelopment projects in North America | | 183,497 | | 1,477,782 | | 1,661,279 | | 1,185,107 | | 63,270 | | 412,902 | | 1,661,279 | | 75% | | $ | 132,935 | | $ | 582,125 | | $ | 59,469 | | $ | 219,409 | | $ | 993,938 | | | | | | | | | | | |
(1) | As of September 30, 2012, 96% of our overall leases contained annual rent escalations that were either fixed or based on a consumer price index or another index. Our Initial Stabilized Yield on a cash basis reflects cash rents upon stabilization and does not reflect contractual rent escalations beyond the stabilization date. We expect, on average, our contractual cash rents related to our value-added projects to increase over time. |
(2) | The cash and GAAP Initial Stabilized Yields related to the development of 499 Illinois Street declined by approximately 0.3% and 0.2%, respectively, to allow for a slightly longer absorption period. Despite this change, we still expect to achieve overall yields for the entire project (including the occupied portion of 409 Illinois) within our original expectations of 6.5%-7.0% and 7.2%-7.6% for cash and GAAP, respectively. |
(3) | Funding for this project will be provided primarily by the $55 million secured construction loan we closed in June 2012. |
(4) | As of the period end, some portion of the real estate basis associated with the rentable square feet under development or redevelopment was classified as in service because activities necessary to prepare the asset for its intended use were no longer in process. In the near future, we anticipate recommencing activities necessary to prepare the asset for its intended use upon execution of leasing and final decisions related to design of each space. |

| ALEXANDRIA REAL ESTATE EQUITIES, INC. ALL RIGHTS RESERVED © 2012 | 25 |
ALEXANDRIA REAL ESTATE EQUITIES, INC.
Investment in Unconsolidated Real Estate Entity and Future Value-Added Projects in North America
September 30, 2012
(Tabular dollar amounts in thousands)
(Unaudited)
Investment in unconsolidated real estate entity
In March 2012, we contributed our 55% ownership interest in a land parcel supporting a future building with 414,000 rentable square feet in the Longwood Medical Area of the Greater Boston market to a newly formed joint venture (the “Restated JV”) with National Development and Charles River Realty Investors, and admitted as a 50% member, Clarion Partners, LLC, resulting in a reduction of our ownership interest from 55% to 27.5%. The transfer of one-half of our 55% ownership interest in this real estate venture to Clarion Partners, LLC, was accounted for as an in-substance partial sale of an interest in the underlying real estate. Upon formation of the Restated JV, the existing $38.4 million secured loan was refinanced with a seven-year (including two one-year extension options) non-recourse $213 million secured construction loan with initial loan proceeds of $50 million. As of September 30, 2012, the outstanding balance on the construction loan was $56.4 million. We do not expect our share of capital contributions through the completion of the project to exceed the approximate $22.3 million in net proceeds received in this transaction. Construction of this $350 million project commenced in April 2012. The initial occupancy date for this project is expected in the fourth quarter of 2014, the project is 37% pre-leased to Dana-Farber Cancer Institute, Inc. In addition, Dana-Farber Cancer Institute, Inc. has an option to lease an additional two floors approximating 99,000 rentable square feet, or 24% of the total rentable square feet of the project. We expect to earn development and other fees of approximately $3.5 million through 2015, and recurring annual property management fees thereafter, from this project. As of September 30, 2012, key information regarding the unconsolidated real estate entity in the Greater Boston market was as follows:
360 Longwood Avenue, Greater Boston | |
Our | | Total Venture | | Current | | | | | | | | Unlevered Initial | | Total Venture | | Venture Debt | | Debt | | Our Equity | |
Ownership | | Costs at | | Venture | | Project | | Percentage | | Stabilization | | Stabilized Yield | | Debt | | Outstanding | | Available | | Investment | |
Percentage | | Completion | | CIP | | RSF | | Leased | | Date | | Cash | | GAAP | | Commitment (1) | | as of 9/30/12 | | as of 9/30/12 | | as of 9/30/12 (2) | |
27.5% | | $ | 350,000 | | $ | 126,833 | | 414,000 | | 37% (3) | | 2016 | | 8.1-8.5% | | 8.7-9.1% | | $ | 213,200 | | $ | 56,411 | | $ | 156,789 | | $ | 26,998 | |
| | | | | | | | | | | | | | | | | | | | | | | | | | | | | |
(1) Total joint venture loan commitment is comprised of borrowings up to $175.2 million which bears interest at fixed interest rate of 5.25%, and additional borrowings up to $38 million that bears interest at LIBOR plus 3.75% with a floor of 5.25%, which will be used to fund tenant improvements, leasing commissions, and other related expenses. The joint venture has entered into an interest rate hedge agreement to cap LIBOR at a maximum of 3.50%. The notes carry a maturity date of April 1, 2019, assuming the joint venture exercises its option to extend the stated maturity date of April 1, 2017, by one year, twice.
(2) We expect to reinvest $18.3 million of the $22.3 million received in March 2012 from sale of a portion of our interest in the land parcel.
(3) Dana-Farber Cancer Institute, Inc. has an option to lease an additional two floors approximating 99,000 rentable square feet, or 24% of the total rentable square feet of the project.
Future value-added projects in North America
The following table summarizes the components of our future value-added developable square footage in North America as of September 30, 2012:
Market | | Land Undergoing
Preconstruction Activities
(additional CIP) | | Land Held for
Future Development | | Total Land (1) | | Future
Redevelopment (2) | |
| | | | | | | | | |
Greater Boston | | 1,589,000 | (3) | 155,000 | | 1,744,000 | | 119,000 | |
| | | | | | | | | |
San Francisco Bay - Mission Bay | | - | | 290,000 | | 290,000 | | - | |
| | | | | | | | | |
San Francisco Bay - South San Francisco | | - | | 1,024,000 | | 1,024,000 | | 40,000 | |
| | | | | | | | | |
San Diego | | 255,000 | (4) | 522,000 | | 777,000 | | 264,000 | |
| | | | | | | | | |
Greater NYC | | 420,000 | (1) (5) | - | | 420,000 | | - | |
| | | | | | | | | |
Suburban Washington, D.C. | | - | | 1,274,000 | | 1,274,000 | | 416,000 | |
| | | | | | | | | |
Seattle | | 106,000 | (6) | 959,000 | | 1,065,000 | | 82,000 | |
| | | | | | | | | |
Other markets | | - | | 1,085,000 | | 1,085,000 | | 105,000 | |
| | | | | | | | | |
Canada | | - | | 142,000 | | 142,000 | | - | |
| | | | | | | | | |
Total future value-added projects in North America | | 2,370,000 | | 5,451,000 | | 7,821,000 | | 1,026,000 | |
(1) In addition to assets included in our gross investment in real estate, we hold options/rights for parcels supporting the future ground-up development of approximately 385,000 rentable square feet in Alexandria Center™ for Life Science – New York City related to an option under our ground lease.
(2) Our asset base also includes non-laboratory space (office, warehouse, and industrial space) identified for future conversion into life science laboratory space through redevelopment. These spaces are classified in investments in real estate, net, in the condensed consolidated balance sheets.
(3) Represents preconstruction related to four future ground-up development projects aggregating 1.6 million rentable square feet related to The Alexandria Center™ at Kendall Square.
(4) Represents preconstruction related to a future development site for 205,000 rentable square feet in Torrey Pines. This site also contains a parking structure and other improvements. Additionally, this also includes a future development site for 50,000 rentable square feet in University Town Center.
(5) Represents preconstruction related to a future ground-up development project for 419,806 rentable square feet for the West Tower of the Alexandria Center™ for Life Science – New York City. Our investment to date includes costs related to steel, curtain wall, foundation, and underground parking garage.
(6) Represents preconstruction related to a future ground-up development project for 106,000 rentable square feet in Lake Union.

| ALEXANDRIA REAL ESTATE EQUITIES, INC.
ALL RIGHTS RESERVED © 2012 | 26 |
ALEXANDRIA REAL ESTATE EQUITIES, INC.
Summary of Capital Expenditures
September 30, 2012
(Unaudited)
Construction spending - actuals | | | Nine Months Ended
September 30, 2012
(in thousands) | |
Development projects in North America | | | $ | 135,914 | |
Redevelopment projects in North America | | | 145,042 | |
Preconstruction | | | 57,418 | |
Generic infrastructure/building improvement projects in North America (1) | | | 73,387 | |
Development and redevelopment projects in Asia | | | 17,067 | |
Total construction spending (2) | | | $ | 428,828 | |
Construction spending - projection | | Three Months Ended
December 31, 2012
(in thousands) | | Year Ended
December 31, 2013
(in thousands) | | Thereafter
(in thousands) | |
Active development projects in North America | | $ | 33,344 | | $ | 122,582 | | $ | 36,971 | |
Active redevelopment projects in North America | | 26,125 | | 59,720 | | 136 | |
Preconstruction | | 26,609 | | 84,475 | | TBD | (3) |
Generic infrastructure/building improvement projects in North America | | 43,484 | | 67,872 | | TBD | (3) |
Future projected construction projects (4) | | 27,612 | | 250,000 - 300,000 | | TBD | (3) |
Development and redevelopment projects in Asia | | 10,173 | | 30,258 | | 17,060 | |
Total construction spending (2) | | $ | 167,347 | | $ | 614,907 - 664,907 | | $ | 54,167 | |
(1) Includes revenue-enhancing projects and amounts shown in the table below related to non-incremental revenue-enhancing capital expenditures.
(2) Amounts include indirect project costs, including interest, property taxes, insurance, and payroll costs.
(3) Estimated spending beyond 2013 related to preconstruction, generic infrastructure improvements, major capital spending, and projected construction projects will be determined at a future date and is contingent upon many factors.
(4) Includes future ground-up development related to the West Tower of the Alexandria Center™ for Life Science – New York City. Also, includes future redevelopment projects in North America at 1616 Eastlake Avenue, 2625/2627/2631 Hanover Street, 3033 Science Park Road, 4757 Nexus Center Drive, 5 Research Court, and 6175 Nancy Ridge Drive.
The table below shows the average per square foot property-related non-incremental revenue-enhancing capital expenditures, tenant improvements, and leasing costs (excluding capital expenditures and tenant improvements that are recoverable from client tenants, revenue-enhancing, or related to properties that have undergone redevelopment).
| | Nine Months Ended | |
Non-incremental revenue-enhancing capital expenditures (1): | | September 30, 2012 | |
Major capital expenditures | | $ | 182,247 | |
Other building improvements | | $ | 1,556,346 | |
Square feet in asset base | | 13,962,954 | |
Per square foot: | | | |
Major capital expenditures | | $ | 0.01 | |
Other building improvements | | $ | 0.11 | |
Tenant improvements and leasing costs: | | | |
Re-tenanted space (2) | | | |
Tenant improvements and leasing costs | | $ | 2,576,059 | |
Re-tenanted square feet | | 268,083 | |
Per square foot | | $ | 9.61 | |
Renewal space | | | |
Tenant improvements and leasing costs | | $ | 3,434,682 | |
Renewal square feet | | 892,966 | |
Per square foot | | $ | 3.85 | |
(1) Major capital expenditures typically consist of significant improvements such as roof and HVAC systems replacements. Other building improvements exclude major capital expenditures.
(2) Excludes space that has undergone redevelopment before re-tenanting.
| ALEXANDRIA REAL ESTATE EQUITIES, INC.
ALL RIGHTS RESERVED © 2012 | 27 |
ALEXANDRIA REAL ESTATE EQUITIES, INC.
Summary of Real Estate Investment in Asia
September 30, 2012
(Tabular dollar amounts in thousands, except per square foot amounts)
(Unaudited)
Property listing
| | | | | | | | | | | | | | Occupancy Percentage | |
| | Rentable Square Feet | | Number of | | Annualized | | | | Operating and | |
Country | | Operating | | Development | | Redevelopment | | Total | | Properties | | Base Rent | | Operating | | Redevelopment | |
China | | | | | | | | | | | | | | | | | |
China | | 299,484 | | - | | - | | 299,484 | | 1 | | $ | 442 | (1) | 46.7 | % | | 46.7 | % | |
China | | - | | 309,476 | | - | | 309,476 | | 1 | | - | | N/A | | | N/A | | |
Total China | | 299,484 | | 309,476 | | - | | 608,960 | | 2 | | $ | 442 | | 46.7 | % | | 46.7 | % | |
| | | | | | | | | | | | | | | | | | | |
India | | | | | | | | | | | | | | | | | | | |
India | | 33,698 | | - | | - | | 33,698 | | 1 | | $ | 328 | | 69.4 | % | | 69.4 | % | |
India | | 143,260 | | - | | - | | 143,260 | | 1 | | 2,554 | | 86.5 | | | 86.5 | | |
India | | - | | 134,500 | | - | | 134,500 | | 1 | | - | | N/A | | | N/A | | |
India | | - | | 175,000 | | - | | 175,000 | | 1 | | - | | N/A | | | N/A | | |
India | | 29,546 | | - | | 67,401 | | 96,947 | | 1 | | 332 | | 100.0 | | | 30.5 | | |
India | | - | | - | | 44,660 | | 44,660 | | 1 | | - | | N/A | | | - | | |
India | | 86,200 | | - | | - | | 86,200 | | 1 | | 932 | | 100.0 | | | 100.0 | | |
Total India | | 292,704 | | 309,500 | | 112,061 | | 714,265 | | 7 | | $ | 4,146 | | 89.9 | % | | 65.0 | % | |
Total Asia | | 592,188 | | 618,976 | | 112,061 | | 1,323,225 | | 9 | | $ | 4,588 | | 68.1 | % | | 57.2 | % | |
(1) Represents annualized base rent for non-laboratory use.
Summary of investments in real estate
| | September 30, 2012 | |
| | Book Value | | Square Feet | | Cost per
Square Foot | |
Rental properties, net, in China | | $ | 21,435 | | 299,484 | | $ | 72 | |
Rental properties, net, in India | | 31,191 | | 292,704 | | 107 | |
| | | | | | | |
CIP/current value-added projects: | | | | | | | |
Active development in China | | 56,098 | | 309,476 | | 181 | |
Active development in India | | 26,337 | | 309,500 | | 85 | |
Active redevelopment projects in India | | 12,866 | | 112,061 | | 115 | |
| | 95,301 | | 731,037 | | 130 | |
| | | | | | | |
Land held for future development/land undergoing preconstruction activities (additional CIP) - India | | 78,511 | | 6,789,000 | | 12 | |
Total investments in real estate, net, in Asia | | $ | 226,438 | | 8,112,225 | | $ | 28 | |
Active development and redevelopment
| | Project RSF | | Leased Status RSF | | Investment | |
| | In | | | | | | | | | | | | | | Leased/ | | September 30, 2012 | | To Complete | | Total at | |
Description | | Service | | CIP | | Total | | Leased | | Negotiating | | Marketing | | Total | | Negotiating % | | In Service | | CIP | | 2012 | | Thereafter | | Completion | |
China development project | | - | | 309,476 | | 309,476 | | - | | - | | 309,476 | | 309,476 | | -% | | $ | - | | $ | 56,098 | | $ | 1,767 | | $ | 24,435 | | $ | 82,300 | |
India development projects | | - | | 309,500 | | 309,500 | | - | | - | | 309,500 | | 309,500 | | -% | | - | | 26,337 | | 7,939 | | 17,509 | | 51,785 | |
India redevelopment projects | | 29,546 | | 112,061 | | 141,607 | | 29,546 | | 44,660 | | 67,401 | | 141,607 | | 52% | | 3,729 | | 12,866 | | 4,774 | | 1,340 | | 22,709 | |
Total active development and redevelopment in Asia | | 29,546 | | 731,037 | | 760,583 | | | | | | | | | | | | $ | 3,729 | | $ | 95,301 | | $ | 14,480 | | $ | 43,284 | | $ | 156,794 | |
| ALEXANDRIA REAL ESTATE EQUITIES, INC.
ALL RIGHTS RESERVED © 2012 | 28 |

ALEXANDRIA REAL ESTATE EQUITIES, INC.
Credit Metrics
September 30, 2012
(Unaudited)
Net Debt/Adjusted EBITDA | | Fixed Charge Coverage Ratio |
| | |
| | |
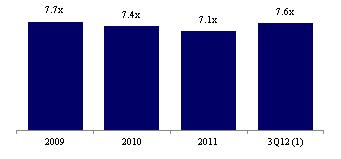
| | 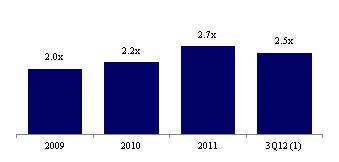
|
| | |
Net Debt to Gross Assets (Excluding Cash and Restricted Cash) | | Interest Coverage Ratio |
| | |
| | |
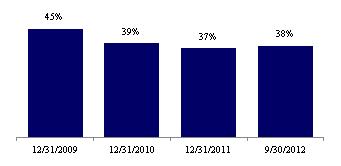
| | 
|
| | |
Unencumbered NOI as a % of Total NOI | | Unencumbered Assets Gross Book Value as a % of Gross Assets |
| | |
| | |
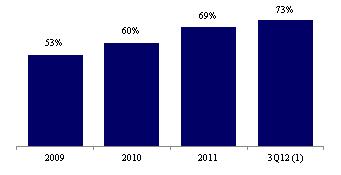
| | 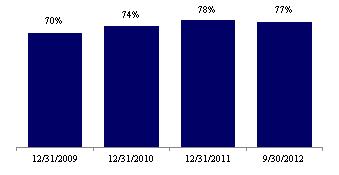
|
| | |
Liquidity | | Unhedged Variable Rate Debt as a % of Total Debt |
| | |

| | 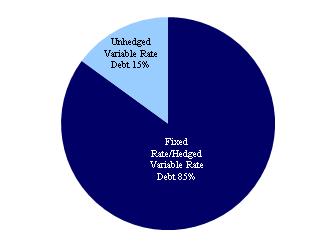
|
(1) Periods represent quarter annualized metrics.

| ALEXANDRIA REAL ESTATE EQUITIES, INC.
ALL RIGHTS RESERVED © 2012 | 29 |
ALEXANDRIA REAL ESTATE EQUITIES, INC.
Summary of Debt
September 30, 2012
(Tabular dollar amounts in thousands)
(Unaudited)
Fixed rate/hedged and unhedged variable rate debt
| | Fixed Rate/Hedged
Variable Rate | | Unhedged
Variable Rate | | Total
Consolidated | | Percentage of
Total | | Weighted Average
Interest Rate at
End of Period (1) | | Weighted Average
Remaining Term
(Years) | |
Secured notes payable (2) | | $ | 640,815 | | $ | 78,535 | | $ | 719,350 | | 23.7 | % | | 5.76 | % | | 3.2 | |
Unsecured senior notes payable (2) | | 549,794 | | - | | 549,794 | | 18.1 | | | 4.61 | | | 9.5 | |
Unsecured senior line of credit (3) | | 50,000 | | 363,000 | | 413,000 | | 13.6 | | | 1.46 | | | 4.6 | |
2016 Unsecured Senior Bank Term Loan (4) | | 750,000 | | - | | 750,000 | | 24.8 | | | 3.12 | | | 3.8 | |
2017 Unsecured Senior Bank Term Loan (5) | | 600,000 | | - | | 600,000 | | 19.8 | | | 3.84 | | | 4.3 | |
Total debt | | $ | 2,590,609 | | $ | 441,535 | | $ | 3,032,144 | | 100.0 | % | | 3.93 | % | | 4.9 | |
Percentage of total debt | | 85% | | 15% | | 100% | | | | | | | | | |
(1) Represents the contractual interest rate as of the end of the period plus the impact of debt premiums/discounts and our interest rate hedge agreements. The weighted average interest rate excludes bank fees and amortization of loan fees.
(2) Represents amounts net of unamortized premiums/discounts.
(3) Total commitments available for borrowing aggregate $1.5 billion under our unsecured senior line of credit. As of September 30, 2012, we had approximately $1.1 billion available for borrowings under our unsecured senior line of credit. Weighted average remaining term assumes we exercise our sole option to extend the stated maturity date of April 30, 2016, by six months, twice, to April 30, 2017.
(4) Assumes we exercise our sole option to extend the stated maturity date of June 30, 2015, by one year, to June 30, 2016.
(5) Assumes we exercise our sole option to extend the stated maturity date of January 31, 2016, by one year, to January 31, 2017.
Debt maturities
Debt | | Stated Rate | | Effective
Interest
Rate (1) | | Maturity
Date | | | 2012 | | 2013 | | 2014 | | 2015 | | 2016 | | Thereafter | | Total | |
Secured notes payable | | | | | | | | | | | | | | | | | | | | | | | |
San Diego | | 6.21 | % | | 6.21 | % | | 3/1/13 | | | $ | 78 | | $ | 7,934 | | $ | - | | $ | - | | $ | - | | $ | - | | $ | 8,012 | |
Suburban Washington, D.C. | | 6.36 | | | 6.36 | | | 9/1/13 | | | 135 | | 26,093 | | - | | - | | - | | - | | 26,228 | |
San Francisco Bay | | 6.14 | | | 6.14 | | | 11/16/13 | | | - | | 7,527 | | - | | - | | - | | - | | 7,527 | |
Greater Boston | | 5.26 | | | 5.59 | | | 4/1/14 | | | 929 | | 3,839 | | 208,683 | | - | | - | | - | | 213,451 | |
Suburban Washington, D.C. | | 2.33 | | | 2.33 | | | 4/20/14 | | | - | | - | | 76,000 | | - | | - | | - | | 76,000 | |
San Diego | | 6.05 | | | 4.88 | | | 7/1/14 | | | 22 | | 142 | | 6,458 | | - | | - | | - | | 6,622 | |
San Diego | | 5.39 | | | 4.00 | | | 11/1/14 | | | 29 | | 177 | | 7,495 | | - | | - | | - | | 7,701 | |
Seattle | | 6.00 | (2) | | 6.00 | | | 11/18/14 | | | 60 | | 240 | | 240 | | - | | - | | - | | 540 | |
Suburban Washington, D.C. | | 5.64 | | | 4.50 | | | 6/1/15 | | | 21 | | 130 | | 138 | | 5,788 | | - | | - | | 6,077 | |
San Francisco Bay | | LIBOR+1.50 | | 1.74 | | | 7/1/15 | (3) | | - | | - | | - | | 1,995 | | - | | - | | 1,995 | |
Greater Boston, San Francisco Bay, and San Diego | | 5.73 | | | 5.73 | | | 1/1/16 | | | 393 | | 1,616 | | 1,713 | | 1,816 | | 75,501 | | - | | 81,039 | |
Greater Boston, San Diego, and Greater NYC | | 5.82 | | | 5.82 | | | 4/1/16 | | | 208 | | 878 | | 931 | | 988 | | 29,389 | | - | | 32,394 | |
San Francisco Bay | | 6.35 | | | 6.35 | | | 8/1/16 | | | 542 | | 2,332 | | 2,487 | | 2,652 | | 126,715 | | - | | 134,728 | |
San Diego, Suburban Washington, D.C., and Seattle | | 7.75 | | | 7.75 | | | 4/1/20 | | | 320 | | 1,345 | | 1,453 | | 1,570 | | 1,696 | | 110,301 | | 116,685 | |
San Francisco Bay | | 6.50 | | | 6.50 | | | 6/1/37 | | | 4 | | 16 | | 17 | | 17 | | 19 | | 801 | | 874 | |
Average/Total | | 5.70 | % | | 5.76 | | | | | | 2,741 | | 52,269 | | 305,615 | | 14,826 | | 233,320 | | 111,102 | | 719,873 | |
| | | | | | | | | | | | | | | | | | | | | | | | |
$1.5 Billion unsecured senior line of credit | | LIBOR+1.20% (4) | | 1.46 | | | 4/30/17 | (5) | | - | | - | | - | | - | | - | | 413,000 | | 413,000 | |
| | | | | | | | | | | | | | | | | | | | | | | | |
2016 Unsecured Senior Bank Term Loan | | LIBOR+1.75% | | 3.12 | | | 6/30/16 | (6) | | - | | - | | - | | - | | 750,000 | | - | | 750,000 | |
2017 Unsecured Senior Bank Term Loan | | LIBOR+1.50% | | 3.84 | | | 1/31/17 | (7) | | - | | - | | - | | - | | - | | 600,000 | | 600,000 | |
| | | | | | | | | | | | | | | | | | | | | | | | |
Unsecured senior notes payable (8) | | 4.60 | % | | 4.61 | | | 4/1/22 | | | - | | - | | 250 | | - | | - | | 550,000 | | 550,250 | |
Average/Subtotal | | | | | 3.93 | | | | | | 2,741 | | 52,269 | | 305,865 | | 14,826 | | 983,320 | | 1,674,102 | | 3,033,123 | |
Unamortized discounts | | | | | - | | | | | | (112 | ) | (464 | ) | (78 | ) | (12 | ) | (44 | ) | (269 | ) | (979 | ) |
Average/Total | | | | | 3.93 | % | | | | | $ | 2,629 | | $ | 51,805 | | $ | 305,787 | | $ | 14,814 | | $ | 983,276 | | $ | 1,673,833 | | $ | 3,032,144 | |
| | | | | | | | | | | | | | | | | | | | | | | | |
Balloon payments | | | | | | | | | | | $ | - | | $ | 41,165 | | $ | 297,330 | | $ | 7,723 | | $ | 980,029 | | $ | 1,666,791 | | $ | 2,993,038 | |
Principal amortization | | | | | | | | | | | 2,629 | | 10,640 | | 8,457 | | 7,091 | | 3,247 | | 7,042 | | 39,106 | |
Total consolidated debt | | | | | | | | | | | $ | 2,629 | | $ | 51,805 | | $ | 305,787 | | $ | 14,814 | | $ | 983,276 | | $ | 1,673,833 | | $ | 3,032,144 | |
| | | | | | | | | | | | | | | | | | | | | | | | |
Fixed rate/hedged variable rate debt | | | | | | | | | | | $ | 2,569 | | $ | 51,565 | | $ | 229,547 | | $ | 12,819 | | $ | 983,276 | | $ | 1,310,833 | | $ | 2,590,609 | |
Unhedged variable rate debt | | | | | | | | | | | 60 | | 240 | | 76,240 | | 1,995 | | - | | 363,000 | | 441,535 | |
Total consolidated debt | | | | | | | | | | | $ | 2,629 | | $ | 51,805 | | $ | 305,787 | | $ | 14,814 | | $ | 983,276 | | $ | 1,673,833 | | $ | 3,032,144 | |
(1) Represents the contractual interest rate as of the end of the period plus the impact of debt premiums/discounts and our interest rate hedge agreements. The weighted average interest rate excludes bank fees and amortization of loan fees.
(2) Represents a loan assumed with the acquisition of a property. The interest rate is based upon 10 year U.S. treasury bills plus 3%, with a floor of 6% and a ceiling of 8.5%.
(3) We have an option to extend the stated maturity date of July 1, 2015, by one year, twice, to July 1, 2017.
(4) In addition to the stated rate, we are subject to an annual facility fee of 0.25%.
(5) Assumes we exercise our sole option to extend the stated maturity date of April 30, 2016, by six months, twice, to April 30, 2017.
(6) Assumes we exercise our sole option to extend the stated maturity date of June 30, 2015, by one year, to June 30, 2016.
(7) Assumes we exercise our sole option to extend the stated maturity date of January 31, 2016, by one year, to January 31, 2017.
(8) Includes $550 million of our 4.60% unsecured senior notes payable due in April 2022, and $250,000 of our 8.00% unsecured senior convertible notes payable with a maturity date of April 15, 2014.
| ALEXANDRIA REAL ESTATE EQUITIES, INC.
ALL RIGHTS RESERVED © 2012 | 30 |
ALEXANDRIA REAL ESTATE EQUITIES, INC.
Summary of Debt
September 30, 2012
(Tabular dollar amounts in thousands)
(Unaudited)
Debt covenants
| | Unsecured Senior Notes Payable | | Unsecured Senior Line of Credit and
Unsecured Senior Bank Term Loans | |
Debt Covenant Ratios | | Requirement | | Actual (1) | | Requirement | | Actual (1) | |
Total Debt to Total Assets (2) | | < 60% | | 39% | | < 60.0% (3) | | 36% | |
| | | | | | | | | |
Consolidated EBITDA to Interest Expense (4) | | > 1.5x | | 5.9x | | > 1.50x | | 2.5x | |
| | | | | | | | | |
Unencumbered Total Asset Value to Unsecured Debt | | > 150% | | 259% | | N/A | | N/A | |
| | | | | | | | | |
Secured Debt to Total Assets (5) | | < 40% | | 9% | | < 40.0% (3) | | 8% | |
| | | | | | | | | |
Unsecured Leverage Ratio | | N/A | | N/A | | < 60.0% (3) | | 40% | |
| | | | | | | | | |
Unsecured Interest Coverage Ratio | | N/A | | N/A | | > 1.75x | | 7.8x | |
(1) Actual covenants are calculated pursuant to the specific terms of each agreement.
(2) Under the unsecured senior line of credit and unsecured senior bank term loans, this ratio is referred to as the Leverage Ratio.
(3) These ratios may increase by an additional 5% in connection with a Material Acquisition, as defined, for up to four quarters.
(4) Under the unsecured senior line of credit and unsecured senior bank term loans, this ratio is referred to as the Fixed Charge Coverage Ratio.
(5) Under the unsecured senior line of credit and unsecured senior bank term loans, this ratio is referred to as the Secured Debt Ratio.
Summary of interest rate hedge agreements
| | | | | | | | | | Notional Amount in Effect as of | |
Transaction Date | | Effective Date | | Termination Date | | Interest Pay
Rate (1) | | Fair Value as of
September 30, 2012 | | September 30,
2012 | | December 31,
2012 | | December 31,
2013 | | December 31,
2014 | |
December 2006 | | December 29, 2006 | | March 31, 2014 | | 4.990 % | | $ | (3,614 | ) | $ | 50,000 | | $ | 50,000 | | $ | 50,000 | | $ | - | |
October 2007 | | October 31, 2007 | | September 30, 2013 | | 4.642 % | | (2,251 | ) | 50,000 | | 50,000 | | - | | - | |
October 2007 | | July 1, 2008 | | March 31, 2013 | | 4.622 % | | (555 | ) | 25,000 | | 25,000 | | - | | - | |
October 2007 | | July 1, 2008 | | March 31, 2013 | | 4.625 % | | (555 | ) | 25,000 | | 25,000 | | - | | - | |
December 2006 | | November 30, 2009 | | March 31, 2014 | | 5.015 % | | (5,449 | ) | 75,000 | | 75,000 | | 75,000 | | - | |
December 2006 | | November 30, 2009 | | March 31, 2014 | | 5.023 % | | (5,458 | ) | 75,000 | | 75,000 | | 75,000 | | - | |
December 2006 | | December 31, 2010 | | October 31, 2012 | | 5.015 % | | (440 | ) | 100,000 | | - | | - | | - | |
December 2011 | | December 30, 2011 | | December 31, 2012 | | 0.480 % | | (180 | ) | 250,000 | | 250,000 | | - | | - | |
December 2011 | | December 30, 2011 | | December 31, 2012 | | 0.480 % | | (180 | ) | 250,000 | | 250,000 | | - | | - | |
December 2011 | | December 30, 2011 | | December 31, 2012 | | 0.480 % | | (90 | ) | 125,000 | | 125,000 | | - | | - | |
December 2011 | | December 30, 2011 | | December 31, 2012 | | 0.480 % | | (90 | ) | 125,000 | | 125,000 | | - | | - | |
December 2011 | | December 30, 2011 | | December 31, 2012 | | 0.495 % | | (95 | ) | 125,000 | | 125,000 | | - | | - | |
December 2011 | | December 30, 2011 | | December 31, 2012 | | 0.508 % | | (99 | ) | 125,000 | | 125,000 | | - | | - | |
December 2011 | | December 31, 2012 | | December 31, 2013 | | 0.640 % | | (1,041 | ) | – | | - | | 250,000 | | - | |
December 2011 | | December 31, 2012 | | December 31, 2013 | | 0.640 % | | (1,041 | ) | - | | - | | 250,000 | | - | |
December 2011 | | December 31, 2012 | | December 31, 2013 | | 0.644 % | | (526 | ) | - | | - | | 125,000 | | - | |
December 2011 | | December 31, 2012 | | December 31, 2013 | | 0.644 % | | (526 | ) | - | | - | | 125,000 | | - | |
December 2011 | | December 31, 2013 | | December 31, 2014 | | 0.977 % | | (1,574 | ) | - | | - | | - | | 250,000 | |
December 2011 | | December 31, 2013 | | December 31, 2014 | | 0.976 % | | (1,572 | ) | - | | - | | - | | 250,000 | |
Total | | | | | | | | $ | (25,336 | ) | $ | 1,400,000 | | $ | 1,300,000 | | $ | 950,000 | | $ | 500,000 | |
(1) In addition to the interest pay rate, borrowings outstanding under our unsecured senior line of credit and unsecured senior bank term loans include an applicable margin currently ranging from 1.20% to 1.75%.
| ALEXANDRIA REAL ESTATE EQUITIES, INC.
ALL RIGHTS RESERVED © 2012 | 31 |

ALEXANDRIA REAL ESTATE EQUITIES, INC.
Definitions and Other Information
September 30, 2012
(Tabular dollar amounts in thousands)
(Unaudited)
This section contains additional information for sections throughout this supplemental information package as well as explanations of certain non-GAAP financial measures and the reasons why we use these supplemental measures of performance. Additional detail can be found in our most recent annual report on Form 10-K and subsequent quarterly reports on Form 10-Q, as well as other documents filed with or furnished to the SEC from time to time.
Adjusted EBITDA and Adjusted EBITDA margins
EBITDA represents earnings before interest, taxes, depreciation, and amortization (“EBITDA”), a non-GAAP financial measure, and is used by us and others as a supplemental measure of performance. We use adjusted EBITDA (“Adjusted EBITDA”) to assess the performance of our core operations, for financial and operational decision making, and as a supplemental or additional means of evaluating period-to-period comparisons on a consistent basis. Adjusted EBITDA also serves as a proxy for a component of a financial covenant under certain of our debt obligations. Adjusted EBITDA is calculated as EBITDA excluding net stock compensation expense, gains or losses on early extinguishment of debt, gains or losses on sales of land parcels, gains or losses on sales of real estate, and impairments of real estate. We believe Adjusted EBITDA provides investors relevant and useful information because it permits investors to view income from our operations on an unleveraged basis before the effects of taxes, non-cash depreciation and amortization, net stock compensation expense, gains or losses on early extinguishment of debt, gains or losses on sales of land parcels, gains or losses on sales of real estate, and impairments of real estate. By excluding interest expense, EBITDA and Adjusted EBITDA allow investors to measure our performance independent of our capital structure and indebtedness and, therefore, allow for a more meaningful comparison of our performance to that of other companies, both in the real estate industry and in other industries. We believe that excluding non-cash charges related to stock-based compensation facilitates a comparison of our operations across periods and among other equity REITs without the variances caused by different valuation methodologies, the volatility of the expense (which depends on market forces outside our control), and the assumptions and the variety of award types that a company can use. We believe that adjusting for the effects of gains or losses on early extinguishment of debt, gains or losses on sales of land parcels, gains or losses on sales of real estate, and impairments of real estate provides useful information by excluding certain items that are not representative of our core operating results. These items are not related to core operations, not dependent upon historical costs, and not subject to judgmental valuation inputs and the timing of our decisions. EBITDA and Adjusted EBITDA have limitations as measures of our performance. EBITDA and Adjusted EBITDA do not reflect our historical cash expenditures or future cash requirements for capital expenditures or contractual commitments. While EBITDA and Adjusted EBITDA are relevant and widely used measures of performance, they do not represent net income or cash flow from operations as defined by GAAP, and they should not be considered as alternatives to those indicators in evaluating performance or liquidity. Further, our computation of EBITDA and Adjusted EBITDA may not be comparable to similar measures reported by other companies.
The following table reconciles net income, the most directly comparable financial measure calculated and presented in accordance with GAAP, to EBITDA and Adjusted EBITDA:
| | Three Months Ended | | Nine Months Ended | |
| | 9/30/12 | | 6/30/12 | | 3/31/12 | | 12/31/11 | | 9/30/11 | | 9/30/12 | | 9/30/11 | |
Net income | | $ | 18,305 | | $ | 25,641 | | $ | 32,775 | | $ | 35,462 | | $ | 32,995 | | $ | 76,721 | | $ | 99,931 | |
Interest expense – continuing operations | | 17,094 | | 17,922 | | 16,227 | | 14,757 | | 14,273 | | 51,243 | | 48,621 | |
Interest expense – discontinued operations | | – | | – | | – | | – | | – | | – | | 65 | |
Depreciation and amortization – continuing operations | | 47,176 | | 51,276 | | 42,326 | | 39,762 | | 38,747 | | 140,778 | | 113,326 | |
Depreciation and amortization – discontinued operations | | 997 | | 1,079 | | 1,079 | | 1,204 | | 1,243 | | 3,155 | | 3,734 | |
EBITDA | | 83,572 | | 95,918 | | 92,407 | | 91,185 | | 87,258 | | 271,897 | | 265,677 | |
Stock compensation expense | | 3,845 | | 3,274 | | 3,293 | | 3,306 | | 3,344 | | 10,412 | | 8,449 | |
Loss on early extinguishment of debt | | – | | 1,602 | | 623 | | – | | 2,742 | | 2,225 | | 6,485 | |
Gain on sale of land parcel | | – | | – | | (1,864 | ) | – | | (46 | ) | (1,864 | ) | (46 | ) |
Gain on sale of real estate | | (1,562 | ) | (2 | ) | – | | – | | – | | (1,564 | ) | – | |
Impairment of real estate | | 9,799 | | – | | – | | – | | 994 | | 9,799 | | 994 | |
Adjusted EBITDA | | $ | 95,654 | | $ | 100,792 | | $ | 94,459 | | $ | 94,491 | | $ | 94,292 | | $ | 290,905 | | $ | 281,559 | |
| | | | | | | | | | | | | | | |
Total revenues | | $ | 145,455 | | $ | 148,016 | | $ | 138,432 | | $ | 139,249 | | $ | 138,054 | | $ | 431,903 | | $ | 408,980 | |
Adjusted EBITDA margins | | 66% | | 68% | | 68% | | 68% | | 68% | | 67% | | 69% | |
Adjusted funds from operations
AFFO is a non-GAAP financial measure that we use as a supplemental measure of our performance. We compute AFFO by adding to or deducting from FFO, as adjusted: (1) non-incremental revenue-enhancing capital expenditures, tenant improvements, and leasing commissions (excludes redevelopment expenditures); (2) effects of straight-line rent and straight-line rent on ground leases; (3) capitalized income from development projects; (4) amortization of acquired above and below market leases, loan fees, and debt premiums/discounts; (5) non-cash compensation expense; and (6) allocation of AFFO attributable to unvested restricted stock awards.
We believe that AFFO is a useful supplemental performance measure because it further adjusts to: (1) deduct certain expenditures that, although capitalized and included in depreciation expense, do not enhance the revenue or cash flows of our properties; (2) eliminate the effect of straight-lining our rental income and capitalizing income from development projects in order to reflect the actual amount of contractual rents due in the period presented; and (3) eliminate the effect of non-cash items that are not indicative of our core operations and do not actually reduce the amount of cash generated by our operations. We believe that eliminating the effect of non-cash charges related to stock-based compensation facilitates a comparison of our operations across periods and among other equity REITs without the variances caused by different valuation methodologies, the volatility of the expense (which depends on market forces outside our control), and the assumptions and the variety of award types that a company can use. We believe that AFFO provides useful information by excluding certain items that are not representative of our core operating results because such items are dependent upon historical costs or subject to judgmental valuation inputs and the timing of our decisions.
AFFO is not intended to represent cash flow for the period, and is only intended to provide an additional measure of performance. We believe that net income attributable to Alexandria Real Estate Equities, Inc.’s common stockholders is the most directly comparable GAAP financial measure to AFFO. We believe that AFFO is a widely recognized measure of the operations of equity REITs, and presenting AFFO will enable investors to assess our performance in comparison to other equity REITs. However, other equity REITs may use different methodologies for calculating AFFO and, accordingly, our AFFO may not be comparable to AFFO calculated by other equity REITs. AFFO should not be considered as an alternative to net income (determined in accordance with GAAP) as an indication of financial performance, or to cash flows from operating activities (determined in accordance with GAAP) as a measure of our liquidity, nor is it indicative of funds available to fund our cash needs, including our ability to make distributions.

| ALEXANDRIA REAL ESTATE EQUITIES, INC.
ALL RIGHTS RESERVED © 2012 | 32 |
ALEXANDRIA REAL ESTATE EQUITIES, INC.
Definitions and Other Information
September 30, 2012
(Unaudited)
Annualized base rent
Annualized base rent means the annualized fixed base rental amount in effect as of the end of the period, related to our operating rentable square feet (using rental revenue computed on a straight-line basis in accordance with GAAP).
Capitalized interest
A key component of our business model is our value-added development and redevelopment programs. These programs are focused on providing high-quality generic life science laboratory space to meet the real estate requirements of and are reusable by various life science industry client tenants. Upon completion, each value-added project is expected to generate significant revenues and cash flows. Our development and redevelopment projects are generally in locations that are highly desirable to life science entities which we believe results in higher occupancy levels, longer lease terms, and higher rental income and returns. Development projects consist of the ground-up development of generic life science laboratory facilities. Redevelopment projects consist of the permanent change in use of office, warehouse, and shell space into generic life science laboratory space, including the conversion of single-tenancy space to multi-tenancy space or vice versa. We also have certain significant value-added projects undergoing important and substantial preconstruction activities to bring these assets to their intended use. These critical activities add significant value and are required for the construction of buildings. The projects will provide high-quality facilities for the life science industry and are expected to generate significant revenue and cash flows for the Company. In accordance with GAAP, we capitalize project costs clearly related to the construction, development, and redevelopment as a cost of the project. Indirect project costs such as construction administration, legal fees, and office costs that clearly relate to projects under construction, development, and redevelopment are also capitalized as a cost of the project. We capitalize project costs only during periods in which activities necessary to prepare an asset for its intended use are in progress. We also capitalize interest cost as a cost of the project only during the period for which activities necessary to prepare an asset for its intended use are ongoing, provided that expenditures for the asset have been made and interest cost is incurred. Additionally, should activities necessary to prepare an asset for its intended use cease, interest, taxes, insurance, and certain other direct project costs related to these assets would be expensed as incurred.
Cash interest
Cash interest is equal to interest expense calculated in accordance with GAAP, plus capitalized interest, less amortization of loan fees, and amortization of debt premiums/discounts.
Construction in progress/current value-added projects
Active development/active redevelopment projects
A key component of our business model is our value-added development and redevelopment programs. These programs are focused on providing high-quality, generic, and reusable life science laboratory space to meet the real estate requirements of a wide range of clients in the life science industry. Upon completion, each value-added project is expected to generate significant revenues and cash flows. Our development and redevelopment projects are generally in locations that are highly desirable to life science entities, which we believe results in higher occupancy levels, longer lease terms, and higher rental income and returns. Development projects consist of the ground-up development of generic and reusable life science laboratory facilities. We generally will not commence new development projects for aboveground vertical construction of new life science laboratory space without first securing pre-leasing for such space except when there is significant market demand for high-quality laboratory facilities. Redevelopment projects consist of the permanent change in use of office, warehouse, and shell space into generic life science laboratory space, including the conversion of single-tenancy space to multi-tenancy space or vice versa.
Generic infrastructure/building improvement projects
Generic infrastructure/building improvement projects include revenue-enhancing capital spending, non-incremental revenue-enhancing capital expenditures, and tenant improvements.
Dividend payout ratio
Dividend payout ratio (common stock) is the ratio of the absolute dollar amount of dividends on our common stock (shares of common stock outstanding on the respective record date multiplied by the related dividend per share) to FFO attributable to Alexandria Real Estate Equities, Inc.’s common stockholders on a diluted basis, as adjusted.
Dividend yield
Dividend yield for the quarter represents the annualized quarter dividend divided by the closing common stock price at the end of the quarter.
| ALEXANDRIA REAL ESTATE EQUITIES, INC.
ALL RIGHTS RESERVED © 2012 | 33 |
ALEXANDRIA REAL ESTATE EQUITIES, INC.
Definitions and Other Information
September 30, 2012
(Tabular dollar amounts in thousands)
(Unaudited)
EBITDA
See Adjusted EBITDA and Adjusted EBITDA margins
Fixed charge coverage ratio
The fixed charge coverage ratio is useful to investors as a supplemental measure of our ability to satisfy fixed financing obligations and dividends on preferred stock. The following table presents a reconciliation of interest expense, the most directly comparable GAAP financial measure to cash interest and fixed charges:
| | Three Months Ended | |
| | 9/30/12 | | 6/30/12 | | 3/31/12 | | 12/31/11 | | 9/30/11 | |
Adjusted EBITDA | | $ | 95,654 | | $ | 100,792 | | $ | 94,459 | | $ | 94,491 | | $ | 94,292 | |
| | | | | | | | | | | |
Interest expense – continuing operations | | $ | 17,094 | | $ | 17,922 | | $ | 16,227 | | $ | 14,757 | | $ | 14,273 | |
Interest expense – discontinued operations | | – | | – | | – | | – | | – | |
Add: capitalized interest | | 16,763 | | 15,825 | | 15,266 | | 16,151 | | 16,666 | |
Less: amortized loan fees | | (2,470 | ) | (2,214 | ) | (2,643 | ) | (2,551 | ) | (2,144 | ) |
Less: amortization of debt premium/discounts | | (112 | ) | (110 | ) | (179 | ) | (565 | ) | (750 | ) |
Cash interest | | 31,275 | | 31,423 | | 28,671 | | 27,792 | | 28,045 | |
Dividends on preferred stock | | 6,471 | | 6,903 | | 7,483 | | 7,090 | | 7,089 | |
Fixed charges | | $ | 37,746 | | $ | 38,326 | | $ | 36,154 | | $ | 34,882 | | $ | 35,134 | |
| | | | | | | | | | | |
Fixed charge coverage ratio – quarter annualized | | 2.5x | | 2.6x | | 2.6x | | 2.7x | | 2.7x | |
Fixed charge coverage ratio – trailing 12 months | | 2.6x | | 2.7x | | 2.7x | | 2.7x | | 2.7x | |
Funds from operations and funds from operations, as adjusted
GAAP basis accounting for real estate assets utilizes historical cost accounting and assumes real estate values diminish over time. In an effort to overcome the difference between real estate values and historical cost accounting for real estate assets, the Board of Governors of the National Association of Real Estate Investment Trusts (“NAREIT”) established the measurement tool of FFO. Since its introduction, FFO has become a widely used non-GAAP financial measure among equity REITs. We believe that FFO is helpful to investors as an additional measure of the performance of an equity REIT. Moreover, we believe that FFO, as adjusted, is also helpful because it allows investors to compare our performance to the performance of other real estate companies between periods, and on a consistent basis, without having to account for differences caused by investment decisions, financing decisions, terms of securities, capital structures, and capital market transactions. We compute FFO in accordance with standards established by the Board of Governors of NAREIT in its April 2002 white paper and related implementation guidance (“NAREIT White Paper”). The NAREIT White Paper defines FFO as net income (computed in accordance with GAAP), excluding gains (losses) from sales and impairments of real estate, plus real estate related depreciation and amortization, and after adjustments for unconsolidated partnerships and joint ventures. Impairments of real estate relate to decreases in the estimated fair value of real estate due to changes in general market conditions and do not necessarily reflect the operating performance of the properties during the corresponding period. Impairments of real estate represent the non-cash write-down of assets when fair value over the recoverability period is less than the carrying value. We compute FFO, as adjusted, as FFO calculated in accordance with the NAREIT White Paper, plus losses from early extinguishment of debt and preferred stock redemption charges, less realized gain on equity investment primarily related to one non-tenant life science entity, and the amount of such items which are allocable to our unvested restricted stock awards. Our calculations of both FFO and FFO, as adjusted, may differ from those methodologies utilized by other equity REITs for similar performance measurements, and, accordingly, may not be comparable to other equity REITs. Neither FFO nor FFO, as adjusted, should be considered as an alternative to net income (determined in accordance with GAAP) as an indication of financial performance, or to cash flows from operating activities (determined in accordance with GAAP) as a measure of liquidity, nor are they indicative of the availability of funds for our cash needs, including funds available to make distributions.
Future value-added projects
Land held for future development
All preconstruction efforts have been advanced to appropriate stages and no further preconstruction activities are ongoing and therefore, interest, property taxes, and other costs related to these assets are expensed as incurred. We generally will not commence new development projects for aboveground vertical construction of new life science laboratory space without first securing pre-leasing for such space.
Land undergoing preconstruction activities (additional CIP)
Preconstruction activities include Building Information Modeling (3-D virtual modeling), design development and construction drawings, sustainability and energy optimization review, budgeting, planning for future site and infrastructure work, and other activities prior to commencement of vertical construction of aboveground shell and core improvements. Our objective with preconstruction is to reduce the time it takes to deliver projects to prospective client tenants. Project costs are capitalized as a cost of the project during periods when activities necessary to prepare an asset for its intended use are in progress. We generally will not commence ground-up development of any parcels undergoing preconstruction activities without first securing pre-leasing for such space. If vertical aboveground construction is not initiated at completion of preconstruction activities, the land parcel will be classified as land held for future development. The two largest projects included in land undergoing preconstruction consist of our 1.6 million developable square feet at Alexandria Center™ at Kendall Square in East Cambridge, Massachusetts, and our 419,806 developable square feet site for the West Tower at Alexandria Center™ for Life Science – New York City.
Future redevelopment
Our asset base also includes non-laboratory space (office, warehouse, and industrial space), classified as rental properties, representing square feet for future conversion into life science laboratory space through redevelopment. These spaces are currently classified in investments in real estate, net, in the condensed consolidated balance sheets.
| ALEXANDRIA REAL ESTATE EQUITIES, INC.
ALL RIGHTS RESERVED © 2012 | 34 |
ALEXANDRIA REAL ESTATE EQUITIES, INC.
Definitions and Other Information
September 30, 2012
(Tabular dollar amounts in thousands)
(Unaudited)
Gross assets (excluding cash and restricted cash)
Gross assets (excluding cash and restricted cash) are equal to total assets plus accumulated depreciation, less cash, cash equivalents, and restricted cash.
Initial stabilized yield - cash
Initial Stabilized Yield is calculated as the quotient of net operating income and our investment in the property at stabilization. Our Initial Stabilized Yield on a cash basis reflects cash rents upon stabilization and does not reflect contractual rent escalations beyond the stabilization date. We expect, on average, our contractual cash rents related to our value-added projects to increase over time. Our Initial Stabilized Yield excludes the impact of leverage.
Interest coverage ratio
Interest coverage ratio is the ratio of Adjusted EBITDA to cash interest. This ratio is useful to investors as an indicator of our ability to service our cash interest obligations. See fixed charge coverage ratio for calculation of cash interest. The following table summarizes the calculation of the interest coverage ratio:
| | Three Months Ended | |
| | 9/30/12 | | 6/30/12 | | 3/31/12 | | 12/31/11 | | 9/30/11 | |
Adjusted EBITDA | | $ | 95,654 | | $ | 100,792 | | $ | 94,459 | | $ | 94,491 | | $ | 94,292 | |
Cash interest | | $ | 31,275 | | $ | 31,423 | | $ | 28,671 | | $ | 27,792 | | $ | 28,045 | |
| | | | | | | | | | | |
Interest coverage ratio – quarter annualized | | 3.1x | | 3.2x | | 3.3x | | 3.4x | | 3.4x | |
Interest coverage ratio – trailing 12 months | | 3.2x | | 3.3x | | 3.4x | | 3.4x | | 3.3x | |
Net debt
Net debt is equal to the sum of total debt less cash, cash equivalents, and restricted cash.
Net operating income
Net operating income is a non-GAAP financial measure equal to income from continuing operations, the most directly comparable GAAP financial measure, plus loss on early extinguishment of debt, depreciation and amortization, interest expense, and general and administrative expense. We believe net operating income provides useful information to investors regarding our financial condition and results of operations because it reflects primarily those income and expense items that are incurred at the property level. Therefore, we believe net operating income is a useful measure for evaluating the operating performance of our real estate assets. Net operating income on a cash basis is net operating income on a GAAP basis, adjusted to exclude the effect of straight-line rent adjustments required by GAAP. We believe that net operating income on a cash basis is helpful to investors as an additional measure of operating performance because it eliminates straight-line rent adjustments to rental revenue.
Further, we believe net operating income is useful to investors as a performance measure, because when compared across periods, net operating income reflects the impact on operations from trends in occupancy rates, rental rates, and operating costs, providing perspective not immediately apparent from income from continuing operations. Net operating income excludes certain components from income from continuing operations in order to provide results that are more closely related to the results of operations of our properties. For example, interest expense is not necessarily linked to the operating performance of a real estate asset and is often incurred at the corporate level rather than at the property level. In addition, depreciation and amortization, because of historical cost accounting and useful life estimates, may distort operating performance at the property level. Property operating expenses that are included in determining net operating income consist of costs that are related to our operating properties, such as utilities, repairs and maintenance, rental expense related to ground leases, contracted services, such as janitorial, engineering, and landscaping, property taxes and insurance, and property level salaries. General and administrative expenses consist primarily of accounting and corporate compensation, corporate insurance, professional fees, office rent, and office supplies, that are incurred as part of corporate office management. Net operating income presented by us may not be comparable to net operating income reported by other equity REITs that define net operating income differently. We believe that in order to facilitate a clear understanding of our operating results, net operating income should be examined in conjunction with income from continuing operations as presented in our condensed consolidated statements of income. Net operating income should not be considered as an alternative to income from continuing operations as an indication of our performance, or as an alternative to cash flows as a measure of liquidity, or our ability to make distributions.
Same property comparisons
As a result of changes within our total property portfolio, the financial data presented in the Summary of Same Property Comparisons shows significant changes in revenue and expenses from period to period. In order to supplement an evaluation of our results of operations over a given period, we analyze the operating performance for all properties that were fully operating for the entire periods presented for the quarter periods (herein referred to as “Same Properties”) separate from properties acquired subsequent to the first day in the first period presented, properties undergoing active development and active redevelopment, and corporate entities (legal entities performing general and administrative functions), which are excluded from same property results (herein referred to as “Non-Same Properties”). Additionally, rental revenues from lease termination fees, if any, are excluded from the results of the Same Properties.
| ALEXANDRIA REAL ESTATE EQUITIES, INC.
ALL RIGHTS RESERVED © 2012 | 35 |
ALEXANDRIA REAL ESTATE EQUITIES, INC.
Definitions and Other Information
September 30, 2012
(Tabular dollar amounts in thousands)
(Unaudited)
Total market capitalization
Total market capitalization is equal to the sum of outstanding shares of Series E Preferred Stock and common stock multiplied by the related closing price of each class at the end of each period presented, the liquidation value of the series D cumulative convertible preferred stock (“Series D Convertible Preferred Stock”), and total debt.
Unencumbered net operating income as a percentage of total net operating income
Unencumbered net operating income as a percentage of total net operating income is a non-GAAP financial measure that we believe is useful to investors as a performance measure of our results of operations of our unencumbered real estate assets, as it reflects primarily those income and expense items that are incurred at the unencumbered property level. We use unencumbered net operating income as a percentage of total net operating income in order to assess our compliance with our financial covenants under our debt obligations because the measure serves as a proxy for a financial measure under certain of our debt obligations. Unencumbered net operating income is derived from assets classified in continuing operations which are not subject to any mortgage, deed of trust, lien, or other security interest. Unencumbered net operating income for periods through June 30, 2012 has been reclassified to conform to current period presentation related to discontinued operations.
| | Three Months Ended | | Nine Months Ended | |
| | 9/30/12 | | 6/30/12 | | 3/31/12 | | 12/31/11 | | 9/30/11 | | 9/30/12 | | 9/30/11 | |
Unencumbered net operating income | | $ | 73,543 | | $ | 76,989 | | $ | 68,462 | | $ | 66,968 | | $ | 64,264 | | $ | 218,994 | | $ | 185,413 | |
Encumbered net operating income | | 27,298 | | 28,668 | | 29,059 | | 30,728 | | 32,931 | | 85,025 | | 105,553 | |
Total net operating income | | $ | 100,841 | | $ | 105,657 | | $ | 97,521 | | $ | 97,696 | | $ | 97,195 | | $ | 304,019 | | $ | 290,966 | |
| | | | | | | | | | | | | | | |
Unencumbered net operating income as a percentage of total net operating income | | 73% | | 73% | | 70% | | 69% | | 66% | | 72% | | 64% | |
Weighted average interest rate for capitalization
The weighted average interest rate for calculating capitalization of interest required pursuant to GAAP represents a weighted average rate based on the rates applicable to borrowings outstanding during the period and includes the impact of our interest rate hedge agreements, amortization of debt discounts/premiums, amortization of loan fees, and other bank fees. A separate calculation is performed each month to determine our weighted average interest rate for capitalization for the month. The rate will vary each month due to changes in variable interest rates, outstanding debt balances, the proportion of variable rate debt to fixed rate debt, the amount and terms of effective interest rate hedge agreements, and the amount of loan fee amortization.
Weighted average shares for calculating FFO, FFO, as adjusted, and AFFO per share
Weighted average shares represent the weighted average of common shares outstanding during the period. The following calculation of weighted average shares was applied to arrive at FFO per share attributable to Alexandria Real Estate Equities, Inc.’s common stockholders, FFO per share attributable to Alexandria Real Estate Equities, Inc.’s common stockholders, as adjusted, and AFFO per share attributable to Alexandria Real Estate Equities, Inc.’s common stockholders:
| | Three Months Ended | | Nine Months Ended | |
| | 9/30/12 | | 6/30/12 | | 3/31/12 | | 12/31/11 | | 9/30/11 | | 9/30/12 | | 9/30/11 | |
Weighted average shares of common stock outstanding for calculating FFO, FFO, as adjusted, and AFFO per share attributable to Alexandria Real Estate Equities, Inc.’s common stockholders –basic | | 62,364,210 | | 61,663,367 | | 61,507,807 | | 61,427,495 | | 61,295,659 | | 61,847,023 | | 58,271,270 | |
Effect of assumed conversion and dilutive securities: | | | | | | | | | | | | | | | |
Assumed conversion of 8.00% Unsecured Senior Convertible Notes | | 6,087 | | 6,087 | | 6,087 | | 6,087 | | 6,047 | | 6,087 | | 6,047 | |
Dilutive effect of stock options | | – | | 173 | | 1,160 | | 3,939 | | 8,310 | | 448 | | 13,475 | |
Weighted average shares of common stock outstanding for calculating FFO, FFO, as adjusted, and AFFO per share attributable to Alexandria Real Estate Equities, Inc.’s common stockholders –diluted | | 62,370,297 | | 61,669,627 | | 61,515,054 | | 61,437,521 | | 61,310,016 | | 61,853,558 | | 58,290,792 | |
| ALEXANDRIA REAL ESTATE EQUITIES, INC.
ALL RIGHTS RESERVED © 2012 | 36 |