Filed by NSTAR Pursuant to Rule 425
Under the Securities Act of 1933
And Deemed Filed Pursuant to Rule 14a-12
Under the Securities Exchange Act of 1934
Subject Company: NSTAR
Commission File No. of Subject Company: 001-14768
This filing relates to the proposed merger of NSTAR with Northeast Utilities pursuant to the terms of an Agreement and Plan of Merger, dated as of October 16, 2010 (the “Merger Agreement”), by and among Northeast Utilities, NSTAR, NU Holding Energy 1 LLC and NU Holding Energy 2 LLC. The Merger Agreement is on file with the Securities and Exchange Commission as an exhibit to the Current Report on Form 8-K filed by NSTAR on October 18, 2010, and is incorporated by reference into this filing.
* * *
 EEI Financial Conference NOVEMBER 1, 2010 |
 2 Safe Harbor Information Concerning Forward-Looking Statements In addition to historical information, this presentation may contain a number of “forward-looking statements” as defined in the Private Securities Litigation Reform Act of 1995. Words such as anticipate, expect, project, intend, plan, believe, and words and terms of similar substance used in connection with any discussion of future plans, actions, or events identify forward- looking statements. Forward-looking statements relating to the proposed merger include, but are not limited to: statements about the benefits of the proposed merger involving NSTAR and Northeast Utilities, including future financial and operating results; NSTAR’s and Northeast Utilities' plans, objectives, expectations and intentions; the expected timing of completion of the transaction; and other statements relating to the merger that are not historical facts. Forward-looking statements involve estimates, expectations and projections and, as a result, are subject to risks and uncertainties. There can be no assurance that actual results will not materially differ from expectations. Important factors could cause actual results to differ materially from those indicated by such forward-looking statements. With respect to the proposed merger, these factors include, but are not limited to: risks and uncertainties relating to the ability to obtain the requisite NSTAR and Northeast Utilities shareholder approvals; the risk that NSTAR or Northeast Utilities may be unable to obtain governmental and regulatory approvals required for the merger, or required governmental and regulatory approvals may delay the merger or result in the imposition of conditions that could reduce the anticipated benefits from the merger or cause the parties to abandon the merger; the risk that a condition to closing of the merger may not be satisfied; the length of time necessary to consummate the proposed merger; the risk that the businesses will not be integrated successfully; the risk that the cost savings and any other synergies from the transaction may not be fully realized or may take longer to realize than expected; disruption from the transaction may make it more difficult to maintain relationships with customers, employees or suppliers; the diversion of management time on merger- related issues; the effect of future regulatory or legislative actions on the companies; and the risk that the credit ratings of the combined company or its subsidiaries may be different from what the companies expect. These risks, as well as other risks associated with the merger, will be more fully discussed in the joint proxy statement/prospectus that will be included in the Registration Statement on Form S-4 that will be filed with the SEC in connection with the merger. Additional risks and uncertainties are identified and discussed in NSTAR’s and Northeast Utilities’ respective reports filed with the SEC and available at the SEC’s website at www.sec.gov. Forward-looking statements included in this presentation speak only as of the date of this presentation. Neither NSTAR nor Northeast Utilities undertakes any obligation to update its forward-looking statements to reflect events or circumstances after the date of this presentation. |
 3 Safe Harbor Additional Information and Where To Find It In connection with the proposed merger between Northeast Utilities and NSTAR, Northeast Utilities will file with the SEC a Registration Statement on Form S-4 that will include a joint proxy statement of Northeast Utilities and NSTAR that also constitutes a prospectus of Northeast Utilities. Northeast Utilities and NSTAR will mail the joint proxy statement/prospectus to their respective shareholders. Northeast Utilities and NSTAR urge investors and shareholders to read the joint proxy statement/prospectus regarding the proposed merger when it becomes available, as well as other documents filed with the SEC, because they will contain important information. Copies of all documents filed with the SEC regarding this proposed transaction, may be obtained free of charge, at the SEC’s website (www.sec.gov). These documents, free of charge, may be obtained from Northeast Utilities’ website (www.nu.com) under the tab “Investors” and then under the heading "Financial/SEC Reports." These documents, may be obtained free of charge, from NSTAR’s website (www.nstar.com) under the tab “Investor Relations.” Participants in the Merger Solicitation Northeast Utilities, NSTAR and their respective trustees, executive officers and certain other members of management and employees may be soliciting proxies from Northeast Utilities and NSTAR shareholders in favor of the merger and related matters. Information regarding the persons who may, under the rules of the SEC, be deemed participants in the solicitation of Northeast Utilities and NSTAR shareholders in connection with the proposed merger will be set forth in the joint proxy statement/prospectus when it is filed with the SEC. You can find information about Northeast Utilities' executive officers and trustees in its definitive proxy statement filed with the SEC on April 1, 2010. You can find information about NSTAR’s executive officers and trustees in its definitive proxy statement filed with the SEC on March 12, 2010. Additional information about Northeast Utilities' executive officers and trustees and NSTAR’s executive officers and trustees can be found in the above- referenced Registration Statement on Form S-4 when it becomes available. You can obtain free copies of these documents from Northeast Utilities and NSTAR using the website information above. |
 4 Agenda The NU – NSTAR merger NU’s capital investment plan NU’s 2010 financial performance NSTAR overview and 2010 financial performance |
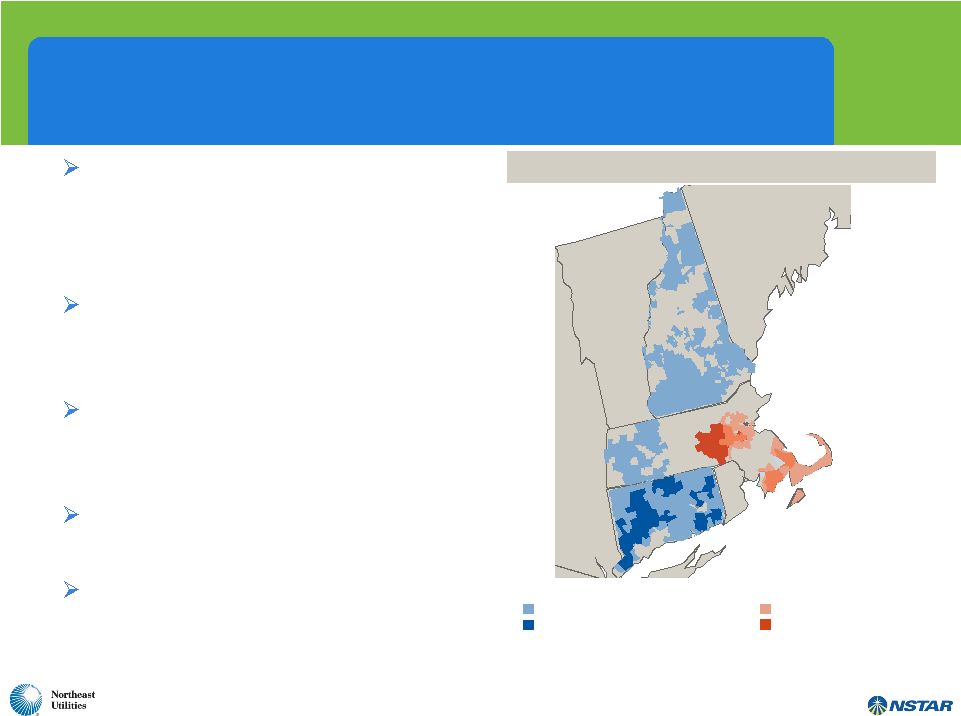 5 A Compelling Combination – Creates Largest Utility Company in New England Significant transmission investment opportunities combined with balance sheet strength provides for substantial growth potential Larger, more diverse and better positioned to support economic growth and renewables in New England Accretive to earnings in Year 1 and provides enhanced total shareholder return proposition Enhances service quality capabilities to the largest customer base in New England Highly experienced and complementary leadership team with proven track record NSTAR Electric Service Area NSTAR Gas Service Area Northeast Utilities Electric Service Area Northeast Utilities Gas Service Area ME NY VT NH M A RI Combined Service Territory |
 6 Key Merger Terms Timing / Approvals: Expected to close within 9 – 12 months Shareholders, federal, and state Headquarters: Dual – Hartford and Boston Company Name: Northeast Utilities Consideration: 100% NU shares Exchange Ratio: 1.312 shares of NU per NSTAR share Pro Forma Ownership: 56% NU shareholders 44% NSTAR shareholders Pro Forma Dividend: Following close, dividend increase for NU shareholders to NSTAR level Dividend parity for NSTAR shareholders Governance: Chuck Shivery to be non-executive Chairman Tom May to be President and CEO 14 Board members 7 nominated by Northeast Utilities including Chuck Shivery 7 nominated by NSTAR including Tom May Balanced Terms and Governance |
 7 Specific Benefits to the NU Shareholders A projected ~ 20% dividend increase Cash flow increase to eliminate equity issuance for foreseeable future Likely credit upgrades and reduction in debt issuance leading to lower long-term, short-term interest costs Increased market liquidity Enhanced opportunities to reduce costs over time Ability to achieve higher earnings growth rate |
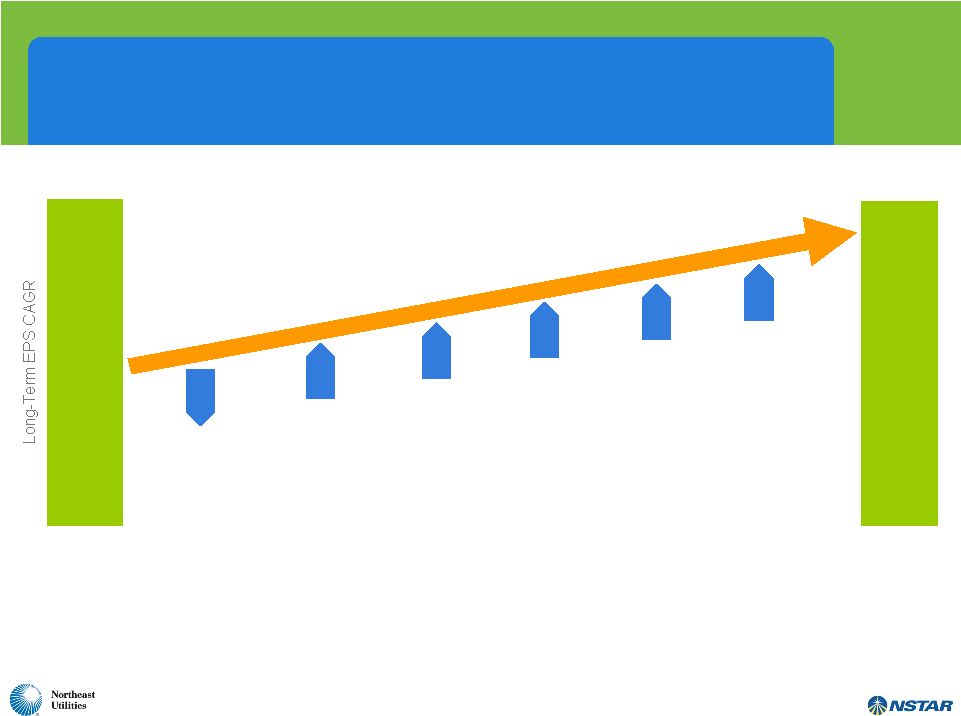 8 This Transaction is Accretive NU Stand Alone Growth Rate Avoidance of Equity Issuance NSTAR Earnings Growth Additional Shares Less NU Parent Debt Issuance Lower Financing Costs Implementing Best Practices Illustrative Impact on Growth Rate 9% Merged Company Growth Rate 9% Components Affecting Expected Accretion 6% 6% |
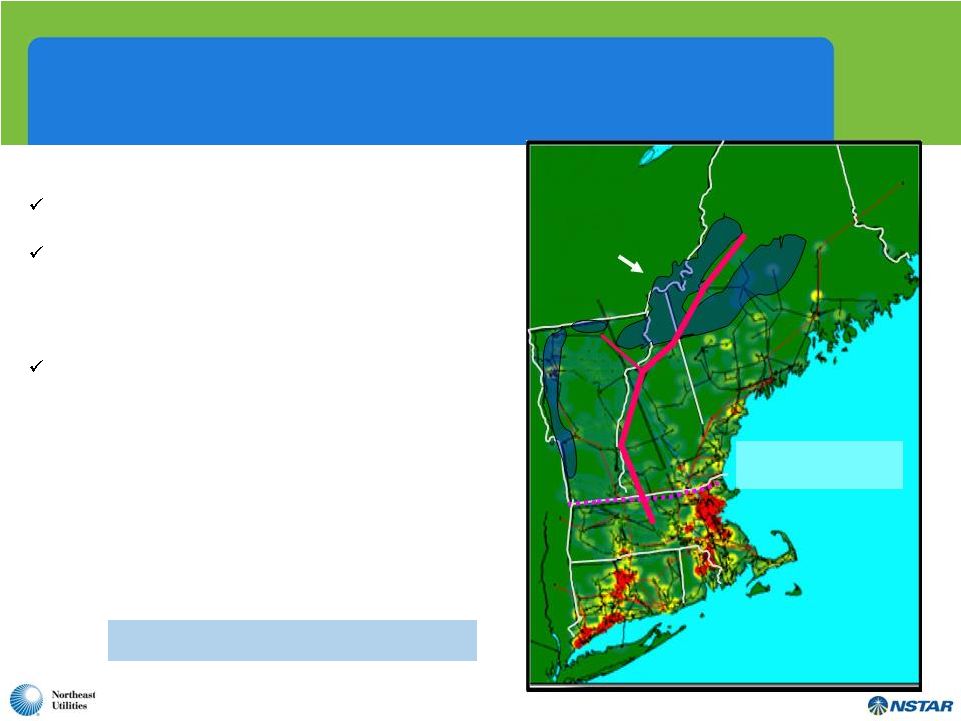 North-South Interface: 80% of NE electric load is below this line Vast majority of potential onshore renewables (wind) are in northern NE Merger Will Enhance Efforts to Bring Northern New England Wind Generation to Market Together, NU and NSTAR: Serve 50% of the region’s load, including important load centers in southern New England Will effectively advocate projects that advance public policy goals to address climate change and the region’s Renewable Portfolio Standards (RPS) • New England RPS are 21% by 2020, and existing resources provide only 6% Will bring best-in-class transmission developer, scale, financial strength and combined talent to successfully develop large-scale projects to connect wind generation with load centers that: • Complement current ISO-NE regional planning and potential FERC changes • Create efficiencies by optimizing multiple wind sites and required transmission • Get clean energy to New England’s load sites • Utilize a “beneficiary-pay” model that provides transparency for customers and regulators NU, NSTAR, National Grid, and United Illuminating working collectively on this model 9 |
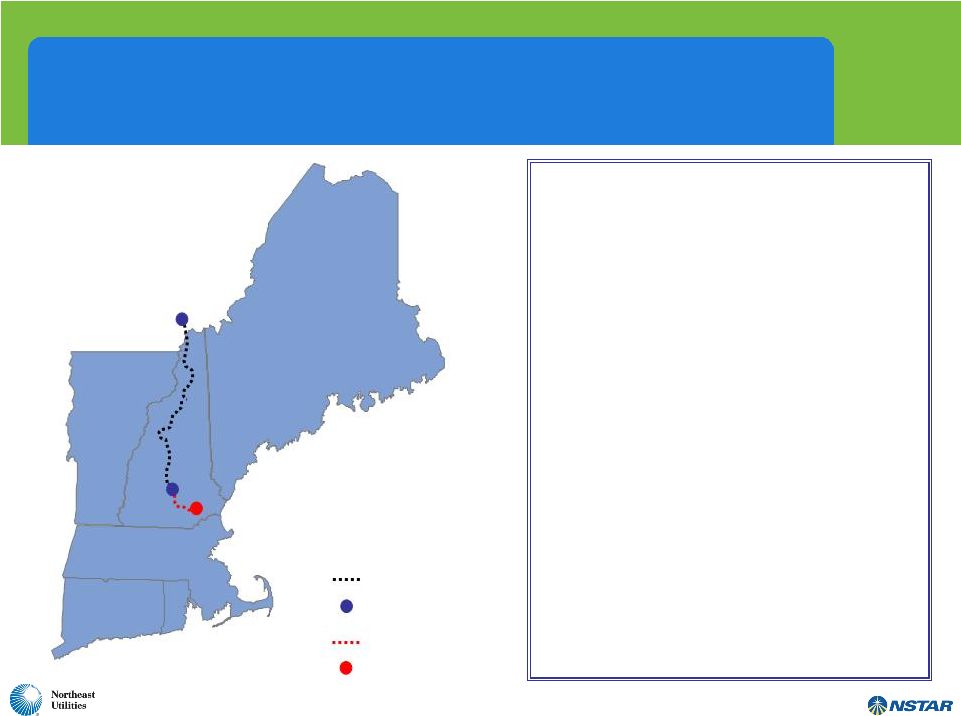 10 Transaction Builds Upon Northern Pass Partnership ´ • To be owned by Northern Pass Transmission LLC - NU (75%) and NSTAR (25%) • 1,200 MW transfer capability • Northern terminus at Des Cantons (Québec), southern terminus in Franklin (New Hampshire) • Québec terminal will convert the power from AC to DC (rectifier) • US terminal will convert the power from DC to AC (inverter) • Capital cost estimate for US segment: $1.107 billion • TSA signed on October 4 • Permitting process began October 14 with U.S. DOE application • PPAs under discussion Des Cantons HVDC Line HVDC Converter Station 345-kV Line Existing Deerfield Substation Deerfield Franklin |
 11 Benefits to the NSTAR Shareholders Enhanced earnings and dividend growth outlook Ability to apply strong balance sheet and cash flow to attractive transmission investment opportunities Larger utility footprint provides access to projects and opportunities not available today More diverse and better balanced earnings profile Compelling total return opportunity |
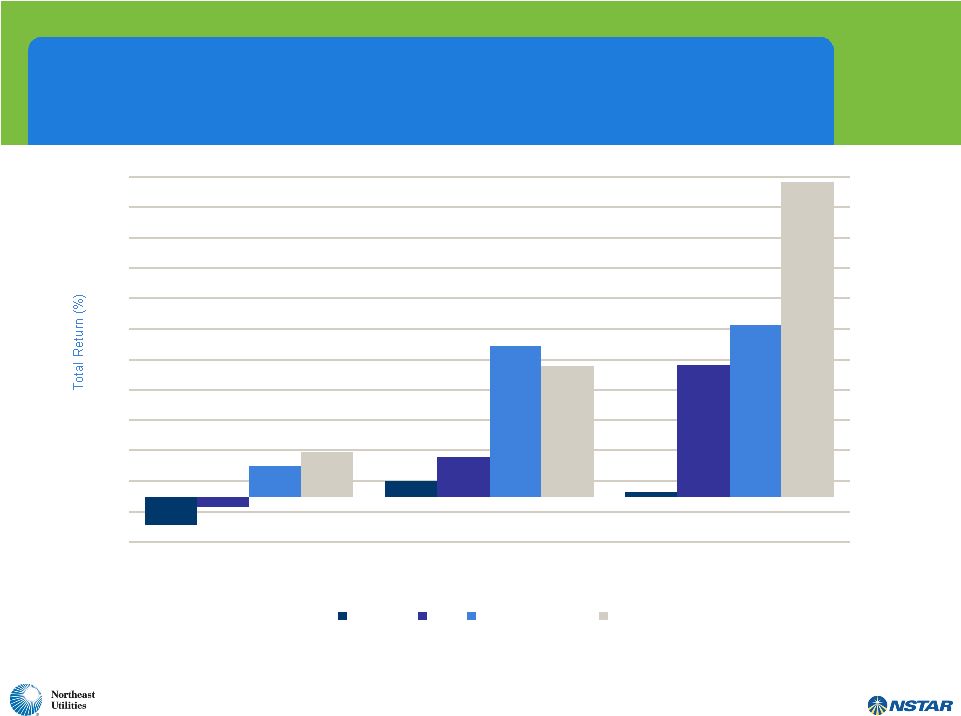 12 Proven Record of Delivering Superior Value (1) 3 years 5 years 10 years ___________________________ (2) (3) (18.7) 10.2 (7.6) 25.7 86.3 19.4 98.6 112.5 29.0 85.2 206.3 3.2 -30 -10 10 30 50 70 90 110 130 150 170 190 210 S&P 500 UTY Northeast Utilities NSTAR Source: Factset. 1. Total returns as of 10/15/10. Assumes reinvestment of dividends. 2. Total returns calculated based on S&P 500 market index, which is weighted by market capitalization. 3. Total returns calculated as simple average of the returns of the components of the UTY, as of 10/15/10. |
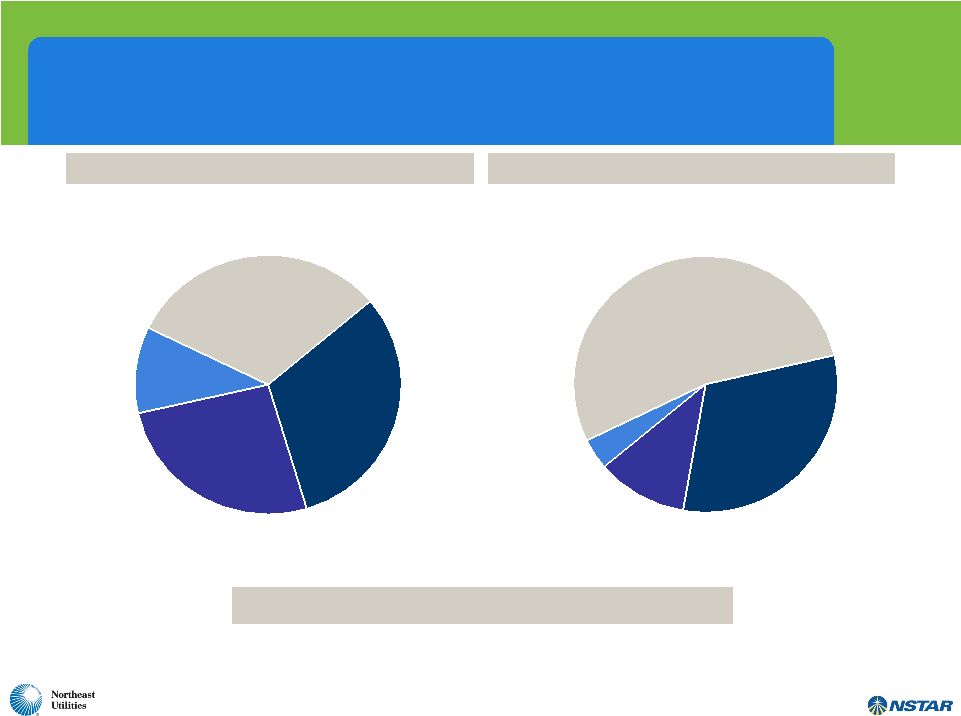 13 Building A Larger, More Diverse and Better Positioned Regulated Utility Business FERC 31% CT 26% NH 11% MA 32% Rate Base By State / Federal Electric Generation 4% Electric Distribution 54% Gas Distribution 11% Electric Transmission 31% Rate Base By Business Combined 2009 Rate Base: $10.8 billion |
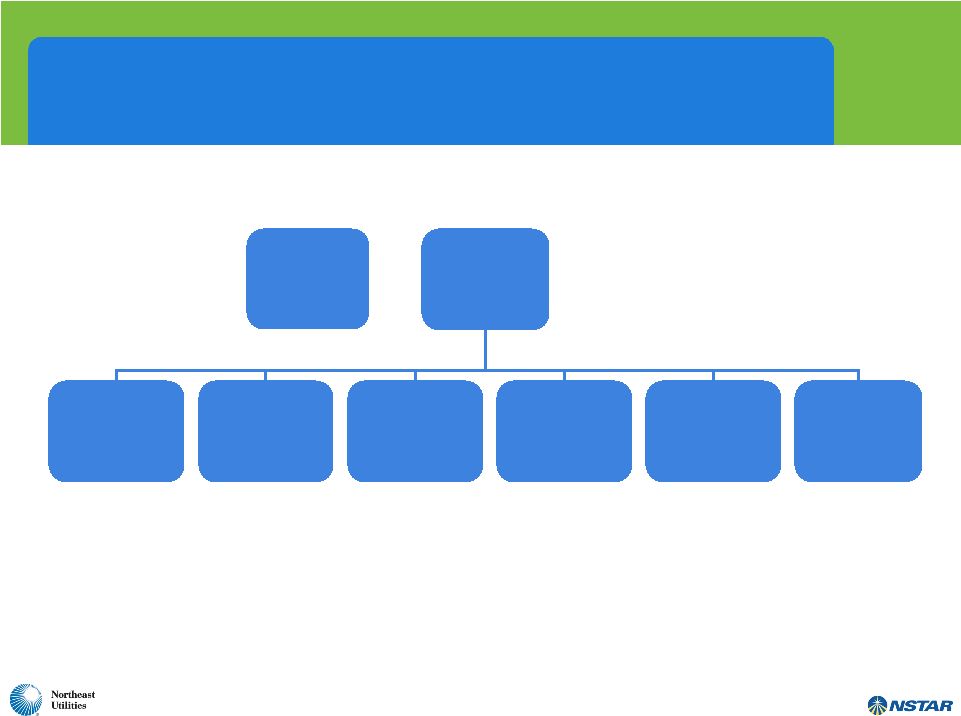 14 Executive Management Organization Tom May President & Chief Executive Officer Greg Butler General Counsel David McHale Chief Administrative Officer Lee Olivier Chief Operating Officer Christine Carmody Human Resources Jim Judge Chief Financial Officer Joe Nolan Corporate Relations Chuck Shivery Non-Executive Chairman |
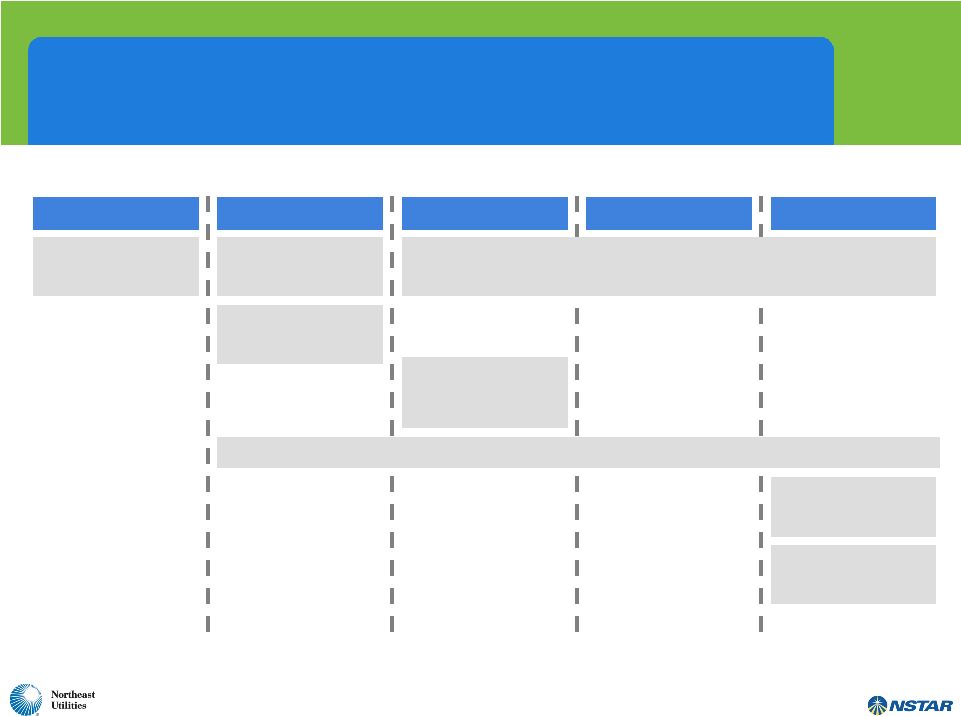 15 Regulatory Timeline Oct 2010 Closing Expected in 9 – 12 months Q4 2010 Q1 2011 Q2 2011 Q3 2011 Merger Announced Commence Regulatory Filings File Joint Proxy Statement/Prospectus Secure Regulatory Approvals FERC, SEC, NRC, DOJ, MDPU, FCC Northeast Utilities and NSTAR Shareholder Meetings Develop Transition Implementation Plans Receive Regulatory Approvals Close Merger |
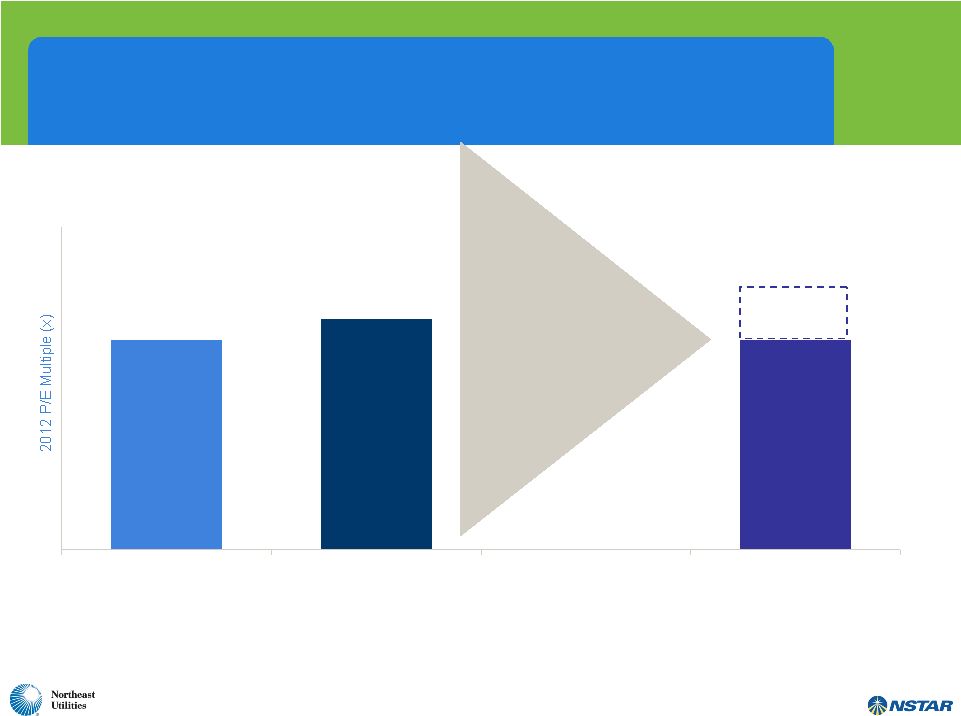 16 13.0x 14.3x Northeast Utilities NSTAR Pro Forma (1) (1) Value Uplift Potential • Significant future rate base growth prospects • Strong dividend growth prospects • Diversification • Top tier management • No foreseeable equity issuance “Best-In-Class” P/E Potential ___________________________ 1. Based on I/B/E/S consensus EPS estimates as of 10/15/10. |
 NU Regulated Investment Strategy |
 18 This presentation contains statements concerning NU’s expectations, beliefs, plans, objectives, goals, strategies, assumptions of future events, future financial performance or growth and other statements that are not historical facts. These statements are “forward-looking statements” within the meaning of the Private Securities Litigation Reform Act of 1995. In some cases, a listener or reader can identify these forward-looking statements through the use of words or phrases such as “estimate”, “expect”, “anticipate”, “intend”, “plan”, “project”, “believe”, “forecast”, “should”, “could”, and other similar expressions. Forward-looking statements are based on the current expectations, estimates, assumptions or projections of management and are not guarantees of future performance. These expectations, estimates, assumptions or projections may vary materially from actual results. Accordingly, any such statements are qualified in their entirety by reference to, and are accompanied by, the following important factors that could cause our actual results to differ materially from those contained in our forward-looking statements, including, but not limited to, actions or inaction of local, state and federal regulatory and taxing bodies; changes in business and economic conditions, including their impact on interest rates, bad debt expense and demand for our products and services; changes in weather patterns; changes in laws, regulations or regulatory policy; changes in levels and timing of capital expenditures; disruptions in the capital markets or other events that make our access to necessary capital more difficult or costly; developments in legal or public policy doctrines; technological developments; changes in accounting standards and financial reporting regulations; fluctuations in the value of our remaining competitive electricity positions; actions of rating agencies; and other presently unknown or unforeseen factors. Other risk factors are detailed from time to time in our reports to the Securities and Exchange Commission (SEC). Any forward-looking statement speaks only as of the date on which such statement is made, and we undertake no obligation to update the information contained in any forward-looking statements to reflect developments or circumstances occurring after the statement is made or to reflect the occurrence of unanticipated events. This presentation references actual and projected EPS by business, a non-GAAP presentation, which management believes is useful to investors to evaluate the actual and projected financial performance and contribution of our businesses. This non-GAAP financial measure should not be considered as an alternative to our consolidated net income attributable to controlling interests, and EPS determined in accordance with GAAP as an indicator of operating performance. Please refer to the reconciliations of this non-GAAP financial measure to our consolidated net income attributable to controlling interests and EPS included in this presentation. Please refer to our reports to the SEC for further details concerning the matters described in this presentation. NU Safe Harbor Provisions |
 19 2011-2015 Plan Continues to Provide Significant Value for Customers and Shareholders Through Strong Execution and Deployment of Capital to Meet the Region’s Energy Needs • NU’s plan deploys a total of $6.6 billion in electric transmission, distribution, generation and natural gas additions that will improve reliability and provide significant environmental benefits • Leadership and sustained success in transmission continues with the advancement of the NEEWS and Northern Pass projects • Successful completion of rate cases at CL&P and PSNH provide certainty around distribution capital deployment and revenue over the immediate future • Investments in both conventional and renewable generation provide clean energy solutions for our customers • The Yankee Gas capital plan delivers value to customers by reducing supply constraints, lowering commodity costs and ensuring a safe and reliable system We will continue to aggressively manage our costs while improving our customer service |
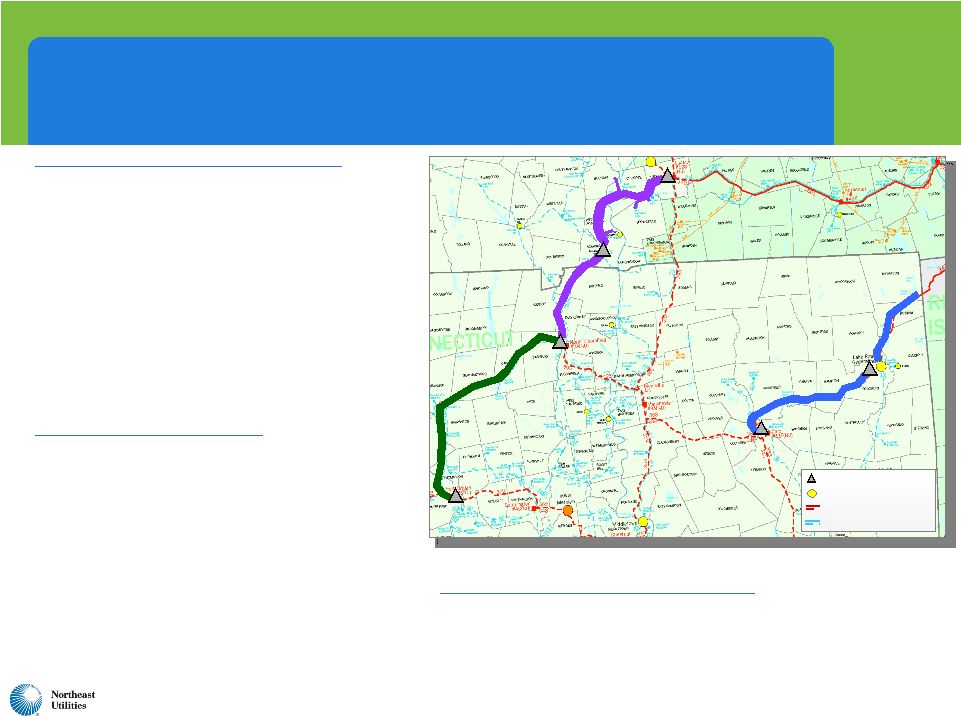 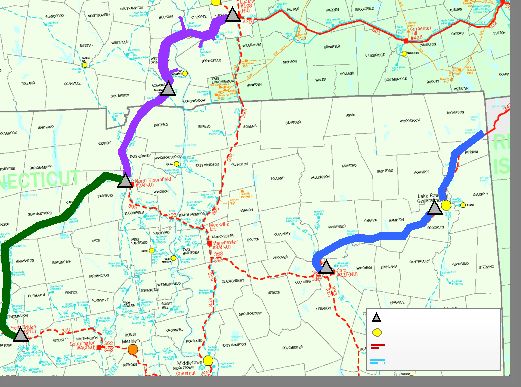 20 NEEWS Projects Advance Current Status Report Greater Springfield Reliability Project • Received siting approval in CT and MA • Development and Management Plans approved by CT Siting Council • Commence substation construction in MA: Dec. 2010 • Commence overhead construction in MA: Spring 2011 • Commence overhead construction in CT: early 2012 • Project in-service: late 2013 Interstate Reliability Project • Joint project with National Grid (NU in CT; NGrid in MA & RI) • ISO-NE confirmed need date in August 2010 • ISO-NE PAC process in late 2010 • File siting application in CT in mid/late 2011 • Siting decision in CT in mid/late 2013 • Commence construction: late 2013/early 2014 • Project in-service: late 2015 SPRINGFIELD HARTFORD 345-kV Substation Generation Station 345-kV ROW 115-kV ROW Central Connecticut Reliability Project Interstate Reliability Project Greater Springfield Reliability Project Central Connecticut Reliability Project • Awaiting completion of ISO-NE’s reassessment of need and need date • Project milestones estimated 12 months behind IRP |
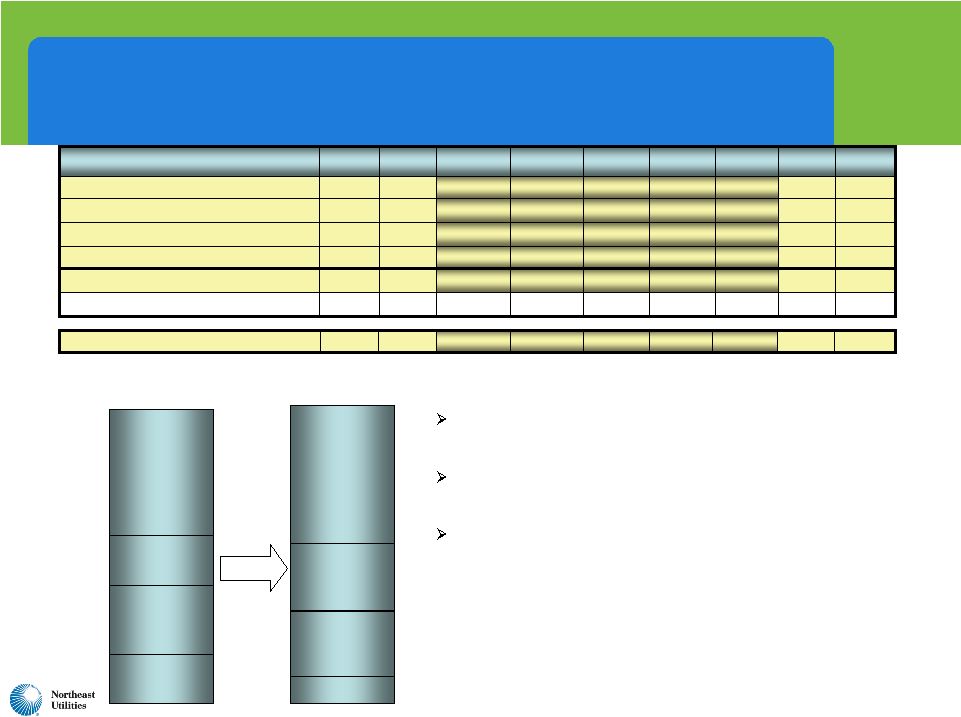 21 Greater Springfield Reliability Project $714M Interstate Reliability Project $251M Central Connecticut Reliability Project $313M 338 48 185 54 20 14 2 3 12 Central Connecticut Reliability Project 84 0 0 0 6 19 26 24 9 NEEWS Related Projects Now Under Way 795 0 0 17 132 300 196 61 89 Greater Springfield Reliability Project 301 1 95 114 21 18 11 9 32 Interstate Reliability Project 1,490* 0 0 149 359 417 317 109 139 Total NEEWS Projects - 2009 EEI* 49 2016 Totals 2015 2014 2013 2012 2011 2010 Priors NEEWS Projects 2010 Cash Flows 280 1,518* 185 179 351 235 97 142 Total NEEWS Projects - 2010 EEI* Scope refinements and changes ordered during siting proceedings New in-service dates for Interstate (2015) and CCRP (2016) reflect regional and state review processes NEEWS related projects either underway ($84M) or incorporated into major NEEWS segments Primary Changes NEEWS Related Projects $212M Revised NEEWS Project Costs (in $ millions) 42 257 1,449 173 171 342 232 90 142 Total NEEWS Projects - 2010 EEI Net UI Greater Springfield Reliability Project $795M Interstate Reliability Project $301M Central Connecticut Reliability Project $338M NEEWS Related Projects $84M 2010 Estimate $1,518M * Prior Estimate $1,490M * NEEWS totals above do not reflect UI Investment in CL&P NEEWS Projects. Based on current NEEWS project estimates, a potential UI investment of $69 million has been reflected in the 2010 EEI net numbers above and in the NU consolidated earnings projections. For 2009 EEI numbers, the UI investment was estimated at $60M. * |
 22 Q4 2011 Begin long lead time Material Procurement $ 1.107 Billion* Project cost - (U.S. side) 2015 In-Service Date Q4 2012 Complete siting approvals 2013 Begin Construction Q4 2011 New Hampshire Siting (‘SEC’) application filed Oct 2010 DOE Presidential Permit application filed Oct 2010 Transmission Service Agreement (‘TSA’) signed Q1 2011 Execute Term Sheets for EPC Jan 2011 FERC order expected Nov 2010 TSA FERC filing Oct 2010 ISO Technical Approval application filed May 2009 FERC filing declaratory order Dec 2008 Initial FERC filing declaratory order Milestone Date Milestone Northern Pass Transmission - a $1.1 Billion Capital Investment (2009 - 2015) Project Milestones (as of 11/1/10) * To be updated by year-end |
 23 NEEWS projects ramping up 2011-2015 Transmission Capital Expenditures $0 $100 $200 $300 $400 $500 $600 $700 $800 Base Reliability Major Southwest CT NEEWS Northern Pass Historic Forecast $2.8 Billion $2.8 Billion NU’s share of NEEWS project estimated at $1.449 billion $845 million of additional forecasted projects Projected $251 Million Northern Pass HVDC Line to Canada US portion estimated at $1.1 billion with $830 million NU ownership share Successful completion of SWCT projects SWCT projects total $1.6 billion |
 24 $311 $334 $318 $316 $328 $335 $83 $133 $97 $114 $117 $128 $133 $133 $12 $20 $9 $5 $5 $5 $34 $52 $57 $57 $58 $183 $109 $51 $53 $29 $1 $59 $29 $0 $50 $100 $150 $200 $250 $300 $350 $400 $450 $500 $550 $600 $650 $700 $750 2010 Proj 2011 2012 2013 2014 2015 PSNH - Generation ($271M total) WMECO - Distribution ($283M total) WMECO - Generation ($44M total) PSNH - Distribution ($625M total) CL&P - AMI/Smart Grid ($217M total)* CL&P - Distribution ($1,631M total) Electric Distribution and Generation Capital Expenditures – By Company 2011-2015 Projected Distribution and Generation Spending $3.1 Billion $637 $694 $636 $560 $552 $629 *Total AMI-related capex through 2016 expected to be approximately $300 million 2011 – 2015 Capital Expenditures |
 25 Yankee Gas Capital Expenditures $24 $28 $49 $50 $50 $52 $32 $34 $31 $30 $31 $33 $17 $16 $19 $20 $21 $21 $27 $35 $13 $26 $26 $0 $10 $20 $30 $40 $50 $60 $70 $80 $90 $100 $110 $120 $130 $140 $150 2010 Proj 2011 2012 2013 2014 2015 Aging Infrastructure Basic Business Peak Load / New Business WWL Gas supply infrastructure 2011-2015 Projected Yankee Gas Capital Spending $585 Million Investing $585 million, leveraging natural gas as “the fuel of choice” Distribution system expansion: $35 million for 16-mile Waterbury to Wallingford Line (WWL) Gas supply infrastructure Sales growth opportunities to supply renewable generation (fuel cells, DG) Yankee Gas Strategy $100 $119 $128 $126 $99 $113 |
 NU Financial |
 27 2010 Represents a Strong Year Financially For NU • Strong third quarter results • 2010 financial performance expected to well exceed initial projections • Cash generation continues to strengthen • 2010 estimate raised to $800 million - $850 million due to extension of bonus depreciation tax deduction • Five-year capital investment and rate base projections show very attractive growth |
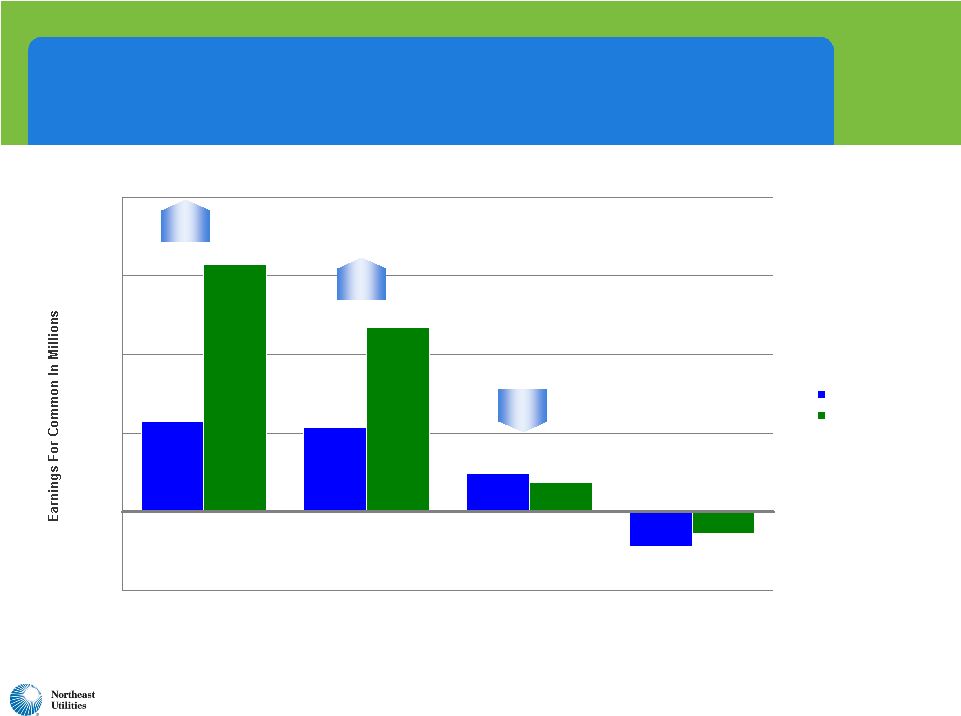
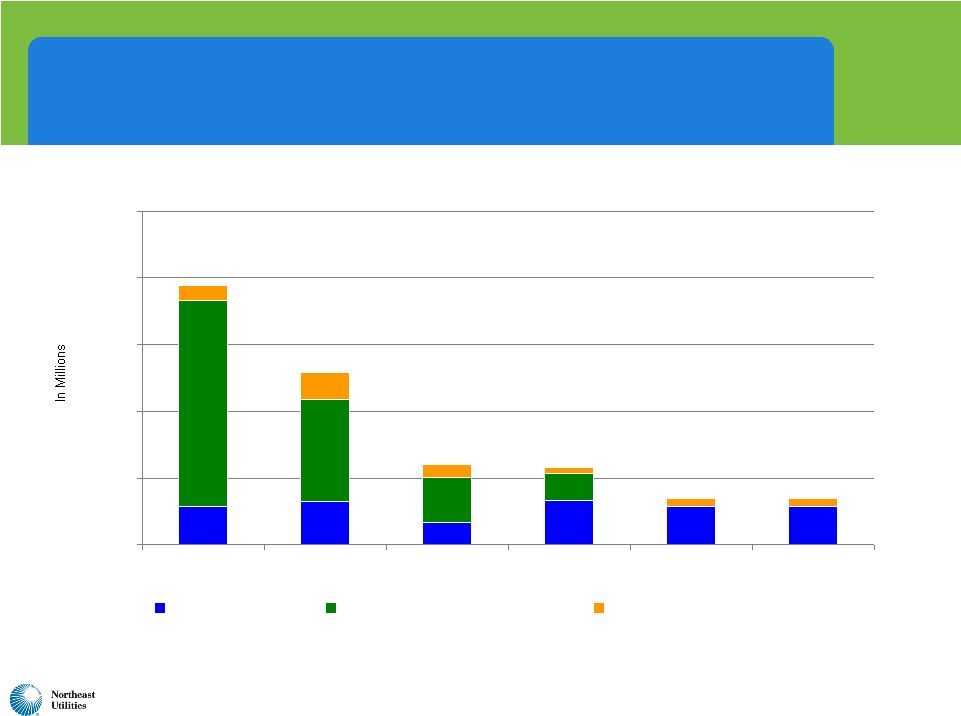
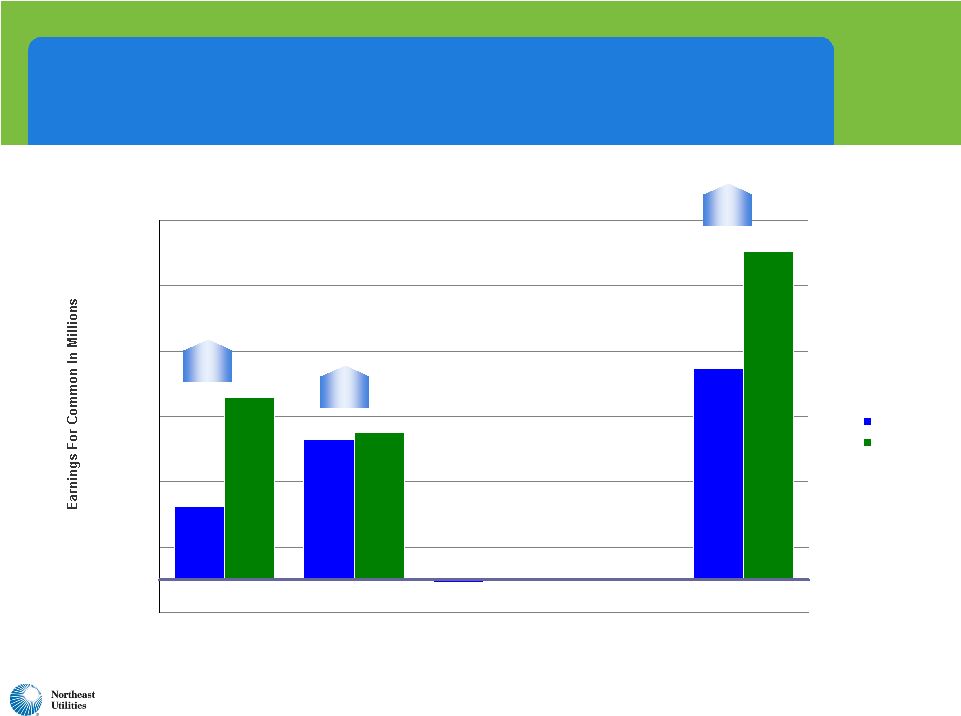 28 $0.3 $42.8 $22.5 $64.8 ($0.8) $100.5 $0.1 ($0.5) $45.2 $55.7 ($10) $10 $30 $50 $70 $90 $110 2009 2010 Third Quarter 2010 Results Distribution and Generation Transmission Parent/Other Competitive Total 147.5% 5.6% 55.1% |
 29 Third Quarter 2010 Distribution and Generation Results ($4.5) $10.7 $11.4 $4.9 ($2.9) $3.7 $23.4 $31.5 ($10) $0 $10 $20 $30 $40 2009 2010 CL&P PSNH WMECO Yankee Gas 176.3% 118.7% 24.5% |
 30 2010 EPS Guidance Raised $1.95 – $2.05 ($0.05) $0.05 $0.95 $1.00 - $1.10 $1.95 - $2.05 August 2010 Guidance $1.80 – $2.00 ($0.05) $0.00 - $0.05 $0.90 - $0.95 $0.95 - $1.05 $1.80 - $2.00 Initial 2010 Guidance $2.10 - $2.20 $1.91 Net income attributable to controlling interest (GAAP) $2.10 – $2.20* ($0.05)* $0.05 $1.00 $1.10 - $1.20 New 2010 Guidance $1.91 NU Consolidated (Non-GAAP) ($0.05) NU Parent/Other $0.09 Competitive $0.95 Transmission $0.92 Distribution/Generation 2009 Actual *Excludes a $0.09 fourth quarter non-recurring tax gain at NU Parent and approximately $0.07 of NU-NSTAR merger related expenses that will be recorded in the fourth quarter |
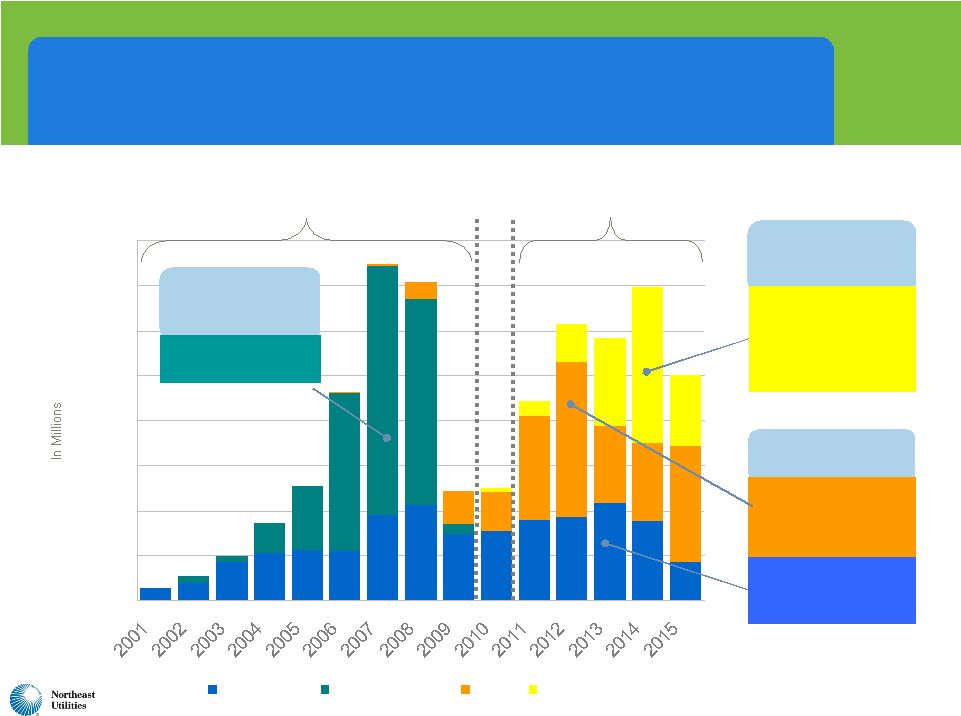
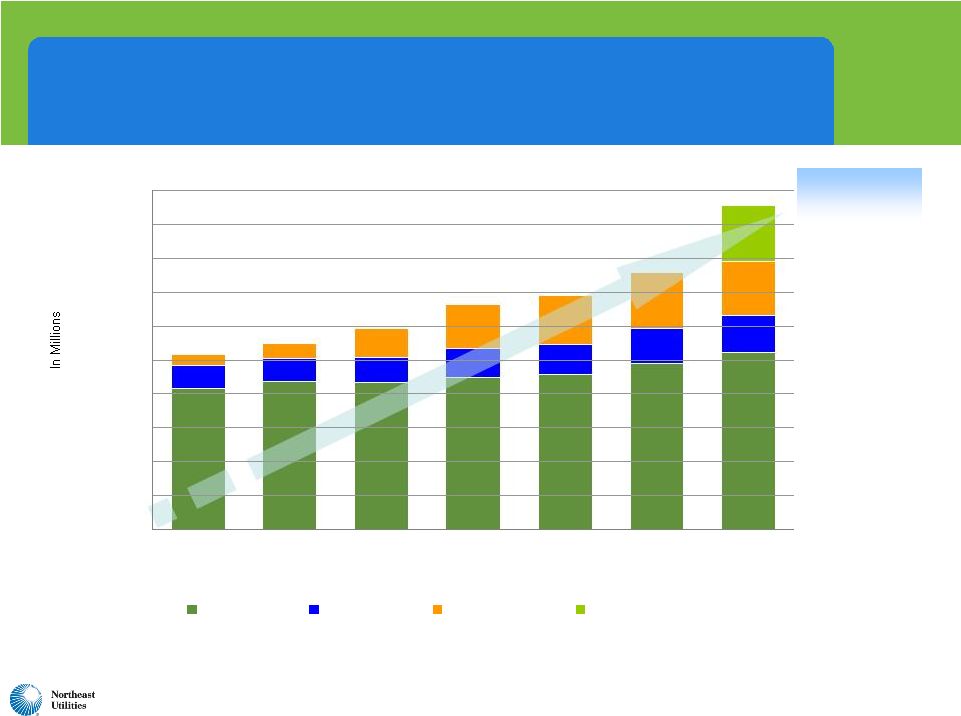
  31 2010-2015: New Capital Expenditure Forecast Distribution and Generation Capex (11/09 Forecast) Transmission Capex (11/09 Forecast) Distribution and Generation Capex (11/10 Forecast) Transmission Capex (11/10 Forecast) 2012 2013 2010 Projected 2011 2014 *Includes total capex at corporate service companies on behalf of operating companies of $141 million ($26 million in 2011, $19 million in 2012, $36 million in 2013, $34 million in 2014, and $26 million in 2015). 2015 $6,640 Total Capex $141 Other $315 Generation $2,843 Transmission $585 Gas Distribution $2,756 Electric Distribution Total 2011-2015 Capex (in Millions) $0 $200 $400 $600 $800 $1,000 $1,200 $1,400 $1,600 $1,800 $2,000 * Five-year 2011-2015 capital spending of approximately $6.6 billion, compared with last year’s 2010-2014 $6.4 billion plan. |
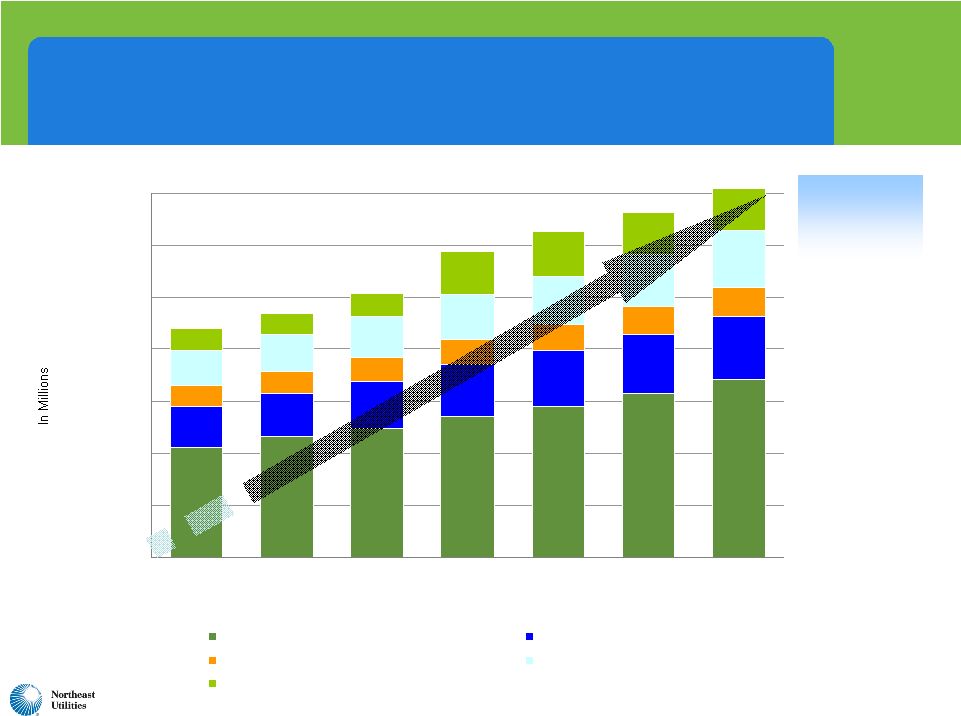
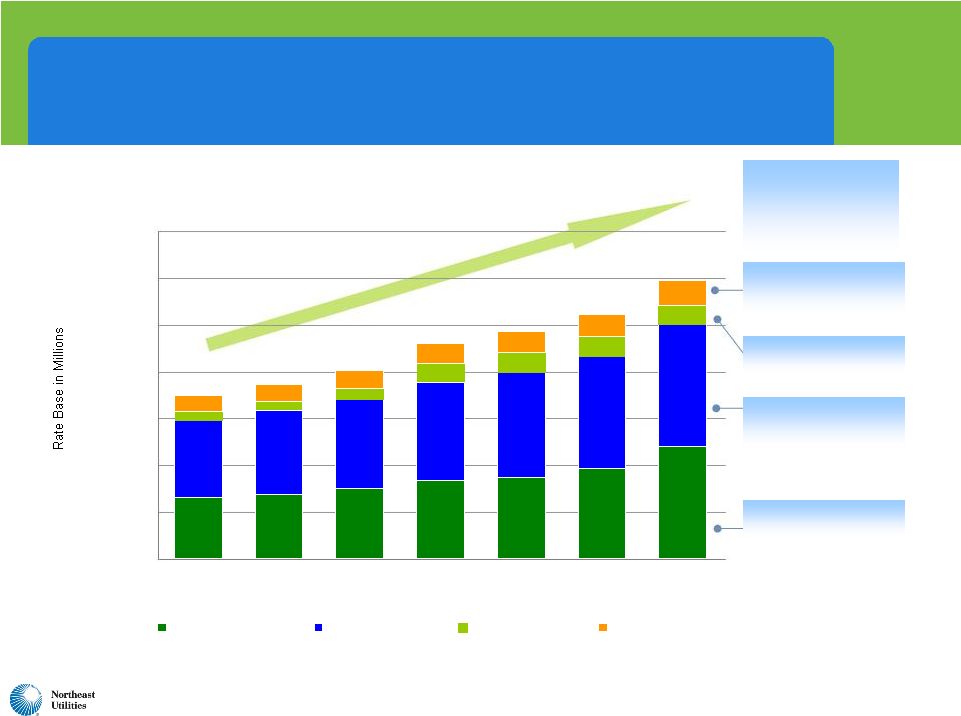 32 $2,597 $2,745 $2,971 $3,325 $3,458 $3,810 $4,792 $3,303 $3,571 $3,843 $4,196 $4,485 $4,822 $5,196 $407 $404 $826 $839 $832 $815 $691 $714 $803 $864 $926 $428 $1,094 $986 $0 $2,000 $4,000 $6,000 $8,000 $10,000 $12,000 $14,000 2009 Actual 2010E 2011E 2012E 2013E 2014E 2015E Transmission Distribution Generation Yankee Gas Projected Year-End Rate Base $7,434 $9,211 $8,045 $9,708 Projected Total Rate Base 2009-2015 CAGR of 9.2% (using 2009 as base year) $6,998 $10,450 Projected Electric Distribution CAGR of 7.8% Projected Transmission CAGR of 10.7% $11,897 Projected Generation CAGR of 12.3% Projected Natural Gas Distribution CAGR of 8.0% |
 NSTAR |
 34 NSTAR Safe Harbor Information Concerning Forward-Looking Statements This presentation contains forward-looking statements within the meaning of the Securities Act of 1933 and the Securities Exchange Act of 1934. These statements are based on the current expectations, estimates or projections of management, and are not guarantees of future performance. Actual results could differ materially from these statements. Examples of some important factors that could cause NSTAR’s actual results or outcomes to differ materially from those discussed in the forward-looking statements include, but are not limited to, the following: adverse financial market conditions including changes in interest rates and the availability and cost of capital; adverse economic conditions; changes to prevailing local, state and federal governmental policies and regulatory actions (including those of the Massachusetts Department of Public Utilities and the Federal Energy Regulatory Commission) with respect to allowed rates of return, rate structure, continued recovery of regulatory assets and energy costs, financings, municipalization, acquisition and disposition of assets, operation and construction of facilities, changes in tax laws and policies, and changes in, and compliance with, environmental and safety laws and policies; new governmental regulations or changes to existing regulations that impose additional operating requirements or liabilities; changes in available information and circumstances regarding legal issues and the resulting impact on our estimated litigation costs; weather conditions that directly influence the demand for electricity and natural gas; impact of continued cost control processes on operating results; ability to maintain current credit ratings; impact of uninsured losses; impact of adverse union contract negotiations; damage from major storms; impact of conservation measures and self-generation by our customers; changes in financial accounting and reporting standards; changes in hazardous waste site conditions and the cleanup technology; prices and availability of operating supplies; impact of terrorist acts and cyber- attacks; impact of service quality performance measures; impact of the expected timing and likelihood of completion of the proposed merger with Northeast Utilities, which could be adversely affected by, among other things, (i) the timing and conditions of any required governmental and regulatory approvals, (ii) litigation brought in connection with the proposed merger, (iii) the ability to maintain relationships with customers, employees or suppliers as well as the ability to successfully integrate the businesses and (iv) the risk that the credit ratings of the combined company or its subsidiaries may be different from what the companies expect. Any forward-looking statement speaks only as of the date of this presentation and NSTAR undertakes no obligation to publicly update forward-looking statements, whether as a result of new information, future events, or otherwise. You are advised, however, to consult all further disclosures NSTAR makes in its filings to the Securities and Exchange Commission. Other factors, in addition to those listed here, could also adversely affect NSTAR. |
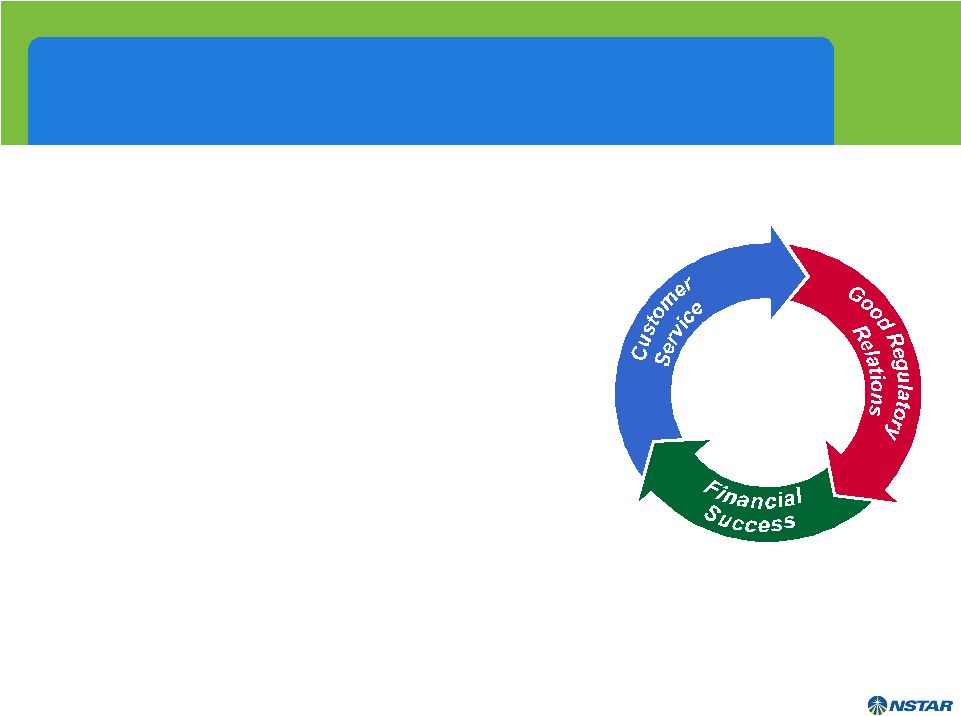 35 NSTAR – A Track Record of Strong Performance • High levels of customer service and reliability • Constructive regulatory outcomes • Solid, consistent financial results • Strong credit profile and positive cash flow |
 36 A Long History of Negotiated, Multi-Year Distribution Rate Agreements • 25 years of rate agreements – last litigated rate increase in 1986 • Fully reconciling pension & post-retirement mechanism and recovery of energy supply • Current electric rate plan through December 31, 2012 • 10.5% ROE with +/- 2% neutral zone • Plan to pursue a new rate agreement effective in 2013 |
 37 History of Disciplined Cost Control $453 2005 $431 2006 2007 Operations & Maintenance Expense $447 $ IN MILLIONS 2008 $454 2009 $431 • Productivity & automation • Performance driven culture • Engaged workforce and constructive union relations • Continuous improvement philosophy Key Drivers |
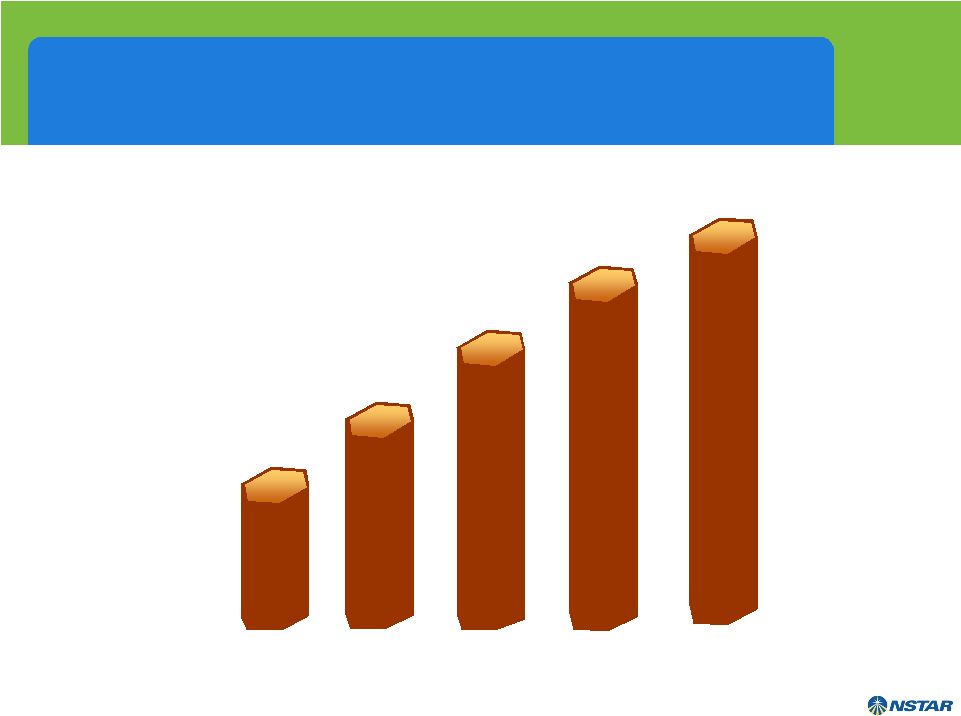
 38 Earnings Growth of 7% Outperforms Industry …19 Consecutive Years of Operating Earnings Growth $2.22 2006 2007 $1.93 $2.07 2008 2009 $2.37 $2.45 - $2.60 2010 Guidance |
 39 Consistent, Above Average Dividend Growth …12 Consecutive Years of Increase… $1.21 $1.30 $1.40 2006 2007 $1.50 2008 2009 2010 $1.60 |
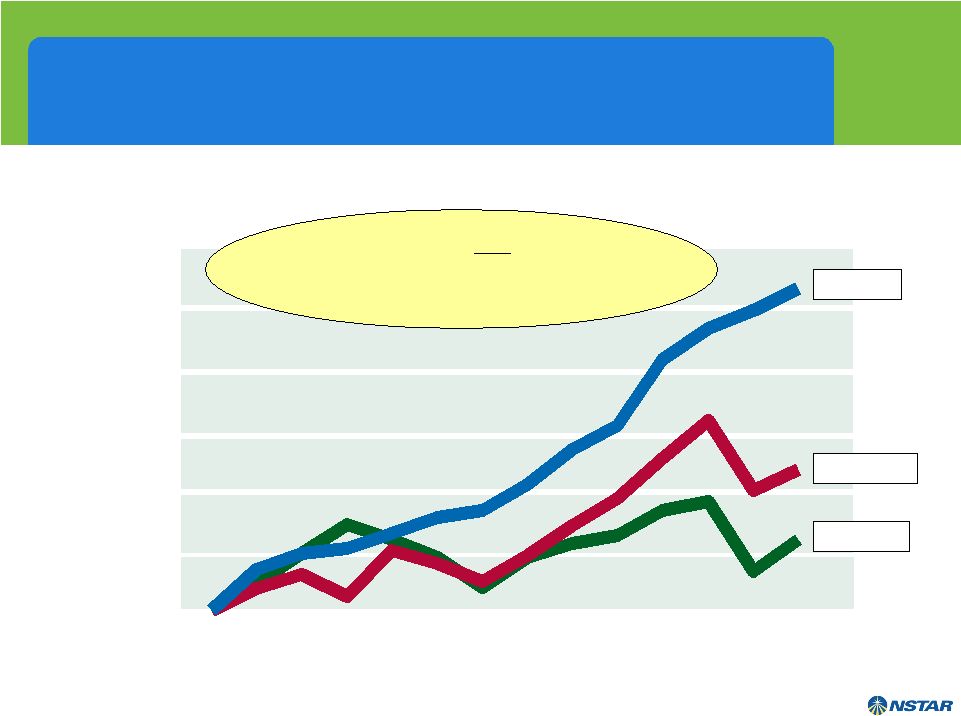 40 Total Shareholder Return Outperforms the Industry NSTAR Utility Index S&P 500 1996 2009 $1,000 $1,750 $2,500 $3,250 $4,000 $4,750 $5,500 Only company in any industry to deliver 13 consecutive years of positive total shareholder return |
 41 Highest Credit Rating in the Industry NSTAR A+ FPL Group, Inc. A Southern Company A Consolidated Edison, Inc. A- Dominion Resources, Inc. A- DPL Inc. A- Duke Energy Corporation A- Energy East Corporation A- KeySpan Corp. A- Niagara Mohawk Power Corporation A- Vectren Corporation A- ALLETE, Inc. BBB+ Alliant Energy Corporation BBB+ Integrys Energy Group, Inc. BBB+ Kentucky Utilities Company BBB+ Louisville Gas and Electric Company BBB+ MDU Resources Group, Inc. BBB+ MidAmerican Energy Holdings Company BBB+ OGE Energy Corp. BBB+ PG&E Corporation BBB+ Portland General Electric Company BBB+ Progress Energy, Inc. BBB+ SCANA Corporation BBB+ Sempra Energy BBB+ Wisconsin Energy Corporation BBB+ Xcel Energy Inc. BBB+ American Electric Power Company, Inc. BBB CenterPoint Energy, Inc. BBB Cleco Corporation BBB El Paso Electric Company BBB Energy Corporation BBB Exelon Corporation BBB FirstEnergy Corp. BBB Great Plains Energy Inc. BBB Green Mountain Power Corporation BBB Hawaiian Electric Industries, Inc. BBB IDACORP, Inc. BBB Northeast Utilities BBB North Western Corporation BBB Pepco Holdings, Inc. BBB PPL Corporation BBB Public Service Enterprise Group Inc. BBB TECO Energy, Inc. BBB UIL Holdings Corporation BBB Allegheny Energy, Inc. BBB- Ameren Corporation BBB- Avista Corporation BBB- Black Hills Corporation BBB- CMS Energy Corporation BBB- Constellation Energy Group, Inc. BBB- Duquesne Light Company BBB- Edison International BBB- Empire District Electric Company BBB- IPALCO Enterprises, Inc. BBB- NiSource Inc. BBB- Otter Tail Corporation BBB- Pinnacle West Capital Corporation BBB- Westar Energy, Inc. Puget Energy, Inc. BBB- Puget Energy, Inc. BB+ NV Energy, Inc. BB PNM Resources, Inc. BB- Energy Future Holdings Corp. B- #1 NSTAR A+ *As published by EEI |
 42 NSTAR System Has Significant Transmission Investment Ahead • Transmission Rate Base is expected to double within 5 years to approximately $1.6 billion • Growth/reliability spending averages $100 million per year • Incremental Major Projects • Cape Cod Line $120 million (2011-2012) • South Boston Circuit $45-$50 million (2014-2015) • Mid Cape Line $25-$30 million (2013-2014) • Northern Pass $280 million (2012-2015) |
 43 Solid Financial Results Q3 2010 Reported EPS - Q3 2009 0.82 $ Higher electric sales (+7.8%) $0.10 PBR distribution revenues 0.02 Lower interest costs 0.03 Lower share count 0.03 0.18 Increase in O&M (0.03) Increase in property taxes (0.02) Non-utility operations (0.02) (0.07) 0.11 EPS from normal operations - Q3 2010 (a) 0.93 $ (a) Excludes one-time charge of $0.20 per share associated with an income tax settlement |
 44 Creates New England’s premier energy provider which will have one of the most attractive total return profiles in the industry. Merger Summary |
 NU Appendix |
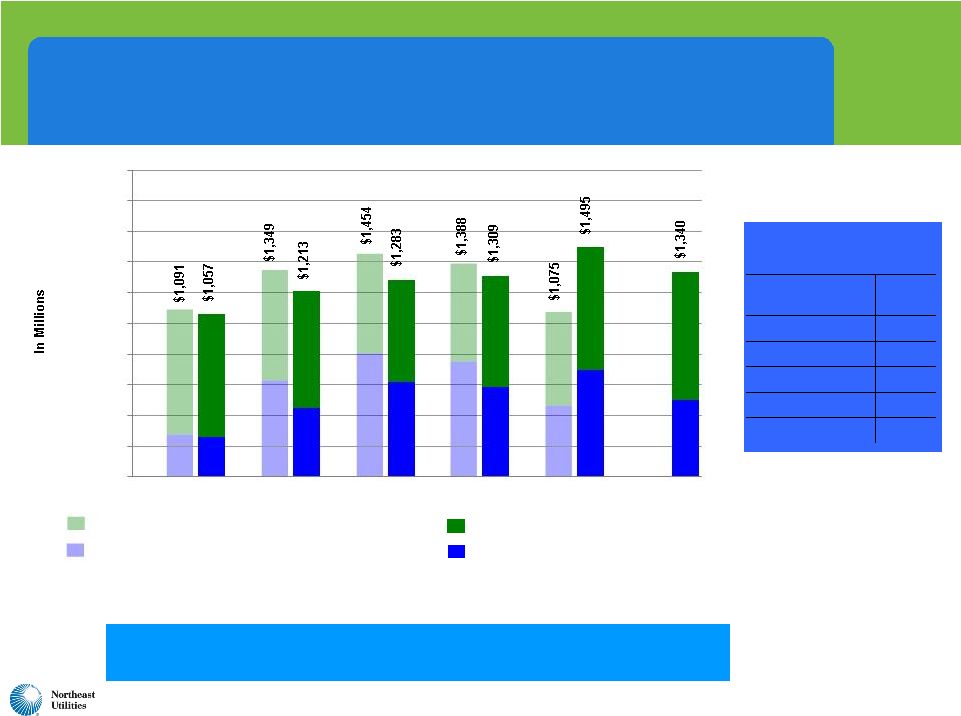
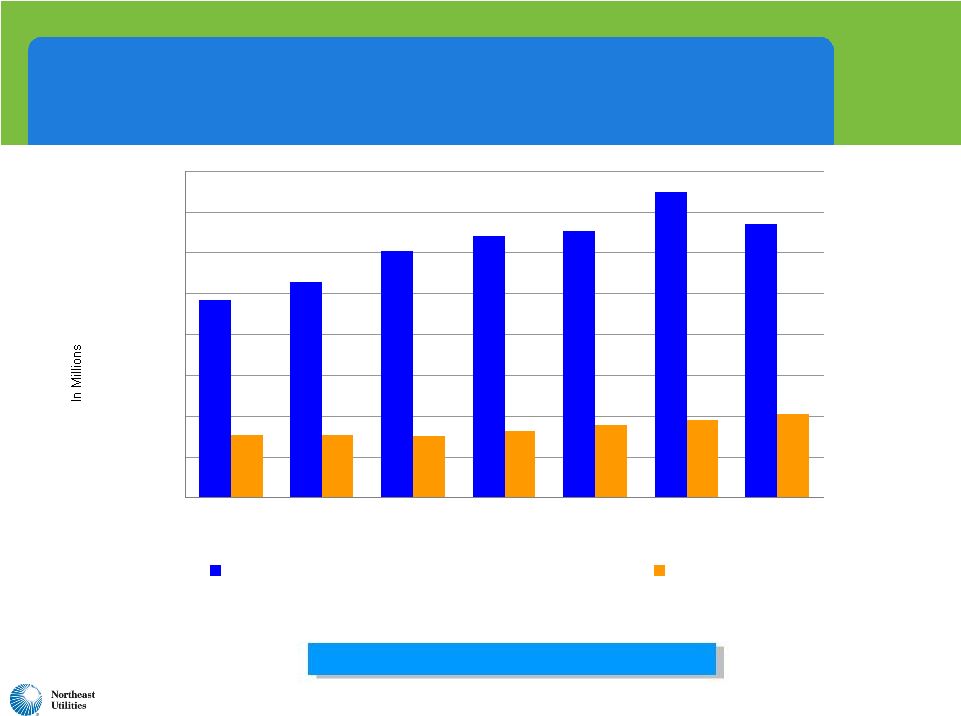 46 2009-2015: NU Projected Capital Expenditures and Depreciation $1,057 $1,213 $1,283 $969 $1,340 $1,495 $1,309 $310 $307 $305 $332 $359 $382 $413 $0 $200 $400 $600 $800 $1,000 $1,200 $1,400 $1,600 2009 Actual 2010 2011 2012 2013 2014 2015 Total Capex (incl. cost of removal and AFUDC)* Depreciation *Totals include capex at corporate service companies on behalf of operating companies of $53 million in 2009, and estimated at $69 million in 2010, $26 million in 2011, $19 million in 2012, $36 million in 2013, $34 million in 2014, and $26 million in 2015. Significant capital spending through 2015 |
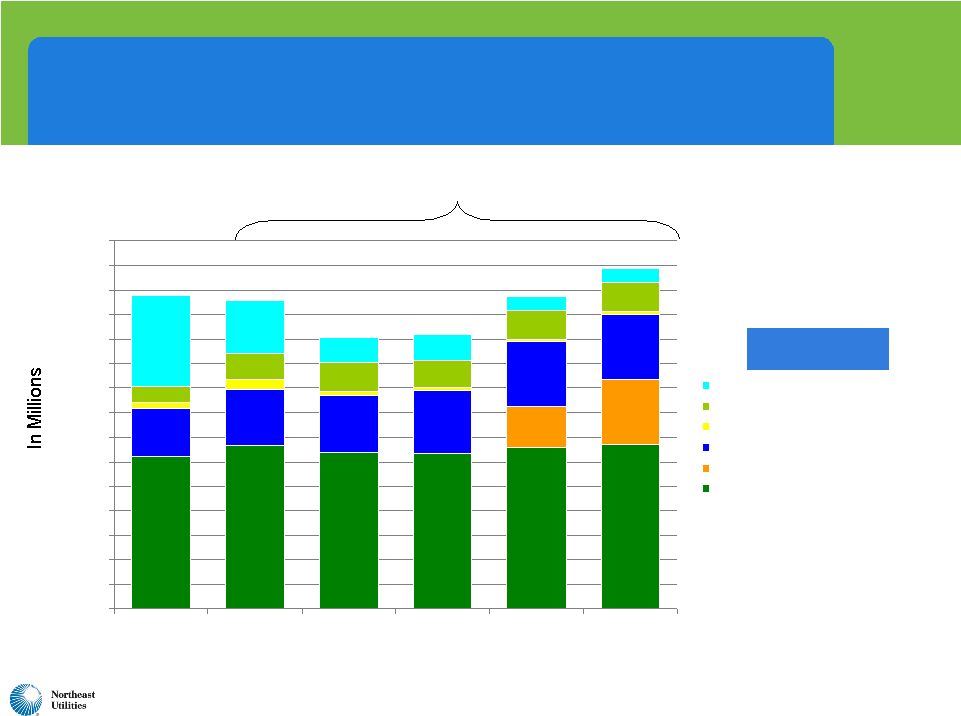
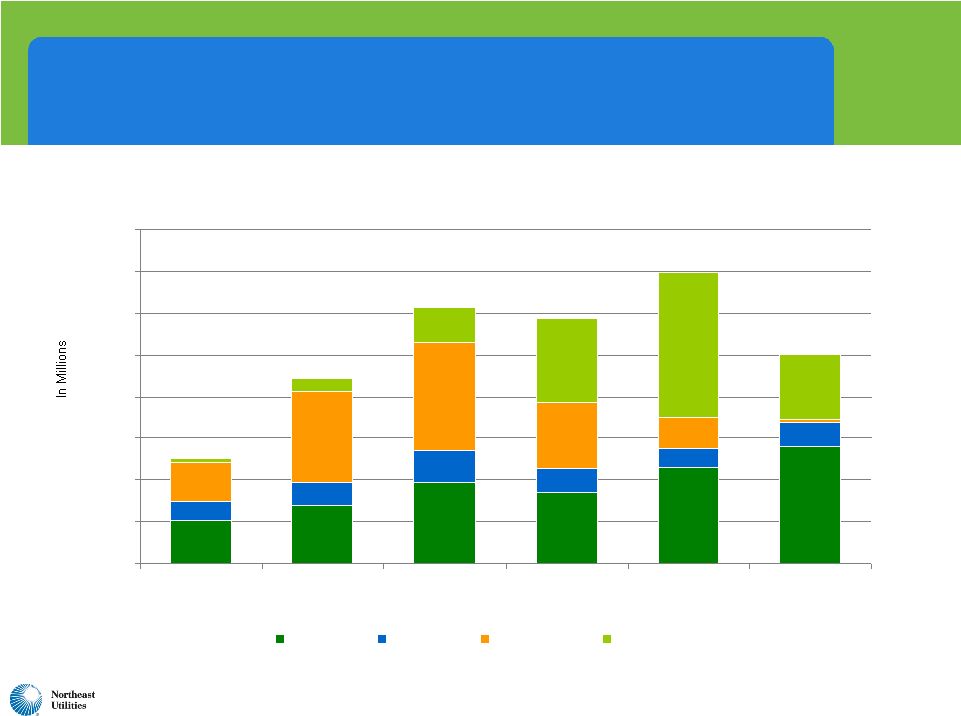 47 $102 $139 $194 $169 $229 $280 $45 $54 $75 $58 $45 $56 $94 $219 $260 $161 $75 $33 $84 $199 $348 $158 $7 $10 $0 $100 $200 $300 $400 $500 $600 $700 $800 2010 Projected 2011 2012 2013 2014 2015 CL&P PSNH WMECO Northern Pass NU Projected Transmission Capital Expenditures $251 $587 $697 $501 $613 $445 |
 48 $29 $32 $16 $33 $29 $29 $154 $77 $35 $20 $20 $5 $9 $5 $5 $12 $0 $50 $100 $150 $200 $250 2010 Projected 2011 2012 2013 2014 2015 PSNH Other PSNH Clean Air Project WMECO Solar Project NU Projected Generation Capital Expenditures $195 $60 $129 $34 $58 $34 |
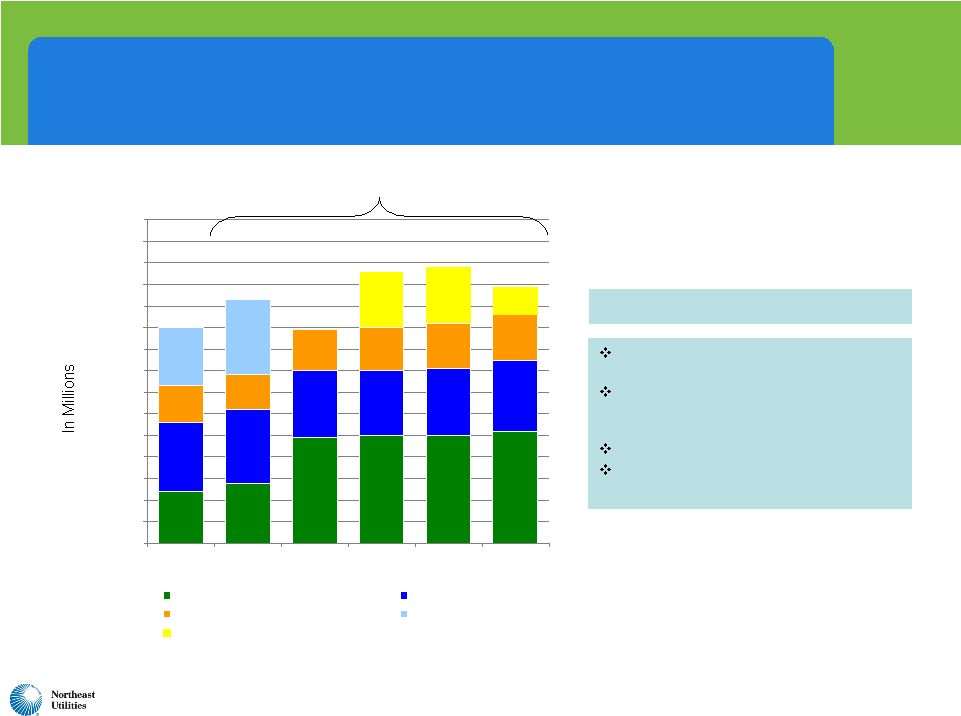
   49 NU Projected Distribution and Generation Year-End Rate Base $2,119 $2,322 $2,490 $2,717 $2,898 $3,154 $3,434 $772 $826 $896 $996 $1,079 $1,137 $1,207 $412 $423 $457 $483 $508 $531 $691 $714 $803 $864 $926 $986 $1,094 $407 $404 $428 $826 $839 $832 $815 $555 $0 $1,000 $2,000 $3,000 $4,000 $5,000 $6,000 $7,000 2009 Actual 2010 2011 2012 2013 2014 2015 CL&P Distribution PSNH Distribution WMECO Distribution Yankee Gas PSNH and WMECO Generation Projected Distribution & Generation Rate Base CAGR of 8.3% $4,401 $5,074 $5,886 $6,250 $6,640 $7,105 $4,689 |
 50 NU Projected Transmission Year-End Rate Base Transmission Rate Base CAGR of 10.7% $ 2,597 $ 2,745 $3,325 $3,458 $ 3,810 $ 4,792 *100% CWIP assumed for NEEWS projects $ 2,971 **NU share of this project is depicted as traditional rate base without CWIP during construction ** * * $2,099 $2,253 $2,303 $2,457 $2,609 $315 $329 $365 $421 $425 $522 $183 $220 $426 $651 $730 $795 $2,196 $2,180 $558 $831 $830 $0 $500 $1,000 $1,500 $2,000 $2,500 $3,000 $3,500 $4,000 $4,500 $5,000 2009 Actual 2010 2011 2012 2013 2014 2015 CL&P PSNH WMECO Northern Pass |
 51 NU Transmission Capital Program and Rate Base Grow Steadily 830 0 Northern Pass 4,792 2,597 Total NU 558 315 PSNH 795 183 WMECO 2,609 2,099 CL&P Projected 12/31/15 Rate Base ($ Millions) Actual 12/31/09 Rate Base ($ Millions) Operating Company Projected 10.7% Compound Annual Rate Base Growth 2009 2010 2011 2012 Fall 2008 EEI Conference 2009-2013 Capital Program -- $3.5 Billion 2013 2014 2010-2014 Capital Program -- $2.9 Billion Fall 2009 EEI Conference 2015 2011-2015 Capital Program -- $2.8 Billion Fall 2010 EEI Conference |
 52 $338 $301 $795 Estimated cost (Millions) Does not include $84 M Related Projects 12 mo. Behind Interstate Late 2013/ Early 2014 MA Substation – Q4 2010 Overhead lines - 2011 Begin Construction 12 mo. Behind Interstate Mid/Late 2013** CT – MA – Receive Decision and Order 12 mo. Behind Interstate Q4 2015 2013 Expected In-Service 12 mo. Behind Interstate Late 2012 Complete Evidentiary hearings 12 mo. Behind Interstate Mid/Late 2011 File siting application 2012 Hold open houses 2012 Conduct MCF outreach 2012 File Municipal Consultation Filing (MCF) Central Connecticut* Interstate Greater Springfield NEEWS Projects Milestones (as of 11/1/10) * Depends upon the timing of a favorable outcome of ISO’s reassessment of need and need dates, which is expected to occur by mid-2011. **Depends upon timing of favorable outcome of siting in three states (CT, MA and RI) |
 53 Other Transmission Capital Projects in RSP, Not in RSP or Not Required to be in RSP $0 $50 $100 $150 $200 $250 2010 2011 2012 2013 2014 2015 Not Required in RSP In RSP Not Yet in RSP 2011-2015 NU Transmission Capital Program Other Projects – In Millions CL&P WMECO PSNH Total $845 Million High confidence level in “Other Projects”, 91% in RSP or not required. 181 187 215 177 86 158 Projects not yet in Regional System Plan (RSP) Breakdown of Other Projects: • 36% ($300M) - in RSP • 55% ($466M) - not required to be in RSP • 9% ($79M) - not yet in RSP Note: Upon commencement of the ISO-NE approval process, the Northern Pass project will be included in the RSP Obsolete Equipment Repl. Prgm. $74.9 Berkshire Area Solution $70.0 Scobie - Tewksbury Line $38.9 Manchester - East Hartford Line $53.1 West Springfield S/S Rebuild $48.2 Deerfield 2nd Auto Transformer $37.3 Stamford Area Reliability $50.0 Obsolete Equipment Repl. Prgm. $22.3 Manchester Area Solution $35.4 Southwest CT Upgrades $30.0 115 KV Relay Replacements $6.9 Maine Power Reliablity $33.6 115 KV Hollow Core Insulaotor Repl $26.5 32 Additional Reliability Projects $30.2 Obsolete Equipment Replacements $29.6 115 KV Relay Replacements $13.3 Nashua Area Solution $28.4 South Meadow BPS $13.1 Eagle Substation $18.5 Eastern CT Upgrades $10.0 OPGW Communications Project $8.2 Wood H Frame Replacements $15.8 New Pease Substation $6.0 OPGW Communications Project $11.8 46 Additional Reliability Projects $51.8 New Sherwood Substation $7.2 Vehicle Purchases $7.6 71 Additional Reliability Projects $66.7 $380.0 $177.6 $287.7 |
 54 NU Generation Strategy WMECO Solar Initiative PSNH Generation Business Plan Installation of 6 MW solar projected by 2012 Estimated cost: $41 million Completed 1.8 MW of solar at first site in Pittsfield, MA in October 2010 Constructive regulatory model – fully tracking, segmented rate base Potential for up to 50 MW Five-year strategy preserves existing 1,200 MW New Hampshire fleet Completes the Merrimack Scrubber Estimated cost reduced from $457 million to $430 million $262.4 million capitalized at 9/30/10 Ahead of schedule: 75% complete as of 10/31/10 Assesses additional growth opportunities in renewables |
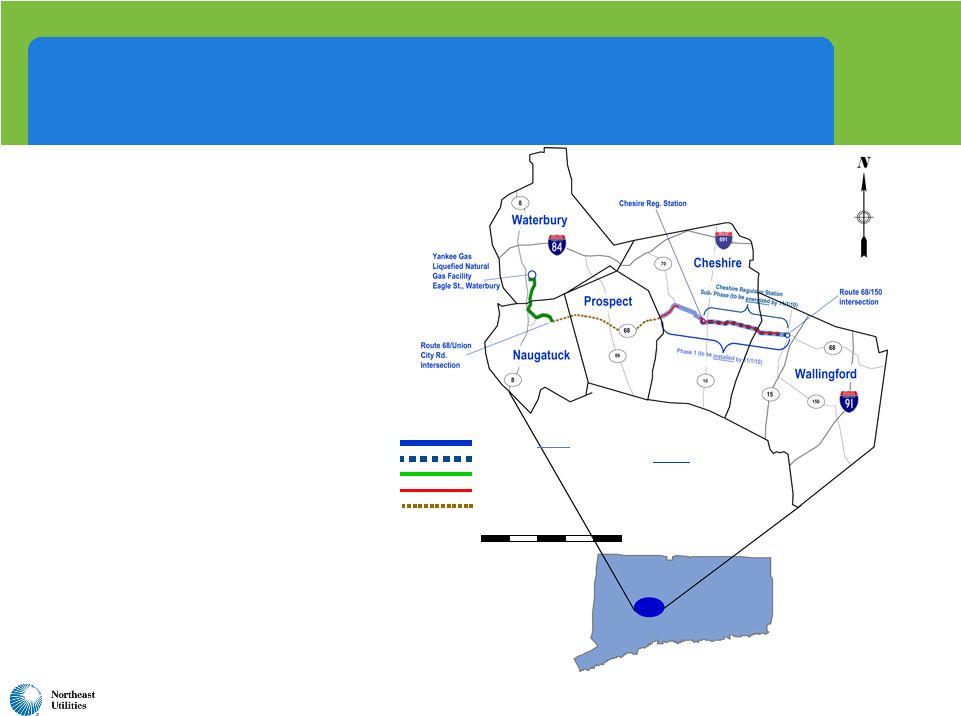 55 • Connecticut depends heavily on heating oil • Natural gas has significant cost advantages at today’s prices • Natural gas offers significantly lower emissions • Vehicle transportation market may emerge • Yankee Gas’ $63 million expansion project began in April 2010 (Waterbury to Wallingford Line Project); $19.6 million invested as of 9/30/10 Waterbury to Wallingford Project to Add Needed Pipeline Capacity to Growing Area Construction planned for 2011 FIVE MILES Phase 2A Pipeline Installed Construction planned for 2011 FIVE MILES Phase 2A Pipeline Installed Cheshire Regulator Station Sub-Phase (to be energized by 11/1/10) Phase 1 (to be installed by 11/1/10) |