Filed by Northeast Utilities Pursuant to Rule 425
Under the Securities Act of 1933
Subject Company: NSTAR
Commission File No.: 333-170754
 Barclays CEO Energy-Power Conference September 8, 2011 Jim Judge Senior Vice President and CFO David McHale Executive Vice President and CFO |
 2 NU Safe Harbor Provisions This presentation contains statements concerning NU’s expectations, beliefs, plans, objectives, goals, strategies, assumptions of future events, future financial performance or growth and other statements that are not historical facts. These statements are “forward-looking statements” within the meaning of the Private Securities Litigation Reform Act of 1995. In some cases, a listener or reader can identify these forward-looking statements through the use of words or phrases such as “estimate”, “expect”, “anticipate”, “intend”, “plan”, “project”, “believe”, “forecast”, “should”, “could”, and other similar expressions. Forward-looking statements are based on the current expectations, estimates, assumptions or projections of management and are not guarantees of future performance. These expectations, estimates, assumptions or projections may vary materially from actual results. Accordingly, any such statements are qualified in their entirety by reference to, and are accompanied by, the following important factors that could cause our actual results to differ materially from those contained in our forward-looking statements, including, but not limited to, actions or inaction of local, state and federal regulatory and taxing bodies; changes in business and economic conditions, including their impact on interest rates, bad debt expense and demand for our products and services; changes in weather patterns; changes in laws, regulations or regulatory policy; changes in levels and timing of capital expenditures; disruptions in the capital markets or other events that make our access to necessary capital more difficult or costly; developments in legal or public policy doctrines; technological developments; changes in accounting standards and financial reporting regulations; fluctuations in the value of our remaining competitive contracts; actions of rating agencies; the effects and outcome of our pending merger with NSTAR; and other presently unknown or unforeseen factors. Other risk factors are detailed from time to time in our reports to the Securities and Exchange Commission (SEC). Any forward-looking statement speaks only as of the date on which such statement is made, and we undertake no obligation to update the information contained in any forward-looking statements to reflect developments or circumstances occurring after the statement is made or to reflect the occurrence of unanticipated events. This presentation references actual and projected EPS by business. EPS by business is a non-GAAP (not determined using generally accepted accounting principles) measure that is calculated by dividing the net income or loss attributable to controlling interests of each business by the weighted average diluted NU parent common shares outstanding for the period. Management uses this non-GAAP financial measure to evaluate earnings results and to provide details of earnings results and guidance by business. This presentation also includes non-GAAP financial measures referencing our 2006 - 2010 EPS excluding a number of factors that affected GAAP earnings in those years. In addition, our 2011 earnings guidance excludes certain non-recurring charges related to merger costs we expect to incur during 2011, which is a non-GAAP financial measure. Management believes that these non-GAAP financial measurements are useful to investors to evaluate the actual and projected financial performance and contribution of NU’s businesses. Non-GAAP financial measures should not be considered as alternatives to NU consolidated net income attributable to controlling interests or EPS determined in accordance with GAAP as indicators of NU’s operating performance. |
 3 NU Safe Harbor Provisions Information Concerning Forward-Looking Statements Relating to the NU–NSTAR Merger Additional Information and Where To Find It In addition to historical information, this communication may contain a number of “forward-looking statements” as defined in the Private Securities Litigation Reform Act of 1995. Words such as anticipate, expect, project, intend, plan, believe, and words and terms of similar substance used in connection with any discussion of future plans, actions, or events identify forward-looking statements. Forward-looking statements relating to the proposed merger include, but are not limited to: statements about the benefits of the proposed merger involving NSTAR and Northeast Utilities, including future financial and operating results; NSTAR’s and Northeast Utilities’ plans, objectives, expectations and intentions; the expected timing of completion of the transaction; and other statements relating to the merger that are not historical facts. Forward-looking statements involve estimates, expectations and projections and, as a result, are subject to risks and uncertainties. There can be no assurance that actual results will not materially differ from expectations. Important factors could cause actual results to differ materially from those indicated by such forward-looking statements. With respect to the proposed merger, these factors include, but are not limited to: the risk that NSTAR or Northeast Utilities may be unable to obtain governmental and regulatory approvals required for the merger, or required governmental and regulatory approvals may delay the merger or result in the imposition of conditions that could reduce the anticipated benefits from the merger or cause the parties to abandon the merger; the risk that a condition to closing of the merger may not be satisfied; the length of time necessary to consummate the proposed merger; the risk that the businesses will not be integrated successfully; the risk that the cost savings and any other synergies from the transaction may not be fully realized or may take longer to realize than expected; disruption from the transaction making it more difficult to maintain relationships with customers, employees or suppliers; the diversion of management time on merger-related issues; the effect of future regulatory or legislative actions on the companies; and the risk that the credit ratings of the combined company or its subsidiaries may be different from what the companies expect. These risks, as well as other risks associated with the merger, are more fully discussed in the joint proxy statement/prospectus that is included in the Registration Statement on Form S-4 (Registration No. 333-170754) that was filed by Northeast Utilities with the SEC in connection with the merger. Additional risks and uncertainties are identified and discussed in NSTAR’s and Northeast Utilities’ reports filed with the SEC and available at the SEC’s website at www.sec.gov. Forward-looking statements included in this document speak only as of the date of this document. Neither NSTAR nor Northeast Utilities undertakes any obligation to update its forward-looking statements to reflect events or circumstances after the date of this document. This communication does not constitute an offer to sell or the solicitation of an offer to buy any securities or a solicitation of any vote or approval. In connection with the proposed merger between Northeast Utilities and NSTAR, Northeast Utilities filed with the SEC a Registration Statement on Form S-4 (Registration No. 333-170754) that includes a joint proxy statement of Northeast Utilities and NSTAR that also constitutes a prospectus of Northeast Utilities. Northeast Utilities and NSTAR mailed the definitive joint proxy statement/prospectus to their respective shareholders, on or about January 5, 2011. Northeast Utilities and NSTAR urge investors and shareholders to read the joint proxy statement/prospectus regarding the proposed merger, as well as other documents filed with the SEC, because they contain important information. You may obtain copies of all documents filed with the SEC regarding this proposed transaction, free of charge, at the SEC’s website (www.sec.gov). You may also obtain these documents, free of charge, from Northeast Utilities’ website (www.nu.com) under the tab “Investors” and then under the heading "Financial/SEC Reports.” You may also obtain these documents, free of charge, from NSTAR’s website (www.nstar.com) under the tab “Investor Relations.” Please refer to our reports to the SEC for further details concerning the matters described in this presentation. |
 4 NSTAR Safe Harbor Provisions Information Concerning Forward-Looking Statements Additional Information and Where to Find It In addition to historical information, this presentation may contain a number of “forward-looking statements” as defined in the Private Securities Litigation Reform Act of 1995. Words such as anticipate, expect, project, intend, plan, believe, and words and terms of similar substance used in connection with any discussion of future plans, actions, or events identify forward-looking statements. Forward-looking statements relating to the pending merger include, but are not limited to: statements about the benefits of the pending merger involving NSTAR and Northeast Utilities, including future financial and operating results; NSTAR’s and Northeast Utilities’ plans, objectives, expectations and intentions; the expected timing of completion of the transaction; and other statements relating to the merger that are not historical facts. Forward-looking statements involve estimates, expectations and projections and, as a result, are subject to risks and uncertainties. There can be no assurance that actual results will not materially differ from expectations. Important factors could cause actual results to differ materially from those indicated by such forward-looking statements. With respect to the pending merger, these factors include, but are not limited to: the risk that NSTAR or Northeast Utilities may be unable to obtain governmental and regulatory approvals required for the merger, or required governmental and regulatory approvals may delay the merger or result in the imposition of conditions that could reduce the anticipated benefits from the merger or cause the parties to abandon the merger; the risk that a condition to closing of the merger may not be satisfied; the length of time necessary to consummate the pending merger; the risk that the businesses will not be integrated successfully; the risk that the cost savings and any other synergies from the transaction may not be fully realized or may take longer to realize than expected; disruption from the transaction making it more difficult to maintain relationships with customers, employees or suppliers; the diversion of management time on merger-related issues; the effect of future regulatory or legislative actions on the companies; and the risk that the credit ratings of the combined company or its subsidiaries may be different from what the companies expect. These risks, as well as other risks associated with the merger, are more fully discussed in the joint proxy statement/prospectus that is included in the definitive proxy statement that was filed by NSTAR with the Securities and Exchange Commission (SEC) on January 5, 2011 and the Registration Statement on Form S-4 (Registration No. 333-170754) that was filed by Northeast Utilities with the SEC in connection with the merger. Additional risks and uncertainties are identified and discussed in NSTAR’s and Northeast Utilities’ reports filed with the SEC and available at the SEC’s website at www.sec.gov. Forward-looking statements included in this document speak only as of the date of this document. Neither NSTAR nor Northeast Utilities undertakes any obligation to update its forward-looking statements to reflect events or circumstances after the date of this document. This presentation does not constitute an offer to sell or the solicitation of an offer to buy any securities. In connection with the pending merger between Northeast Utilities and NSTAR, Northeast Utilities filed with the SEC a Registration Statement on Form S-4 (Registration No. 333- 170754) that includes a joint proxy statement of Northeast Utilities and NSTAR that also constitutes a prospectus of Northeast Utilities. Northeast Utilities and NSTAR first mailed the definitive joint proxy statement/prospectus to their respective shareholders, on or about January 5, 2011. Northeast Utilities and NSTAR urge investors and shareholders to read the joint proxy statement/prospectus regarding the pending merger, as well as other documents filed with the SEC, because they contain important information. You may obtain copies of all documents filed with the SEC regarding this proposed transaction, free of charge, at the SEC’s website (www.sec.gov). You may also obtain these documents, free of charge, from Northeast Utilities’ website (www.nu.com) under the tab “Investors” and then under the heading "Financial/SEC Reports.” You may also obtain these documents, free of charge, from NSTAR’s website (www.nstar.com) under the tab “Investor Relations.” |
 5 Topics for Today • NU Update – Transmission projects – Financial performance • Merger Update • NSTAR Financial Update |
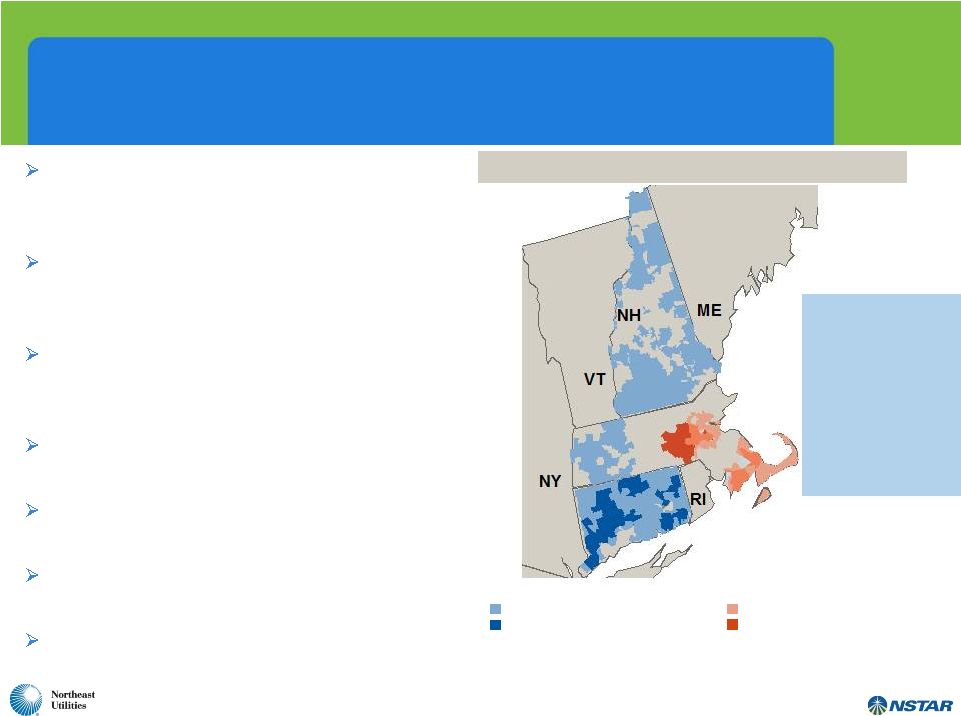 6 A Compelling Combination – Creates Largest Utility Company in New England Significant infrastructure investment opportunities combined with balance sheet strength provides for substantial growth potential Larger, diverse and better positioned to support economic growth and state public policy initiatives in New England Expected to be accretive to earnings in Year 1, provides an enhanced total shareholder return proposition Enhances service quality capabilities for the largest customer base in New England Highly experienced and complementary leadership team with proven track record 100% stock transaction – 1.312 shares of Northeast Utilities per NSTAR share 56% Northeast Utilities shareholders 44% NSTAR shareholders NSTAR Electric Service Area NSTAR Gas Service Area Northeast Utilities Electric Service Area Northeast Utilities Gas Service Area Combined Service Territory • 3 million electric customers • 500,000 natural gas customers • 4,500 miles electric transmission • 72,000 miles electric distribution • 6,300 miles gas distribution MA |
 7 Transmission Update |
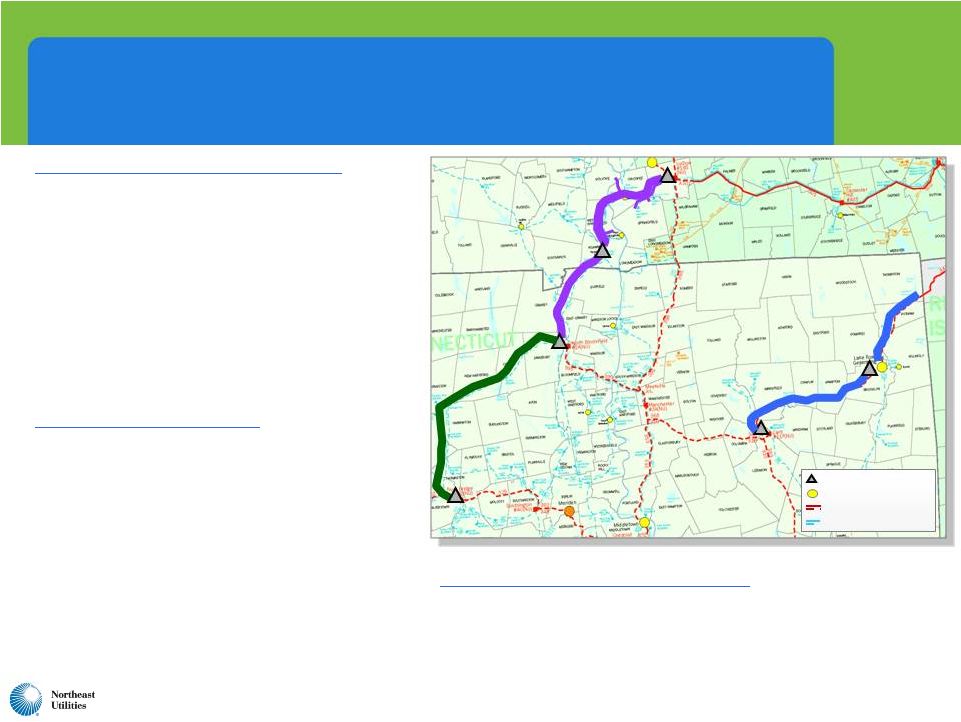 8 NEEWS Projects Advance Current Status Report • Substation construction commenced in MA in Dec. 2010; in CT in July/August 2011 • Commenced overhead site work in MA in February 2011 • Commence overhead construction in CT in early 2012 following receipt of environmental permits • Projected in-service: late 2013 • Total projected NU cost: $718 million Interstate Reliability Project • Joint project with National Grid (NU in CT; NGrid in MA & RI) • ISO-NE confirmed need in August 2010 • File siting application in CT in late 2011 • Siting decisions in 2013 • Commence construction: late 2013/early 2014 • Projected in-service: late 2015 • Total projected NU cost: $218 million Central Connecticut Reliability Project • Expected review to be completed and needs identified in late 2011 with specific projects identified in late 2012 • Total projected NU cost: $301 million SPRINGFIELD HARTFORD 345-kV Substation Generation Station 345-kV ROW 115-kV ROW Central Connecticut Reliability Project Interstate Reliability Project Greater Springfield Reliability Project Greater Springfield Reliability Project |
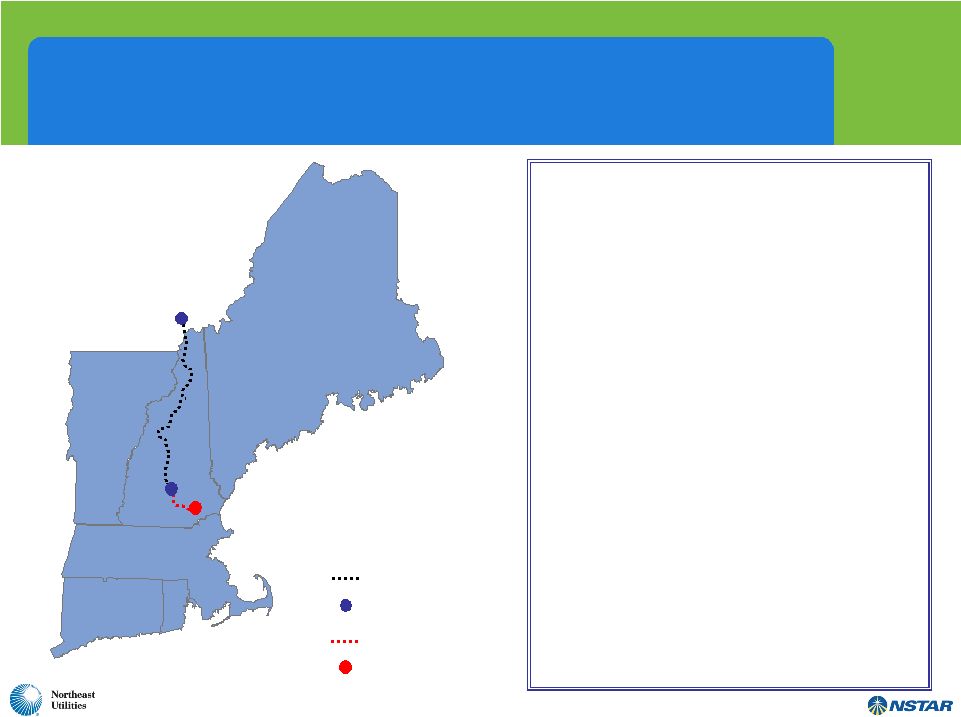 9 Northern Pass Transmission – a $1.1 Billion Capital Investment ´ • To be owned by Northern Pass Transmission LLC - NU (75%) and NSTAR (25%) • 1,200 MW transfer capability • Northern terminus at Des Cantons (Québec), southern terminus in Franklin (New Hampshire) • Québec terminal will convert the power from AC to DC (rectifier) • US terminal will convert the power from DC to AC (inverter) • 345kV AC leg from Franklin to Deerfield, NH • TSA signed in October 2010 and accepted by FERC on February 11, 2011 • Permitting process began October 14, 2010 with U.S. DOE application – comment period recently extended; U.S. Forest Service application filed June 28 • New Hampshire Senate voted June 2 to “re-refer” eminent domain bill • Capital cost estimate for US segment: $1.1 billion – completion projected for late 2016 Des Cantons HVDC Line HVDC Converter Station 345-kV Line Existing Deerfield Substation Deerfield Franklin |
 10 Review of FERC-Approved Transmission ROEs 10.00% 10.50% 11.00% 11.50% 12.00% 12.50% 13.00% 13.50% Local Network Service Regional Network Service Base Northern Pass 2005-2008 Regional Projects NEEWS M-N Underground NU’s Local Network Service Tariff ROE NE RTO Incentive adder of 50 basis points on PTF assets ISO-NE Planned Regional PTF projects in-service before 1/1/09 Middletown-Norwalk Advanced Tech. underground cable system 125 basis point NEEWS incentive 142 basis point Northern Pass incentive 11.14% 12.64% 12.89% 13.10% 12.56% 11.64% |
 11 NU Financial Update |
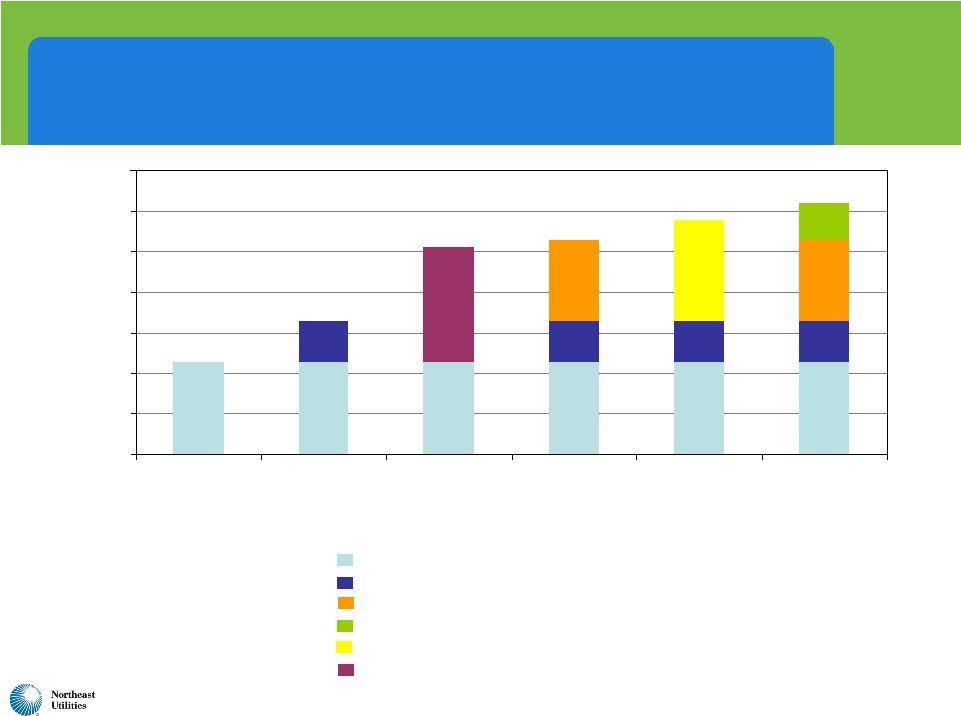
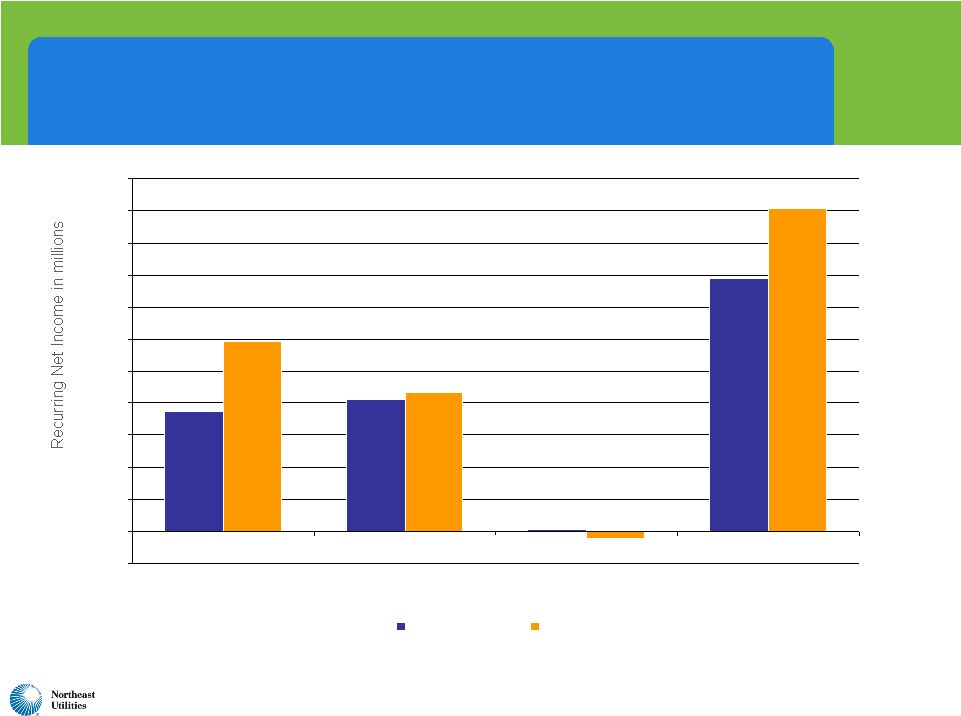 12 $82.1 $158.2 $1.1 $75.0 $200.9 -$4.5 $86.9 $118.5 -$20.0 $0.0 $20.0 $40.0 $60.0 $80.0 $100.0 $120.0 $140.0 $160.0 $180.0 $200.0 $220.0 1H 2010 1H 2011 NU – Strong First Half Earnings Distribution/Generation Transmission Parent/Other Total *Excludes $9.5 million of after-tax merger-related expenses in 2011 * * |
 13 Hurricane Irene Impacts on Second Half of 2011 • Approximately 800,000 NU customers lost service at peak on August 28 due to Irene—most damaging storm in NU’s history • Restoration now virtually complete • CL&P suffered the most extensive damage, particularly along Long Island Sound and in Eastern Connecticut • 1,800 line and tree crews worked on restoration • Total cost likely to exceed $100 million • Will negatively affect cash flows in second half of 2011 • Catastrophic storm deferral mechanisms in place for CL&P, PSNH and WMECO |
 14 2009 and 2010 Results and Standalone 2011 Guidance 2009 Actual 2010 Actual Revised 2011 Guidance NU Consolidated EPS (GAAP) $1.91 $2.19 $2.10 - $2.20 Distribution/Generation $0.92 $1.16 $1.30 - $1.35 Transmission $0.95 $1.00 $1.05 – $1.10 Competitive $0.09 $0.05 N/A NU Parent/Other ($0.05) ($0.05)* ($0.05)** NU Consolidated EPS (Non-GAAP) $1.91 $2.16* $2.30 – $2.40** * Excludes a $0.09/share fourth quarter non-recurring tax gain at NU Parent and approximately $0.06 of NU-NSTAR merger-related expenses that were recorded in the fourth quarter. **Excludes $0.20/share of expected NU-NSTAR merger-related costs. Includes competitive results. |
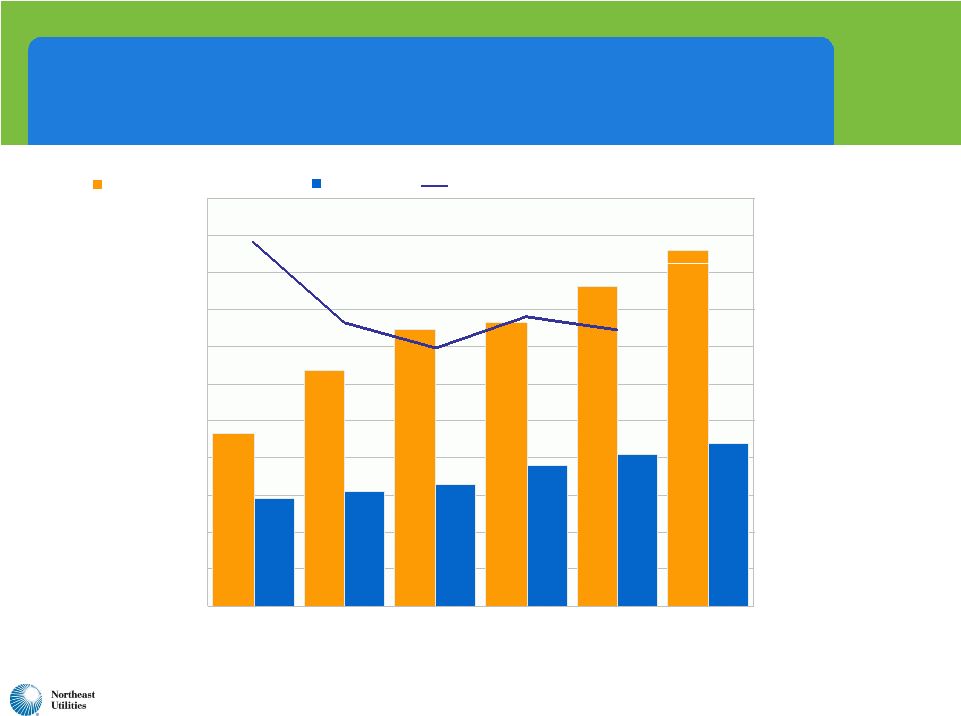 15 NU – Improved Earnings Have Resulted in Rising Dividends 62.5% 48.7% 44.3% 49.7% $2.16 ³ $1.86² $1.16¹ $1.59 $0.825 $0.775 $0.725 $0.95 Payout ratios EPS Dividends paid/declared per share 1 Excludes net income of competitive businesses, one-time CL&P tax reduction 2 Excludes litigation settlement charge 3 Excludes NU tax settlement, NU-NSTAR merger costs $1.91 $1.025 47.5% $2.30 - 2.40 4 $1.10 5 4 Excludes NU-NSTAR merger costs 5 Based on first, second and third quarter rate of $0.275 $0.00 $0.25 $0.50 $0.75 $1.00 $1.25 $1.50 $1.75 $2.00 $2.25 $2.50 $2.75 2006 2007 2008 2009 2010 2011E 0.0% 10.0% 20.0% 30.0% 40.0% 50.0% 60.0% 70.0% |
 16 Merger Update |
 17 Status of Merger Approvals Securities and Exchange Commission Shareholders Department of Justice Federal Communications Commission Federal Energy Regulatory Commission Maine DPUC Massachusetts DPU Nuclear Regulatory Commission Approvals Received Applications Pending Connecticut PURA New Hampshire PUC Determined Not To Have Jurisdiction |
 18 Massachusetts Hearings on Merger • Hearings ended July 28 • Net benefits study anticipates $784M in net savings over 10 years Elimination of duplicative efforts Adoption of best practices Attrition/retirements – 350 positions over time • Attorney General’s focus: Customer benefits • Other interveners’ focus: Environmental benefits, labor impacts • Briefing schedule revised: Final briefs due by October 18 • DOER’s motion to stay proceedings – Oral Arguments October 25 • Companies continue integration work focused on Day 1 readiness th th th |
 19 NSTAR Financial Update |
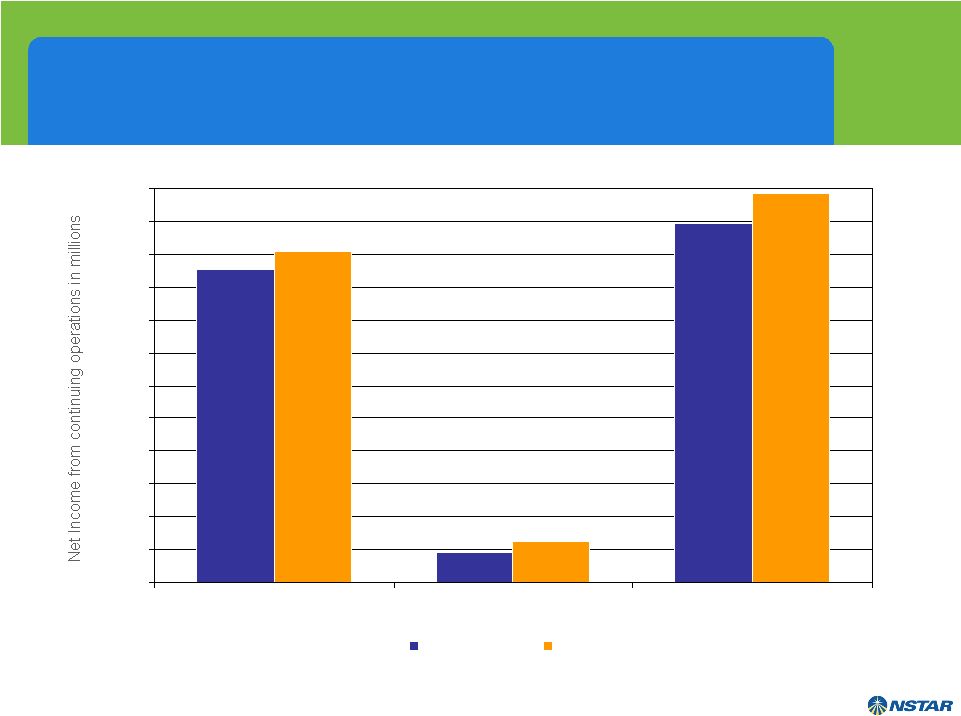 20 $14.0 $114.5 $100.5 $123.4 $17.6 $105.8 $5.0 $15.0 $25.0 $35.0 $45.0 $55.0 $65.0 $75.0 $85.0 $95.0 $105.0 $115.0 $125.0 Electric Gas Consolidated 1H 2010 1H 2011 NSTAR’s Solid First Half Exceeds Expectations Note: Results reflect continuing operations excluding merger-related costs of $5.9 million. EPS $1.19 EPS $1.07 |
 NSTAR System Has Significant Transmission Investment Ahead • Transmission Rate Base is expected to double within 5 years to approximately $1.6 billion • Growth/reliability spending averages $100 million per year • Incremental Major Projects: – Cape Cod Line – Boston 345kV Connection – Mid Cape Line • Northern Pass $120 million $45-$50 million $25-$30 million $280 million (2011-2012) (2014-2015) (2013-2014) (2014-2016) 21 |
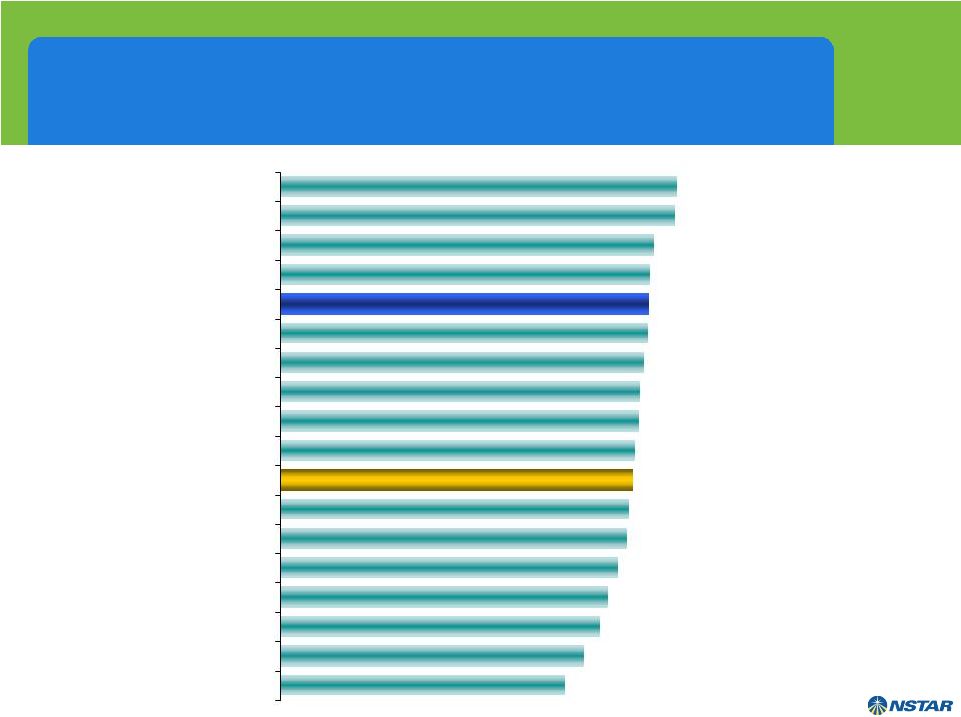
 22 Highest Credit Rating in the Industry #1 NSTAR A+ *As published by EEI NSTAR A+ Southern Company A Consolidated Edison, Inc. A- Dominion Resources, Inc. A- DPL Inc. A- Duke Energy Corporation A- Energy East Corporation A- NextEra Energy, Inc. A- KeySpan Corp. A- Niagara Mohawk Power Corporation A- Vectren Corporation A- Wisconsin Energy Corporation A- Xcel Energy Inc. A- ALLETE, Inc. BBB+ Alliant Energy Corporation BBB+ DTE Energy Company BBB+ Integrys Energy Group, Inc. BBB+ Kentucky Utilities Company BBB+ Louisville Gas and Electric Company BBB+ MDU Resources Group, Inc. BBB+ MidAmerican Energy Holdings Company BBB+ Northeast Utilities BBB+ OGE Energy Corp. BBB+ Pepco Holdings, Inc. BBB+ PG&E Corporation BBB+ PPL Corporation BBB+ Progress Energy, Inc. BBB+ SCANA Corporation BBB+ Sempra Energy BBB+ TECO Energy, Inc. BBB+ American Electric Power Company, Inc. BBB Avista Corporation BBB CenterPoint Energy, Inc. BBB Cleco Corporation BBB El Paso Electric Company BBB Entergy Corporation BBB Exelon Corporation BBB Great Plains Energy Inc. BBB Green Mountain Power Corporation BBB IDACORP, Inc. BBB NorthWestern Corporation BBB Pinnacle West Capital Corporation BBB Portland General Electric Company BBB Public Service Enterprise Group Inc. BBB UIL Holdings Corporation BBB Westar Energy, Inc. BBB Allegheny Energy, Inc. BBB- Ameren Corporation BBB- Black Hills Corporation BBB- CMS Energy Corporation BBB- Constellation Energy Group, Inc. BBB- Duquesne Light Company BBB- Edison International BBB- Empire District Electric Company BBB- FirstEnergy Corp. BBB- Hawaiian Electric Industries, Inc. BBB- IPALCO Enterprises, Inc. BBB- NiSource Inc. BBB- Otter Tail Corporation BBB- Puget Energy, Inc. BB+ NV Energy, Inc. BB+ PNM Resources, Inc. BB- |
 23 J.D. Power Survey Recognizes Customer Service Efforts Company A Company B Company C Company D NSTAR Company E Company F Company G Company H Company I EAST LARGE AVERAGE Company J Company K Company L Company M Company N Company O Company P |
 24 NSTAR Total Shareholder Return Outperforms the Industry 1996 2010 $1,000 $2,000 $3,000 $4,000 $5,000 $6,000 Only Company in Any Industry to Deliver 14 Consecutive Years of Positive Total Shareholder Return S&P 500 Utility Index NSTAR |
 25 • Combines two highly successful energy delivery companies with similar strategies • Matches NSTAR’s distribution expertise and strong cash flows with NU’s nationally recognized transmission organization and significant investment opportunities • Larger, diverse and better-positioned company to support economic growth and public policy initiatives for the region • Clearly meets new Massachusetts “net benefit” standard with customer benefits across 3 states: Projected net cost savings of $784M over 10 years Significant environmental benefits expected • Attractive shareholder investment opportunity: Track record of top performance Low risk investment profile Strong credit ratings Greater liquidity for investors • In short, a truly compelling transaction with significant strategic, customer, regional and shareholder benefits Key Takeaways on the Merger |
 Appendix |
 27 Improved Results Due In Part to Resolution of All Three Electric Distribution Rate Cases • Five-year settlement approved by NHPUC on 6/28/2010 • $45.5 million increase on 7/1/10 in addition to 8/1/09 temporary increase of $25.6 million • $2.3 million decrease on 7/1/11 • 2012 & 2013 projected increases of $9.5 million & $11.1 million • Authorized ROE remains 9.67% • Recovery of ice storm costs over 7 years • Trailing 12-month ROE = 10.3% • Final decision 6/30/2010 • $63.4 million increase effective 7/1/10 • $38.5 million increase effective 7/1/11 • Authorized 9.4% ROE at 6/30/10 • 49.2% equity in capital structure • Initial increase deferred until 1/1/11 • Capex plan approved • Trailing 12-month ROE = 9.8% PSNH CL&P • Final decision 1/31/11 • $16.8 million increase effective 2/1/11 • Authorized 9.6% ROE • Decoupling approved • $2.1 million write-off taken in fourth quarter 2010 • Trailing 12-month ROE = 6.5% WMECO |
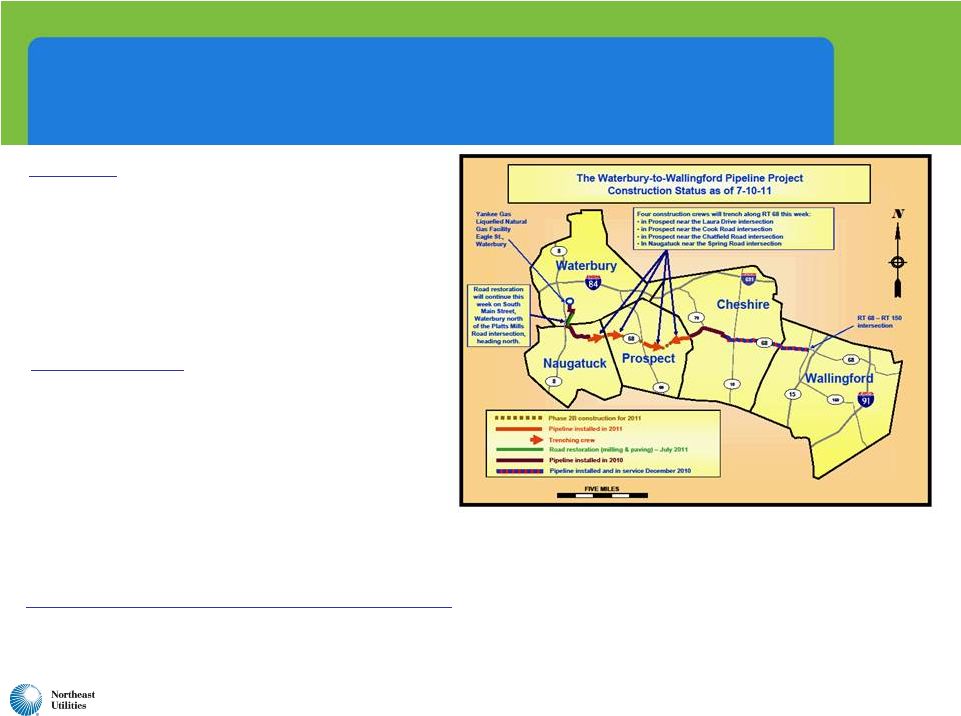 28 Yankee Gas Rate Decision Less Supportive The Good • Supported full projected cost of Waterbury to Wallingford line • Supported ramp-up to $40 million annual spending for pipeline replacement • Authorized capital structure of 52.2% equity; 47.8% debt The Not So Good • 8.83% authorized ROE • First-year rate cut of about $0.5 million; second-year increase of $6.7 million • Request was $29.1 million increase Year One and $10.3 million increase Year Two • Numerous disallowed costs • Imputation of $1.6 million of merger savings Year One and $3 million in Year Two Motion for Reconsideration Filed With the PURA • Reconsideration was granted August 2 - ADIT impacts only |
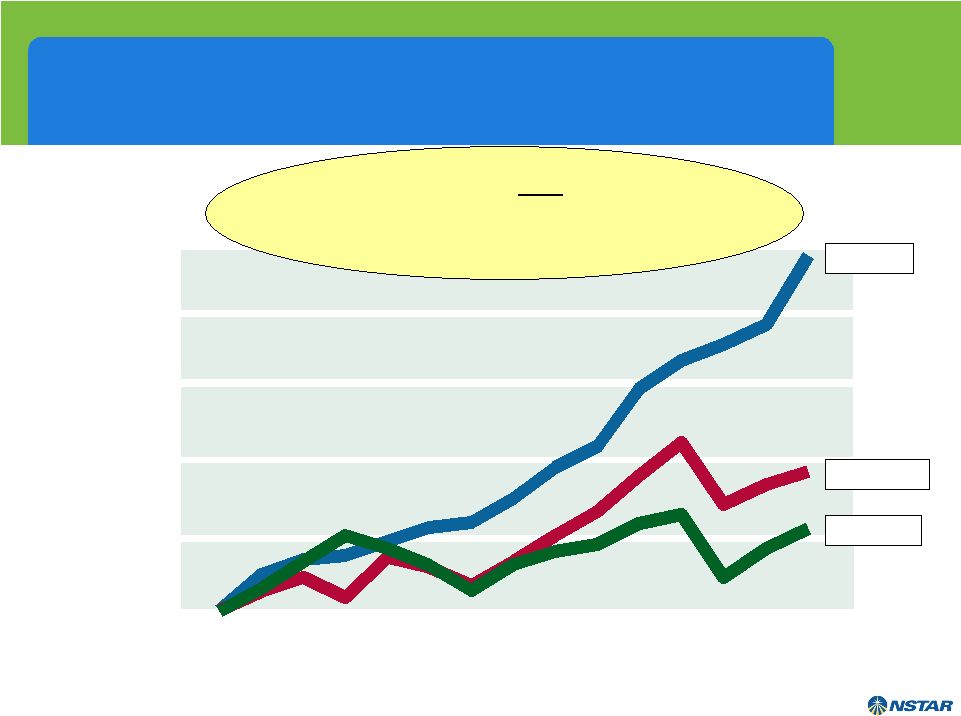
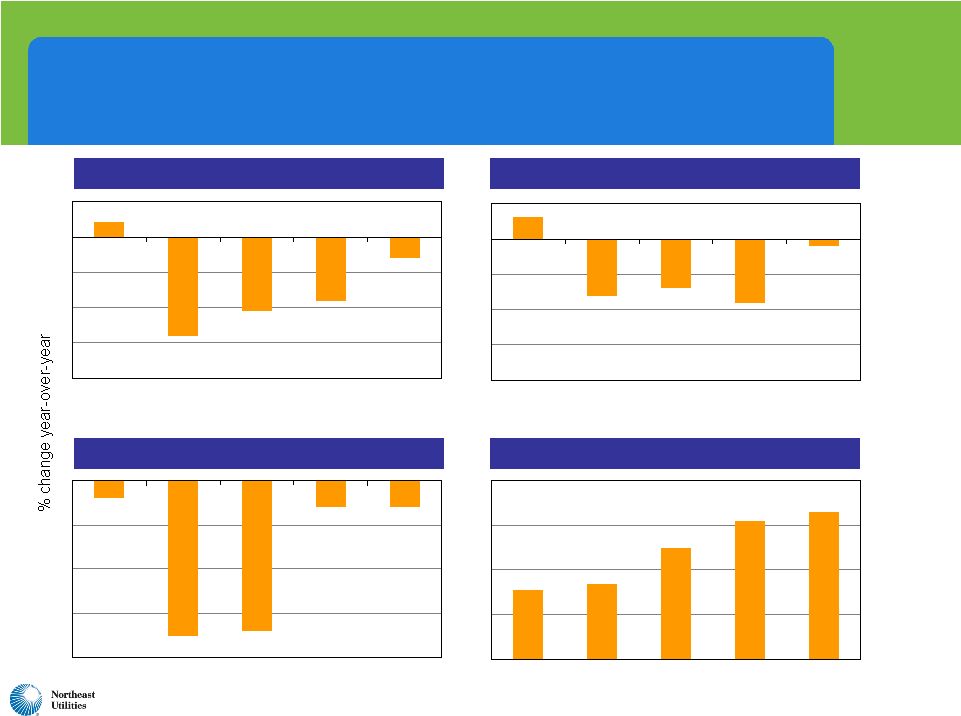 29 NU Weather-Adjusted Retail Sales Trends -2.8 -2.1 -1.8 -0.6 0.4 CL&P 2007 2008 2009 2010 2011 YTD -1.4 -1.8 -0.2 -1.6 0.6 2007 2008 2009 2010 2011 YTD PSNH -0.6 -0.6 -3.4 -3.5 -0.4 WMECO 2007 2008 2009 2010 2011 YTD 3.4 6.2 6.6 5.0 3.1 2007 2008 2009 2010 2011 YTD Yankee Gas (firm) |
 30 2006 – 2011 NU Consolidating EPS GAAP / Non-GAAP Reconciliation (0.20) (0.06) N/A N/A N/A N/A NU-NSTAR Merger Expenses N/A 0.09 N/A N/A N/A N/A NU Tax Settlement $2.19 N/A N/A N/A $2.16 0.05 $2.11 (0.05) 2.16 1.00 $1.16 2010 Actual $2.10 - $2.20 N/A N/A N/A $2.30 – $2.40 N/A $2.30 – $2.40 (0.05) 2.35 – 2.45 1.05 – 1.10 $1.30 – $1.35 2011 Guidance $1.91 $1.67 $1.59 $3.05 NU Consolidated (GAAP) N/A (0.19) N/A N/A Litigation Charge N/A N/A N/A 2.04 Gain on Sale of Competitive Generation N/A N/A N/A 0.48 CL&P Income Tax Reduction $1.91 $1.86 $1.59 $0.53 NU Consolidated Operating Results (Non-GAAP) 0.09 0.08 0.08 (0.63) Competitive $1.82 $1.78 $1.51 $1.16 Total Regulated and Parent (0.05) (0.07) 0.04 (0.03) NU Parent/Other 1.87 1.85 1.47 1.19 Total Regulated 0.95 0.89 0.53 0.39 Transmission $0.92 $0.96 $0.94 $0.80 Distribution/Generation 2009 Actual 2008 Actual 2007 Actual 2006 Actual |
 31 NSTAR…20 Consecutive Years of Operating Earnings Growth $1.93 $2.07 $2.22 $2.37 $2.56 2006 2007 2008 2009 2010 2011 Guidance $2.60 – $2.75 |
 32 $1.30 $1.40 $1.50 $1.60 $1.70 NSTAR – Consistent, Above Average Dividend Growth …13 Consecutive Years of Increase… 2006 2007 2008 2009 2010 |
 33 NSTAR Rate Cases • Effective January 1, 2006 to December 31, 2012 • Customers’ overall delivery rates flat • Annual inflation-adjusted distribution rate change offset by transition charge • Allowed ROE of 10.5% (8.5% to 12.5% band) • Recovery of Incremental Safety & Reliability Program Costs • Included new service quality and additional service programs • Last rate case effective November 1, 1991 Electric Gas |