Filed by NSTAR Pursuant to Rule 425
Under the Securities Act of 1933
Subject Company: NSTAR
Commission File No.: 001-14768
 EEI Financial Conference NOVEMBER 7, 2011 |
 2 NU Safe Harbor Provisions This presentation contains statements concerning NU’s expectations, beliefs, plans, objectives, goals, strategies, assumptions of future events, future financial performance or growth and other statements that are not historical facts. These statements are “forward-looking statements” within the meaning of the Private Securities Litigation Reform Act of 1995. In some cases, a listener or reader can identify these forward-looking statements through the use of words or phrases such as “estimate”, “expect”, “anticipate”, “intend”, “plan”, “project”, “believe”, “forecast”, “should”, “could”, and other similar expressions. Forward-looking statements are based on the current expectations, estimates, assumptions or projections of management and are not guarantees of future performance. These expectations, estimates, assumptions or projections may vary materially from actual results. Accordingly, any such statements are qualified in their entirety by reference to, and are accompanied by, the following important factors that could cause our actual results to differ materially from those contained in our forward-looking statements, including, but not limited to, actions or inaction of local, state and federal regulatory and taxing bodies; changes in business and economic conditions, including their impact on interest rates, bad debt expense and demand for our products and services; changes in weather patterns; changes in laws, regulations or regulatory policy; changes in levels and timing of capital expenditures; disruptions in the capital markets or other events that make our access to necessary capital more difficult or costly; developments in legal or public policy doctrines; technological developments; changes in accounting standards and financial reporting regulations; fluctuations in the value of our remaining competitive contracts; actions of rating agencies; the effects and outcome of our pending merger with NSTAR; and other presently unknown or unforeseen factors. Other risk factors are detailed from time to time in our reports to the Securities and Exchange Commission (SEC). Any forward-looking statement speaks only as of the date on which such statement is made, and we undertake no obligation to update the information contained in any forward-looking statements to reflect developments or circumstances occurring after the statement is made or to reflect the occurrence of unanticipated events. This presentation references actual and projected EPS by business. EPS by business is a non-GAAP (not determined using generally accepted accounting principles) measure that is calculated by dividing the net income or loss attributable to controlling interests of each business by the weighted average diluted NU parent common shares outstanding for the period. Management uses this non-GAAP financial measure to evaluate earnings results and to provide details of earnings results and guidance by business. Our 2010 and 2011 actual and projected earnings excludes certain non-recurring charges related to a tax settlement in 2010 and merger costs which we have incurred in 2010 and expect to incur during 2011, which is a non-GAAP financial measure. Management believes that these non-GAAP financial measurements are useful to investors to evaluate the actual and projected financial performance and contribution of NU’s businesses. Non-GAAP financial measures should not be considered as alternatives to NU consolidated net income attributable to controlling interests or EPS determined in accordance with GAAP as indicators of NU’s operating performance. |
 3 NU Safe Harbor Provisions Information Concerning Forward-Looking Statements Relating to the NU–NSTAR Merger In addition to historical information, this communication may contain a number of “forward-looking statements” as defined in the Private Securities Litigation Reform Act of 1995. Words such as anticipate, expect, project, intend, plan, believe, and words and terms of similar substance used in connection with any discussion of future plans, actions, or events identify forward-looking statements. Forward-looking statements relating to the proposed merger include, but are not limited to: statements about the benefits of the proposed merger involving NSTAR and NU, including future financial and operating results; NSTAR’s and NU’s plans, objectives, expectations and intentions; the expected timing of completion of the transaction; and other statements relating to the merger that are not historical facts. Forward-looking statements involve estimates, expectations and projections and, as a result, are subject to risks and uncertainties. There can be no assurance that actual results will not materially differ from expectations. Important factors could cause actual results to differ materially from those indicated by such forward-looking statements. With respect to the proposed merger, these factors include, but are not limited to: the risk that NSTAR or NU may be unable to obtain governmental and regulatory approvals required for the merger, or required governmental and regulatory approvals may delay the merger or result in the imposition of conditions that could reduce the anticipated benefits from the merger or cause the parties to abandon the merger; the risk that a condition to closing of the merger may not be satisfied; the length of time necessary to consummate the proposed merger; the risk that the businesses will not be integrated successfully; the risk that the cost savings and any other synergies from the transaction may not be fully realized or may take longer to realize than expected; disruption from the transaction making it more difficult to maintain relationships with customers, employees or suppliers; the diversion of management time on merger-related issues; the effect of future regulatory or legislative actions on the companies; and the risk that the credit ratings of the combined company or its subsidiaries may be different from what the companies expect. These risks, as well as other risks associated with the merger, are more fully discussed in the joint proxy statement/prospectus that is included in the Registration Statement on Form S-4 (Registration No. 333-170754) that was filed by NU with the SEC in connection with the merger. Additional risks and uncertainties are identified and discussed in NSTAR’s and NU’s reports filed with the SEC and available at the SEC’s website at www.sec.gov. Forward-looking statements included in this document speak only as of the date of this document. Neither NSTAR nor NU undertakes any obligation to update its forward-looking statements to reflect events or circumstances after the date of this document. Additional Information and Where To Find It This communication does not constitute an offer to sell or the solicitation of an offer to buy any securities or a solicitation of any vote or approval. In connection with the proposed merger between NU and NSTAR, NU filed with the SEC a Registration Statement on Form S-4 (Registration No. 333-170754) that includes a joint proxy statement of NU and NSTAR that also constitutes a prospectus of NU. NU and NSTAR mailed the definitive joint proxy statement/prospectus to their respective shareholders, on or about January 5, 2011. NU and NSTAR urge investors and shareholders to read the joint proxy statement/prospectus regarding the proposed merger, as well as other documents filed with the SEC, because they contain important information. You may obtain copies of all documents filed with the SEC regarding this proposed transaction, free of charge, at the SEC’s website (www.sec.gov). You may also obtain these documents, free of charge, from NU’s website (www.nu.com) under the tab “Investors” and then under the heading "Financial/SEC Reports.” You may also obtain these documents, free of charge, from NSTAR’s website (www.nstar.com) under the tab “Investor Relations.” Please refer to our reports to the SEC for further details concerning the matters described in this presentation. |
 4 NSTAR Safe Harbor Provisions Information Concerning Forward-Looking Statements In addition to historical information, this presentation may contain a number of “forward-looking statements” as defined in the Private Securities Litigation Reform Act of 1995. Words such as anticipate, estimate, expect, project, intend, plan, believe, and words and terms of similar meaning used in connection with any discussion of future operating or financial performance, plans, actions, or events identify forward-looking statements. Forward-looking statements relating to the pending merger include, but are not limited to: statements about the benefits of the pending merger involving NSTAR and Northeast Utilities, including future financial and operating results; NSTAR’s and Northeast Utilities’ plans, objectives, expectations and intentions; the expected timing of completion of the transaction; and other statements relating to the merger that are not historical facts. Forward-looking statements involve estimates, expectations and projections and, as a result, are subject to risks and uncertainties. There can be no assurance that actual results will not materially differ from expectations. Important factors could cause actual results to differ materially from those indicated by such forward-looking statements. With respect to the pending merger, these factors include, but are not limited to: the risk that NSTAR or Northeast Utilities may be unable to obtain governmental and regulatory approvals required for the merger, or required governmental and regulatory approvals may delay the merger or result in the imposition of conditions that could reduce the anticipated benefits from the merger or cause the parties to abandon the merger; the risk that a condition to closing of the merger may not be satisfied; the length of time necessary to consummate the pending merger; the risk that the businesses will not be integrated successfully; the risk that the cost savings and any other synergies from the transaction may not be fully realized or may take longer to realize than expected; disruption from the transaction making it more difficult to maintain relationships with customers, employees or suppliers; the diversion of management time on merger-related issues; the effect of future regulatory or legislative actions on the companies; and the risk that the credit ratings of the combined company or its subsidiaries may be different from what the companies expect. These risks, as well as other risks associated with the merger, are more fully discussed in the joint proxy statement/prospectus that is included in the definitive proxy statement that was filed by NSTAR with the Securities and Exchange Commission (SEC) on January 5, 2011 and the Registration Statement on Form S-4 (Registration No. 333-170754) that was filed by Northeast Utilities with the SEC in connection with the merger. Additional risks and uncertainties are identified and discussed in NSTAR’s and Northeast Utilities’ reports filed with the SEC and available at the SEC’s website at www.sec.gov. Forward-looking statements included in this document speak only as of the date of this document. Neither NSTAR nor Northeast Utilities undertakes any obligation to update its forward-looking statements to reflect events or circumstances after the date of this document. Additional Information and Where to Find It This presentation does not constitute an offer to sell or the solicitation of an offer to buy any securities. In connection with the pending merger between Northeast Utilities and NSTAR, Northeast Utilities filed with the SEC a Registration Statement on Form S-4 (Registration No. 333- 170754) that includes a joint proxy statement of Northeast Utilities and NSTAR that also constitutes a prospectus of Northeast Utilities. Northeast Utilities and NSTAR first mailed the definitive joint proxy statement/prospectus to their respective shareholders, on or about January 5, 2011. Northeast Utilities and NSTAR urge investors and shareholders to read the joint proxy statement/prospectus regarding the pending merger, as well as other documents filed with the SEC, because they contain important information. You may obtain copies of all documents filed with the SEC regarding this proposed transaction, free of charge, at the SEC’s website (www.sec.gov). You may also obtain these documents, free of charge, from Northeast Utilities’ website (www.nu.com) under the tab “Investors” and then under the heading "Financial/SEC Reports.” You may also obtain these documents, free of charge, from NSTAR’s website (www.nstar.com) under the tab “Investor Relations.” |
 5 Topics for Today • Merger update • NU regulated investment strategy • NU financial results and investment outlook • NSTAR financial results |
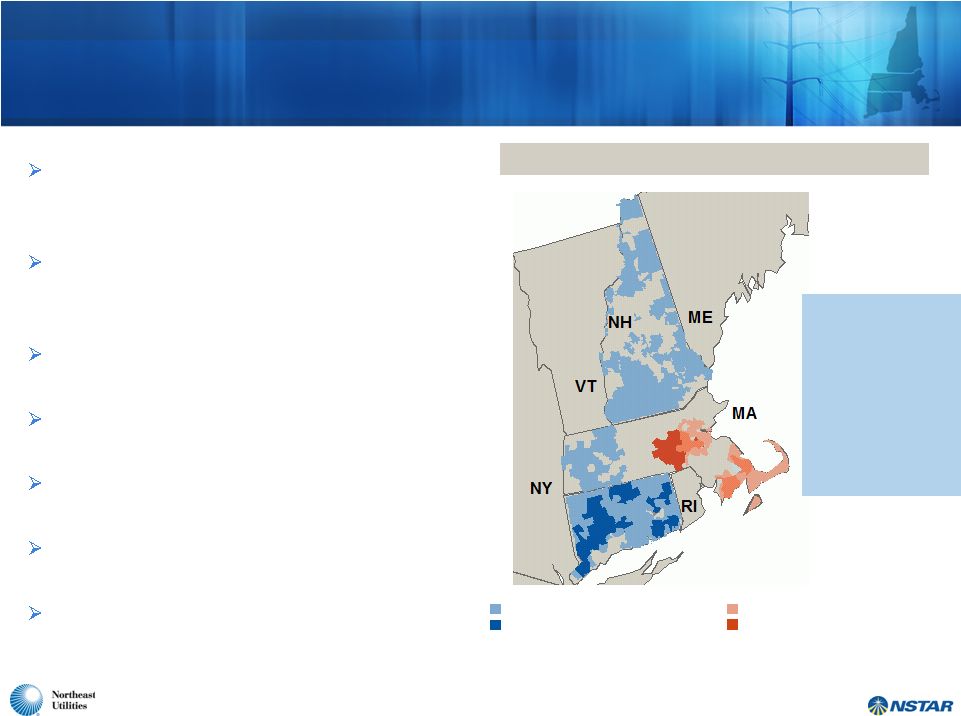 6 A Compelling Combination – Creates Largest Utility Company in New England Significant infrastructure investment opportunities combined with balance sheet strength provide for substantial growth potential Larger, diverse and better positioned to support economic growth and state public policy initiatives in New England Provides an enhanced total shareholder return proposition Enhances service quality capabilities for the largest customer base in New England Highly experienced and complementary leadership team with proven track record 100% stock transaction – 1.312 NU shares per NSTAR share 56% NU shareholders 44% NSTAR shareholders NSTAR Electric Service Area NSTAR Gas Service Area Northeast Utilities Electric Service Area Northeast Utilities Gas Service Area Combined Service Territory • 3 million electric customers • 500,000 natural gas customers • 4,500 miles electric transmission • 72,000 miles electric distribution • 6,300 miles gas distribution |
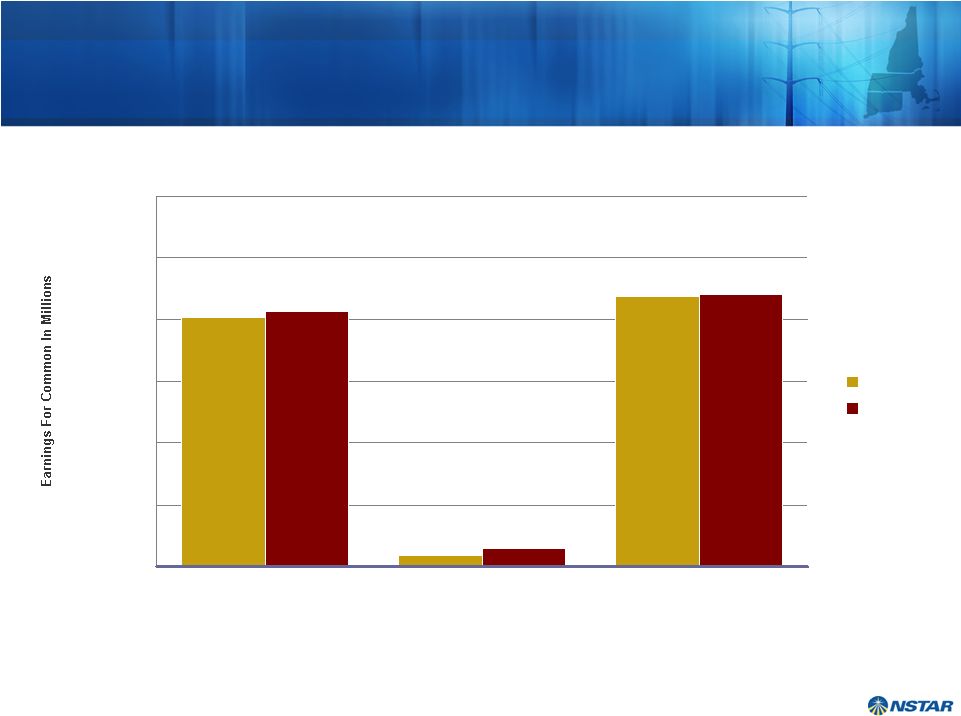
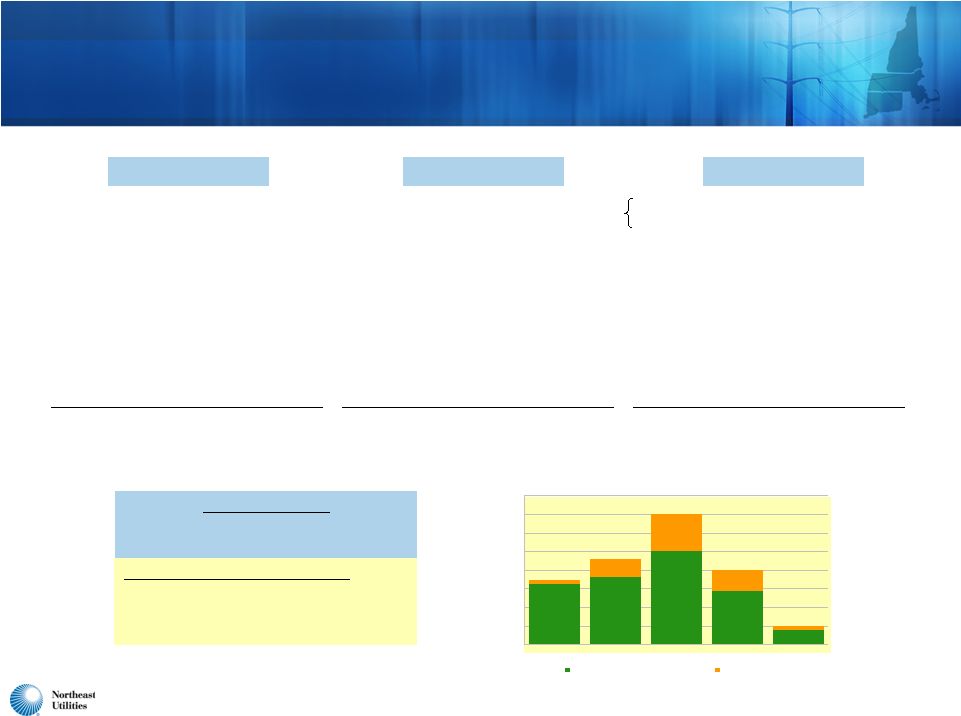
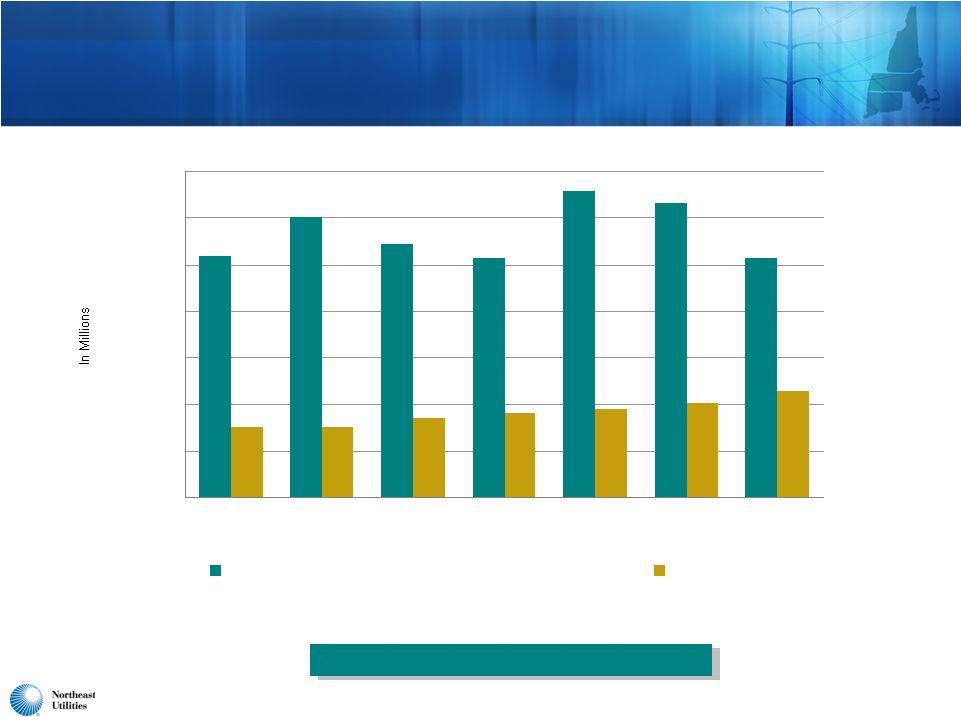
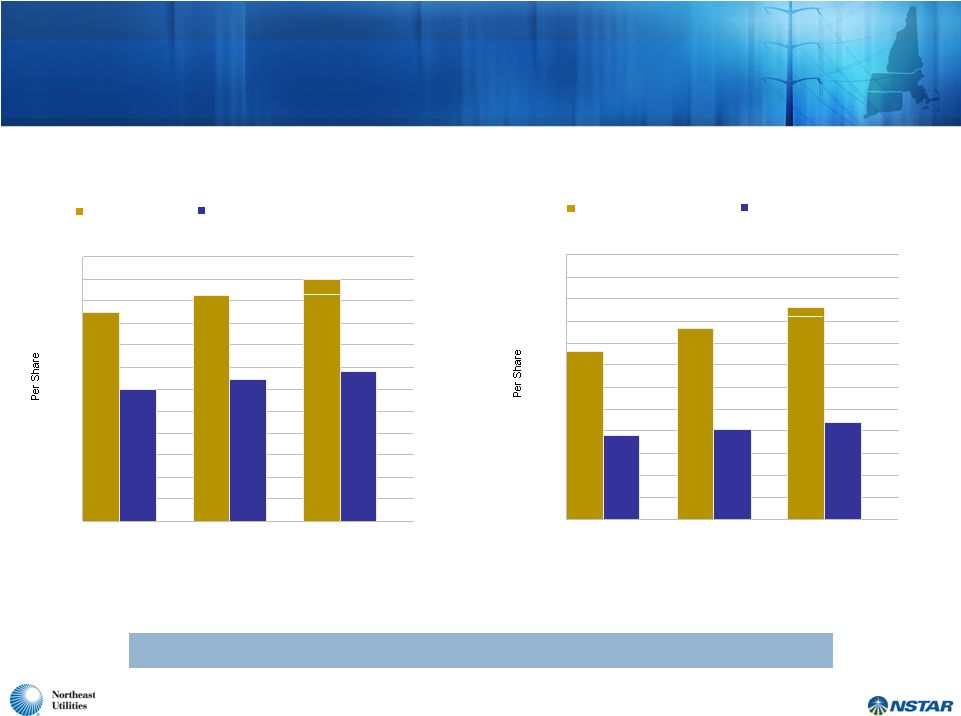 7 Both Companies Have a Strong History of Earnings and Dividend Growth $0.00 $0.25 $0.50 $0.75 $1.00 $1.25 $1.50 $1.75 $2.00 $2.25 $2.50 $2.75 $3.00 2009 2010 2011 $2.16 $0.95 $1.91 $1.025 $2.30 - 2.40 1 Excludes NU tax settlement, NU-NSTAR merger costs 2 Full year estimate, excluding NU-NSTAR merger costs 3 December 30, 2011 dividend will be $0.325 per share if merger has closed, $0.275 if it has not closed EPS 2011 total dividend per share if merger does not close on or before 12/30/11 NSTAR and NU Earnings and Common Dividends: 2009-2011 $0.00 $0.25 $0.50 $0.75 $1.00 $1.25 $1.50 $1.75 $2.00 $2.25 $2.50 $2.75 $3.00 2009 2010 2011 $2.37 $2.56 $1.50 $1.60 $1.70 1 Excludes merger costs, MATEP sale and RCN tax adjustment 2 Full year estimate, excluding NU-NSTAR merger costs $2.60 - $2.75 EPS Dividend per share NSTAR NU Attractive current yield with strong cash flow and credit profile $1.10 1 2 1 2 3 |
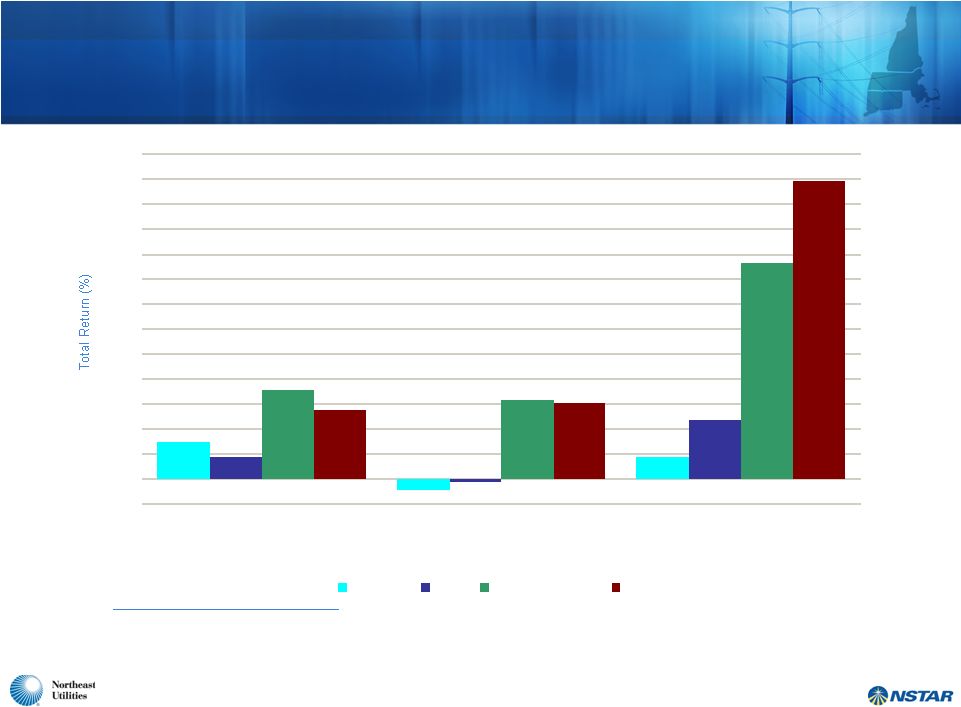 29 (9) 18 (3) 47 71 63 173 55 60 239 18 -20 0 20 40 60 80 100 120 140 160 180 200 220 240 260 S&P 500 UTY Northeast Utilities NSTAR 8 Proven Record of Delivering Superior Value (1) 3 years 5 years 10 years 1. Total return as of 10/31/11. Assumes reinvestment of dividends. 2. Total return calculated based on S&P 500 market index, which is weighted by market capitalization. 3. Total return calculated based on Philadelphia Utility Index, which is weighted by market capitalization. (2) (3) NST NST NST NU NU NU |
 9 NU’s Transmission Initiatives Continue to Grow • First major NEEWS project well under construction; applications to be filed soon for second project • Northern Pass TSA accepted by FERC; permitting process continues • More than $400 million of new reliability projects added to five-year plan to continue addressing national reliability standards • States support reliability initiatives, but continue to protest at FERC on authorized ROEs • FERC denied state rehearing requests earlier this year regarding NEEWS, NPT incentives • States and others filed a complaint with FERC on September 30 over 11.14% base ROE for all New England transmission owners |
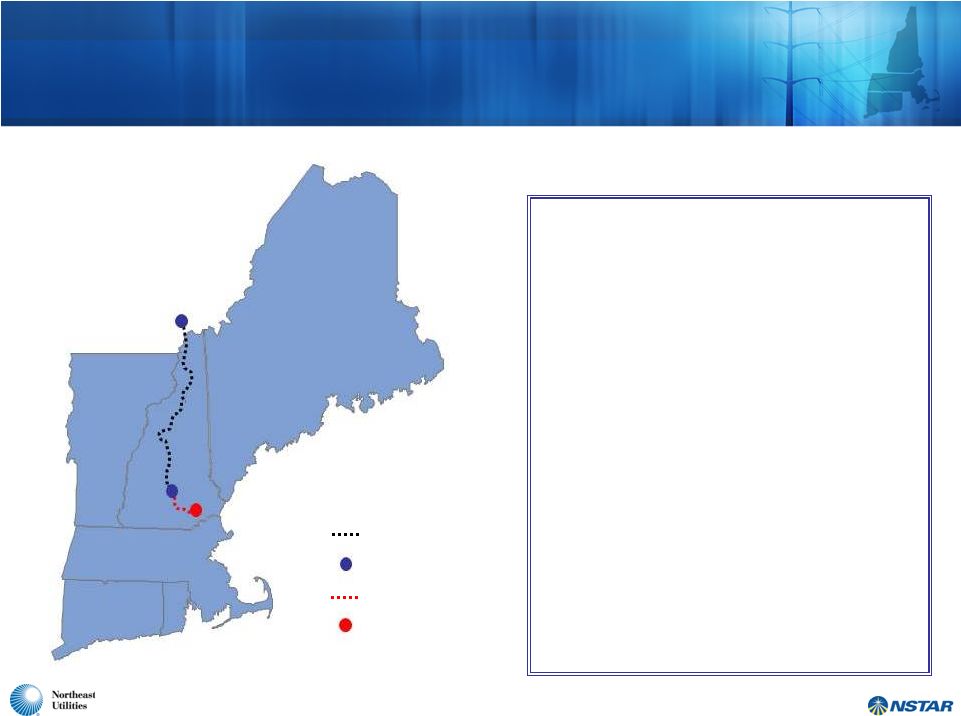 10 Even Before Merger Was Announced, NU and NSTAR Were Partners on Northern Pass • To be owned by Northern Pass Transmission LLC NU (75%) and NSTAR (25%) • 1,200 MW transfer capability • Significant environmental and economic benefits for New England • Northern terminus of DC line at Des Cantons (Québec), southern terminus in Franklin (New Hampshire) • 345kV AC leg from Franklin to Deerfield, NH • TSA accepted by FERC • Permitting process continues with U.S. DOE, U.S. Forest Service • Continued progress in securing alternate route in northern New Hampshire – Community outreach ongoing • Capital cost estimate for US segment - $1.1 billion – Completion projected for fourth quarter 2016 Des Cantons HVDC Line HVDC Converter Station 345-kV Line Existing Deerfield Substation Deerfield Franklin |
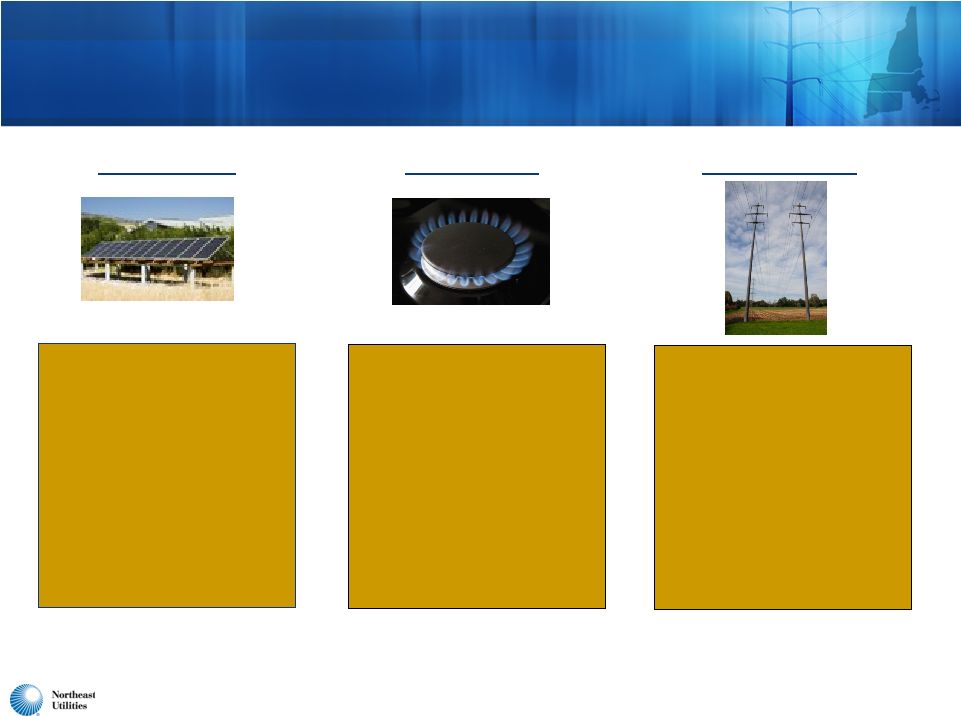 11 • Second WMECO solar project under construction • CT legislation allows 10 MW of renewable generation for CL&P • Sales growth has accelerated • Significant cost, environmental advantages vs. oil • Proximity to shale gas a game-changer for Northeast • Reducing region’s petroleum use a national and state focus • NPT initiative • NEEWS suite of projects • Additional reliability projects important to region’s energy policy Renewables Transmission Natural Gas Numerous Initiatives Under Way at NU to Help the Region’s Energy Policy Succeed |
 12 Supporting Massachusetts Energy Policies • Award-winning energy efficiency programs • Massachusetts tops the nation • NSTAR to invest annually more than $200M • New renewable energy contracts signed and approved • Three wind projects totaling 108.9 MW • Merger-related environmental initiatives • Further expand energy efficiency programs • Solar investment • Electric vehicle pilot |
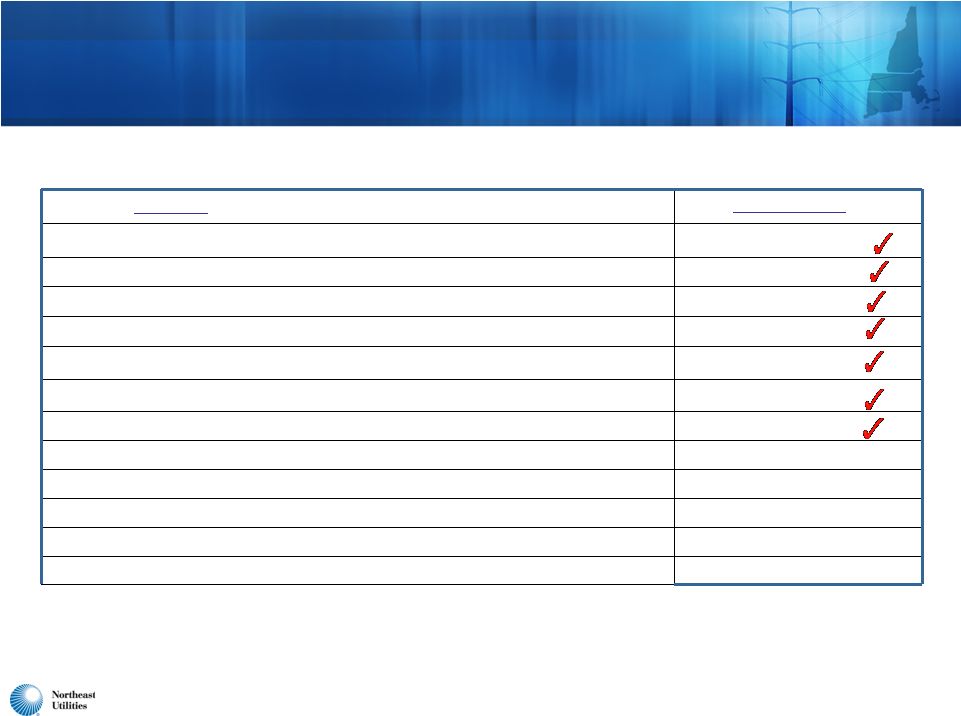
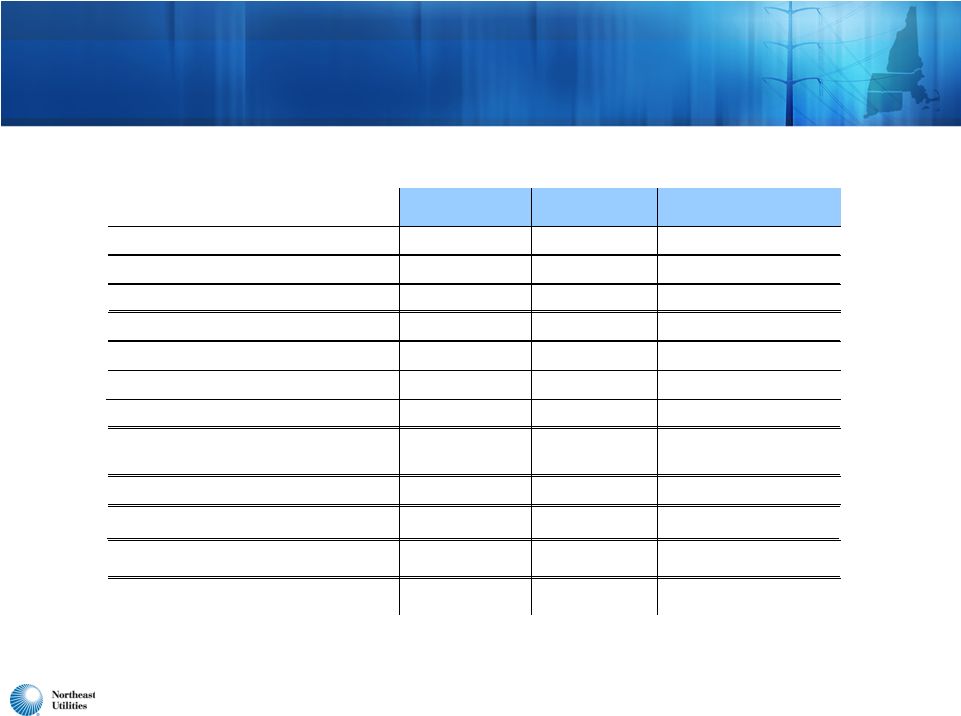
 13 Status of Merger Approvals Securities and Exchange Commission Shareholders Department of Justice (waiting period expired) Federal Communications Commission Federal Energy Regulatory Commission Maine DPUC Massachusetts DPU Nuclear Regulatory Commission Approvals Received Applications Pending Connecticut PURA New Hampshire PUC Determined Not To Have Jurisdiction |
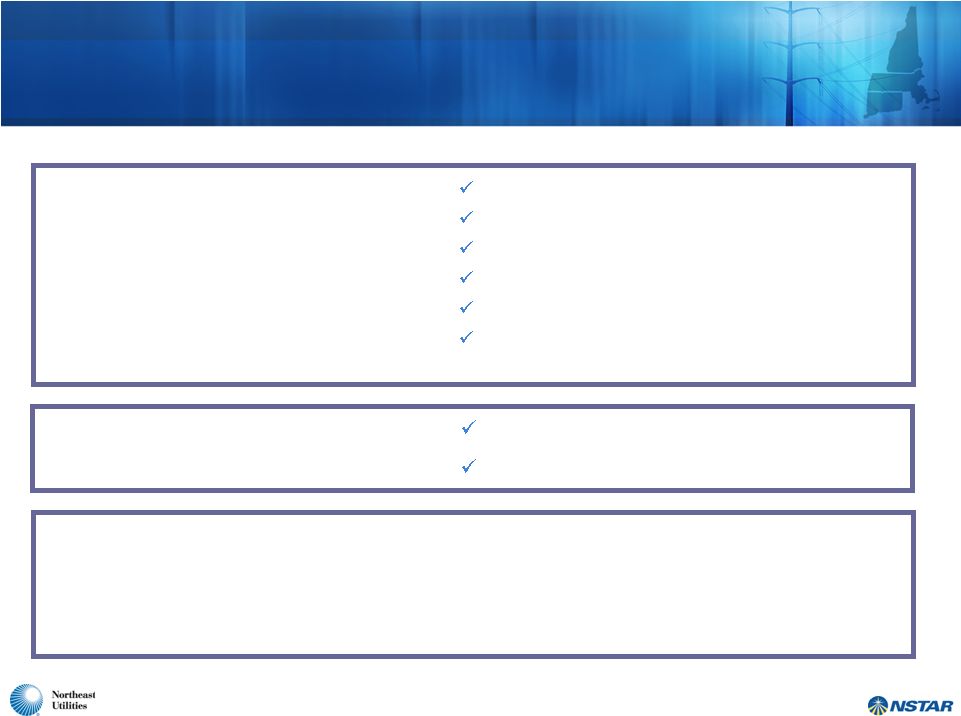
 14 Merger Brings Together the Strengths of NU and NSTAR to the Benefit of Customers and Investors • Enhanced business and financial profile • Best practices will improve service quality and reduce costs • Strong financial position and cash flows • Regional ownership; regional control; attentive to New England issues • Better able to support the region’s energy policies |
 NU Regulated Investment Strategy |
 16 2012-2016 Plan Continues to Provide Significant Value for Customers and Shareholders Through Investment of $5.7 Billion in Infrastructure, Supported by Strong Execution and Rigorous Cost Management Specifically, the plan: • Invests $2.6B in Transmission, reflecting completion of Northern Pass Project, substantial completion of NEEWS, and continued investment in New England reliability • Invests $2.1B in Electric Distribution infrastructure, reflects deferring implementation of AMI at CL&P; better capital utilization with aging infrastructure; and revised projections of new service connections • Invests $255M in generation; $160M for base load generation and completion of Merrimack Scrubber and $95M investment in renewable generation at CL&P and WMECO • Invests $566M in Yankee Gas, slightly lower than previous plan due to completion of Waterbury-to-Wallingford pipeline project; also captures a compelling opportunity due to the combination of low commodity prices and customer penetration in Connecticut • Holds down operational O&M expense growth due to continued improvements in efficiency and achieving operational excellence |
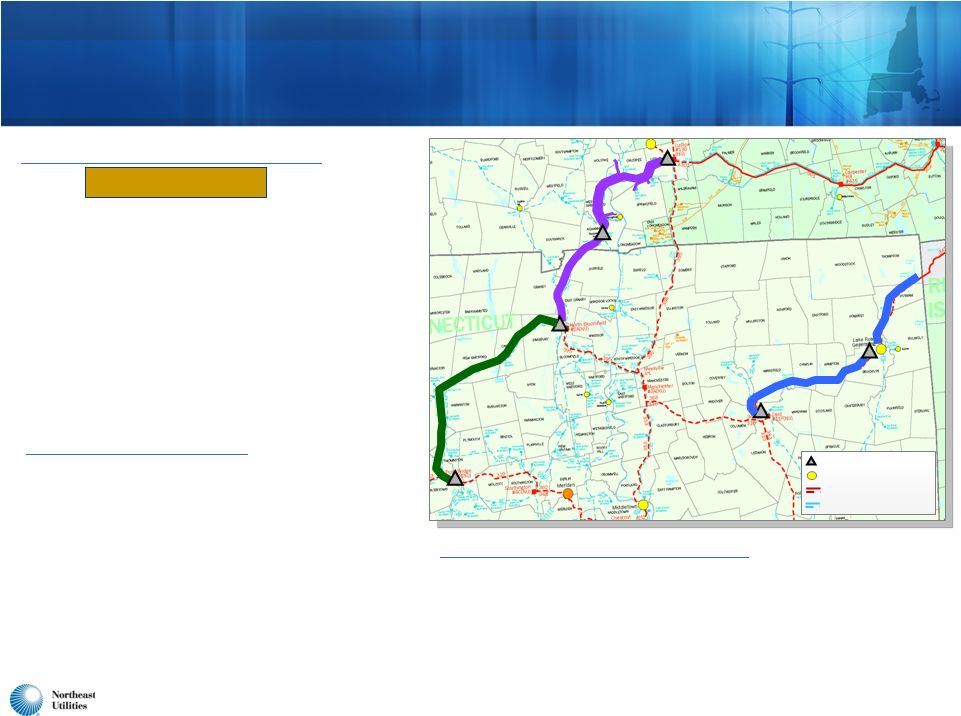 17 NEEWS Projects Advance Current Status Report Interstate Reliability Project • Joint project with National Grid (NU in CT; NGrid in MA & RI) • ISO-NE confirmed need: August 2010 • File siting application in CT: late 2011 • Siting decisions: 2013 • Commence construction: late 2013/early 2014 • Projected in-service: late 2015 • Total projected NU cost: $218 million Central Connecticut Reliability Project • Review to be completed and needs identified in early 2012 with specific projects identified later in 2012 • Total projected NU cost: $301 million • Project in-service: 2017 SPRINGFIELD HARTFORD 345-kV Substation Generation Station 345-kV ROW 115-kV ROW Central Connecticut Reliability Project Interstate Reliability Project Greater Springfield Reliability Project Greater Springfield Reliability Project • Substation construction commenced in MA in Dec. 2010; in CT in summer 2011 • Army Corps of Engineers permit received in September - full overhead construction has commenced in both MA and CT • 29% complete as of 10/31/11 • Projected in-service: late 2013 • Total projected NU cost: $718 million Under Construction Under Construction |
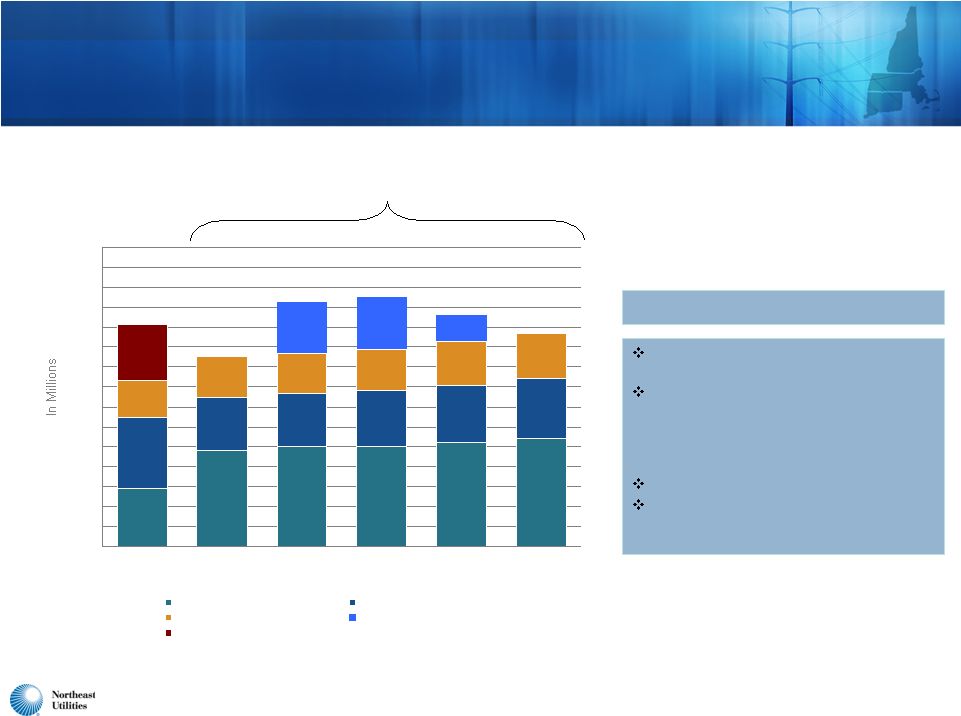
 18 $0 $100 $200 $300 $400 $500 $600 $700 $800 Base Reliability Major Southwest CT NEEWS Northern Pass Successful completion of SWCT projects Northern Pass HVDC Line to Canada 2012-2016 Transmission Capital Expenditures Includes More Than $400 Million of New Projects Historic Forecast $2.6 Billion $3.0 Billion NEEWS projects progressing US portion estimated at $1.1 billion with $835 million NU ownership share NU’s share of NEEWS project estimated at $1.262 billion SWCT projects total $1.6 billion Projected $434 Million $1.0 billion of additional forecasted reliability projects ($400M new) |
 19 Transmission 2012-2016 CapEx Plan Includes $346 Million Program for Reliability Upgrades at PSNH and WMECO * Projects were identified by ISO-NE in its Vermont/New Hampshire reliability review and are included in the current ISO-NE RSP ** Projects expected to be finalized in Q4 2011 and added to the April 2012 update of the ISO-NE RSP Northern Area* • Autotransformer addition • 2013 estimated ISD Central Area* • Synchronous condenser • Capacitor banks • 2013-2015 estimated ISDs • New 115 kV lines • 115 kV line rebuilds • Capacitor banks • 2014-2016 estimated ISDs Seacoast Area** Southern Area** Western Areas* PSNH Total = $238 Million Pittsfield-Greenfield Area* • Autotransformer addition • New 115 kV switching station • New 115 kV line • 115 kV line rebuilds • Capacitor banks • 2014-2015 ISDs WMECO Total = $108 Million * Projects were identified by ISO-NE in its Berkshire County/Pittsfield area reliability review and are included in the current ISO-NE RSP |
 20 Our Electric Distribution Plan Reflects a Comprehensive Approach to Optimizing Our Capital Investment While Improving Reliability • The current plan reduces long-term distribution capital investments by: • Deferring deployment of AMI in CT ($217M) • Optimizing investments in aging plant infrastructure through implementation of our new asset investment strategy • Reducing new service, municipal relocation and associated capital business requirements due to economic factors and more precise forecasting • Lowering vehicle budget through life extension strategies • We have completed a rigorous analysis of our distribution infrastructure, down to the component level, which allows us to: • Extend equipment life due to better performance analysis and enhanced preventative maintenance • Selectively replace components that pose a high risk to reliability • Monitor low-risk components to extend operation beyond depreciated life |
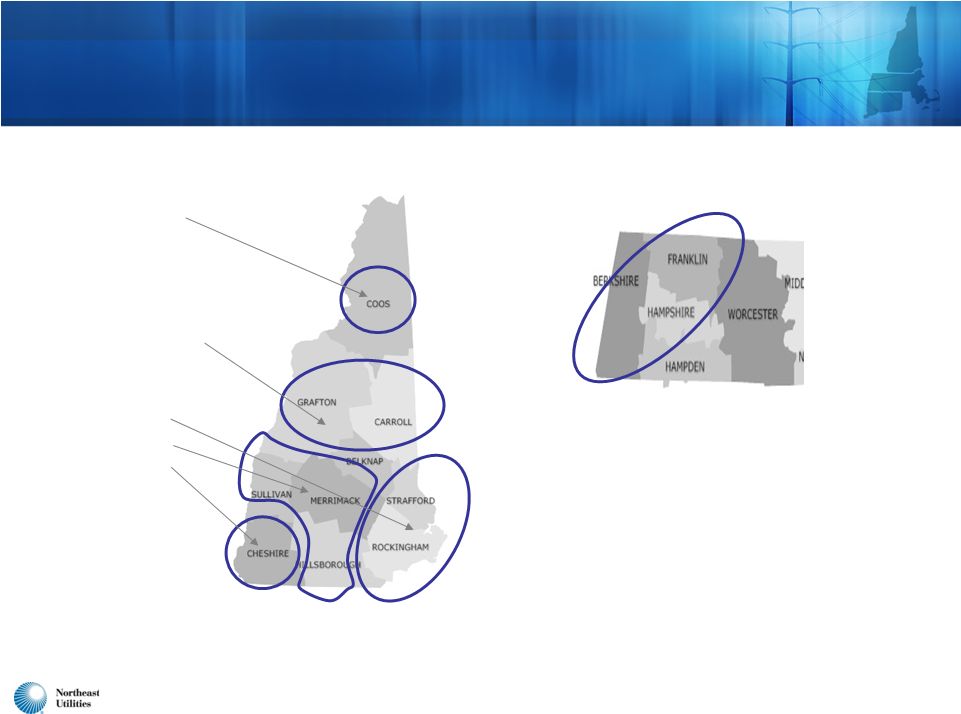
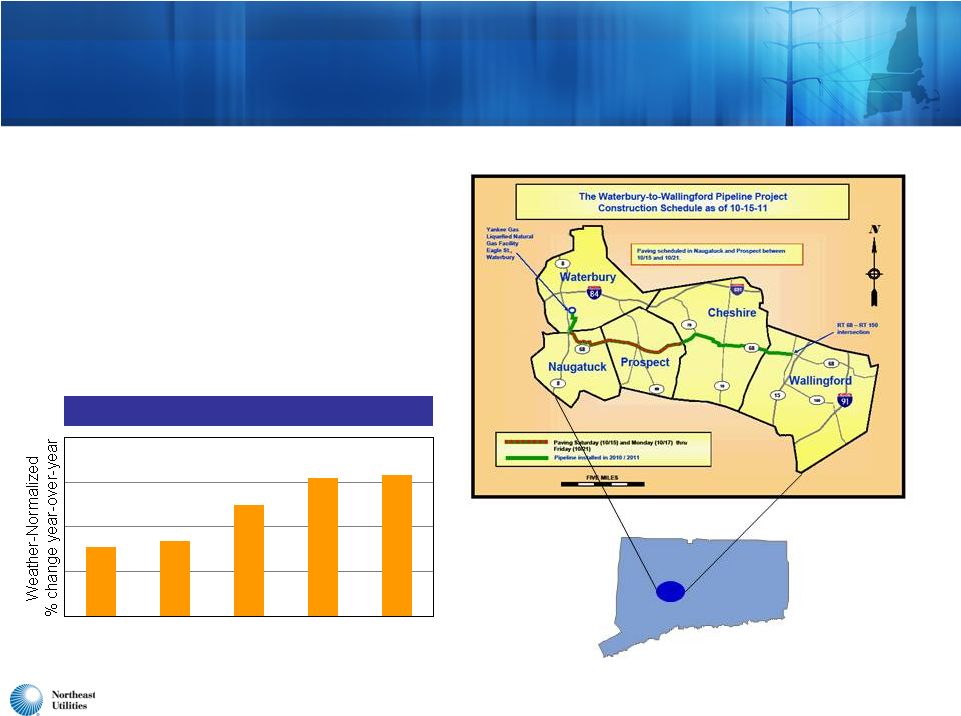
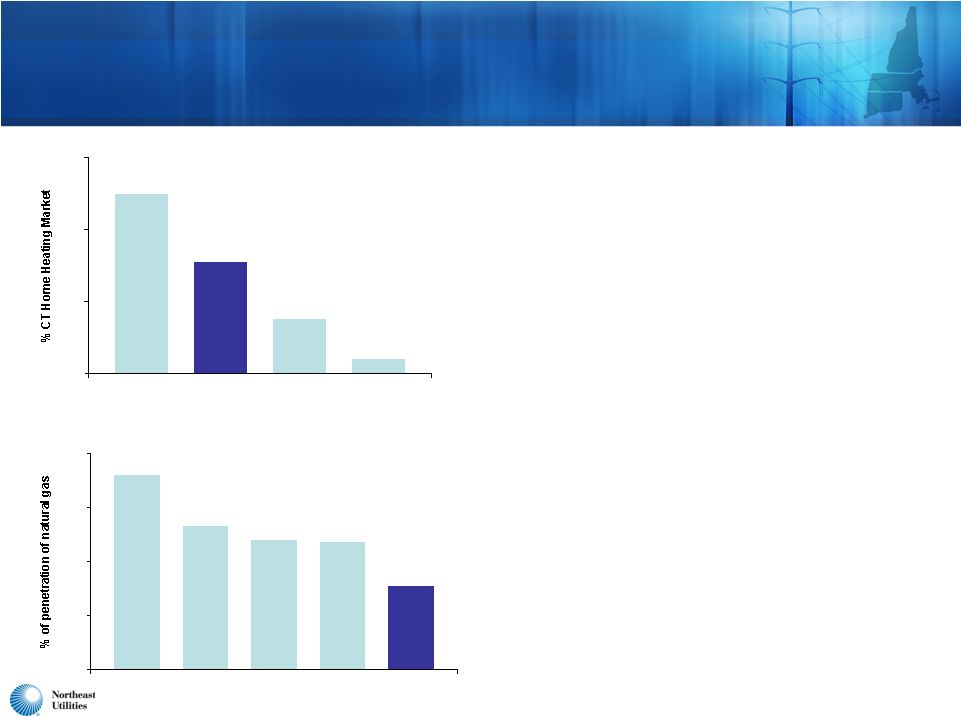 21 50% 31% 15% 4% 0% 20% 40% 60% CT Home Heating Market Penetration Heating Oil #2 Natural Gas Electric Heating Propane 72% 53% 48% 47% 31% 0% 20% 40% 60% 80% Natural gas penetration CT vs. other states CT NJ NY RI MA Natural Gas: A Compelling Infrastructure Growth Opportunity • A 35 percent increase in firm YTD gas sales since 2006 • WWL project complete and in rates • Capital investment projected to $566 million from 2012-2016 • Expands natural gas access, removes gas constraints • Pursues further oil-to-gas conversions • Accelerates cast iron and bare steel pipe replacement to $40 million/year • Increasing the penetration to 50 percent of the state would yield long-term benefits • Significant customer savings • Reduced emissions • Reduction in oil demand |
 NU Financial Results and Investment Outlook |
 23 2011 Shows Continued Improvement in NU’s Earnings, Cash Flow • EPS up 12.3% year-to-date, excluding merger expenses • S&P raised all NU and subsidiary credit ratings in May • Attractive dividend growth continues while maintaining conservative payout ratio • Cash generation continues to strengthen • $690 million of debt financed at very attractive rates • Five-year capital investment and rate base projections continue to show very attractive growth |
 24 $0.0 $127.3 $130.7 $258.7 $0.7 $281.4 ($10.1) ($10.4) $128.4 $173.5 ($50) $0 $50 $100 $150 $200 $250 $300 2010 2011 Year-To-Date 2011 Results Distribution and Generation Transmission Parent/Other Ex. Merger Expenses Merger Expenses Total EPS $1.46 EPS $1.58 |
 25 2011 Earnings Guidance Maintained Current 2011 Guidance NU Consolidated EPS (GAAP) $2.10 - $2.20 Distribution/Generation $1.30 - $1.35 Transmission $1.05 – $1.10 NU Parent/Other ($0.05)* NU Consolidated EPS (Non-GAAP) $2.30 – $2.40* *Excludes $0.20/share of estimated merger-related costs. |
 26 Benefits From Favorable 2011 Financing Environment Company Amount Maturity Coupon Previous Rate Taxable Financings PSNH $160 million 9/01/21 3.2% New Money WMECO $100 million 9/15/21 3.5% New Money Refinancings and Remarketing of Tax-Exempt Debt CL&P $62 million 4/01/12* 1.25% 1.4% PSNH $122 million** 6/01/21 4.05% 6.0% CL&P $120.5 million 9/01/28 4.375% 5.85% CL&P $125 million 9/03/13* 1.25% 5.85% Company Amount Maturity Indicative Rate Current Coupon NU $263 million 4/01/12 2.75% 7.25% * Mandatory tender dates shown. Maturity dates are 5/1/31 for $62 million issue and 9/01/28 for $125 million issue. ** New debt is taxable. Refinanced debt was tax-exempt. ***Based on 5-year maturity *** |
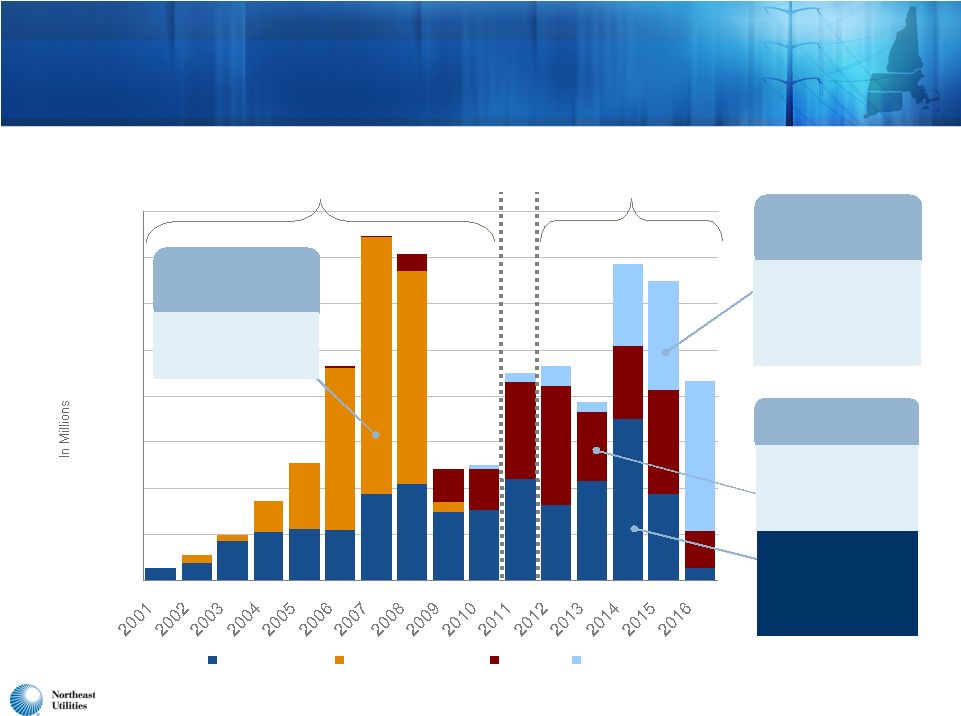
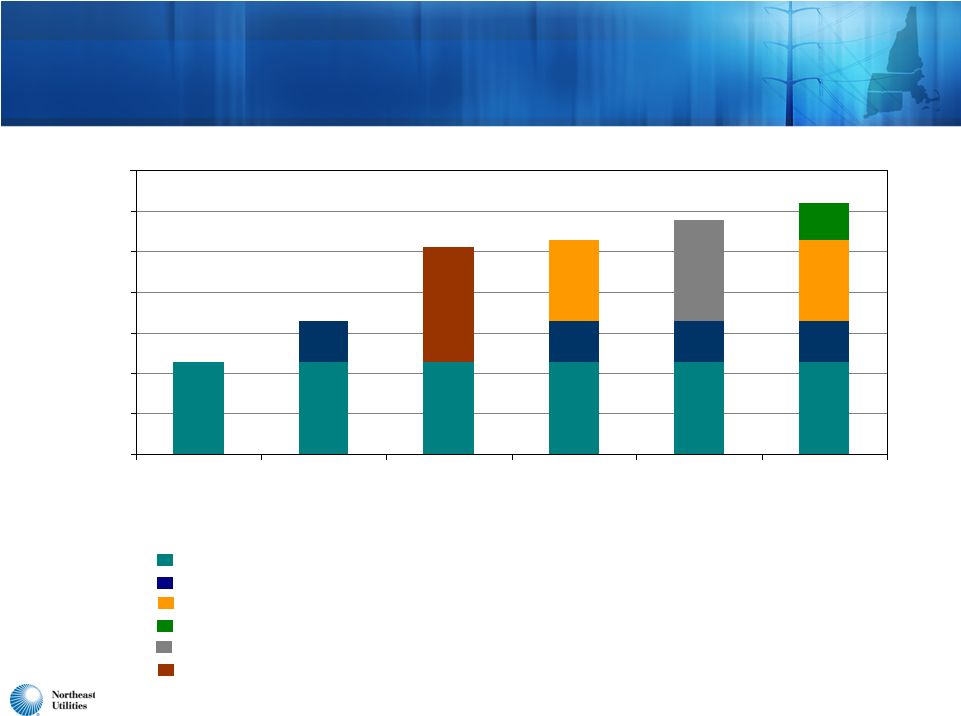
 27 2011-2016: New Capital Expenditure Forecast $0 $200 $400 $600 $800 $1,000 $1,200 $1,400 $1,600 $1,800 $2,000 Five-year 2012-2016 capital spending of approximately $5.7 billion, compared with last year’s 2011-2015 $6.5 billion plan. Distribution and Generation Capex (11/10 Forecast) Transmission Capex (11/10 Forecast)** Distribution and Generation Capex (11/11 Forecast*) Transmission Capex (11/11 Forecast) 2011 2014 2015 2012 2013 2016 * Includes total capex at corporate service companies on behalf of operating companies of $155 million ($28 million in 2012, $34 million in 2013, $36 million in 2014, $29 million in 2015, and $28 million in 2016). **Reflects $137 million reduction in November 2010 projections for 2011-2015 capex due to FERC approval of CWIP application regarding NEEWS projects. |
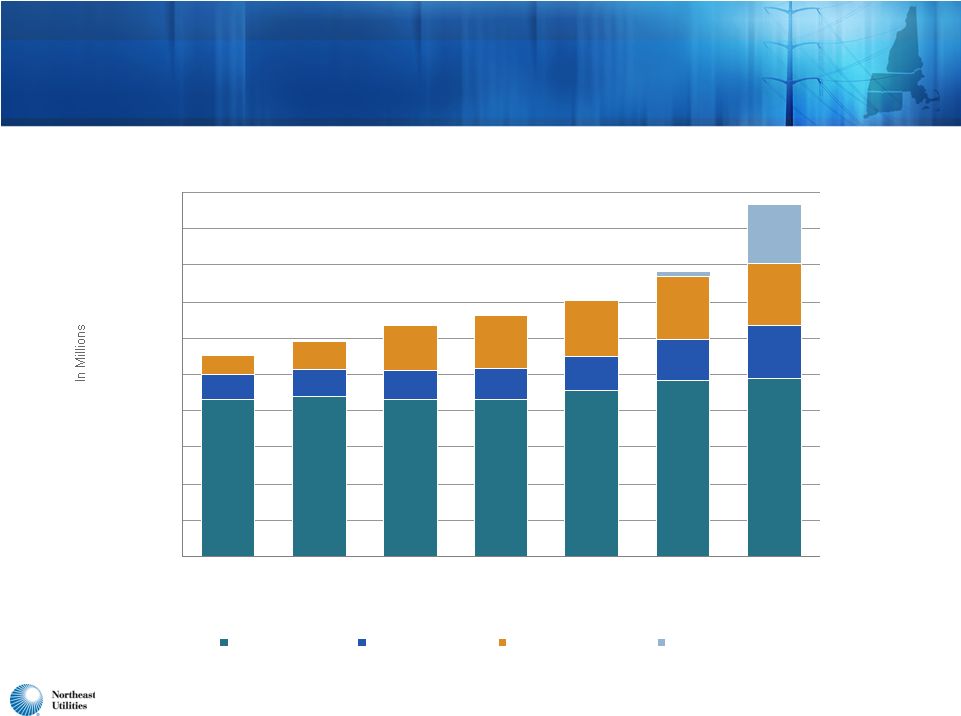
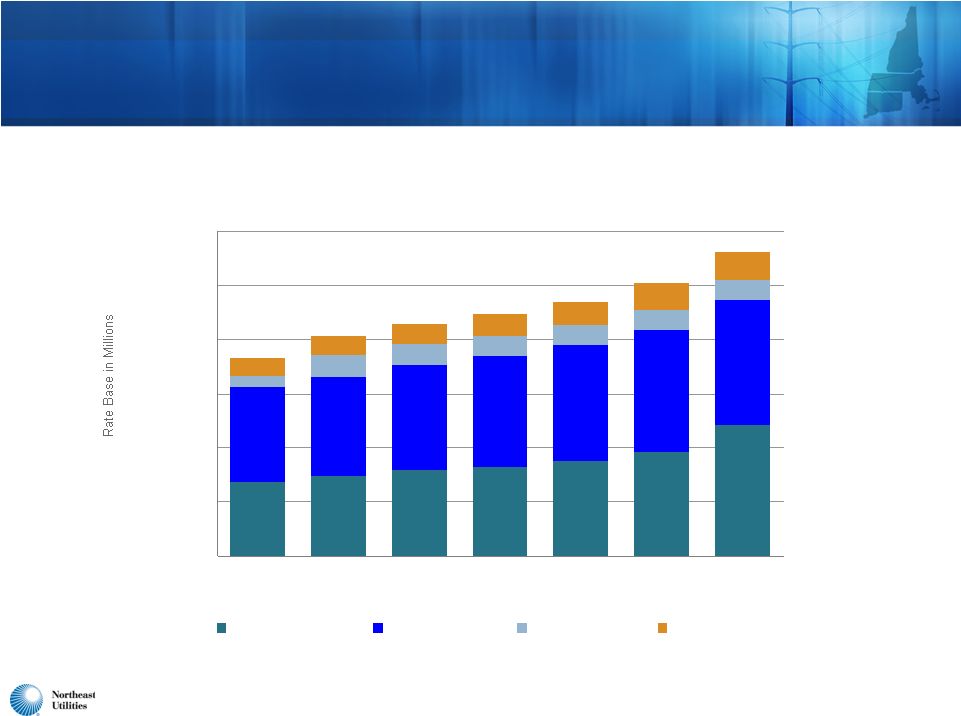 28 Projected NU Year-End Rate Base $2,758 $2,940 $3,177 $3,306 $3,502 $3,866 $4,835 $3,488 $3,689 $3,862 $4,085 $4,282 $4,468 $4,613 $405 $797 $763 $768 $759 $755 $682 $733 $753 $792 $851 $773 $1,031 $974 $0 $2,000 $4,000 $6,000 $8,000 $10,000 $12,000 2010 Actual 2011E 2012E 2013E 2014E 2015E 2016E Transmission Distribution Generation Yankee Gas $8,159 $8,946 $8,565 $9,403 $10,067 $11,234 $7,333 |
 NSTAR Financial Results |
 30 Solid Results For Q3-2011; In-line With Expectations Q3 2010 EPS before one-time item 0.93 $ Transmission revenue 0.04 Energy efficiency 0.03 Telecommunications operations 0.01 0.08 Electric sales (-2.1%) (0.05) Depreciation and property taxes (0.01) Operations & maintenance (0.01) (0.07) 0.01 EPS - Q3 2011 0.94 $ (1) Excludes one-time charge of 20 cents per share related to a settlement with the IRS (1) |
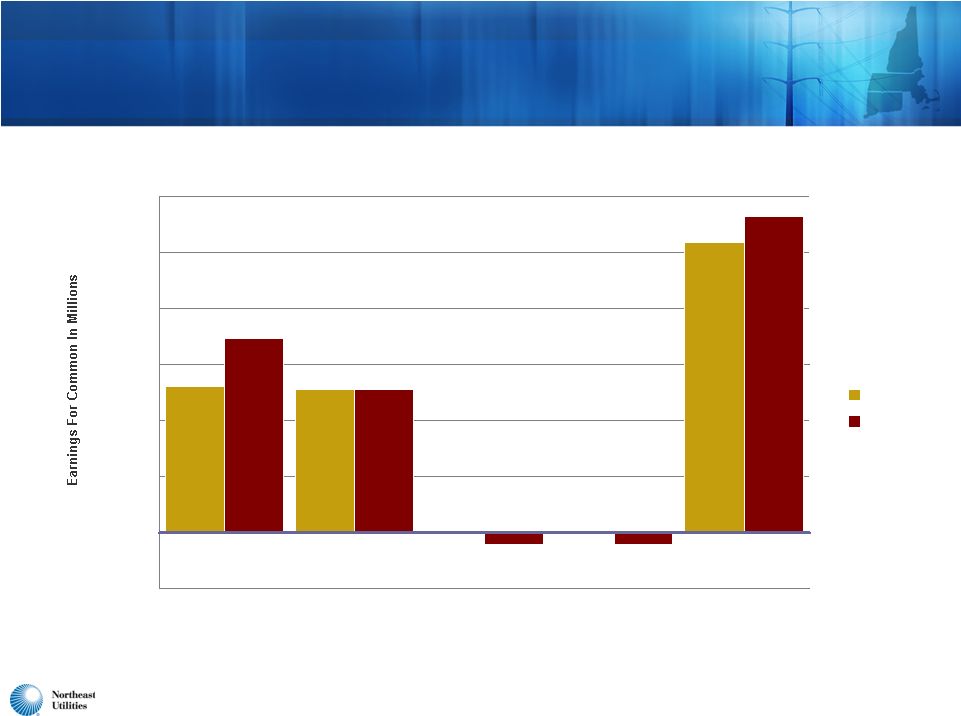
 31 $9.3 $202.0 $218.3 $220.7 $14.5 $206.2 $0 $50 $100 $150 $200 $250 $300 Electric Gas Consolidated 2010 2011 Year-To-Date 2011 Results Reflect Strong Customer Focus and Positive Cost Management Note: Results exclude merger-related costs of $5.6 million for 2011, a one-time charge of $20.6 million for a tax settlement in Q3 2010 and a one-time gain of $108.9 million from the sale of district energy operations in Q2 2010. EPS $2.12 EPS $2.07 |
 32 NSTAR - Transmission Investment Ahead • Transmission Rate Base is expected to grow from $800 million to approximately $1.6 billion by 2016 • Growth/reliability spending averages about $100 million per year • Major Projects: • Cape Cod Line • Mid Cape Line • Boston 345kV Connection • Northern Pass $110-$120 million $25-$30 million $45-$50 million $280 million (2011-2012) (2013-2014) (2014-2015) (2014-2016) |
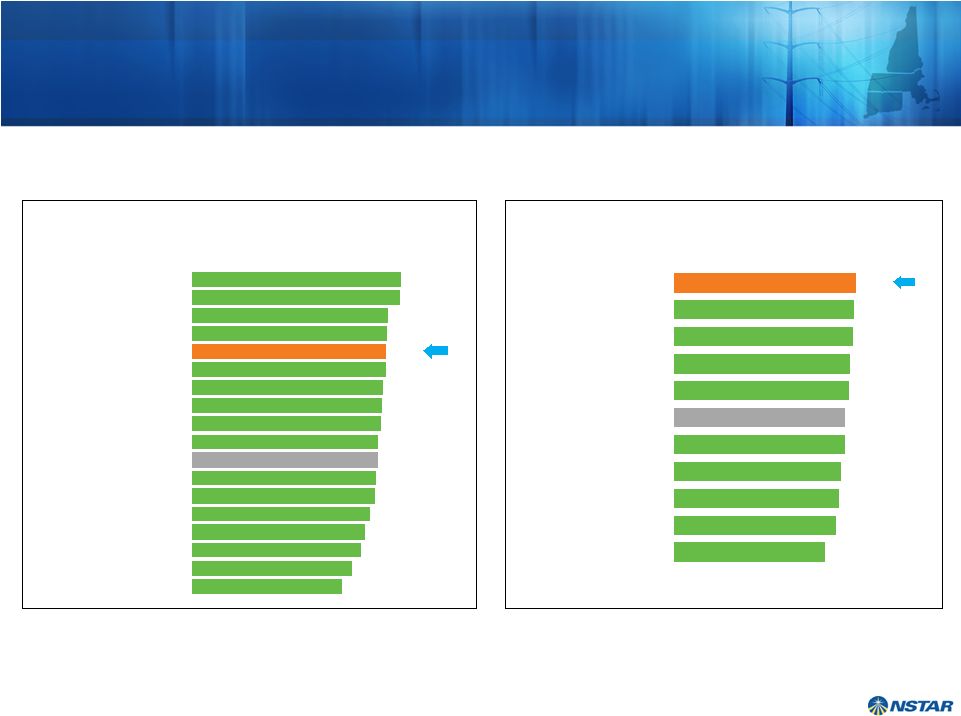 33 Very Positive J.D. Power Customer Satisfaction Results Company A Company B Company C Company D East midsize Segment Average Company E Company F Company G Company H Company I NSTAR Gas 620 618 614 613 609 608 604 601 598 585 622 2011 J.D. Power Gas Company Survey Company A Company B Company C Company D East midsize Segment Average Company E Company F Company G Company H Company I NSTAR Electric Company J Company K Company L Company M Company N Company O Company P 638 636 621 618 606 617 614 611 610 607 617 603 602 595 588 582 570 556 2011 J.D. Power Electric Company Survey |
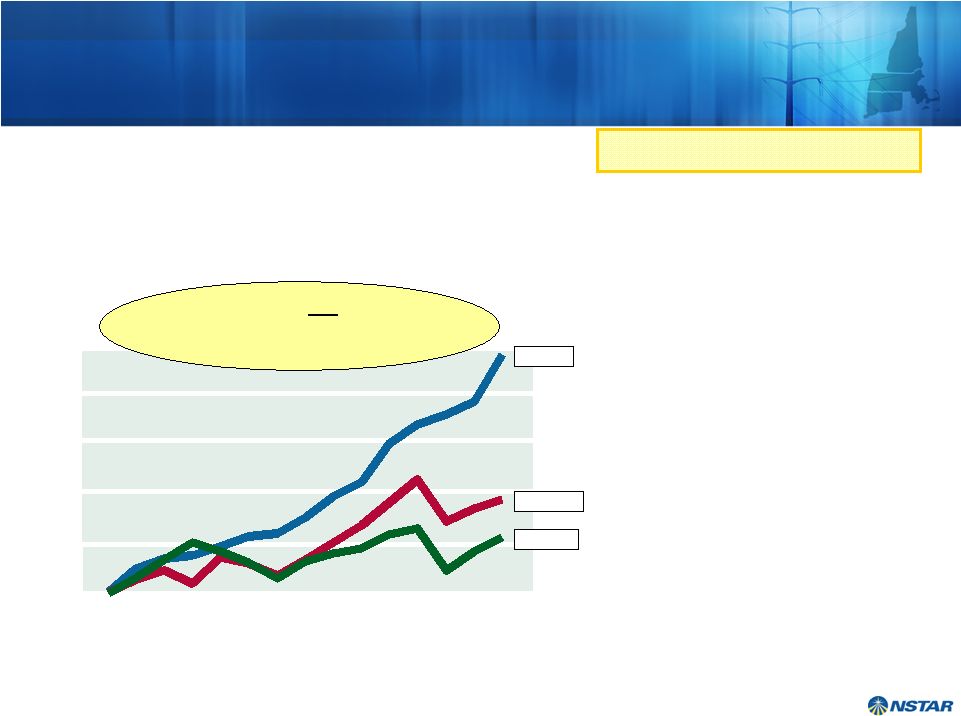 34 Best-in-the-Industry TSR and Credit Ratings NSTAR A+ NSTAR Total Shareholder Return Outperforms the Industry 1996 2010 $1,000 $2,000 $3,000 $4,000 $5,000 $6,000 Only Company in Any Industry to Deliver 14 Consecutive Years of Positive Total Shareholder Return S&P 500 Utility Index NSTAR NSTAR Total Shareholder Return NSTAR A+ Southern Company A Consolidated Edison, Inc. A- Dominion Resources, Inc. A- DPL Inc. A- Duke Energy Corporation A- Energy East Corporation A- NextEra Energy, Inc. A- KeySpan Corp. A- Niagara Mohawk Power Corporation A- Vectren Corporation A- Wisconsin Energy Corporation A- Xcel Energy Inc. A- ALLETE, Inc. BBB+ Alliant Energy Corporation BBB+ DTE Energy Company BBB+ Integrys Energy Group, Inc. BBB+ Kentucky Utilities Company BBB+ Louisville Gas and Electric Company BBB+ MDU Resources Group, Inc. BBB+ MidAmerican Energy Holdings Company BBB+ Northeast Utilities BBB+ OGE Energy Corp. BBB+ Pepco Holdings, Inc. BBB+ PG&E Corporation BBB+ PPL Corporation BBB+ Progress Energy, Inc. BBB+ SCANA Corporation BBB+ Sempra Energy BBB+ TECO Energy, Inc. BBB+ American Electric Power Company, Inc. BBB Avista Corporation BBB CenterPoint Energy, Inc. BBB Cleco Corporation BBB El Paso Electric Company BBB Entergy Corporation BBB Exelon Corporation BBB Great Plains Energy Inc. BBB Green Mountain Power Corporation BBB IDACORP, Inc. BBB NorthWestern Corporation BBB Pinnacle West Capital Corporation BBB Portland General Electric Company BBB Public Service Enterprise Group Inc. BBB UIL Holdings Corporation BBB Westar Energy, Inc. BBB Allegheny Energy, Inc. BBB- Ameren Corporation BBB- Black Hills Corporation BBB- CMS Energy Corporation BBB- Constellation Energy Group, Inc. BBB- Duquesne Light Company BBB- Edison International BBB- Empire District Electric Company BBB- FirstEnergy Corp. BBB- Hawaiian Electric Industries, Inc. BBB- IPALCO Enterprises, Inc. BBB- NiSource Inc. BBB- Otter Tail Corporation BBB- Puget Energy, Inc. BB+ NV Energy, Inc. BB+ PNM Resources, Inc. BB- |
 35 Massachusetts Proceeding Nearing Completion • Hearings and briefing process completed • Meets Massachusetts “net benefit” standard • Significant environmental benefits • Expand EE programs • Solar investment • Electric vehicle pilot • Net savings of $784M over 10 yrs – $5B over 40 yrs • Oral arguments on DOER’s motion rescheduled to November 17 th |
 36 • Very enthusiastic and confident about the merger • A truly compelling transaction combining two very strong companies • Offers significant customer, environmental and regional benefits • Attractive shareholder investment opportunity: Track record of top performance Low-risk investment profile Strong financial condition Key Takeaways |
 Appendix |
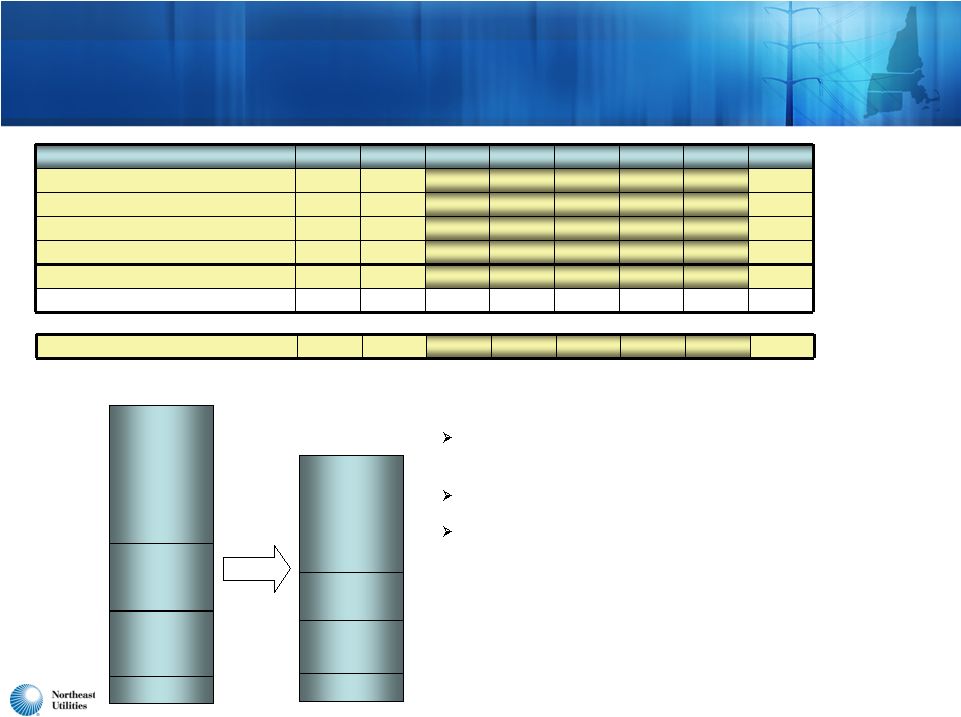 38 Greater Springfield Reliability Project $718M Interstate Reliability Project $218M Central Connecticut Reliability Project $301M NEEWS Projects 2011 Cash Flows Priors 2011 2012 2013 2014 2015 2016 Greater Springfield Reliability Project 153 170 232 119 44 0 0 718 Interstate Reliability Project 41 9 11 12 70 74 1 218 Central Connecticut Reliability Project 15 1 2 13 42 150 78 (2) 301 NEEWS Related Projects 33 28 17 7 0 0 0 85 Total NEEWS Projects - 2011 EEI (1) 242 208 262 151 156 224 79 1,322 (3) Total NEEWS Projects - 2010 EEI (1) 239 235 351 179 185 280 49 1,518 (3) Removal of AFUDC charges estimated to be incurred after June 1, 2011 due to FERC order allowing 100% of Construction Work in Progress to be placed into regional rates. Reduction of Interstate Reliability Project scope (310 Loop / Card Street scope). Related Projects: a combination of offsetting budget and AFUDC adjustments. Approximately $40M of the $85M has been placed in service. Primary Changes NEEWS Related Projects $85 M Revised NEEWS Project Costs (in $ millions) (3) NEEWS totals above do not reflect UI Investment in CL&P NEEWS Projects. Based on current NEEWS project estimates, a potential UI investment of $60 million has been reflected in the 2011 EEI net numbers above and in the NU consolidated earnings projections. For 2010 EEI numbers, the UI investment was estimated at $69M. Total NEEWS Projects – 2011 EEI Net UI 242 208 252 136 156 213 55 1,262 Greater Springfield Reliability Project $795M Interstate Reliability Project $301M Central Connecticut Reliability Project $338M NEEWS Related Projects $84 M 2010 EEI Estimate $1,518M 2011 EEI Estimate $1,322M (2) A portion of these capital expenditures is expected to be spent in 2017. (1) 2010 EEI cashflows include actual and forecasted AFUDC through December 31, 2015; 2011 EEI cashflows reflect actual AFUDC only through May 31, 2011. |
 39 Other Transmission Capital Projects In RSP / Not Yet in RSP $0 $50 $100 $150 $200 $250 $300 $350 $400 2012 2013 2014 2015 2016 In RSP Not Yet in RSP 2012-2016 NU Transmission Capital Program Other Projects – In Millions CL&P WMECO PSNH Total $1.0 Billion High confidence level in “Other Projects”, 77% in RSP as required. Breakdown of Other Projects: • 77% ($77M) - in RSP • 23% ($228M) - not yet in RSP 174 229 352 199 51 1990 Line Structure Replacement $63.3 Pittsfield / Greenfield Area Solution $107.6 NH Reliability Project in RSP $84.6 Hartford Area Reliability $53.2 West Springfield S/S Rebuild $48.3 NH Reliability Project not yet in RSP $154.2 Stamford Underground Cable $48.5 115 KV Hollow Core Insulator Repl $13.7 Scobie - Tewksbury Line $40.1 Southwest CT Upgrades $30.0 OPGW Communications Project $8.4 Manchester Area Solution $34.4 Separate Lines 348,310,371 & 383 $24.6 115 KV Relay Replacements $5.6 Maine Power Reliability $31.5 115 KV Hollow Core Insulator Repl $22.2 10 Additional Reliability Projects $15.8 Nashua Area Solution $28.4 South Meadow BPS $12.9 New Peaslee SS & 115 KV Line $24.0 OPGW Communications Project $10.4 Deerfield 2nd Auto Transformer $22.4 Obsolete Equipment Repl. Prgm. $7.8 New Maintenance Facility $12.9 Vehicle Purchases $7.0 Eagle Substation $7.7 36 Additional Reliability Projects $43.9 New Pease Substation $6.0 OPGW Communications Project $4.6 39 Additional Reliability Projects $31.6 $323.8 $199.4 $482.4 |
 40 Review of FERC-Approved Transmission ROEs 10.00% 10.50% 11.00% 11.50% 12.00% 12.50% 13.00% 13.50% Local Network Service Regional Network Service Base Northern Pass 2005-2008 Regional Projects NEEWS M-N Underground NU’s Local Network Service Tariff ROE (subject of states’ 9/30/11 Section 206 complaint to FERC) NE RTO Incentive adder of 50 basis points on PTF assets ISO-NE Planned Regional PTF projects in-service before 1/1/09 (D.C. Circuit Court rejected appeal on 1/29/10) Middletown-Norwalk advanced technical underground cable system 125 basis point NEEWS incentive (request for reconsideration denied by FERC on 6/28/11) 142 basis point Northern Pass incentive (request for reconsideration denied by FERC on 8/5/11) 11.14% 12.64% 12.89% 13.10% 12.56% 11.64% |
 41 Milestone Milestone Date Initial FERC filing declaratory order Dec 2008 FERC filing declaratory order May 2009 Transmission Service Agreement (‘TSA’) signed Oct 2010 ISO Technical Approval application filed Oct 2010 DOE Presidential Permit application filed Oct 2010 TSA FERC filing Dec 2010 FERC order received Feb 2011 New Hampshire Siting (‘SEC’) application filed Q4 2012 Complete siting approvals Q4 2013 Begin Construction 2014 In-Service Date Oct 2016 Project cost - (U.S. side) $ 1.1 Billion Northern Pass Transmission A $1.1 Billion Capital Investment (2009 -2016) Project Milestones (as of 11/1/11) |
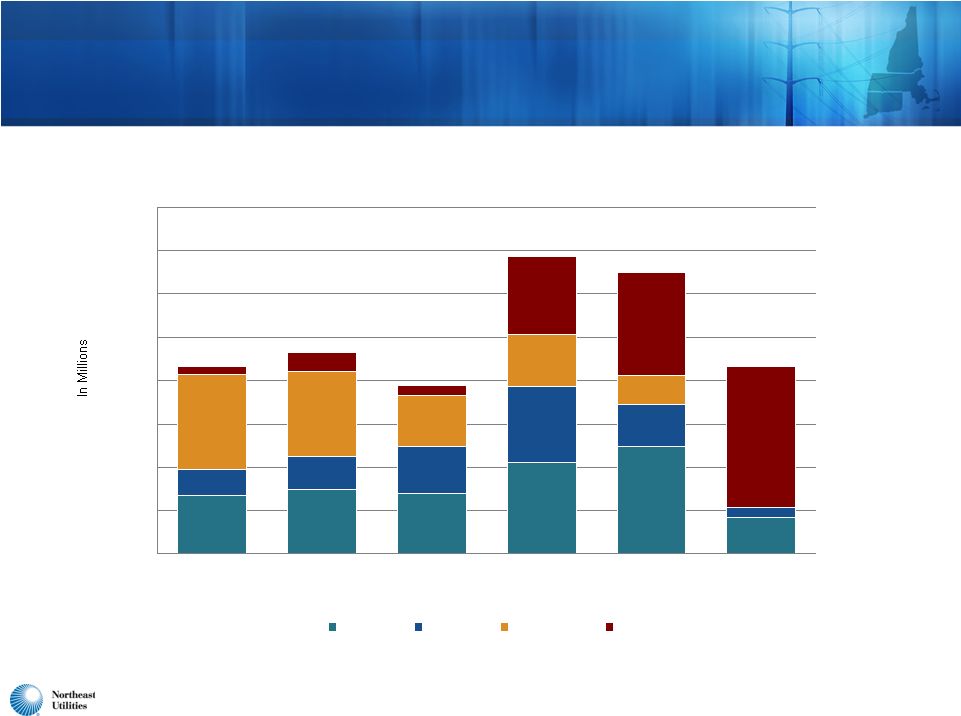 42 $135 $148 $139 $210 $247 $83 $59 $76 $109 $176 $97 $221 $198 $118 $122 $68 $43 $178 $238 $23 $1 $22 $19 $327 $0 $100 $200 $300 $400 $500 $600 $700 $800 2011 2012 2013 2014 2015 2016 CL&P PSNH WMECO Northern Pass NU Projected Transmission Capital Expenditures $434 $686 $650 $434 $388 $465 |
 43 NU Projected Transmission Year-End Rate Base $2,158 $2,205 $2,151 $2,157 $2,278 $2,416 $2,444 $336 $353 $395 $424 $474 $560 $743 $264 $382 $631 $725 $750 $874 $809 $839 $16 $0 $500 $1,000 $1,500 $2,000 $2,500 $3,000 $3,500 $4,000 $4,500 $5,000 2010 Actual 2011 2012 2013 2014 2015 2016 CL&P PSNH WMECO Northern Pass $2,758 $3,177 $3,306 $3,502 $3,866 $4,835 $2,940 |
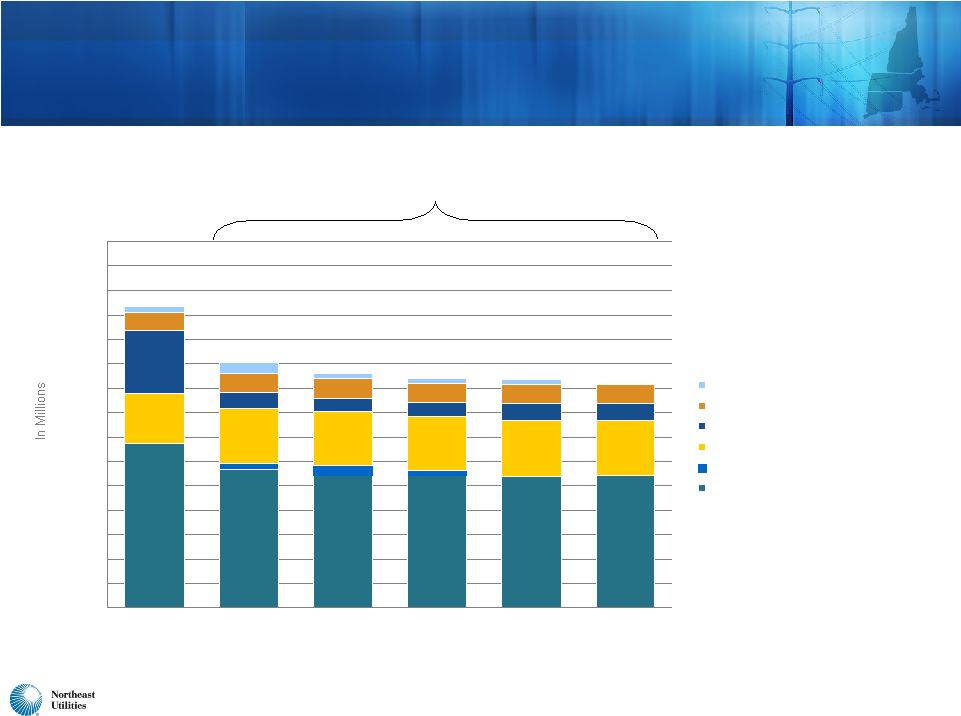 44 $338 $284 $271 $271 $268 $272 $12 $22 $11 $102 $111 $109 $110 $116 $112 $129 $35 $28 $29 $34 $34 $36 $39 $39 $39 $40 $20 $10 $10 $10 $40 $12 $0 $50 $100 $150 $200 $250 $300 $350 $400 $450 $500 $550 $600 $650 $700 $750 2011 Proj 2012 2013 2014 2015 2016 WMECO - Generation ($50m total) WMECO - Distribution ($197m total) PSNH - Generation ($160m total) PSNH - Distribution ($558m total) CL&P - Generation ($45m total) CL&P - Distribution ($1,366m total) Projected Electric Distribution and Generation Capital Expenditures – By Company 2012-2016 Projected Distribution & Generation Capital Spending $2.4 Billion $617 $458 $468 $470 $479 $501 |
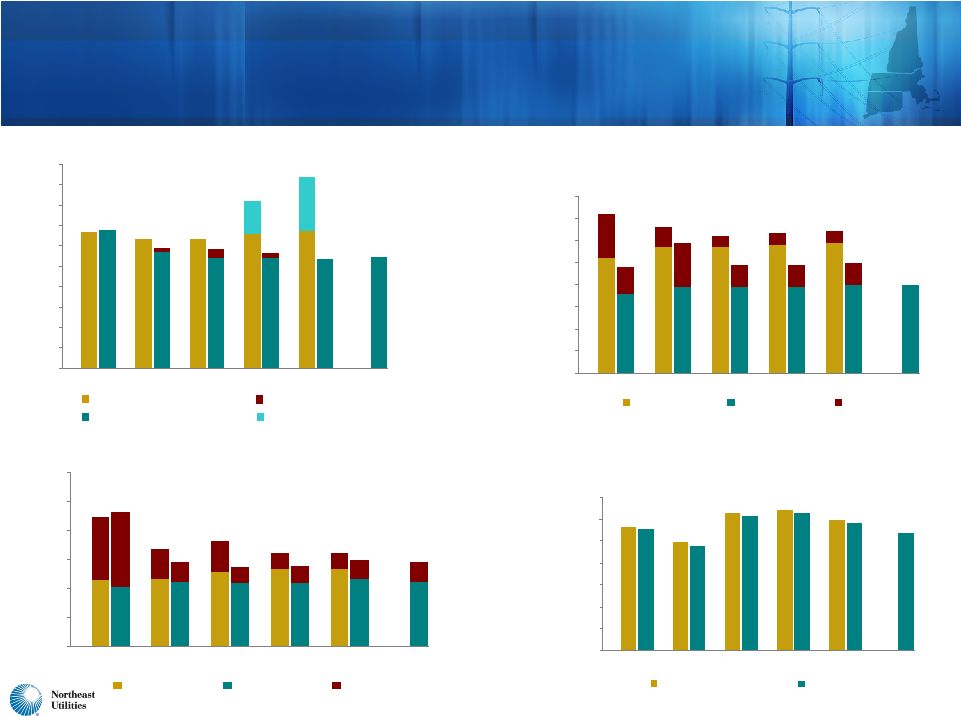 45 Projected Distribution/Generation Capital Expenditures 2011-2016 CL&P Distribution/Generation CapEx $272 $268 $335 $271 $328 $271 $316 $284 $318 $334$338 $83 $133 $1 $11 $22 $12 $0 $50 $100 $150 $200 $250 $300 $350 $400 $450 $500 2011 2014 2015 2016 2013 2012 2010 Distribution Forecast 2011 Distribution Forecast Renewable Generation AMI WMECO Distribution/Generation CapEx 2010 Forecast 2011 Forecast Generation $40 $40 $9 $20 $5 $10 $10 $36 $52 $57 $57 $58 $59 $39 $39 $39 $5 $5 $10 $12 $20 $0 $10 $20 $30 $40 $50 $60 $70 $80 2011 2014 2015 2016 2013 2012 PSNH Distribution/Generation CapEx 2010 Forecast 2011 Forecast Generation $116 $112 $51 $35 $53 $28 $29 $29 $34 $110 $109 $111 $133 $133 $128 $117 $114 $102 $109 $129 $34 $29 $0 $50 $100 $150 $200 $250 $300 2011 2014 2015 2016 2013 2012 Yankee Gas Distribution CapEx 2010 Forecast 2011 Forecast $113 $99 $95 $126 $123 $128 $125 $116 $107 $111 $119 $0 $20 $40 $60 $80 $100 $120 $140 2011 2014 2015 2016 2013 2012 |
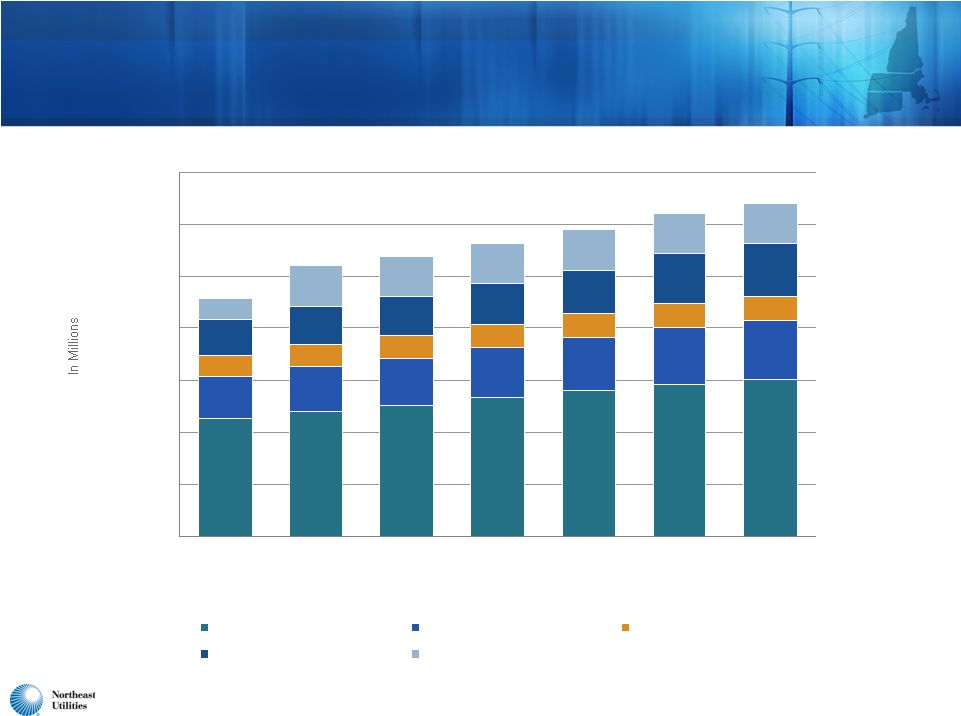 46 Actual and Projected Distribution and Generation Year-End Rate Base $2,273 $2,409 $2,532 $2,677 $2,812 $2,924 $3,023 $803 $861 $903 $968 $1,021 $1,082 $1,127 $412 $419 $427 $440 $449 $462 $682 $733 $753 $792 $851 $974 $1,031 $405 $797 $773 $763 $768 $759 $755 $463 $0 $1,000 $2,000 $3,000 $4,000 $5,000 $6,000 $7,000 2010 Actual 2011 2012 2013 2014 2015 2016 CL&P Distribution PSNH Distribution WMECO Distribution Yankee Gas Total Generation $4,575 $5,388 $5,640 $5,901 $6,201 $6,399 $5,219 |
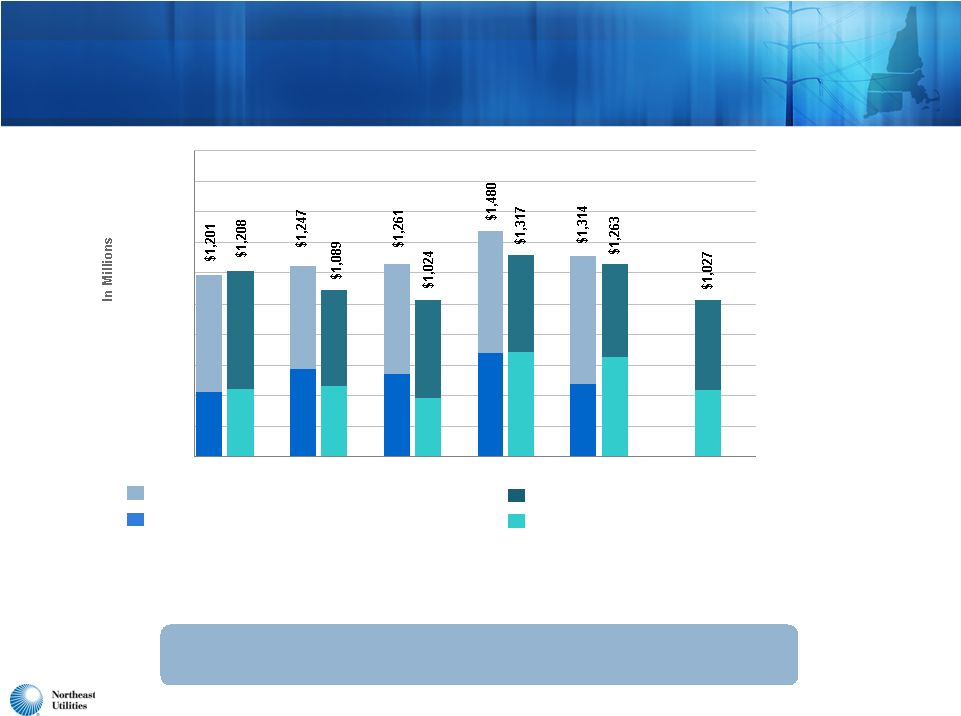
 47 2010-2016: NU Actual and Projected Capital Expenditures and Depreciation $1,208 $1,089 $1,024 $1,036 $1,027 $1,263 $1,317 $302 $305 $341 $364 $384 $406 $458 $0 $200 $400 $600 $800 $1,000 $1,200 $1,400 2010 Actual 2011 2012 2013 2014 2015 2016 Total Capex (incl. cost of removal and AFUDC)* Depreciation *Totals include capex at corporate service companies on behalf of operating companies of $69 million in 2010, and estimated at $46 million in 2011, $28 million in 2012, $34 million in 2013, $36 million in 2014, $29 million in 2015, and $28 million in 2016. Significant capital spending through 2016 |
 48 $29 $48 $50 $50 $52 $54 $36 $27 $27 $28 $29 $30 $18 $20 $20 $21 $22 $26 $26 $13 $28 $23 $0 $10 $20 $30 $40 $50 $60 $70 $80 $90 $100 $110 $120 $130 $140 $150 2011 Proj 2012 2013 2014 2015 2016 Aging Infrastructure Basic Business Peak Load/New Business Gas Supply Infrastructure WWL 2012-2016 Projected Yankee Gas Capital Spending $566 Million $111 $116 $125 $123 $95 Yankee Gas Projected Capital Expenditures Investing $566 million, leveraging natural gas as “the fuel of choice” Distribution system expansion: 2011 spending of $28 million for 16-mile Waterbury to Wallingford Line and modifications to the LNG facility (WWL); total project cost of $54M Gas supply infrastructure Accelerated replacement of cast iron / bare steel pipe: $40M annually starting in 2012 $107 Yankee Gas Strategy |
 49 • $54 million Waterbury-to-Wallingford/LNG project began in April 2010; scheduled to enter service this month • Fills gaps in supply portfolio and eliminates system constraint in Cheshire area • Increases vaporization capacity of Waterbury LNG project • Supports area’s growing customer demand Yankee Gas Continues to Identify Initiatives to Meet Customer Needs and Sales Growth 3.4 6.2 6.3 5.0 3.1 Yankee Gas Sales (firm) 2007 2008 2009 2010 2011 YTD |
 50 2009 – 2011 NU Consolidating EPS GAAP / Non-GAAP Reconciliation 2009 Actual 2010 Actual 2011 Guidance Distribution/Generation $0.92 $1.16 $1.30 – $1.35 Transmission 0.95 1.00 1.05 – 1.10 Total Regulated 1.87 2.16 2.35 – 2.45 NU Parent/Other (0.05) (0.05) (0.05) Total Regulated and Parent $1.82 $2.11 $2.30 – $2.40 Competitive 0.09 0.05 N/A NU Consolidated Operating Results (Non-GAAP) $1.91 $2.16 $2.30 – $2.40 NU-NSTAR Merger Expenses N/A (0.06) (0.20) NU Tax Settlement N/A 0.09 N/A NU Consolidated (GAAP) $1.91 $2.19 $2.10 - $2.20 |