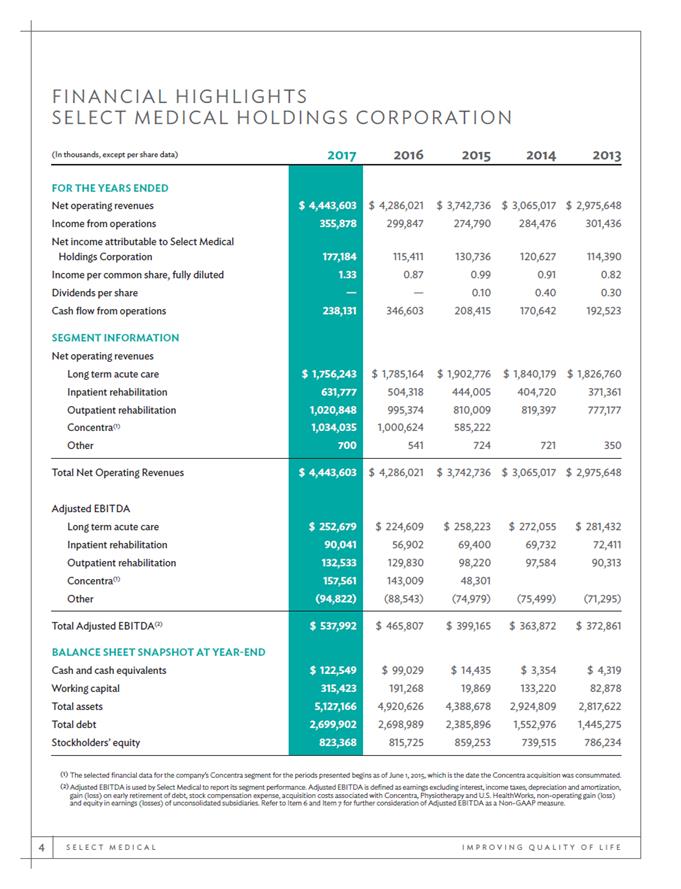
FINANCIAL HIGHLIGHT S SELE CT MEDICAL HOLDINGS C ORP OR ATION (In thousands, except per share data)20172016201520142013 (1) The selected financial data for the company’s Concentra segment for the periods presented begins as of June 1, 2015, which is the date the Concentra acquisition was consummated. (2) Adjusted EBITDA is used by Select Medical to report its segment performance. Adjusted EBITDA is defined as earnings excluding interest, income taxes, depreciation and amortization, gain (loss) on early retirement of debt, stock compensation expense, acquisition costs associated with Concentra, Physiotherapy and U.S. HealthWorks, non-operating gain (loss) and equity in earnings (losses) of unconsolidated subsidiaries. Refer to Item 6 and Item 7 for further consideration of Adjusted EBITDA as a Non-GAAP measure. 4 S E L E C T M E D I C A LI M P R O V I N G Q U A L I T Y O F L I F E FOR THE YEARS ENDED Net operating revenues Income from operations Net income attributable to Select Medical Holdings Corporation Income per common share, fully diluted Dividends per share Cash flow from operations SEGMENT INFORMATION Net operating revenues Long term acute care Inpatient rehabilitation Outpatient rehabilitation Concentra(1) Other $ 4,443,603 355,878 177,184 1.33 — 238,131 $ 1,756,243 631,777 1,020,848 1,034,035 700 $ 4,286,021$ 3,742,736 $ 3,065,017 $ 2,975,648 299,847274,790 284,476301,436 115,411130,736120,627114,390 0.87 0.99 0.910.82 — 0.100.40 0.30 346,603 208,415170,642192,523 $ 1,785,164$ 1,902,776$ 1,840,179 $ 1,826,760 504,318444,005 404,720 371,361 995,374810,009 819,397777,177 1,000,624585,222 541724 721350 Total Net Operating Revenues Adjusted EBITDA Long term acute care Inpatient rehabilitation Outpatient rehabilitation Concentra(1) Other $ 4,443,603 $ 252,679 90,041 132,533 157,561 (94,822) $ 4,286,021$ 3,742,736 $ 3,065,017 $ 2,975,648 $ 224,609 $ 258,223$ 272,055$ 281,432 56,902 69,400 69,73272,411 129,83098,220 97,58490,313 143,00948,301 (88,543) (74,979) (75,499) (71,295) Total Adjusted EBITDA(2) BALANCE SHEET SNAPSHOT AT YEAR-END Cash and cash equivalents Working capital Total assets Total debt Stockholders’ equity $ 537,992 $ 122,549 315,423 5,127,166 2,699,902 823,368 $ 465,807 $ 399,165 $ 363,872$ 372,861 $ 99,029$ 14,435$ 3,354$ 4,319 191,268 19,869133,22082,878 4,920,626 4,388,6782,924,809 2,817,622 2,698,9892,385,8961,552,9761,445,275 815,725859,253739,515786,234