Exhibit 99.2
Excerpts from Preliminary Offering Memorandum
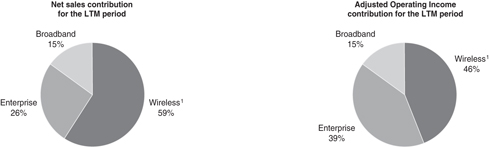
Our global market leadership as well as our diversified customer base, market exposure, product and geographic mix provide for a highly diversified, resilient and profitable business model with strong cash flow generation. During the LTM period, we generated net sales of $3,130 million, Adjusted Operating Income of $369 million, Adjusted EBITDA of $521 million and Adjusted EBITDA minus capital expenditures of $486 million. The following charts provide a breakdown of net sales and Adjusted Operating Income by segment:
| 1 | Includes ACCG and WNS segments |
Recent developments
Based upon currently available information, we estimate that for the year ended December 31, 2010 our net sales were in the range of $3,162 million to $3,187 million, our Adjusted Operating Income was in the range of $355 million to $368 million and our Adjusted EBITDA calculated on a pro forma basis was in the range of $487 million to $500 million. However, we have not completed our financial closing procedures for the three-month period and year ended December 31, 2010 and our actual results could be materially different from our estimates. In addition, Ernst & Young LLP, our independent public accounting firm, has not performed any procedures with respect to the financial information for the three-month period ended December 31, 2010, nor have they expressed any opinion or other form of assurance with respect to the estimated ranges presented above or their achievability. Our estimated range of Adjusted Operating Income for the year ended December 31, 2010 excludes the impact of amortization of purchased intangibles, restructuring, fees and expenses associated with the Transactions, the effect of purchase accounting and other special items.
Summary historical and unaudited pro forma consolidated financial information
The following table sets forth our summary historical financial information and summary unaudited pro forma consolidated financial information for the periods and dates indicated.
The summary historical financial information as of December 31, 2007, 2008 and 2009 and September 30, 2009 and 2010, for each of the years ended December 31, 2007, 2008 and 2009 and for the nine-month periods ended September 30, 2009 and 2010 have been prepared in accordance with U.S. GAAP. The balance sheet data as of December 31, 2008 and 2009 and the statement of operations and cash flow data for each of the three years ended December 31, 2007, 2008 and 2009 have been derived from the audited consolidated financial statements of our business. The balance sheet data as of December 31, 2007 has been derived from the audited consolidated financial statements of our business. The balance sheet data as of September 30, 2010 and the statement of operations and cash flow data for the nine-month periods ended September 30, 2009 and 2010, are derived from the unaudited interim consolidated financial statements of our business. The balance sheet data as of September 30, 2009 has been derived from the unaudited consolidated financial statements of our business. The unaudited interim consolidated financial statements have been prepared on the same basis as the audited consolidated financial statements and, in the opinion of our management, include all adjustments, consisting only of normal and recurring adjustments, necessary for a fair presentation of the information set forth herein. Interim financial results are not necessarily indicative of results that may be expected for the full fiscal year or any future reporting period.
The summary unaudited pro forma consolidated financial information for the twelve-month period ended September 30, 2010, has been calculated by subtracting the unaudited pro forma statement of operations for the nine-month period ended September 30, 2009 from the unaudited pro forma statement of operations for the year ended December 31, 2009 and then adding the unaudited pro forma statement of operations for the nine-month period ended September 30, 2010. The summary unaudited pro forma consolidated statement of operations data have been adjusted to give effect to the Transactions as if these events occurred on January 1, 2009. The summary unaudited pro forma consolidated balance sheet data have been adjusted to give effect to the Transactions as if these events occurred as of September 30, 2010. For purposes of the presentation, pro forma adjustments give effect to events that are directly attributable to the Transactions, are factually supportable, and in the case of the statement of operations data, expected to have a continuing impact on our business. The pro forma adjustments are based on available information and certain assumptions that management believes are reasonable.
The summary unaudited pro forma consolidated financial information is for information purposes only and does not purport to present what our results of operations and financial condition would have been had the Transactions actually occurred, nor does it project our results of operations for any future period or our financial condition at any future date. This information is only a summary.
| Historical | Pro forma twelve 2010 | |||||||||||||||||||||||
| Year ended December 31, | Nine months ended September 30, | |||||||||||||||||||||||
| (Dollars in thousands) | 2007 | 2008 | 2009 | 2009 | 2010 | |||||||||||||||||||
Statement of operations |
| |||||||||||||||||||||||
Net sales | $ | 1,930,763 | $ | 4,016,561 | $ | 3,024,859 | $ | 2,276,392 | $ | 2,381,607 | $ | 3,130,074 | ||||||||||||
Costs and expenses: | ||||||||||||||||||||||||
Cost of sales | 1,341,676 | 2,936,939 | 2,159,455 | 1,633,748 | 1,675,580 | 2,221,211 | ||||||||||||||||||
Selling, general and administrative | 262,203 | 501,820 | 404,562 | 303,353 | 331,866 | 438,034 | ||||||||||||||||||
Research and development | 34,312 | 134,777 | 107,447 | 82,457 | 89,426 | 115,222 | ||||||||||||||||||
Amortization of purchased intangible assets(1) | 5,027 | 97,863 | 85,217 | 62,473 | 62,292 | 152,955 | ||||||||||||||||||
Goodwill and other intangible asset impairments | — | 397,093 | — | — | — | — | ||||||||||||||||||
Restructuring costs(2) | 1,002 | 37,600 | 20,645 | 20,027 | 55,349 | 55,967 | ||||||||||||||||||
Total operating costs and expense | 1,644,220 | 4,106,092 | 2,777,326 | 2,102,058 | 2,214,513 | 2,983,390 | ||||||||||||||||||
Operating income (loss) | 286,543 | (89,531 | ) | 247,533 | 174,334 | 167,094 | 146,684 | |||||||||||||||||
Interest expense | (8,791 | ) | (148,860 | ) | (125,400 | ) | (99,465 | ) | (68,612 | ) | (211,985 | ) | ||||||||||||
Interest income | 22,663 | 18,811 | 4,648 | 3,350 | 4,146 | 1,762 | ||||||||||||||||||
Other income (expense), net | (1,356 | ) | (16,865 | ) | (11,227 | ) | (12,570 | ) | (1,361 | ) | (18 | ) | ||||||||||||
Income (loss) before income taxes | 299,059 | (236,445 | ) | 115,554 | 65,649 | 101,267 | (63,558 | ) | ||||||||||||||||
Income tax benefit (expense) | (94,218 | ) | 7,923 | (37,755 | ) | (24,917 | ) | (28,586 | ) | 35,879 | ||||||||||||||
Net income (loss) | $ | 204,841 | $ | (228,522 | ) | $ | 77,799 | $ | 40,732 | $ | 72,681 | $ | (27,679 | ) | ||||||||||
| Historical | Pro forma twelve 2010 | |||||||||||||||||||||||
| Year ended December 31, | Nine months ended September 30, | |||||||||||||||||||||||
| (Dollars in thousands) | 2007 | 2008 | 2009 | 2009 | 2010 | |||||||||||||||||||
Balance sheet data (at end of period): | ||||||||||||||||||||||||
Cash, cash equivalents and short-term investments | $ | 649,451 | $ | 412,111 | $ | 702,905 | $ | 592,906 | $ | 671,292 | $ | 243,735 | ||||||||||||
Property, plant and equipment, net | 525,305 | 468,140 | 412,388 | 427,721 | 355,232 | 447,400 | ||||||||||||||||||
Total assets | 5,106,571 | 4,062,760 | 3,941,316 | 3,931,050 | 3,909,359 | 5,546,047 | ||||||||||||||||||
Total debt | 2,595,819 | 2,041,784 | 1,544,478 | 1,545,668 | 1,347,728 | 2,722,895 | ||||||||||||||||||
Total stockholder’s equity | 1,280,008 | 1,008,358 | 1,548,983 | 1,481,737 | 1,671,732 | 1,552,000 | ||||||||||||||||||
Other financial data: | ||||||||||||||||||||||||
Net cash provided by (used in): | ||||||||||||||||||||||||
Operating activities | $ | 239,925 | $ | 361,921 | $ | 483,630 | $ | 361,428 | $ | 183,449 | ||||||||||||||
Investing activities | $ | (1,952,839 | ) | $ | (107,360 | ) | $ | (71,951 | ) | $ | (24,646 | ) | $ | (101,944 | ) | |||||||||
Financing activities | $ | 2,084,193 | $ | (472,577 | ) | $ | (167,740 | ) | $ | (164,351 | ) | $ | (193,163 | ) | ||||||||||
Capital expenditures | $ | 27,892 | $ | 57,824 | $ | 40,861 | $ | 31,738 | $ | 25,984 | ||||||||||||||
Other financial and operating data: | ||||||||||||||||||||||||
EBITDA(3) | $ | 332,329 | $ | 559,462 | $ | 426,878 | $ | 303,111 | $ | 300,043 | $ | 420,811 | ||||||||||||
Adjusted Operating Income(3) | $ | 298,802 | $ | 511,148 | $ | 389,135 | $ | 288,944 | $ | 283,316 | $ | 368,986 | ||||||||||||
Adjusted EBITDA(3) |
| $ | 521,184 | |||||||||||||||||||||
Net debt at period end(4) |
| $ | 2,479,160 | |||||||||||||||||||||
Ratio of net debt to Adjusted EBITDA(3)(4) |
| 4.8x | ||||||||||||||||||||||
Ratio of total debt to Adjusted EBITDA(3) |
| 5.2x | ||||||||||||||||||||||
Ratio of Adjusted EBITDA to net cash interest expense(3)(5) |
| 2.7x | ||||||||||||||||||||||
| (1) | Amortization of purchased intangible assets excludes amortization amounts included in cost of sales of $3,329, $15,458 and $14,522 for the years ended December 31, 2007, 2008 and 2009, respectively. Amortization of purchased intangible assets excludes amortization amounts included in cost of sales of $10,892 and $10,864 for the nine months ended September 30, 2009 and 2010, respectively. |
| (2) | Restructuring expense is primarily comprised of employee-related costs, including severance and related benefits, lease termination costs, asset impairments and equipment relocation costs |
| (3) | EBITDA consists of earnings before interest, taxes, depreciation and amortization (including impairments to goodwill and other intangible assets and adjustments for purchase accounting). Adjusted Operating Income consists of EBITDA, without an adjustment to add back depreciation, and eliminates non-operating income or expense and certain unusual or non-recurring items impacting results in a particular period if we believe that excluding such items provides investors meaningful information to understand our operating results and ability to analyze financial and business trends on a period-to-period basis. Adjusted EBITDA consists of Adjusted Operating Income with an adjustment to add back depreciation and eliminates |
the impact of certain non-cash, nonrecurring or other items that are included in net income, EBITDA and Adjusted Operating Income that we do not consider indicative of our ongoing operating performance. Presentations of these measures on a pro forma basis take into account the impact of the Transactions and, in the case of Adjusted EBITDA, certain other actions, events or circumstances that we believe affect our ongoing operating performance. |
| EBITDA, Adjusted Operating Income and Adjusted EBITDA and the related ratio data are not calculated or presented in accordance with U.S. GAAP and other companies in our industry may calculate EBITDA, Adjusted Operating Income and Adjusted EBITDA differently than we do. As a result, these financial measures have limitations as analytical and comparative tools and you should not consider these items in isolation, or as a substitute for analysis of our results as reported under U.S. GAAP. EBITDA, Adjusted Operating Income and Adjusted EBITDA should not be considered as measures of discretionary cash available to us to invest in the growth of our business. In calculating these financial measures, we make certain adjustments that are based on assumptions and estimates that may prove to have been inaccurate. In addition, in evaluating these financial measures, you should be aware that in the future we may incur expenses similar to those eliminated in this presentation. Our presentation of EBITDA, Adjusted Operating Income and Adjusted EBITDA should not be construed as an inference that our future results will be unaffected by unusual or non-recurring items. |
| The following table reconciles net income to EBITDA, Adjusted Operating Income and Adjusted EBITDA for the periods presented: |
| Historical | Pro forma | |||||||||||||||||||||||
| Year ended December 31, | Nine months ended September 30, | |||||||||||||||||||||||
| (Dollars in thousands) | 2007 | 2008 | 2009 | 2009 | 2010 | |||||||||||||||||||
Net income (loss) | $ | 204,841 | $ | (228,522 | ) | $ | 77,799 | $ | 40,732 | $ | 72,681 | $ | (27,679 | ) | ||||||||||
Interest expense | 8,791 | 148,860 | 125,400 | 99,465 | 68,612 | 211,985 | ||||||||||||||||||
Interest income | (22,663 | ) | (18,811 | ) | (4,648 | ) | (3,350 | ) | (4,146 | ) | (1,762 | ) | ||||||||||||
Income taxes | 94,218 | (7,923 | ) | 37,755 | 24,917 | 28,586 | (35,879 | ) | ||||||||||||||||
Depreciation | 38,786 | 95,762 | 90,833 | 67,982 | 61,154 | 95,528 | ||||||||||||||||||
Impairments and purchase accounting(a) | — | 456,775 | — | — | — | — | ||||||||||||||||||
Amortization | 8,356 | 113,321 | 99,739 | 73,365 | 73,156 | 178,618 | ||||||||||||||||||
EBITDA | $ | 332,329 | $ | 559,462 | $ | 426,878 | $ | 303,111 | $ | 300,043 | $ | 420,811 | ||||||||||||
Less: Depreciation | (38,786 | ) | (95,762 | ) | (90,833 | ) | (67,982 | ) | (61,154 | ) | (95,527 | ) | ||||||||||||
Other(b) | 5,259 | 47,448 | 53,090 | 53,815 | 44,427 | 43,702 | ||||||||||||||||||
Adjusted Operating Income | $ | 298,802 | $ | 511,148 | $ | 389,135 | $ | 288,944 | $ | 283,316 | $ | 368,986 | ||||||||||||
Add Back: Depreciation |
| 95,527 | ||||||||||||||||||||||
Equity-based incentive compensation(c) |
| 17,467 | ||||||||||||||||||||||
Cost savings initiatives(d) |
| 28,502 | ||||||||||||||||||||||
Other(e) |
| 10,702 | ||||||||||||||||||||||
Adjusted EBITDA |
| $ | 521,184 | |||||||||||||||||||||
| (a) | Reflects the charge recorded in 2008 for the impairment of goodwill and other intangible assets recognized in the acquisition of Andrew and $59.7 million in non-cash charges resulting from purchase accounting adjustments related to inventory. |
| (b) | Reflects restructuring charges of $1.0 million, $37.6 million, $20.6 million, $20.0 million, $55.3 million and $56.0 million for the years ended December 31, 2007, 2008 and 2009, the nine months ended September 30, 2009 and 2010 and the LTM period, respectively. Reflects other expense, net of $1.4 million, $16.9 million, $11.2 million, $12.6 million, $1.3 million and $18,000 for the years ended December 31, 2007, 2008 and 2009, the nine months ended September 30, 2009 and 2010 and the LTM period, respectively. For 2007, reflects $2.9 million of acquisition and one-time costs as a result of the Andrew acquisition. For 2008, reflects $5.2 million in acquisition and one-time costs and a $12.2 million benefit related to the alignment of benefit policies, both of which resulted from the Andrew acquisition. For both the year ended December 31, 2009 and the nine months ended September 30, 2009, reflects litigation charges of $21.2 million. For both the nine months ended September 30, 2010 and the LTM period, reflects an $8.6 million gain related to the settlement of a warranty claims dispute and a $3.7 million gain on the sale of a distribution facility. |
| (c) | Reflects non-cash, equity-based incentive compensation expense. |
| (d) | Reflects estimated annualized savings expected to be realized from in-process restructuring initiatives that are expected to be completed during fiscal 2011. |
| (e) | Reflects the anticipated $3.0 million annual management fee that we will pay to Carlyle after the close of the Acquisition, a $1.0 million expense relating to the SatCom product line sold in January 2008, estimated public company cost savings of $3.5 million and other non-recurring items of $3.2 million. |
| (4) | Represents total debt less cash, cash equivalents and short-term investments. |
| (5) | Net cash interest expense is net interest expense less $15.9 million of amortization of deferred financing fees for the LTM period. |
[Data presented on a pro forma basis give pro forma effect to the Transactions.]
[References to the “LTM period” refer to our unaudited results for the twelve months ended September 30, 2010 on a pro forma basis.]
[References to the “Transactions” refer to the transactions contemplated by that certain Agreement and Plan of Merger, dated as of October 26, 2010, among CommScope, Inc., Cedar I Holding Company, Inc. and Cedar I Merger Sub, Inc.]