Exhibit 99.1
| As of August 2, 2007 |
| This presentation contains “forward-looking statements” within the meaning of the Private Securities Litigation Reform Act of 1995. These statements are based on the current plans and expectations of Comfort Systems USA, Inc. and involve risks and uncertainties that could cause actual future activities and results of operations to be materially different from those set forth in the forward-looking statements. Important factors that could cause actual results to differ include, among others, national or regional weakness in non-residential construction activity, difficulty in obtaining or increased costs associated with bonding, shortages of labor and specialty building materials, the use of incorrect estimates for bidding a fixed price contract, undertaking contractual commitments that exceed our labor resources, retention of key management, the Company’s backlog failing to translate into actual revenue or profits, errors in the Company’s percentage of completion method of accounting, the result of competition in the Company’s markets, seasonal fluctuations in the demand for HVAC systems, the imposition of past and future liability from environmental, safety, and health regulations including the inherent risk associated with self-insurance, adverse litigation results and other risks detailed in the Company’s reports filed with the Securities and Exchange Commission. Important factors that could cause actual results to differ are discussed under “Item 1A. Company Risk Factors” in the Company’s Annual Report on Form 10-K for the year ended December 31, 2006. These forward-looking statements speak only as of the date of this filing. Comfort Systems USA, Inc. expressly disclaims any obligation or undertaking to release publicly any updates or revisions to any forward-looking statement contained herein to reflect any change in Comfort Systems USA, Inc.’s expectations with regard thereto or any change in events, conditions or circumstances on which any such statement is based. Safe Harbor Statement |
| To be the nation’s premier HVAC and mechanical systems installation and services provider. Vision |

| Mission To provide the best value HVAC and mechanical systems installation and service, principally in the mid-market commercial, industrial, and institutional sectors, while caring for our customers, employees and the environment and realizing superior returns for our stockholders. |
| Act with honesty and integrity. Show respect for all stakeholders. Exceed customer expectations. Seek “win-win” solutions. Demonstrate spirit and drive. Pursue innovation. Achieve premier safety performance. Commit to energy efficiency. Communicate openly. Impact our communities positively. Think national. Act local. Values |

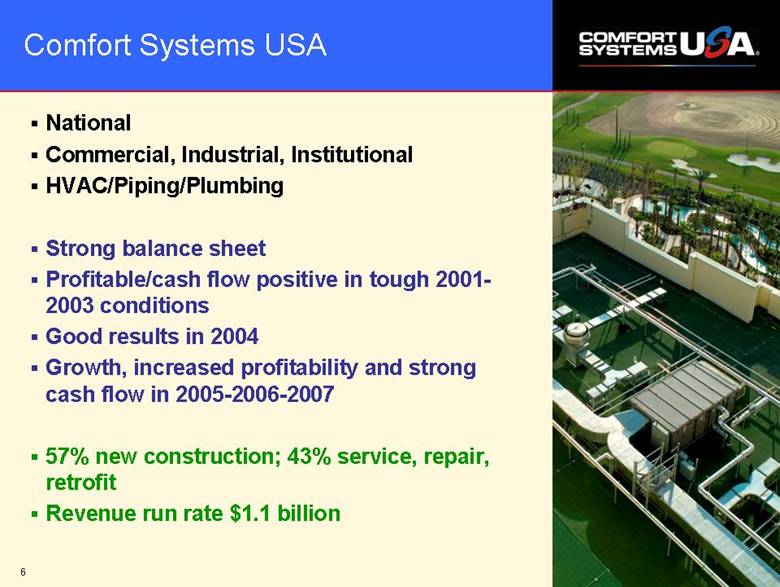
| Comfort Systems USA National Commercial, Industrial, Institutional HVAC/Piping/Plumbing Strong balance sheet Profitable/cash flow positive in tough 2001-2003 conditions Good results in 2004 Growth, increased profitability and strong cash flow in 2005-2006-2007 57% new construction; 43% service, repair, retrofit Revenue run rate $1.1 billion |
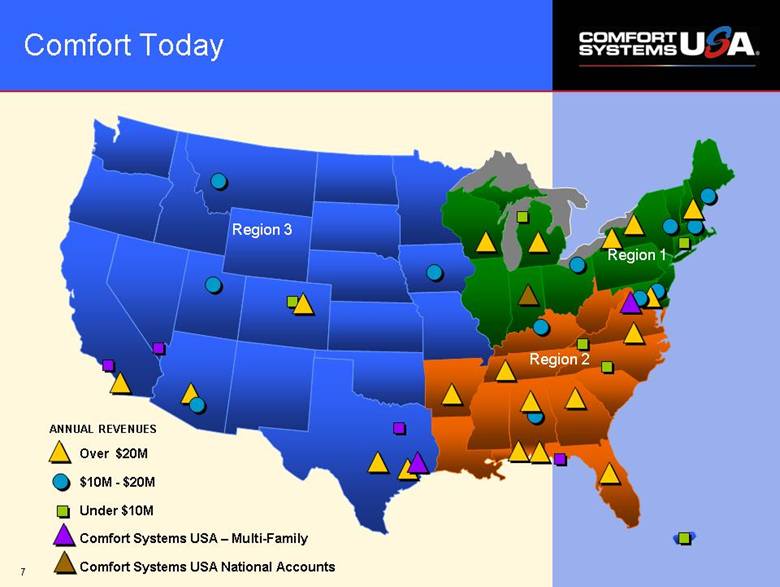
| Comfort Today Over $20M $10M - $20M Under $10M Comfort Systems USA – Multi-Family Comfort Systems USA National Accounts ANNUAL REVENUES Region 3 Region 1 Region 2 |
| What We Do Commercial HVAC Quality People. Building Solutions. Applied Systems Piping Service, Repair, Retrofit |

| What We Do |
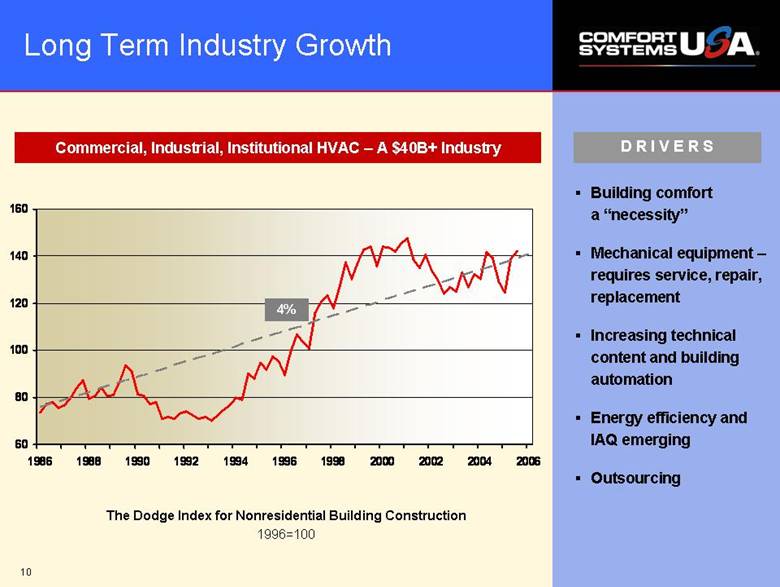
| Long Term Industry Growth The Dodge Index for Nonresidential Building Construction 1996=100 Building comfort a “necessity” Mechanical equipment – requires service, repair, replacement Increasing technical content and building automation Energy efficiency and IAQ emerging Outsourcing Commercial, Industrial, Institutional HVAC – A $40B+ Industry DRIVERS 4% 60 80 100 120 140 160 1986 1988 1990 1992 1994 1996 1998 2000 2002 2004 2006 |
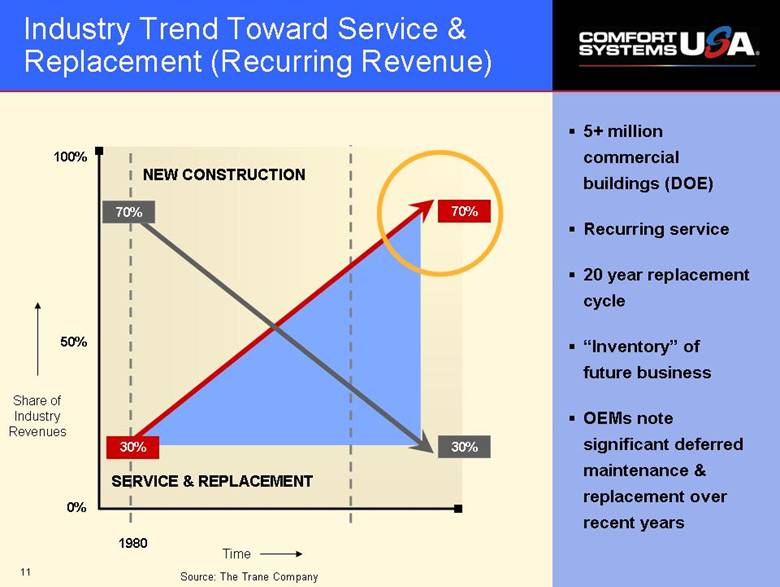
| Industry Trend Toward Service & Replacement (Recurring Revenue) 5+ million commercial buildings (DOE) Recurring service 20 year replacement cycle “Inventory” of future business OEMs note significant deferred maintenance & replacement over recent years Source: The Trane Company NEW CONSTRUCTION 70% 30% 0% 50% 100% 1980 Share of Industry Revenues Time 70% 30% SERVICE & REPLACEMENT |
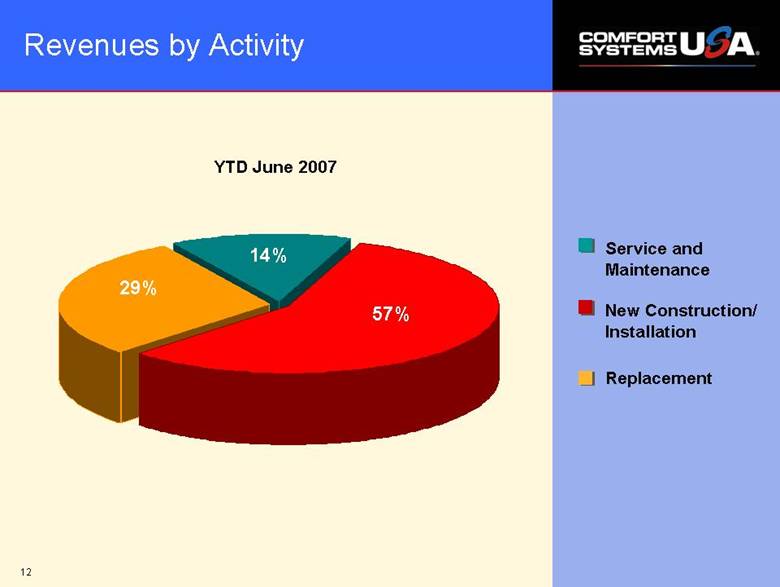
| 14% 29% 57% Revenues by Activity New Construction/ Installation Replacement Service and Maintenance YTD June 2007 |
| PROJECT SIZE # OF PROJECTS (As of June 30, 2007) Diverse Project Mix Average Project Size $410,000 Average Project Length 6-9 months Value of Projects >$1M $1,005.2M Value of Projects <$1M $666.0M 3,783 210 45 12 4 TOTAL PROJECTS = 4,054 0 2,000 4,000 0-1M 1-5M 5-10M 10-15M 15+M |

| Select General Contractors *Trademarks and logos are the property of their respective owners. |
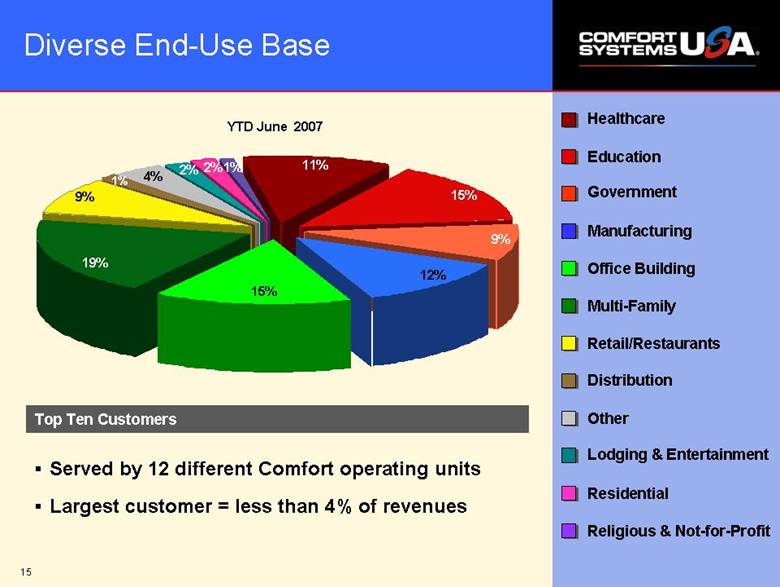
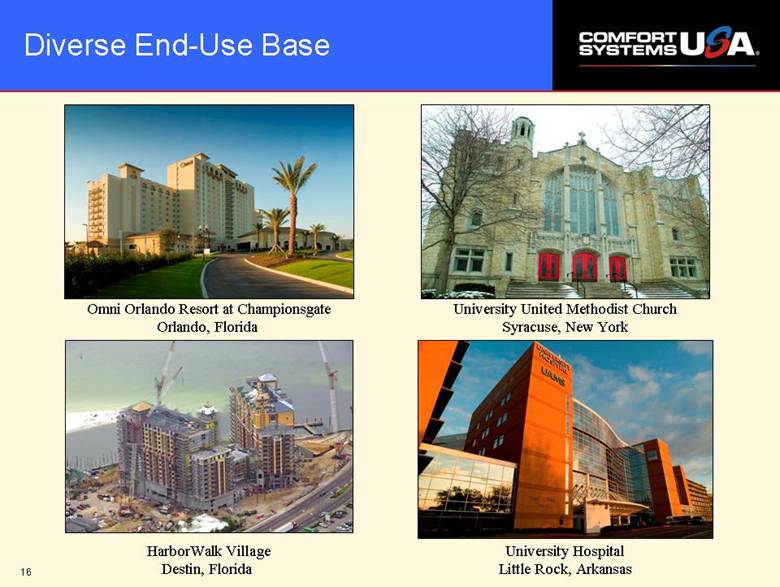
| Healthcare Education Government Manufacturing Office Building Multi-Family Retail/Restaurants Distribution Other Residential 15% 9% 11% 15% 19% 9% 1% 12% 2% 1% Top Ten Customers Diverse End-Use Base Served by 12 different Comfort operating units Largest customer = less than 4% of revenues Lodging & Entertainment YTD June 2007 4% 2% Religious & Not-for-Profit |
| Diverse End-Use Base Omni Orlando Resort at Championsgate Orlando, Florida HarborWalk Village Destin, Florida University Hospital Little Rock, Arkansas University United Methodist Church Syracuse, New York |
| Competitive Advantages High quality operations Ability to leverage and proliferate technical expertise Ability to collaborate on large jobs and share labor National multi-location service capability Purchasing economics Financing Bonding and insurance |
| Financial Overview |
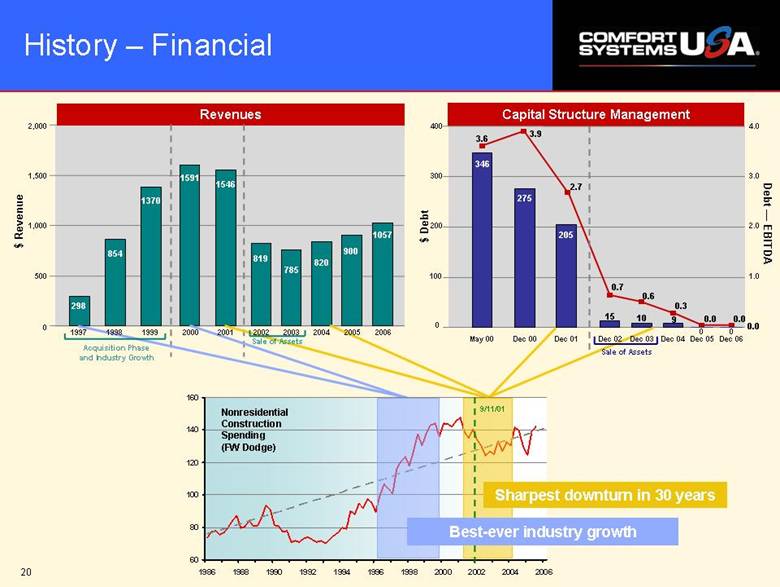
| History 1997 to 1999 – IPO, rapid acquisition growth, strong organic growth 2000 – Integration challenges, trough in profits, high leverage, start of rationalization of operations 2001 – Working capital conservation increases cash flow/reduces debt 2002 to 2003 – Sale of assets; smaller stronger platform weathers worst industry conditions in 30 years 2004 – Renewed growth 2005 – Increased growth and profitability 2006 – Increased productivity and growth; push to increase service, repair, retrofit |
| Capital Structure Management $ Revenue Revenues 298 854 1370 1591 1546 2,000 1,500 1,000 500 0 819 Acquisition Phase and Industry Growth 785 820 1057 900 400 300 200 $ Debt Debt –– EBITDA 0.6 346 275 205 15 10 4.0 3.0 2.0 1.0 3.6 3.9 2.7 0.7 9 0.3 0.0 0.0 Sharpest downturn in 30 years Best-ever industry growth History – Financial Nonresidential Construction Spending (FW Dodge) 9/11/01 Dec 06 0.0 0 100 0 Sale of Assets 2000 2001 2002 1997 1998 1999 2003 2004 2005 2006 May 00 Dec 00 Dec 01 Dec 02 Dec 03 Dec 04 Dec 05 0 Sale of Assets 60 80 100 120 140 160 1986 1988 1990 1992 1994 1996 1998 2000 2002 2004 2006 |
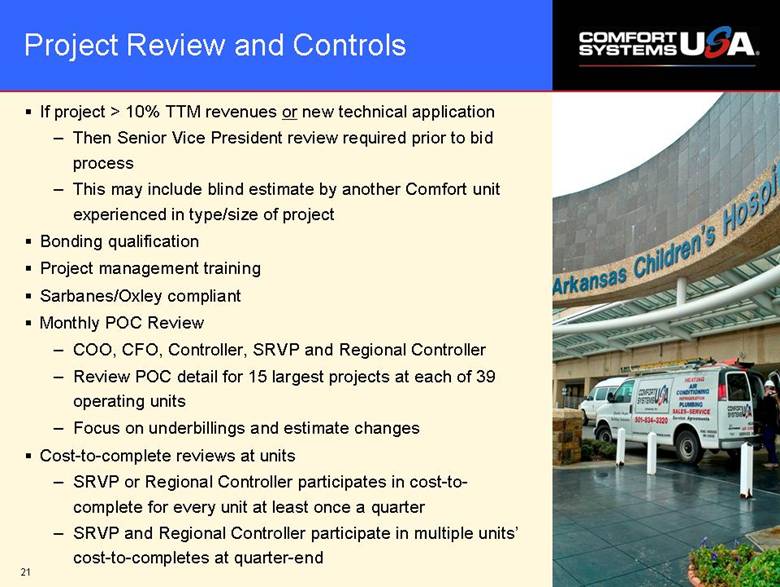
| Project Review and Controls If project > 10% TTM revenues or new technical application Then Senior Vice President review required prior to bid process This may include blind estimate by another Comfort unit experienced in type/size of project Bonding qualification Project management training Sarbanes/Oxley compliant Monthly POC Review COO, CFO, Controller, SRVP and Regional Controller Review POC detail for 15 largest projects at each of 39 operating units Focus on underbillings and estimate changes Cost-to-complete reviews at units SRVP or Regional Controller participates in cost-to-complete for every unit at least once a quarter SRVP and Regional Controller participate in multiple units’ cost-to-completes at quarter-end |
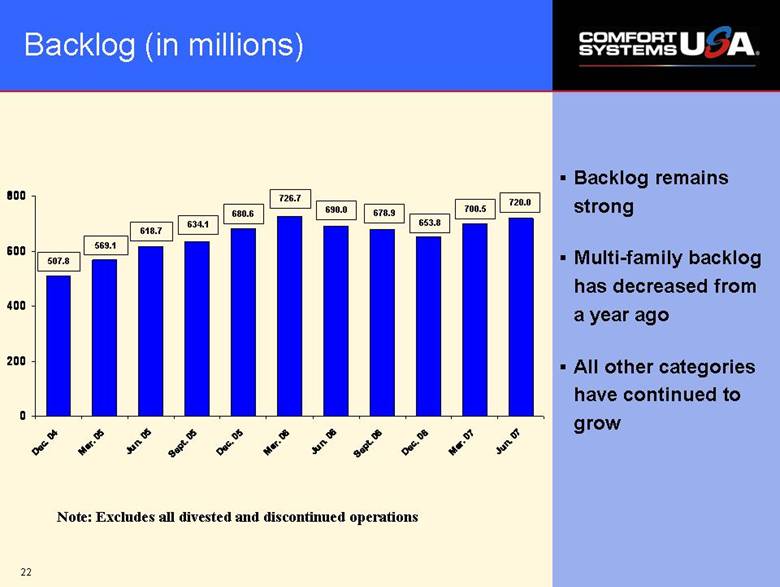
| Backlog (in millions) Note: Excludes all divested and discontinued operations Backlog remains strong Multi-family backlog has decreased from a year ago All other categories have continued to grow 507.8 569.1 618.7 634.1 726.7 680.6 690.0 678.9 653.8 700.5 720.0 0 200 400 600 800 Dec. 04 Mar. 05 Jun. 05 Sept. 05 Dec. 05 Mar. 06 Jun. 06 Sept. 06 Dec. 06 Mar. 07 Jun. 07 |
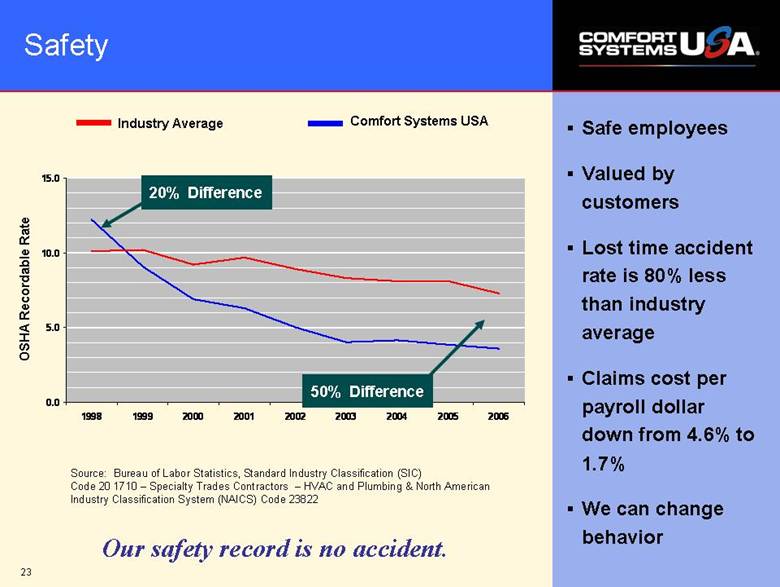
| Safe employees Valued by customers Lost time accident rate is 80% less than industry average Claims cost per payroll dollar down from 4.6% to 1.7% We can change behavior OSHA Recordable Rate Source: Bureau of Labor Statistics, Standard Industry Classification (SIC) Code 20 1710 – Specialty Trades Contractors – HVAC and Plumbing & North American Industry Classification System (NAICS) Code 23822 Safety 50% Difference 20% Difference Industry Average Comfort Systems USA Our safety record is no accident. 0.0 5.0 10.0 15.0 1998 1999 2000 2001 2002 2003 2004 2005 2006 |
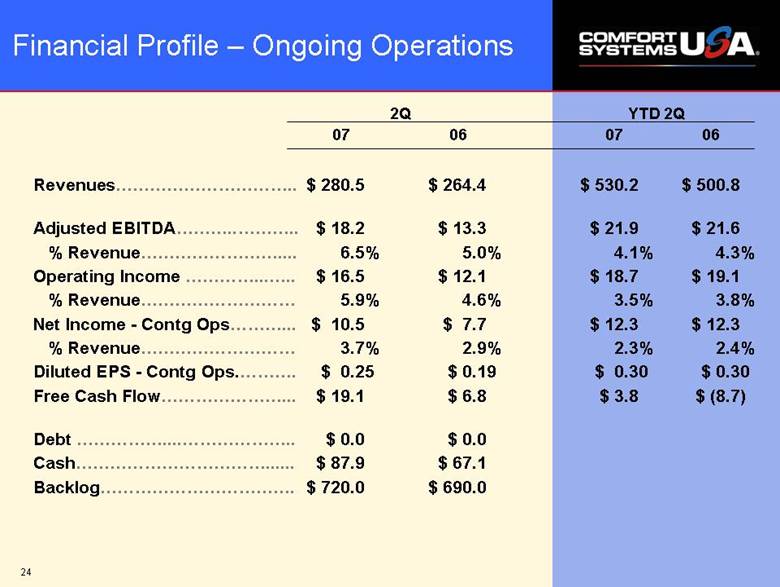
| Financial Profile – Ongoing Operations Revenues $ 280.5 $ 264.4 $ 530.2 $ 500.8 Adjusted EBITDA $ 18.2 $ 13.3 $ 21.9 $ 21.6 % Revenue 6.5% 5.0% 4.1% 4.3% Operating Income $ 16.5 $ 12.1 $ 18.7 $ 19.1 % Revenue 5.9% 4.6% 3.5% 3.8% Net Income - Contg Ops $ 10.5 $ 7.7 $ 12.3 $ 12.3 % Revenue 3.7% 2.9% 2.3% 2.4% Diluted EPS - Contg Ops $ 0.25 $ 0.19 $ 0.30 $ 0.30 Free Cash Flow $ 19.1 $ 6.8 $ 3.8 $ (8.7) Debt $ 0.0 $ 0.0 Cash $ 87.9 $ 67.1 Backlog $ 720.0 $ 690.0 2Q YTD 2Q 07 06 07 06 |
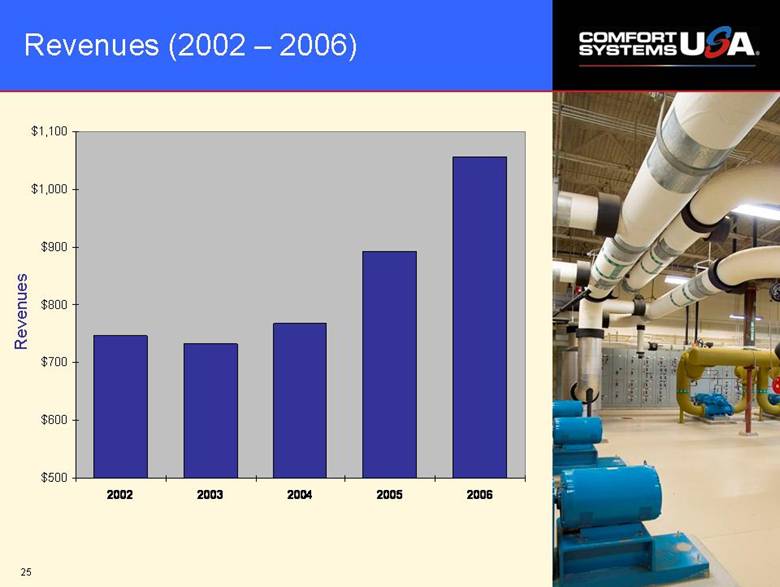
| Revenues (2002 – 2006) Revenues $500 $600 $700 $800 $900 $1,000 $1,100 2002 2003 2004 2005 2006 |
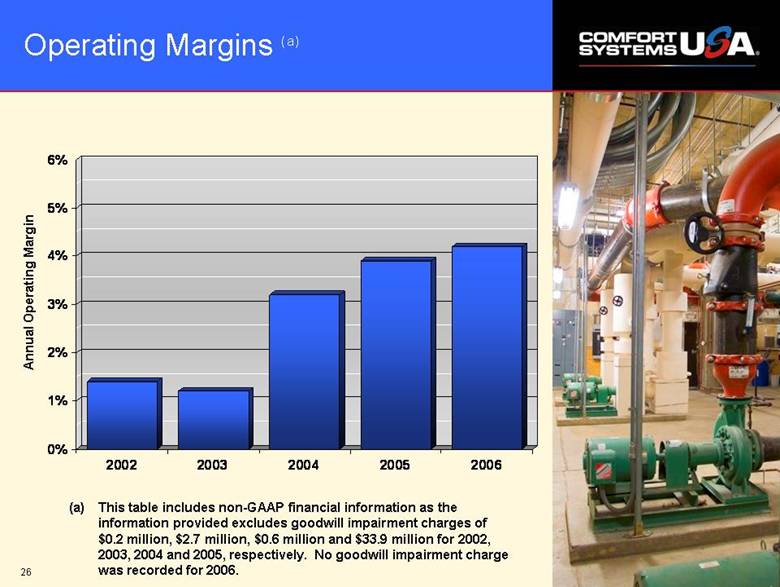
| Operating Margins (a) Annual Operating Margin (a) This table includes non-GAAP financial information as the information provided excludes goodwill impairment charges of $0.2 million, $2.7 million, $0.6 million and $33.9 million for 2002, 2003, 2004 and 2005, respectively. No goodwill impairment charge was recorded for 2006. 0% 1% 2% 3% 4% 5% 6% 2002 2003 2004 2005 2006 |
| Financial Strengths Market share up – revenue and profit performance better than industry Commitment to cost containment $87.9 million cash at 6/30/07; substantial credit capacity if needed Positive free cash flow for last eight calendar years |
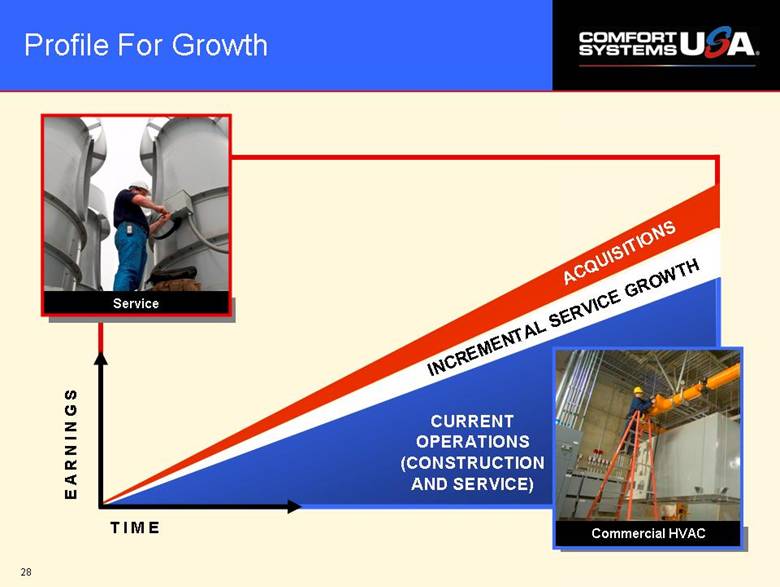
| Profile For Growth T I M E E A R N I N G S Service ACQUISITIONS INCREMENTAL SERVICE GROWTH Commercial HVAC CURRENT OPERATIONS (CONSTRUCTION AND SERVICE) |
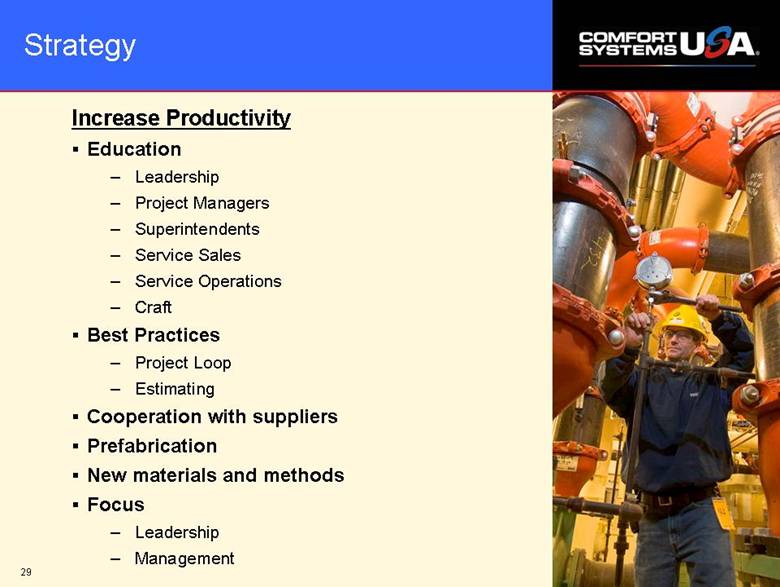
| Strategy Increase Productivity Education Leadership Project Managers Superintendents Service Sales Service Operations Craft Best Practices Project Loop Estimating Cooperation with suppliers Prefabrication New materials and methods Focus Leadership Management |
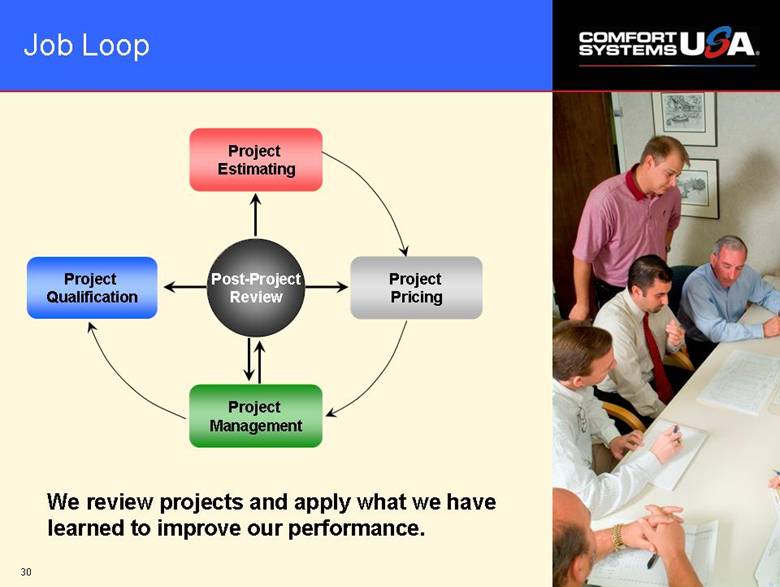
| Job Loop Project Estimating Post-Project Review We review projects and apply what we have learned to improve our performance. Project Pricing Project Qualification Project Management |
| The only things that evolve by themselves in an organization are disorder, friction and malperformance. -Peter Drucker |
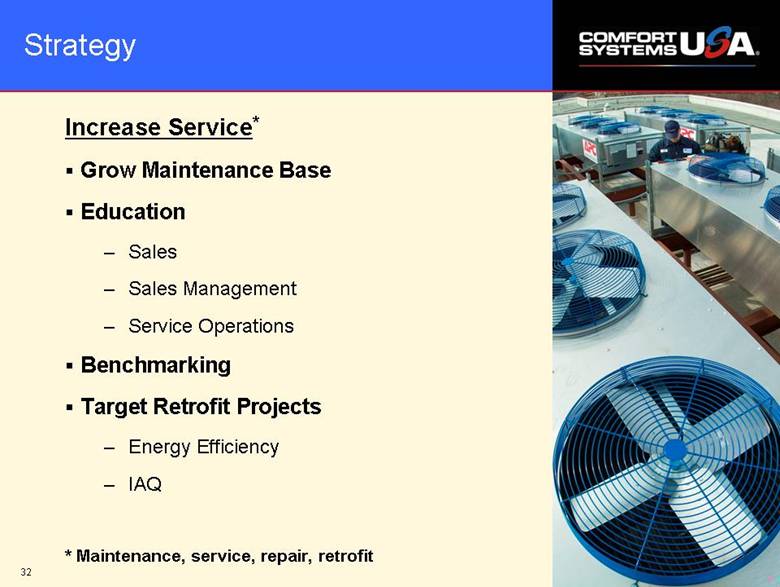
| Strategy Increase Service* Grow Maintenance Base Education Sales Sales Management Service Operations Benchmarking Target Retrofit Projects Energy Efficiency IAQ * Maintenance, service, repair, retrofit |
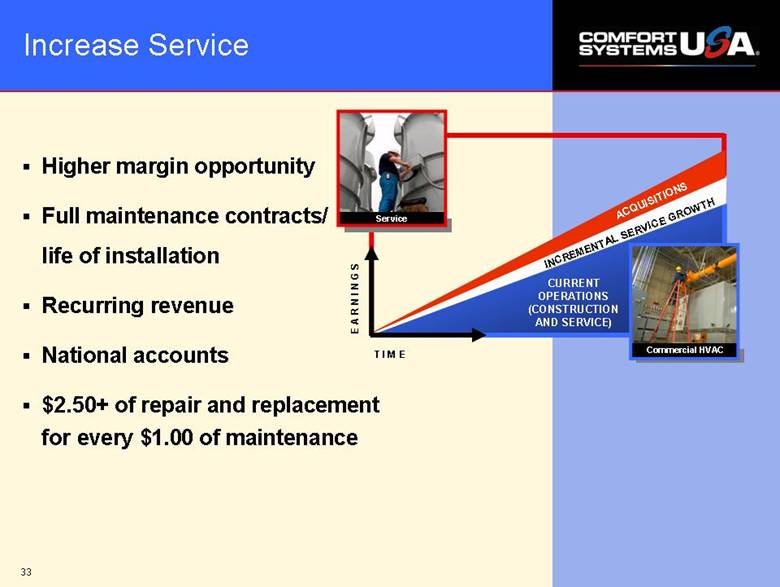
| Higher margin opportunity Full maintenance contracts/ life of installation Recurring revenue National accounts $2.50+ of repair and replacement for every $1.00 of maintenance Increase Service T I M E E A R N I N G S Service ACQUISITIONS INCREMENTAL SERVICE GROWTH Commercial HVAC CURRENT OPERATIONS (CONSTRUCTION AND SERVICE) |
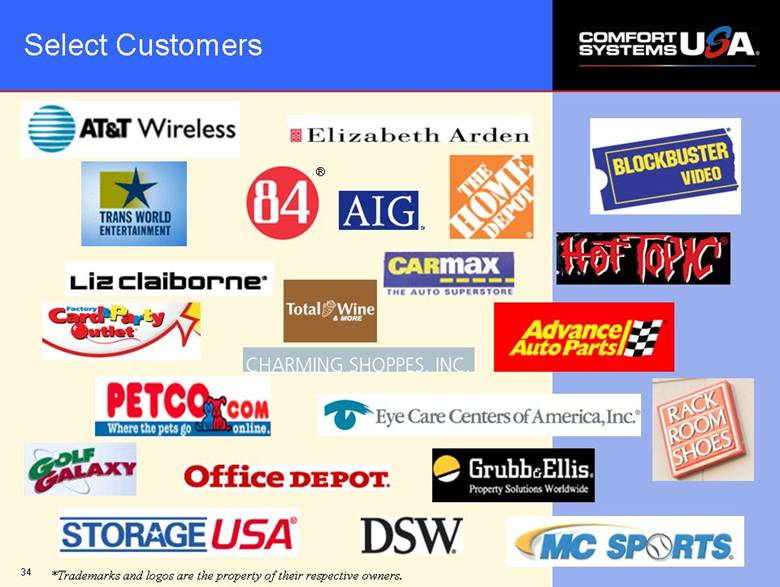
| Select Customers *Trademarks and logos are the property of their respective owners. |
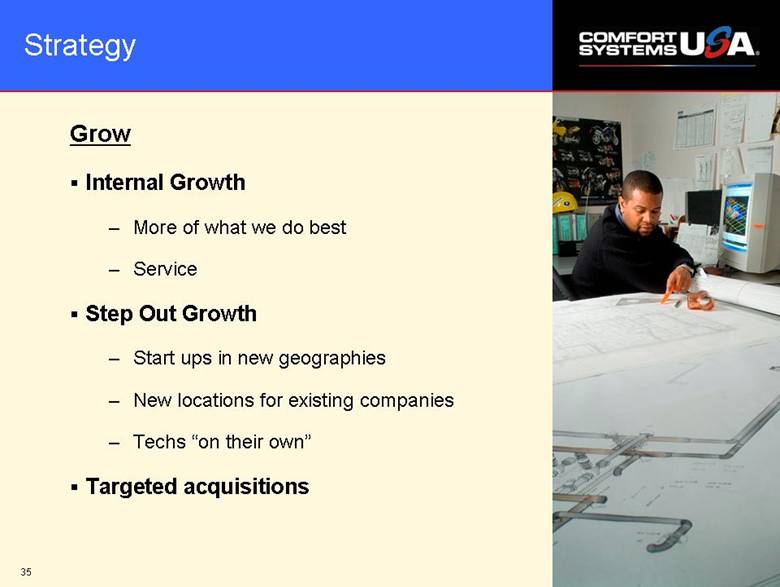
| Strategy Grow Internal Growth More of what we do best Service Step Out Growth Start ups in new geographies New locations for existing companies Techs “on their own” Targeted acquisitions |
| $20 million in revenue Full service mechanical In a growing market where we are not now Company that has performed well in the past and has continuing demonstrable upside Organizational structure capable of sustaining/improving the company Ownership/management that wants to stay on to operate company The Ideal Candidate |
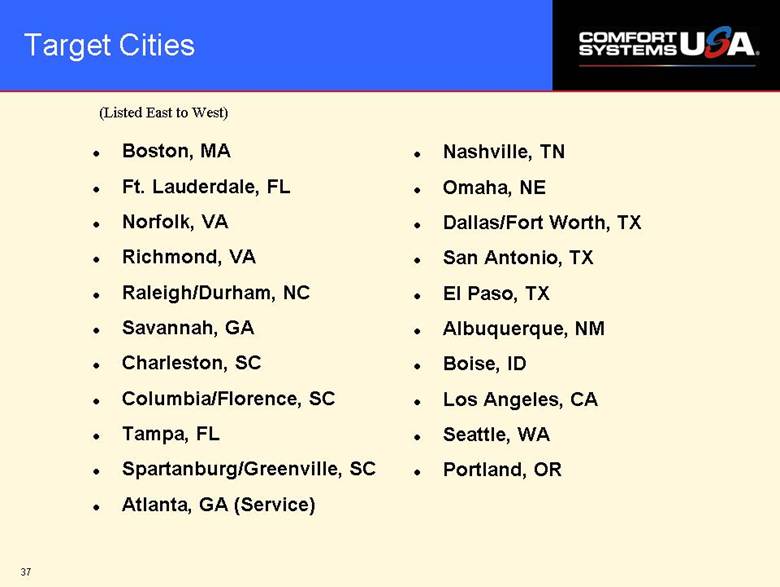
| Boston, MA Ft. Lauderdale, FL Norfolk, VA Richmond, VA Raleigh/Durham, NC Savannah, GA Charleston, SC Columbia/Florence, SC Tampa, FL Spartanburg/Greenville, SC Atlanta, GA (Service) Target Cities (Listed East to West) Nashville, TN Omaha, NE Dallas/Fort Worth, TX San Antonio, TX El Paso, TX Albuquerque, NM Boise, ID Los Angeles, CA Seattle, WA Portland, OR |
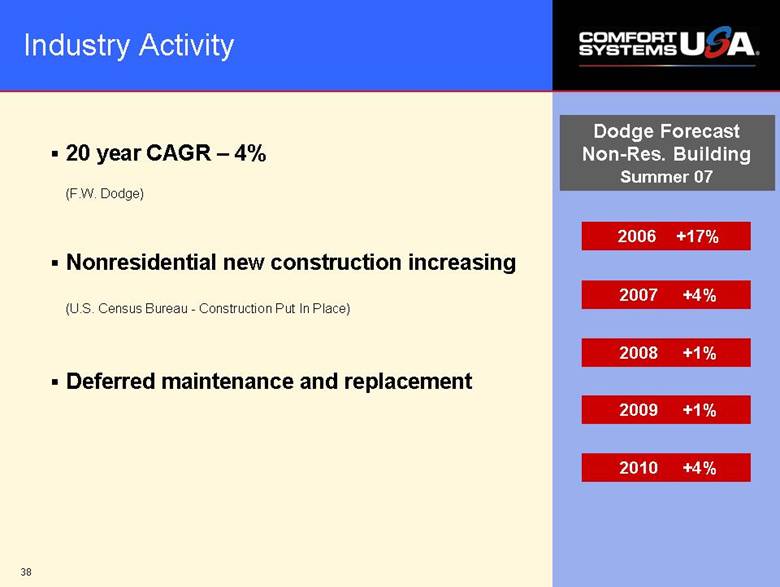
| Industry Activity 20 year CAGR – 4% (F.W. Dodge) Nonresidential new construction increasing (U.S. Census Bureau - Construction Put In Place) Deferred maintenance and replacement Dodge Forecast Non-Res. Building Summer 07 2006 +17% 2007 +4% 2008 +1% 2009 +1% 2010 +4% |
| Outlook Long-Term $40+ billion fragmented industry HVAC is a basic necessity Commercial construction strong Growing installed base for recurring maintenance, service, repair and retrofit Scale opportunities – service, purchasing, bonding, best practices Diverse customer base and geography Energy efficiency and IAQ Financially and operationally sound – ready to grow |
| C O N T A C T: Bill George Executive Vice President and CFO 1-800-723-8431 bgeorge@comfortsystemsusa.com www.comfortsystemsusa.com |