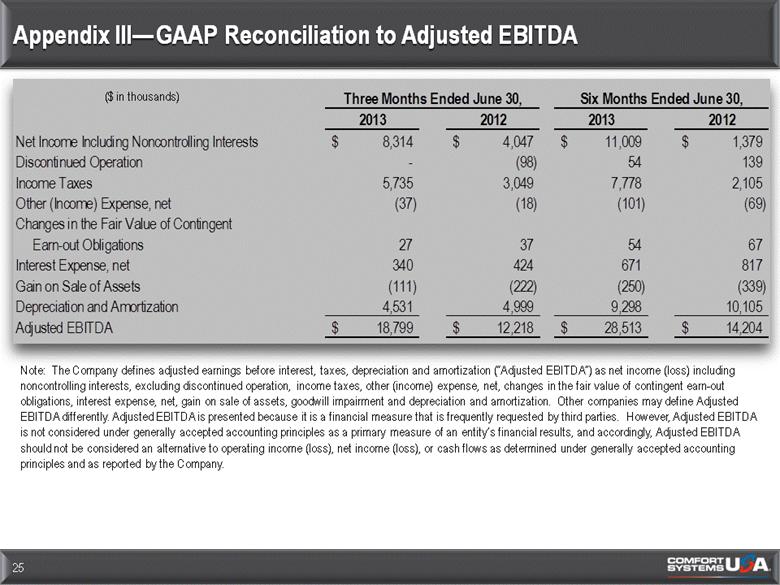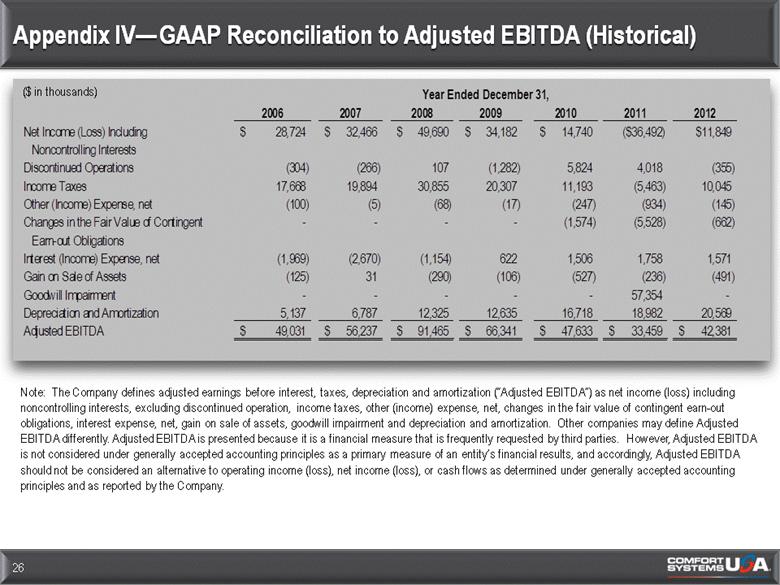
| ($ in thousands) Appendix IV—GAAP Reconciliation to Adjusted EBITDA (Historical) 26 Note: The Company defines adjusted earnings before interest, taxes, depreciation and amortization (“Adjusted EBITDA”) as net income (loss) including noncontrolling interests, excluding discontinued operation, income taxes, other (income) expense, net, changes in the fair value of contingent earn-out obligations, interest expense, net, gain on sale of assets, goodwill impairment and depreciation and amortization. Other companies may define Adjusted EBITDA differently. Adjusted EBITDA is presented because it is a financial measure that is frequently requested by third parties. However, Adjusted EBITDA is not considered under generally accepted accounting principles as a primary measure of an entity’s financial results, and accordingly, Adjusted EBITDA should not be considered an alternative to operating income (loss), net income (loss), or cash flows as determined under generally accepted accounting principles and as reported by the Company. 2006 2007 2008 2009 2010 2011 2012 Net Income (Loss) Including Noncontrolling Interests 28,724 $ 32,466 $ 49,690 $ 34,182 $ 14,740 $ ($36,492) $11,849 Discontinued Operations (304) (266) 107 (1,282) 5,824 4,018 (355) Income Taxes 17,668 19,894 30,855 20,307 11,193 (5,463) 10,045 Other (Income) Expense, net (100) (5) (68) (17) (247) (934) (145) Changes in the Fair Value of Contingent Earn-out Obligations - - - - (1,574) (5,528) (662) Interest (Income) Expense, net (1,969) (2,670) (1,154) 622 1,506 1,758 1,571 Gain on Sale of Assets (125) 31 (290) (106) (527) (236) (491) Goodwill Impairment - - - - - 57,354 - Depreciation and Amortization 5,137 6,787 12,325 12,635 16,718 18,982 20,569 Adjusted EBITDA 49,031 $ 56,237 $ 91,465 $ 66,341 $ 47,633 $ 33,459 $ 42,381 $ Year Ended December 31, |