Exhibit 99.1
Quality People. Building Solutions. NYSE: FIX November 2, 2021
SAFE HARBOR Certain statements and information in this presentation may constitute forward - looking statements within the meaning of applica ble securities laws and regulations. The words “believe,” “expect,” “anticipate,” “plan,” “intend,” “foresee,” “should,” “would,” “c ould,” or other similar expressions are intended to identify forward - looking statements, which are generally not historic in nature. These forward - looki ng statements are based on the current expectations and beliefs of Comfort Systems USA, Inc. and its subsidiaries (collectively, the “Company”) co ncerning future developments and their effect on the Company. While the Company’s management believes that these forward - looking statements are reasonable as and when made, there can be no assurance that future developments affecting the Company will be those that it anticipates, an d the Company’s actual results of operations, financial condition and liquidity, and the development of the industry in which the Company ope rat es, may differ materially from those made in or suggested by the forward - looking statements contained in this presentation. In addition, even if our results of operations, financial condition and liquidity, and the development of the industry in which we operate, are consistent with t he forward - looking statements contained in this presentation, those results or developments may not be indicative of our results or developments in subsequent periods. All comments concerning the Company’s expectations for future revenue and operating results are based on the Compan y’s forecasts for its existing operations and do not include the potential impact of any future acquisitions. The Company’s forward - looking statem ents involve significant risks and uncertainties (some of which are beyond the Company’s control) and assumptions that could cause actual fut ure results to differ materially from the Company’s historical experience and its present expectations or projections. Important factors that could cause actual results to differ materially from those in the forward - looking statements include, bu t are not limited to: the use of incorrect estimates for bidding a fixed - price contract; undertaking contractual commitments that exceed t he Company’s labor resources; failing to perform contractual obligations efficiently enough to maintain profitability; national or regional weak nes s in construction activity and economic conditions; the Company’s business being negatively affected by health crises or outbreaks of disease, suc h as epidemics or pandemics; financial difficulties affecting projects, vendors, customers, or subcontractors; the Company’s backlog failing to tr anslate into actual revenue or profits; failure of third party subcontractors and suppliers to complete work as anticipated; difficulty in obtain ing or increased costs associated with bonding and insurance; impairment to goodwill; errors in the Company’s percentage - of - completion method of accoun ting; the result of competition in the Company’s markets; the Company’s decentralized management structure; material failure to comply wit h varying state and local laws, regulations or requirements; debarment from bidding on or performing government contracts; shortages of labor an d specialty building materials or material increases to the cost thereof; retention of key management; seasonal fluctuations in the deman d f or mechanical and electrical systems; the imposition of past and future liability from environmental, safety, and health regulations including the inherent risk associated with self - insurance; adverse litigation results; an increase in our effective tax rate; a material information techno logy failure or a material cyber security breach; risks associated with acquisitions; our ability to manage growth and geographically - dispersed operations; our ability to obtain financing on acceptable terms; and other risks detailed in our reports filed with the Securities and Exchange Commission (the “S EC”). For additional information regarding known material factors that could cause the Company’s results to differ from its project ed results, please see its filings with the SEC, including its Annual Report on Form 10 - K, Quarterly Reports on Form 10 - Q, and Current Repor ts on Form 8 - K. Readers are cautioned not to place undue reliance on forward - looking statements, which speak only as of the date hereof. The Com pany undertakes no obligation to publicly update or revise any forward - looking statements after the date they are made, whether as a result of n ew information, future events, or otherwise. NON - GAAP MEASURES Certain measures in this presentation are not measures calculated in accordance with generally accepted accounting principles (“ GAAP”). They should not be considered a replacement for GAAP results. Non - GAAP financial measures appearing in these slides are identified in the footnote. See the Appendices for a reconciliation of these non - GAAP measures to the most comparable GAAP financial measures.

COMFORT SYSTEMS USA 2 • Leading national mechanical, electrical and plumbing (“MEP”) installation and service provider • $3+ billion yearly revenue • 11,800+ employees • History of profitable growth • Balanced construction and service portfolio
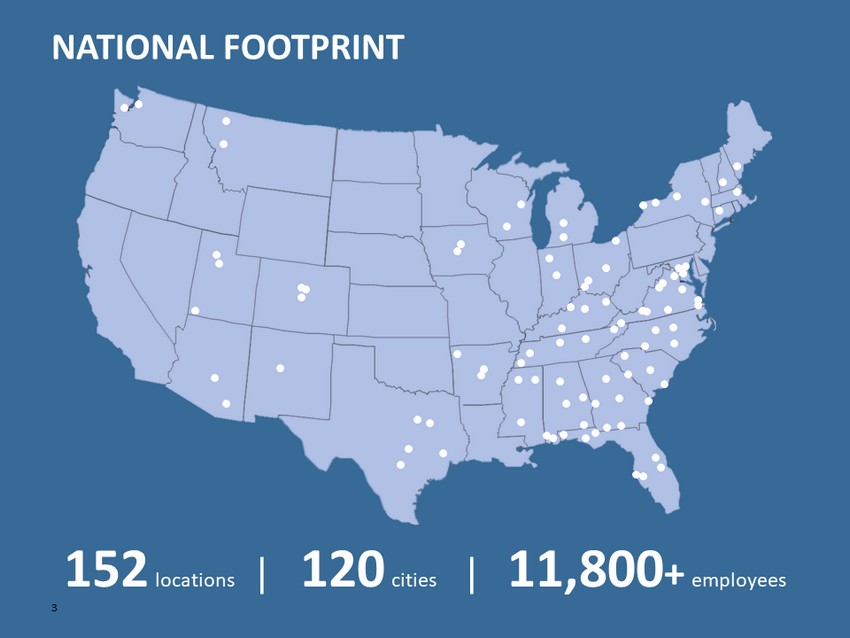
NATIONAL FOOTPRINT 3 152 locations | 120 cities | 11,800 + employees
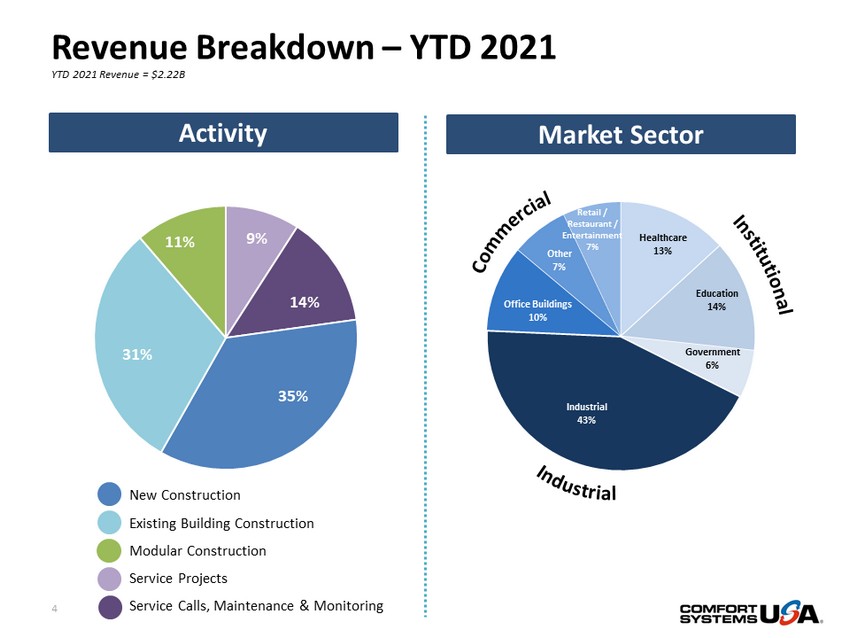
9% 14% 35% 31% 11% New Construction Existing Building Construction Modular Construction Service Projects Service Calls, Maintenance & Monitoring Revenue Breakdown – YTD 2021 4 Activity YTD 2021 Revenue = $2.22B Healthcare 13% Education 14% Government 6% Industrial 43% Office Buildings 10% Other 7% Retail / Restaurant / Entertainment 7% Market Sector
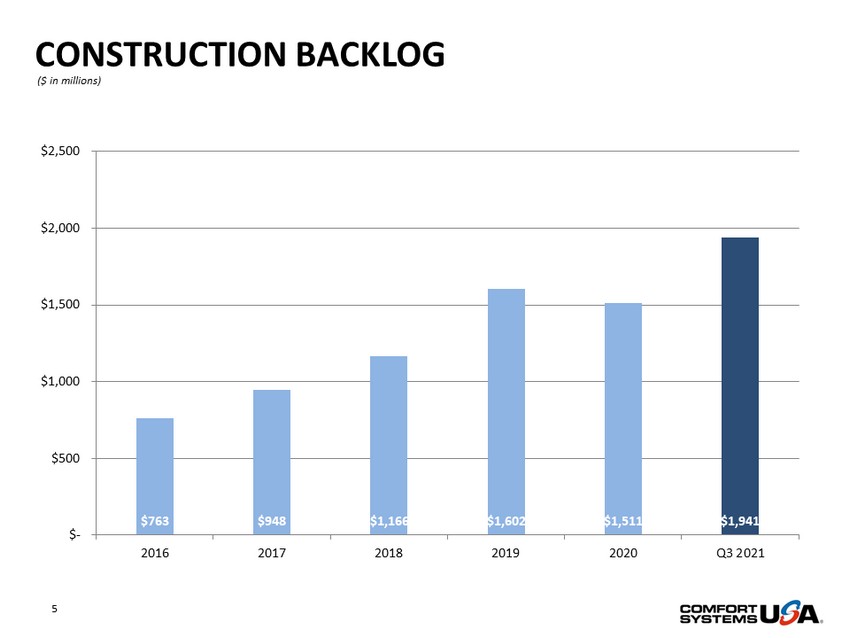
CONSTRUCTION BACKLOG 5 $763 $948 $1,166 $1,602 $1,511 $1,941 $- $500 $1,000 $1,500 $2,000 $2,500 2016 2017 2018 2019 2020 Q3 2021 ($ in millions)

SERVICE MAINTENANCE BASE 6 $111 $116 $123 $127 $130 $139 $0 $20 $40 $60 $80 $100 $120 $140 2016 2017 2018 2019 2020 Q3 2021 ($ in millions)

RECENT FINANCIAL PERFORMANCE 7 Three Months Ended Nine Months Ended ($ in millions, except per share information) 9/30/21 9/30/20 9/30/21 9/30/20 Revenue $833.9 $714.1 $2,217.6 $2,157.7 Net Income $46.3 $50.1 $105.8 $107.3 Diluted EPS $1.27 $1.36 $2.90 $2.92 Adjusted EBITDA (1) $82.3 $71.7 $188.1 $187.3 Operating Cash Flow $42.6 $52.6 $152.7 $216.4 ( 1) Adjusted EBITDA is a non - GAAP financial measure. See Appendix for a GAAP reconciliation to Adjusted EBITDA.
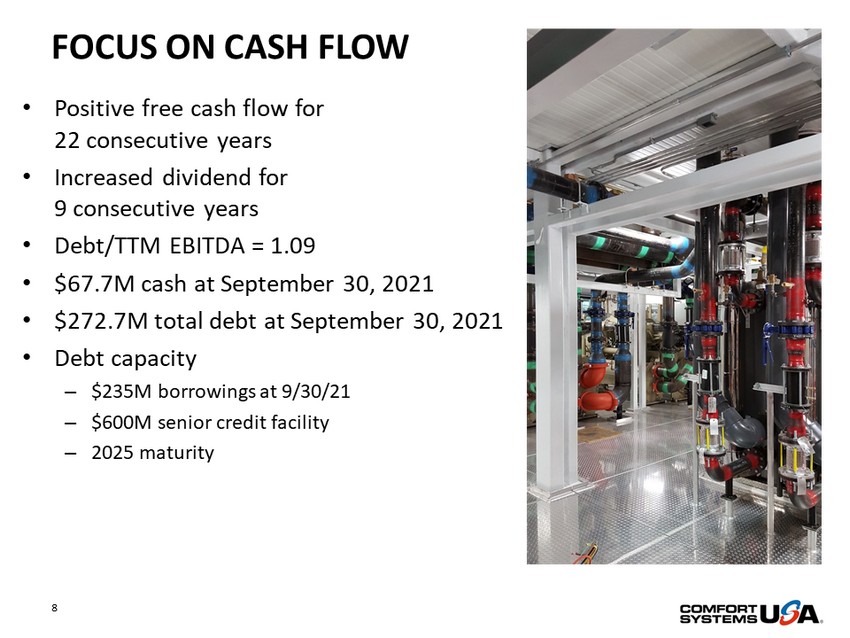
FOCUS ON CASH FLOW • Positive free cash flow for 22 consecutive years • Increased dividend for 9 consecutive years • Debt/TTM EBITDA = 1.09 • $67.7M cash at September 30, 2021 • $272.7M total debt at September 30, 2021 • Debt capacity – $235M borrowings at 9/30/21 – $600M senior credit facility – 2025 maturity 8
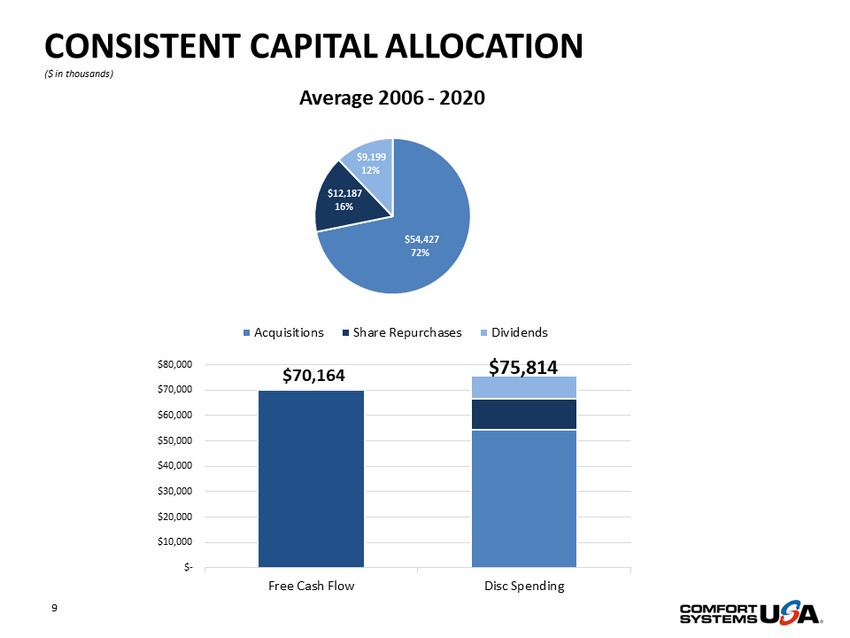
9 CONSISTENT CAPITAL ALLOCATION ($ in thousands) $54,427 72% $12,187 16% $9,199 12% Average 2006 - 2020 Acquisitions Share Repurchases Dividends $75,814 $70,164 $- $10,000 $20,000 $30,000 $40,000 $50,000 $60,000 $70,000 $80,000 Free Cash Flow Disc Spending
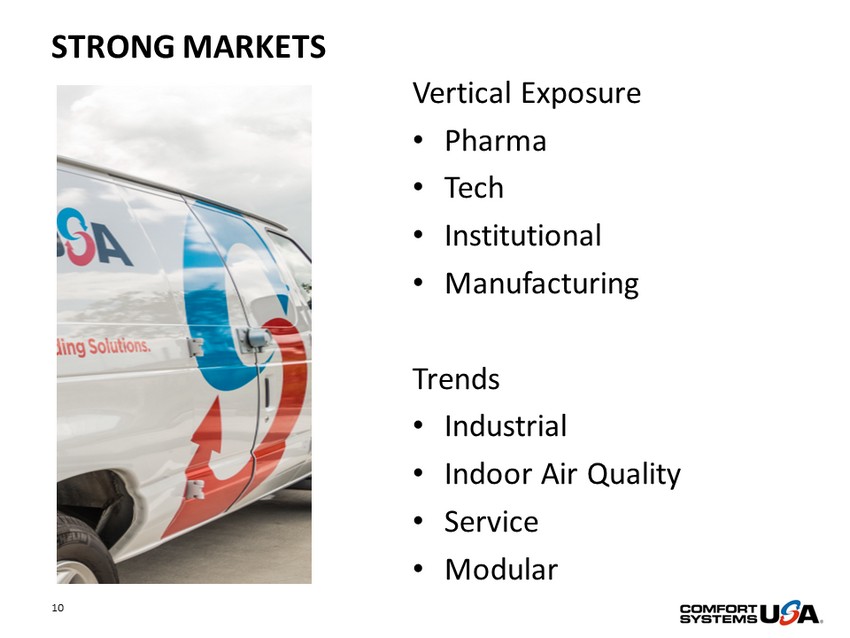
STRONG MARKETS 10 Vertical Exposure • Pharma • Tech • Institutional • Manufacturing Trends • Industrial • Indoor Air Quality • Service • Modular Insert a picture here
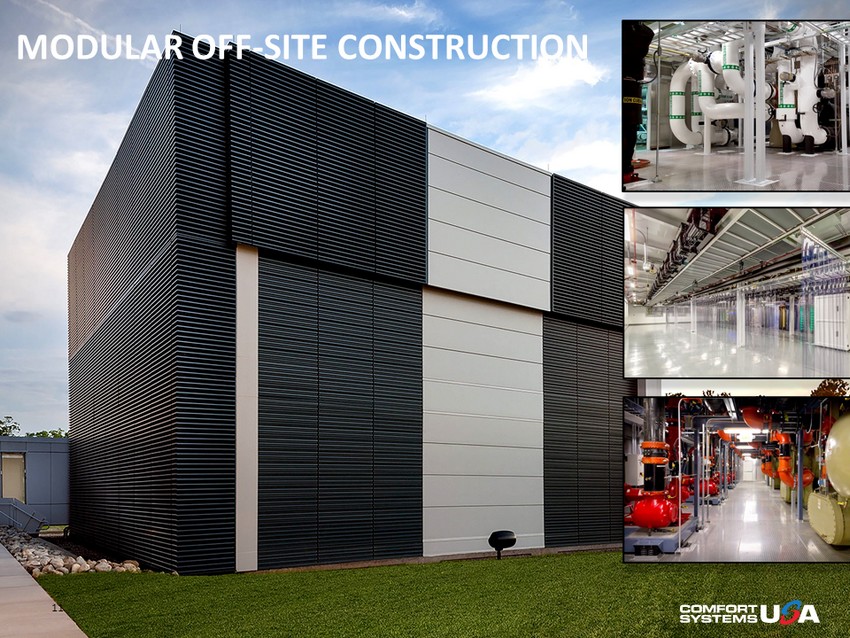
MODULAR OFF - SITE CONSTRUCTION 11

OUR STRENGTH 12 • Consistent free cash flow • Strong Balance Sheet • Acquisition record • Leading innovation • Profitable growth

THANK YOU 13 152 Locations 38 operating companies across America at 152 locations in 120 cities 11,800+ of the most qualified HVAC and electrical contracting personnel in America 11,800+ Employees $3+ Billion $3+ billion in yearly revenue CONTACT: Julie Shaeff Chief Accounting Officer 1 - 800 - 723 - 8431 ir@comfortsystemsusa.com www.comfortsystemsusa.com
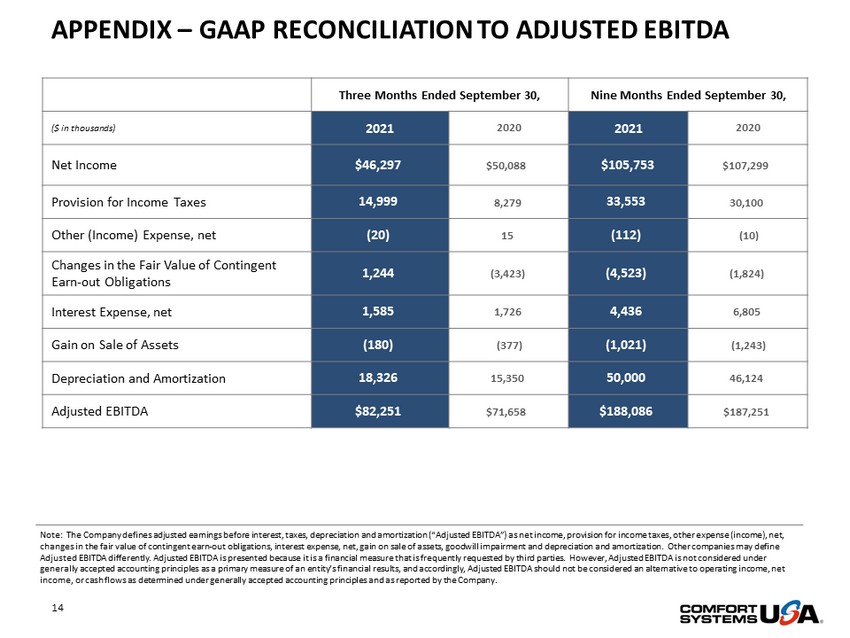
APPENDIX – GAAP RECONCILIATION TO ADJUSTED EBITDA 14 Three Months Ended September 30, Nine Months Ended September 30, ($ in thousands) 2021 2020 2021 2020 Net Income $46,297 $50,088 $105,753 $107,299 Provision for Income Taxes 14,999 8,279 33,553 30,100 Other (Income) Expense, net (20) 15 (112) (10) Changes in the Fair Value of Contingent Earn - out Obligations 1,244 (3,423) (4,523) (1,824) Interest Expense, net 1,585 1,726 4,436 6,805 Gain on Sale of Assets (180) (377) (1,021) (1,243) Depreciation and Amortization 18,326 15,350 50,000 46,124 Adjusted EBITDA $82,251 $71,658 $188,086 $187,251 Note: The Company defines adjusted earnings before interest, taxes, depreciation and amortization (“Adjusted EBITDA”) as net in come, provision for income taxes, other expense (income), net, changes in the fair value of contingent earn - out obligations, interest expense, net, gain on sale of assets, goodwill impairment and depreciation and amortization. Other companies may define Adjusted EBITDA differently. Adjusted EBITDA is presented because it is a financial measure that is frequently requested by t hir d parties. However, Adjusted EBITDA is not considered under generally accepted accounting principles as a primary measure of an entity’s financial results, and accordingly, Adjusted EBI TDA should not be considered an alternative to operating income, net income, or cash flows as determined under generally accepted accounting principles and as reported by the Company.