Exhibit 99.1

Quality People. Building Solutions. NYSE: FIX November 2, 2022

SAFE HARBOR Certain statements and information in this presentation may constitute forward - looking statements within the meaning of applicab le securities laws securities laws and regulations. The words “believe,” “expect,” “anticipate,” “plan,” “intend,” “foresee,” “should,” “would,” “c ould,” or other similar expressions are intended to identify forward - looking statements, which are generally not historic in nature. These forward - looki ng statements are based on are based on the current expectations and beliefs of Comfort Systems USA, Inc. and its subsidiaries (collectively, the “Compa ny” ) concerning future future developments and their effect on the Company. While the Company’s management believes that these forward - looking statemen ts are reasonable as reasonable as and when made, there can be no assurance that future developments affecting the Company will be those that it a nti cipates, and the the Company’s actual results of operations, financial condition and liquidity, and the development of the industry in which t he Company operates, may differ materially from those made in or suggested by the forward - looking statements contained in this presentation. In addition, even if our results of operations, financial condition and liquidity, and the development of the industry in which we operate, are consistent with the forward - look ing statements contained in this presentation, those results or developments may not be indicative of our results or developments in subsequent periods. Al l comments concerning the Company’s expectations for future revenue and operating results are based on the Company’s forecasts for its existing operati ons and do not include the potential impact of any future acquisitions. The Company’s forward - looking statements involve significant risks and uncertaintie s (some of which are beyond the Company’s control) and assumptions that could cause actual future results to differ materially from the Company’s histori cal experience and its present expectations or projections. Important factors that could cause actual results to differ materially from those in the forward - looking statements include, bu t are not limited to: the use of incorrect estimates for bidding a fixed - price contract; undertaking contractual commitments that exceed the Company’s lab or resources; failing to perform contractual obligations efficiently enough to maintain profitability; national or regional weakness in construction a cti vity and economic conditions; rising inflation and fluctuations in interest rates; shortages of labor and specialty building materials or material increase s t o the cost thereof; the Company’s business being negatively affected by health crises or outbreaks of disease, such as epidemics or pandemics (and related impa cts , such as vaccine mandates or supply chain disruptions); financial difficulties affecting projects, vendors, customers, or subcontractors; the Company’s ba cklog failing to translate into actual revenue or profits; failure of third party subcontractors and suppliers to complete work as anticipated; difficulty i n o btaining or increased costs associated with bonding and insurance; impairment to goodwill; errors in the Company’s percentage - of - completion method of accoun ting; the result of competition in the Company’s markets; the Company’s decentralized management structure; material failure to comply with varyi ng state and local laws, regulations or requirements; debarment from bidding on or performing government contracts; retention of key management; seaso nal fluctuations in the demand for mechanical and electrical systems; the imposition of past and future liability from environmental, safety, and hea lth regulations including the inherent risk associated with self - insurance; adverse litigation results; an increase in our effective tax rate; a material info rmation technology failure or a material cyber security breach; risks associated with acquisitions, such as challenges to our ability to integrate those comp ani es into our internal control environment; our ability to manage growth and geographically - dispersed operations; our ability to obtain financing on acceptable terms; extreme weather conditions (such as storms, droughts, extreme heat or cold, wildfires and floods), including as a result of climate change, a nd any resulting regulations or restrictions related thereto; and other risks detailed in our reports filed with the Securities and Exchange Commission (the “S EC”). For additional information regarding known material factors that could cause the Company’s results to differ from its project ed results, please see its filings with the SEC, including its Annual Report on Form 10 - K, Quarterly Reports on Form 10 - Q, and Current Reports on Form 8 - K. Readers are cautioned not to place undue reliance on forward - looking statements, which speak only as of the date hereof. The Company undertakes no obligat ion to publicly update or revise any forward - looking statements after the date they are made, whether as a result of new information, future events, or ot herwise. NON - GAAP MEASURES Certain measures in this presentation are not measures calculated in accordance with generally accepted accounting principles (“ GAAP”). They should not be considered a replacement for GAAP results. Non - GAAP financial measures appearing in these slides are identified in the footnote. See the Appendices for a reconciliation of these non - GAAP measures to the most comparable GAAP financial measures.

COMFORT SYSTEMS USA 2 • Leading national mechanical, electrical and plumbing (“MEP”) installation and service provider • $4.0+ billion yearly revenue • 14,000+ employees • History of profitable growth • Balanced construction and service portfolio

NATIONAL FOOTPRINT 3 173 locations | 129 cities | 14,000+ employees
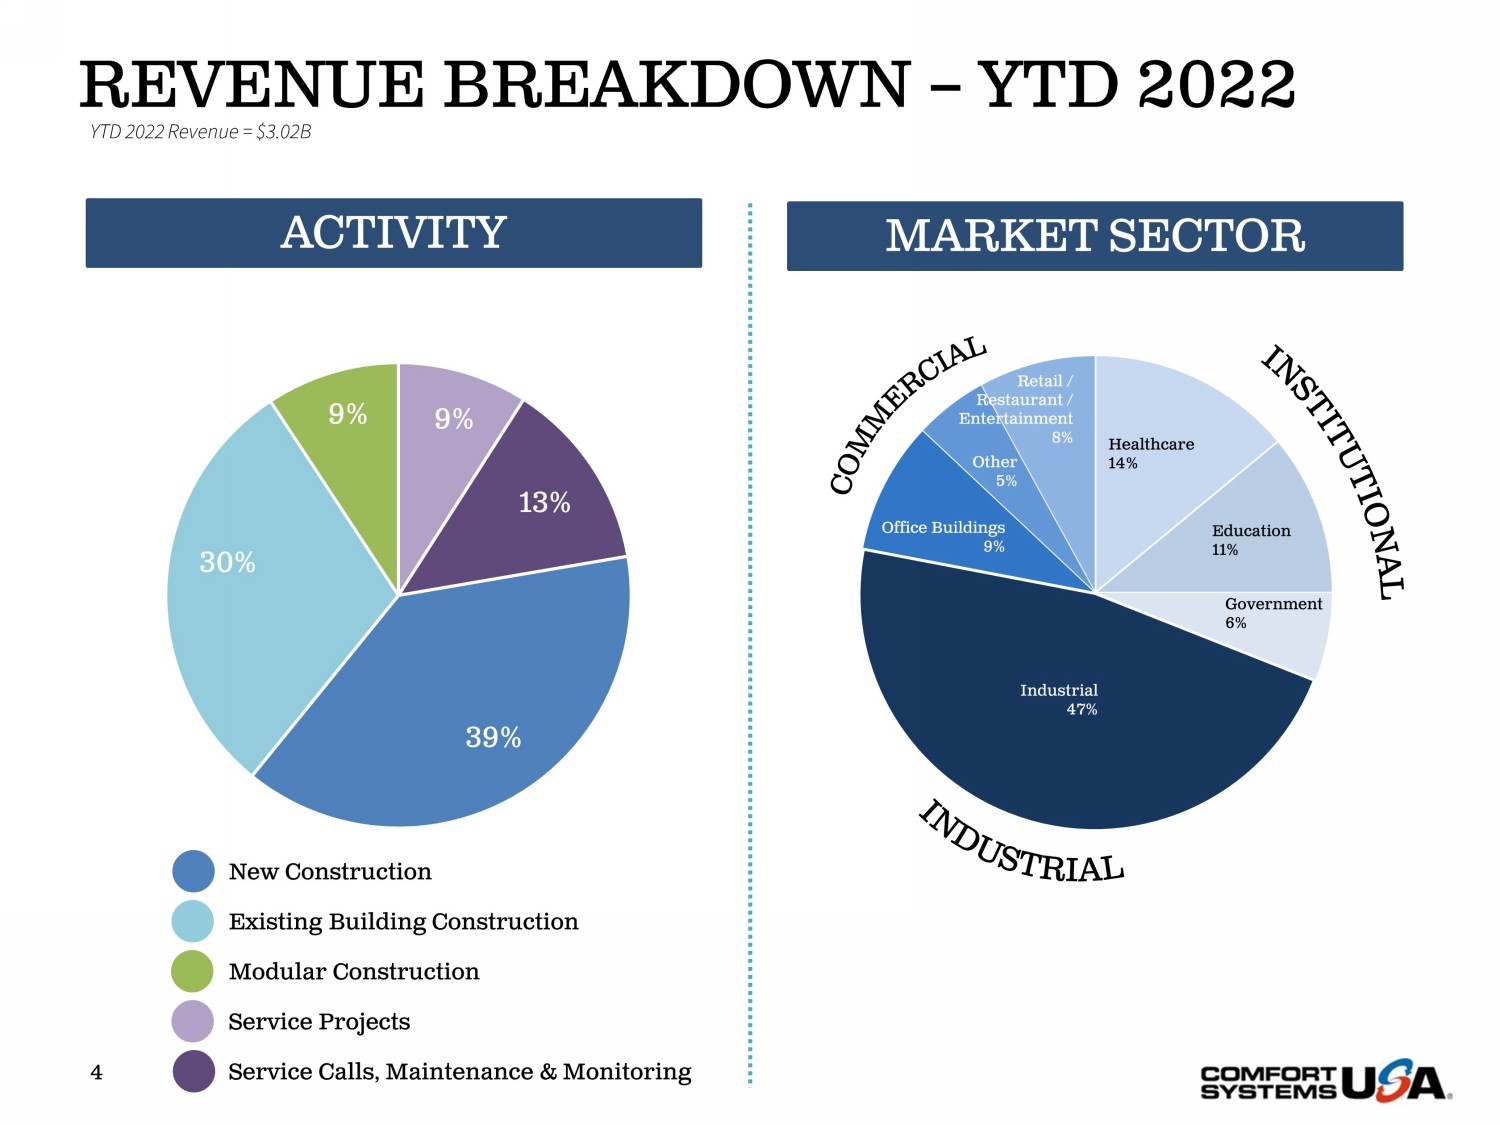
9% 13% 39% 30% 9% New Construction Existing Building Construction Modular Construction Service Projects Service Calls, Maintenance & Monitoring REVENUE BREAKDOWN – YTD 2022 4 ACTIVITY YTD 2022 Revenue = $3.02B Healthcare 14% Education 11% Government 6% Industrial 47% Office Buildings 9% Other 5% Retail / Restaurant / Entertainment 8% MARKET SECTOR

CONSTRUCTION BACKLOG 5 $763 $948 $1,166 $1,602 $1,511 $2,312 $3,251 $- $500 $1,000 $1,500 $2,000 $2,500 $3,000 $3,500 2016 2017 2018 2019 2020 2021 Q3 2022 ($ in millions)

SERVICE MAINTENANCE BASE 6 $111 $116 $123 $127 $130 $147 $160 $0 $20 $40 $60 $80 $100 $120 $140 $160 $180 2016 2017 2018 2019 2020 2021 Q3 2022 ($ in millions)

RECENT FINANCIAL PERFORMANCE 7 THREE MONTHS ENDED NINE MONTHS ENDED ($ in millions, except per share information) 9/30/22 9/30/21 9/30/22 9/30/21 Revenue $1,120.0 $833.9 $3,023.2 $2,217.6 Net Income $61.5 $46.3 $190.5 $105.8 Diluted EPS $1.71 $1.27 $5.28 $2.90 Adjusted EPS (1) $1.67 $1.27 $3.75 $2.90 Adjusted EBITDA (2) $101.0 $82.3 $238.6 $188.1 Operating Cash Flow $61.2 $42.6 $169.5 $152.7 (1) Adjusted EPS is a non - GAAP financial measure. Adjusted EPS excludes tax gains. See Appendix II for a GAAP reconciliation to Ad justed EPS. (2) Adjusted EBITDA is a non - GAAP financial measure. See Appendix I for a GAAP reconciliation to Adjusted EBITDA.

FOCUS ON CASH FLOW • Positive free cash flow for 23 consecutive years • Increased dividend for 10 consecutive years • Debt/TTM EBITDA = 1.24 • $71.1M cash at September 30, 2022 • $380.7M total debt at September 30, 2022 • Debt capacity – $335M borrowings at 9/30/22 – $850M senior credit facility – 2027 maturity 8
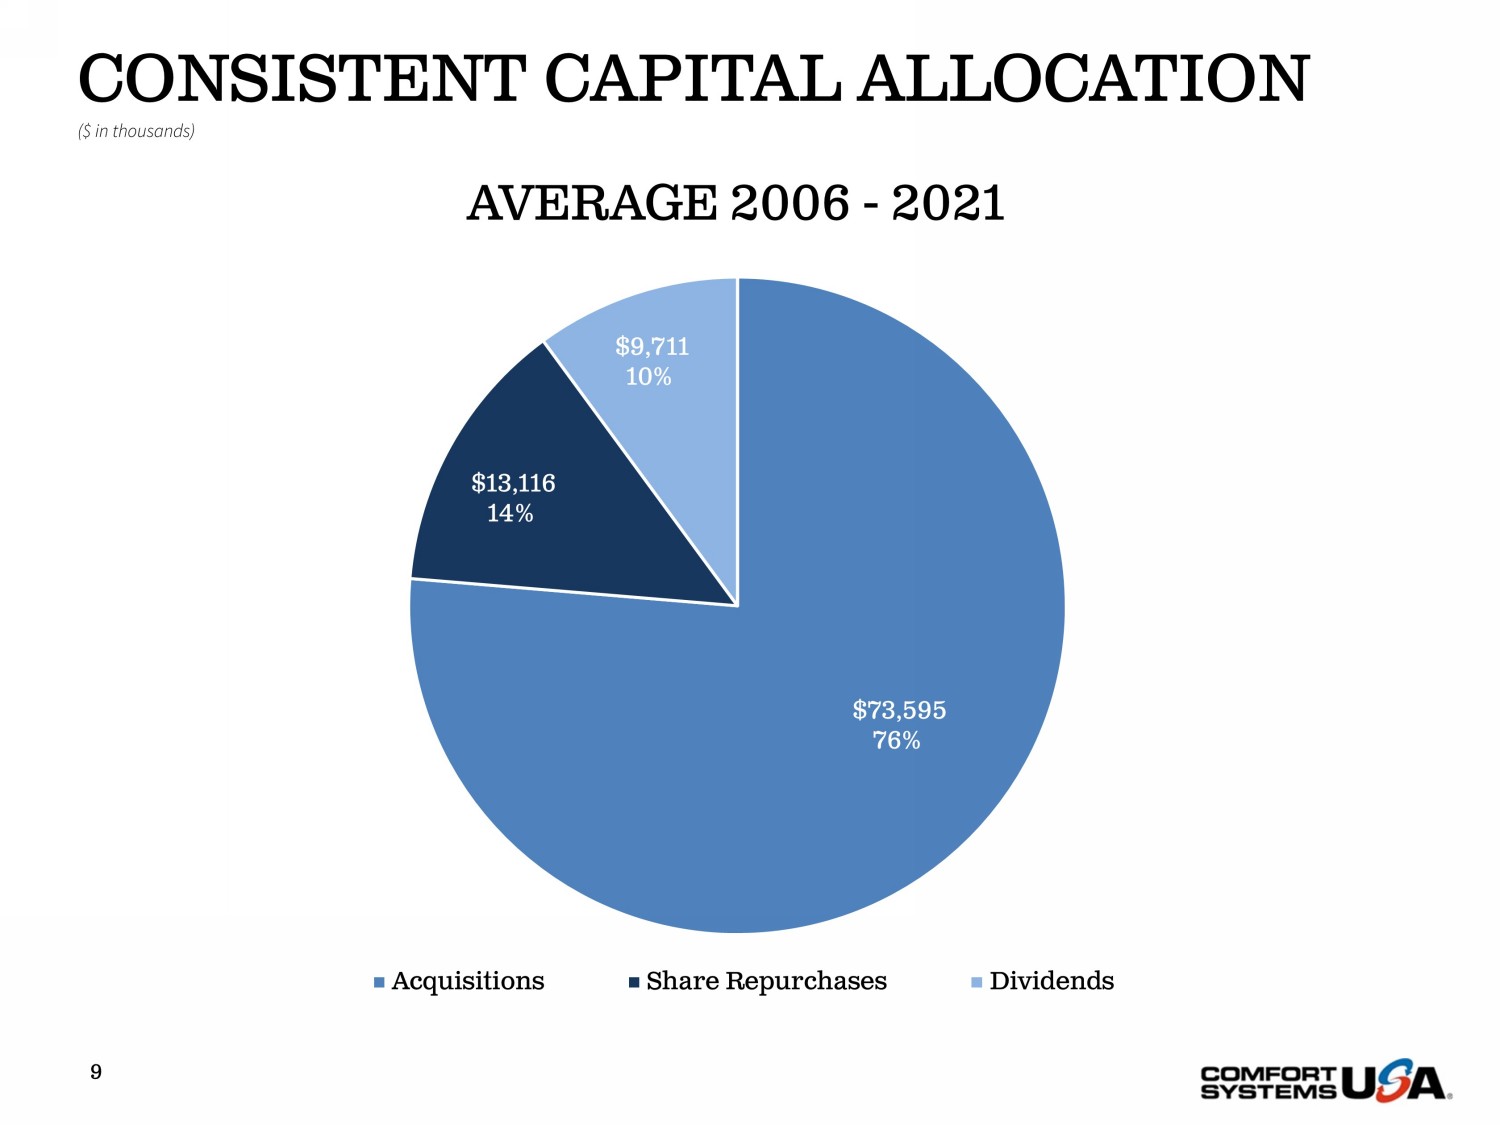
9 CONSISTENT CAPITAL ALLOCATION ($ in thousands) $73,595 76% $13,116 14% $9,711 10% AVERAGE 2006 - 2021 Acquisitions Share Repurchases Dividends
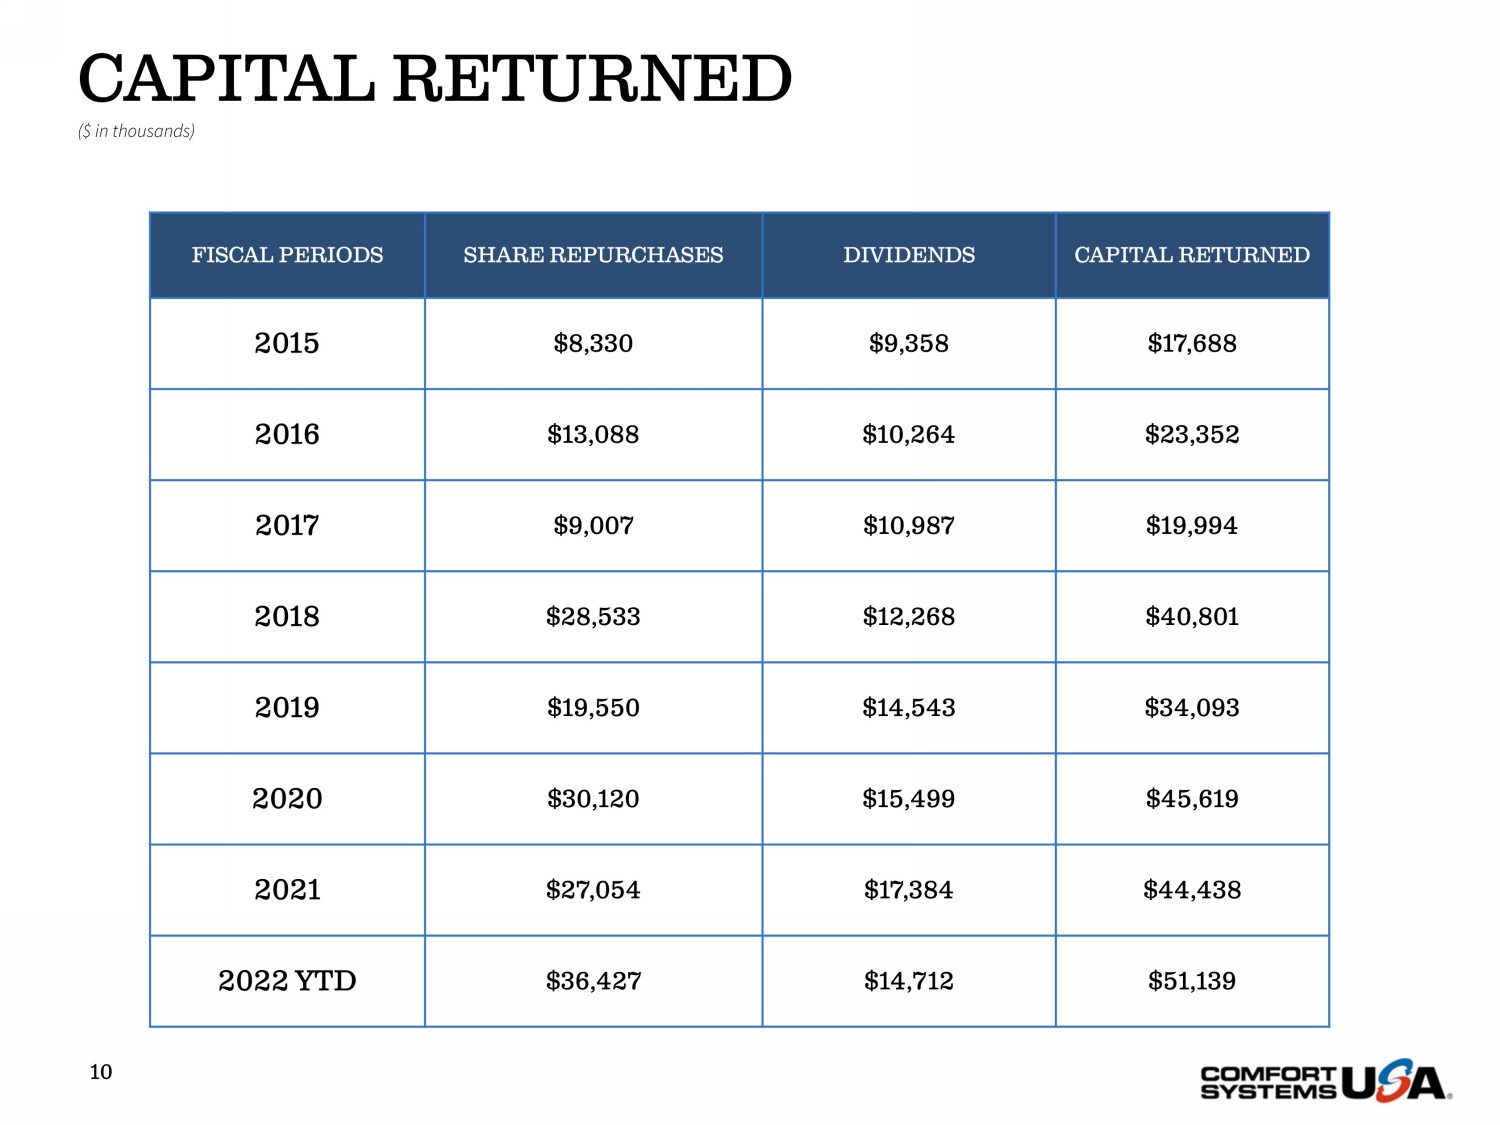
10 CAPITAL RETURNED ($ in thousands) FISCAL PERIODS SHARE REPURCHASES DIVIDENDS CAPITAL RETURNED 2015 $8,330 $9,358 $17,688 2016 $13,088 $10,264 $23,352 2017 $9,007 $10,987 $19,994 2018 $28,533 $12,268 $40,801 2019 $19,550 $14,543 $34,093 2020 $30,120 $15,499 $45,619 2021 $27,054 $17,384 $44,438 2022 YTD $36,427 $14,712 $51,139
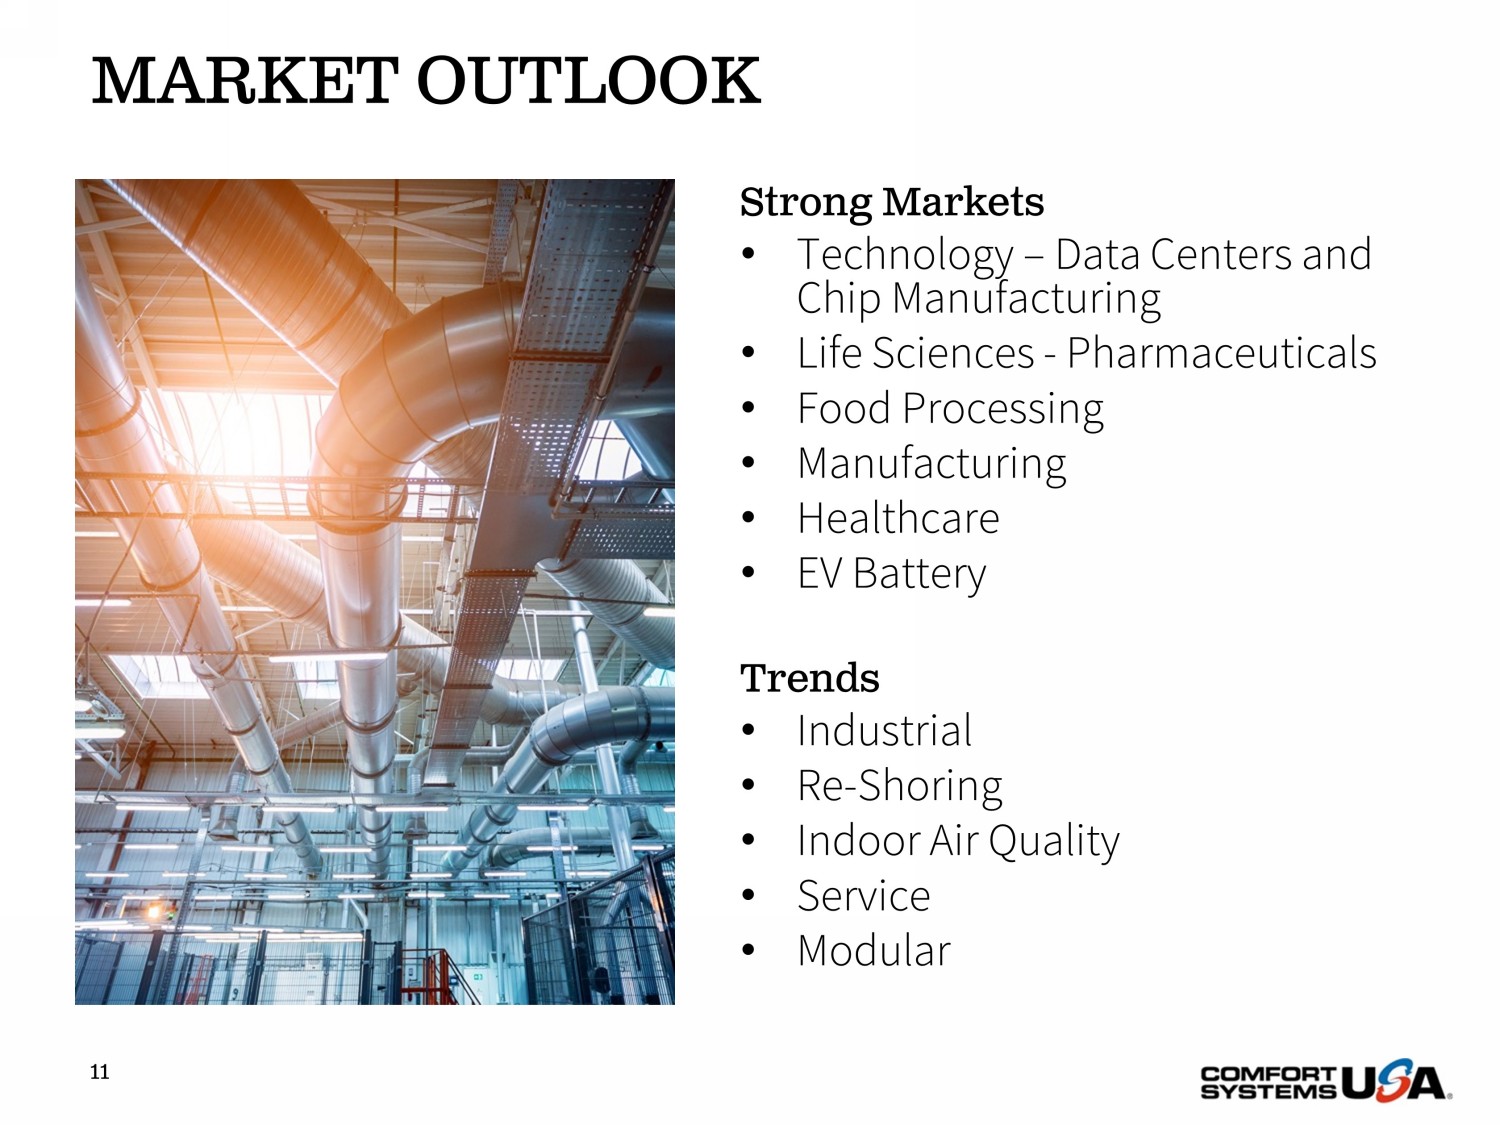
MARKET OUTLOOK 11 Strong Markets • Technology – Data Centers and Chip Manufacturing • Life Sciences - Pharmaceuticals • Food Processing • Manufacturing • Healthcare • EV Battery Trends • Industrial • Re - Shoring • Indoor Air Quality • Service • Modular

MODULAR OFF - SITE CONSTRUCTION 12

Foster a safe, collaborative, and inclusive environment for our employees • 100% of all operating companies have diversity, equity, and inclusion action plans • 100% of operational sites have conducted an employee health and safety risk assessment • Future goal: Implement a process to track, manage, and report on the number of diverse suppliers with whom we partner Our environmental, social and corporate governance (ESG) goals are embedded in how we operate as a business – they are part of our very foundation and core values of being safe, honest, respectful, collaborative, and innovative – and we have diligently sought to develop transparent disclosures to support our ESG commitments . As a company, we recognize that while our work lends itself to sustainable best practices, there is more we can do to create a positive impact . We are committed to a continual improvement approach to sustainability . PEOPLE PARTNERS PLANET Be reliable, honest, and innovative partners to our customers and suppliers • 100% of all operational sites have completed an internal audit/risk assessment concerning business ethics issues • Bronze EcoVadis Sustainability Rating achieved in 2021 • Sustainable Procurement Policy and Supplier Diversity Program launched in 2021 Operate with the intention to positively impact the environment through our work and the services we provide to our customers • For the first time in the history of Comfort Systems USA, we completed a Greenhouse Gas Inventory covering all relevant Scope 1 and 2 emissions across our facilities. • Improved energy efficiency for 5,838 existing buildings in 2021 • Developed and shared sustainable transportation guidelines with all operating companies to utilize best practices in fleet management, business travel, route optimization, and employee commuting Energy Efficiency Carbon Emissions Regulatory Compliance Financial Health Privacy and Data Security Ethics, Anti - Bribery, and Corruption Worker Health and Safety Diversity, Equity, and Inclusion Material Topics Material Topics Material Topics SUSTAINABILITY OVERVIEW 13
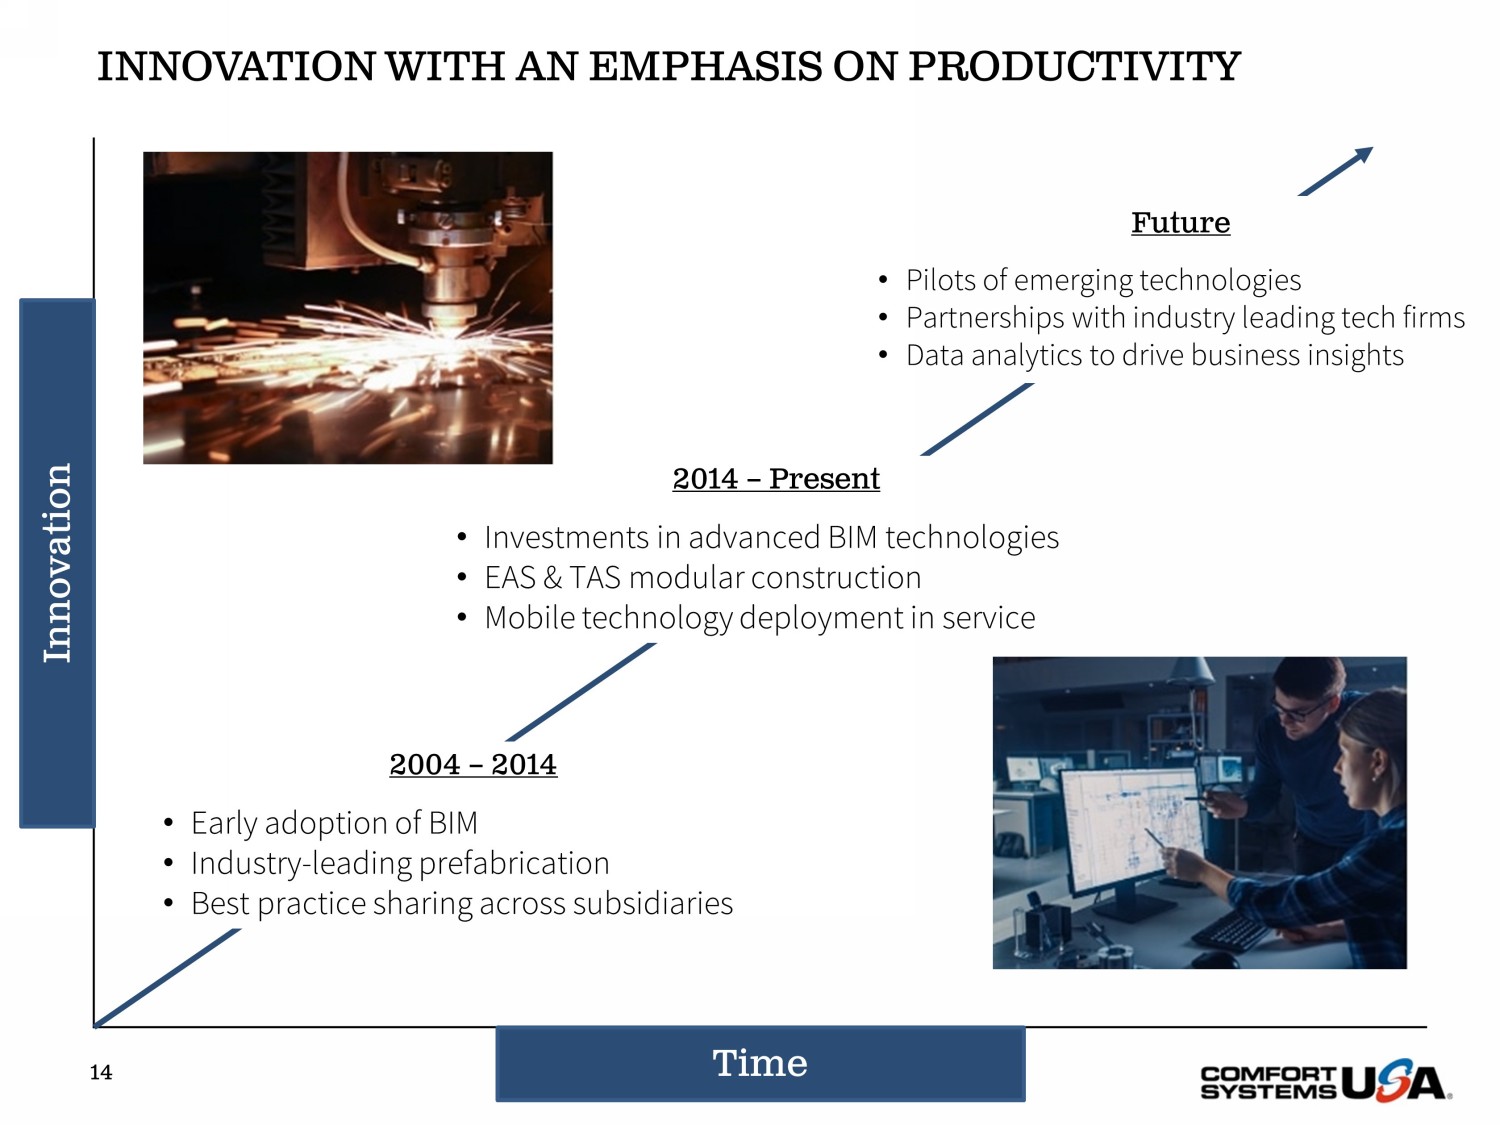
Time Innovation INNOVATION WITH AN EMPHASIS ON PRODUCTIVITY 2004 – 2014 • Early adoption of BIM • Industry - leading prefabrication • Best practice sharing across subsidiaries 2014 – Present • Investments in advanced BIM technologies • EAS & TAS modular construction • Mobile technology deployment in service Future • Pilots of emerging technologies • Partnerships with industry leading tech firms • Data analytics to drive business insights 14

15 Be safe Be honest Be respectful Be innovative Be collaborative OUR VALUES
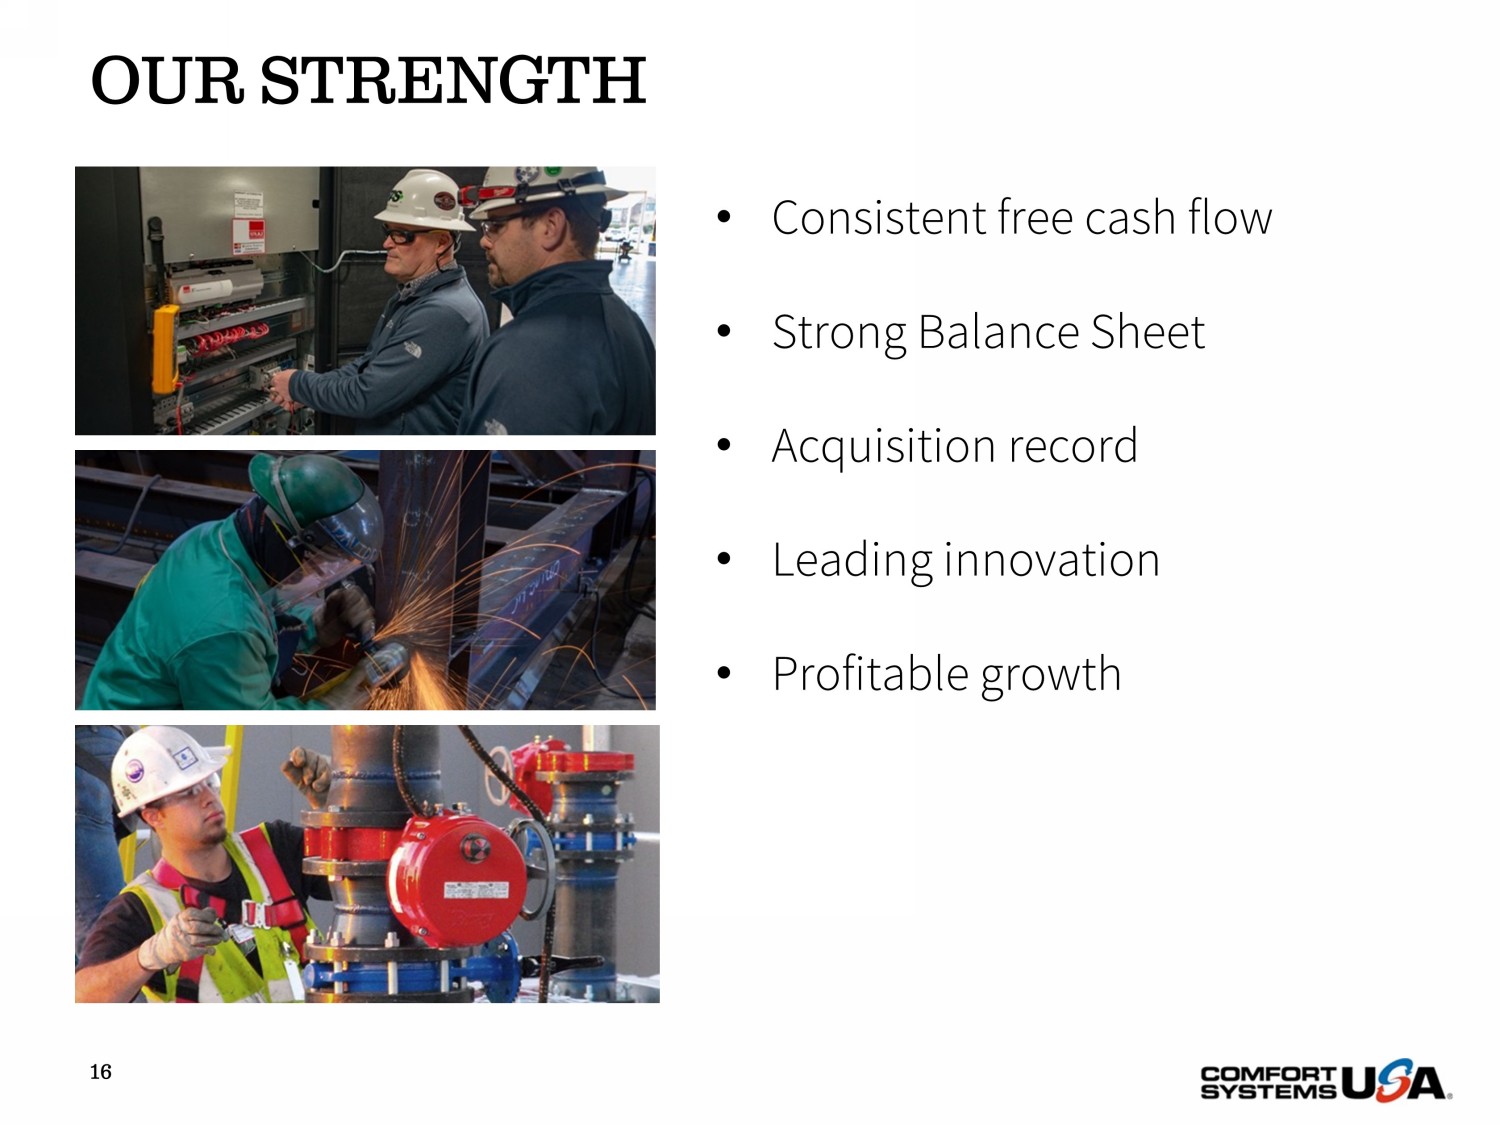
OUR STRENGTH 16 • Consistent free cash flow • Strong Balance Sheet • Acquisition record • Leading innovation • Profitable growth

THANK YOU 17 173 Locations 42 operating companies across America at 173 locations in 129 cities 14,000+ of the most qualified HVAC and electrical contracting personnel in America 14,000+ Employees $4.0+ Billion $4.0+ billion in yearly revenue CONTACT: Julie Shaeff Chief Accounting Officer 1 - 800 - 723 - 8431 ir@comfortsystemsusa.com www.comfortsystemsusa.com
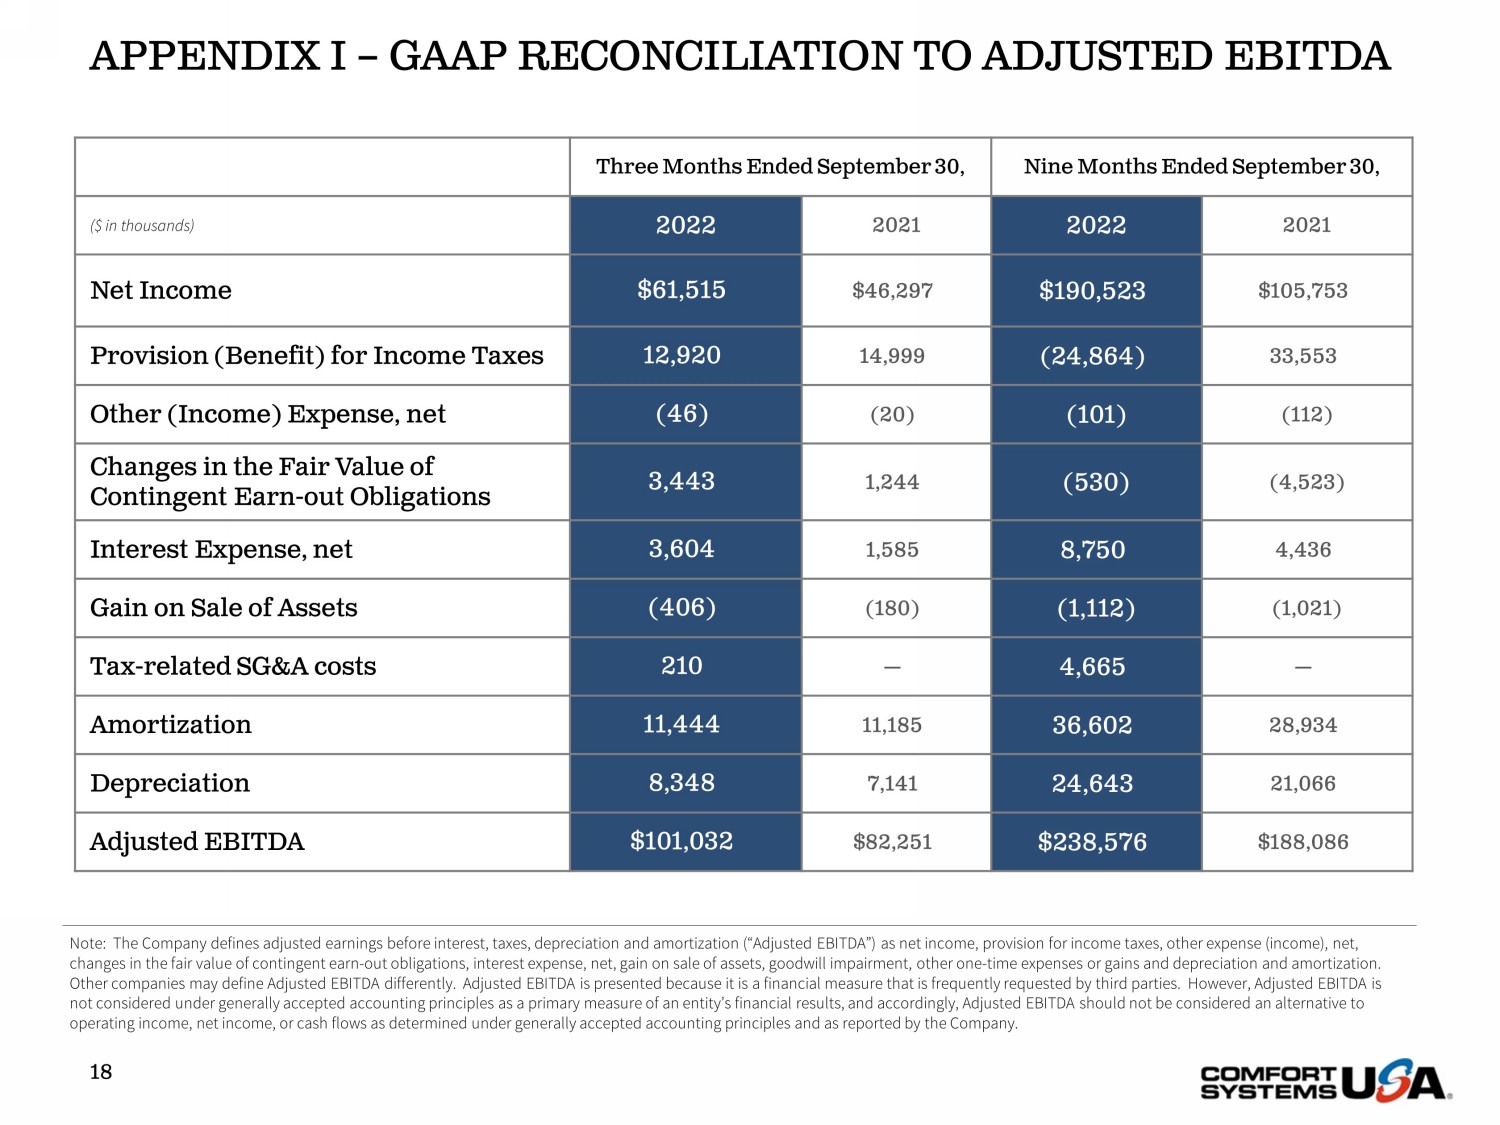
APPENDIX I – GAAP RECONCILIATION TO ADJUSTED EBITDA 18 Three Months Ended September 30, Nine Months Ended September 30, ($ in thousands) 2022 2021 2022 2021 Net Income $61,515 $46,297 $190,523 $105,753 Provision (Benefit) for Income Taxes 12,920 14,999 (24,864) 33,553 Other (Income) Expense, net (46) (20) (101) (112) Changes in the Fair Value of Contingent Earn - out Obligations 3,443 1,244 (530) (4,523) Interest Expense, net 3,604 1,585 8,750 4,436 Gain on Sale of Assets (406) (180) (1,112) (1,021) Tax - related SG&A costs 210 — 4,665 — Amortization 11,444 11,185 36,602 28,934 Depreciation 8,348 7,141 24,643 21,066 Adjusted EBITDA $101,032 $82,251 $238,576 $188,086 Note: The Company defines adjusted earnings before interest, taxes, depreciation and amortization (“Adjusted EBITDA”) as net in come, provision for income taxes, other expense (income), net, changes in the fair value of contingent earn - out obligations, interest expense, net, gain on sale of assets, goodwill impairment , other one - time expenses or gains and depreciation and amortization. Other companies may define Adjusted EBITDA differently. Adjusted EBITDA is presented because it is a financial measure that is frequently requested by third parties. However, Adjusted EBITDA is not considered under generally accepted accounting principles as a primary measure of an entity’s financial results, and acco rdi ngly, Adjusted EBITDA should not be considered an alternative to operating income, net income, or cash flows as determined under generally accepted accounting principles and as reported by t he Company.

APPENDIX II – GAAP RECONCILIATION TO ADJUSTED EPS 19 Three Months Ended September 30, Nine Months Ended September 30, 2022 2021 2022 2021 Diluted Income per Share $1.71 $1.27 $5.28 $2.90 Tax Gains (0.05) — (1.64) — Tax - Related SG&A Costs, Net of Tax 0.01 — 0.11 — Diluted Income per Share Excluding Tax Gains $1.67 $1.27 $3.75 $2.90 Note: Diluted income per share excluding tax gains is presented because the Company believes it reflects the results of the cor e ongoing operations of the Company, and we believe it is responsive to frequent questions we receive from third parties. This measure, however, is not considered a primary measure of an entity’s fin ancial results under generally accepted accounting principles, and accordingly, should not be considered an alternative to operating results as determined under generally accepted accounting p rin ciples and as reported by the Company.