
SunTrust Robinson Humphrey Sunbelt Community Bank Conference September 28, 2004
1
Forward-Looking Statement
Statements contained in this presentation which are not historical facts are forward-looking statements as defined in Securities Laws. Such forward-looking statements are subject to risks and uncertainties which could cause actual results to differ materially from estimated results. Such risks and uncertainties are detailed in the Company’s filings with the Securities and Exchange Commission.
2
Company Overview
3
Company Overview
A $1.4 billion bank holding company headquartered in Culpeper, Virginia.
Three bank subsidiaries and one financial service subsidiary.
37 banking offices, two loan production offices and five trust and investment locations. $480 million in trust and managed assets under administration at Virginia Commonwealth Trust subsidiary.
Origin of the company dates back to the inception of Second Bank & Trust in 1900.
4
Company Overview
Landmark transaction was the merger-of-equals of Virginia Commonwealth Financial and Virginia Financial Corp. to form Virginia Financial Group in 2002.
Most recent M&A transaction was purchase of eight branches from First Virginia Bank in connection with BBT merger.
Traded on the Nasdaq National Market (symbol: VFGI)
5
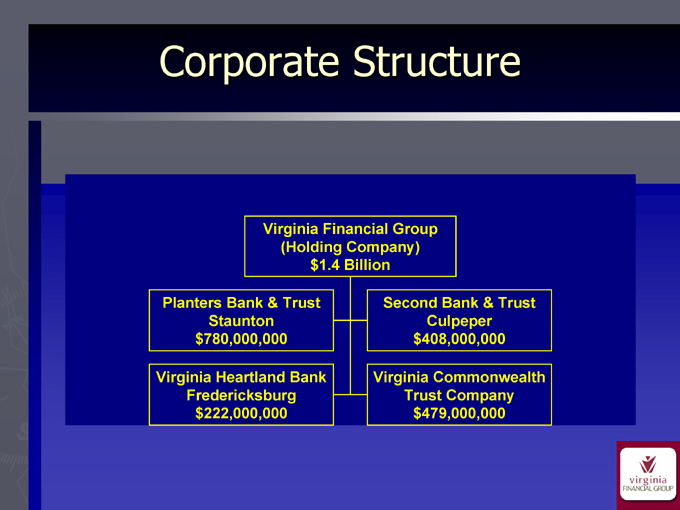
Corporate Structure
Virginia Financial Group (Holding Company) $1.4 Billion
Planters Bank & Trust Staunton $780,000,000
Virginia Heartland Bank Fredericksburg $222,000,000
Second Bank & Trust Culpeper $408,000,000
Virginia Commonwealth Trust Company $479,000,000
6
Multi Charter Model – What Changes?
Human Resources Marketing Compliance Internal Audit
Finance / Treasury Management Credit Review Operations / Information Technology
7
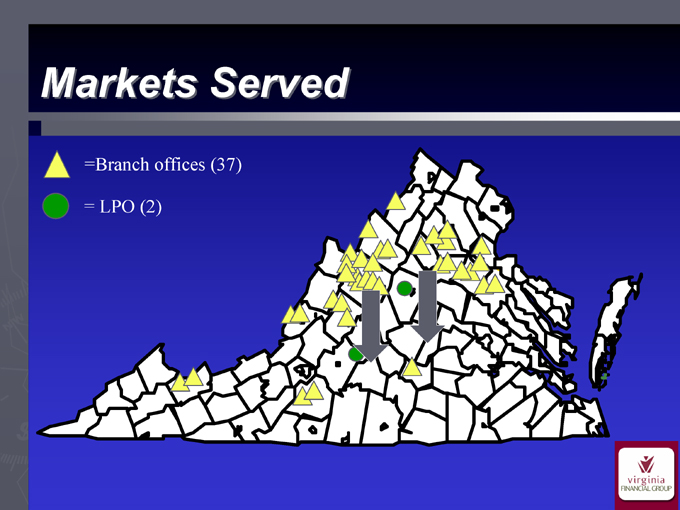
Markets Served
= Branch offices (37)
= LPO (2)
8
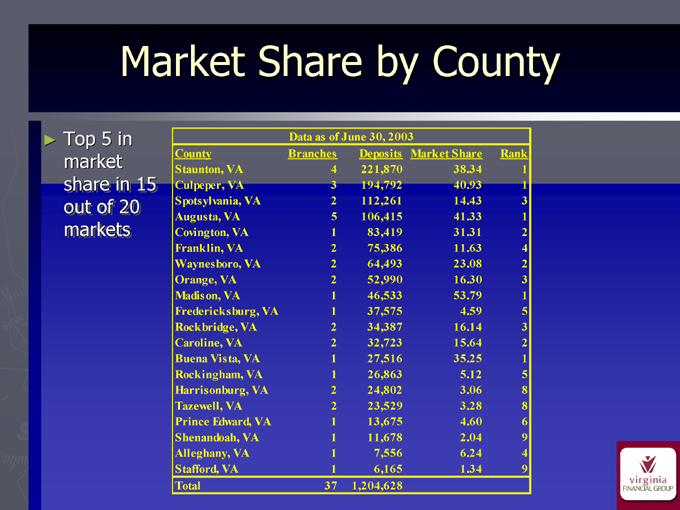
Market Share by County
Top 5 in market share in 15 out of 20 markets
Data as of June 30, 2003
County Branches Deposits Market Share Rank Staunton, VA 4 221,870 38.34 1 Culpeper, VA 3 194,792 40.93 1 Spotsylvania, VA 2 112,261 14.43 3 Augusta, VA 5 106,415 41.33 1 Covington, VA 1 83,419 31.31 2 Franklin, VA 2 75,386 11.63 4 Waynesboro, VA 2 64,493 23.08 2 Orange, VA 2 52,990 16.30 3 Madison, VA 1 46,533 53.79 1 Fredericksburg, VA 1 37,575 4.59 5 Rockbridge, VA 2 34,387 16.14 3 Caroline, VA 2 32,723 15.64 2 Buena Vista, VA 1 27,516 35.25 1 Rockingham, VA 1 26,863 5.12 5 Harrisonburg, VA 2 24,802 3.06 8 Tazewell, VA 2 23,529 3.28 8 Prince Edward, VA 1 13,675 4.60 6 Shenandoah, VA 1 11,678 2.04 9 Alleghany, VA 1 7,556 6.24 4 Stafford, VA 1 6,165 1.34 9 Total 37 1,204,628
9
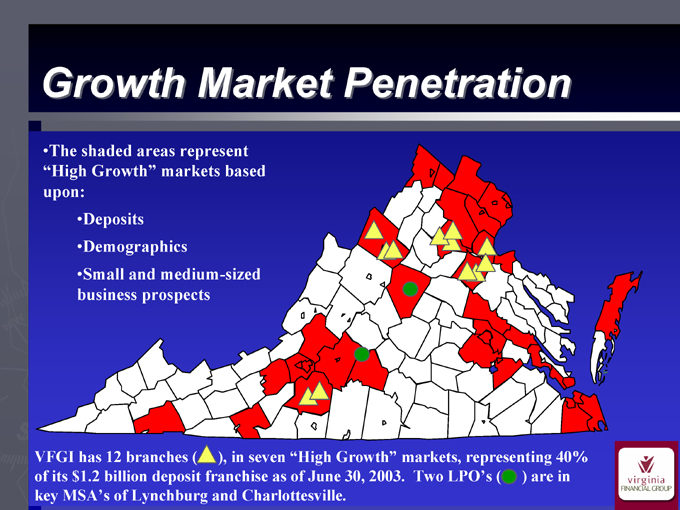
Growth Market Penetration
The shaded areas represent “High Growth” markets based upon:
Deposits
Demographics
Small and medium-sized business prospects
VFGI has 12 branches ( ), in seven “High Growth” markets, representing 40% of its $1.2 billion deposit franchise as of June 30, 2003. Two LPO’s ( ) are in key MSA’s of Lynchburg and Charlottesville.
10

Strategic Initiatives
11
Strategic Initiatives
Become the “Community Bank of Choice” in Virginia Become second to none in quality of service Continue to attract and retain the best talent
12
Strategic Initiatives – Specific
Actions/Plans
Strengthening of management group:
Hiring of Chief Operating Officer
Hiring of Chief Credit Officer
Hiring of Director of Internal Audit
Hiring of New President for Planters affiliate
Average age of top four VFG Executives (excluding CEO
– 42 years
SOX 404 compliance
Reengineering of Back Office Operations
Strengthening of in-house training
13
Strategic Initiatives – Specific
Goals/Action Plans
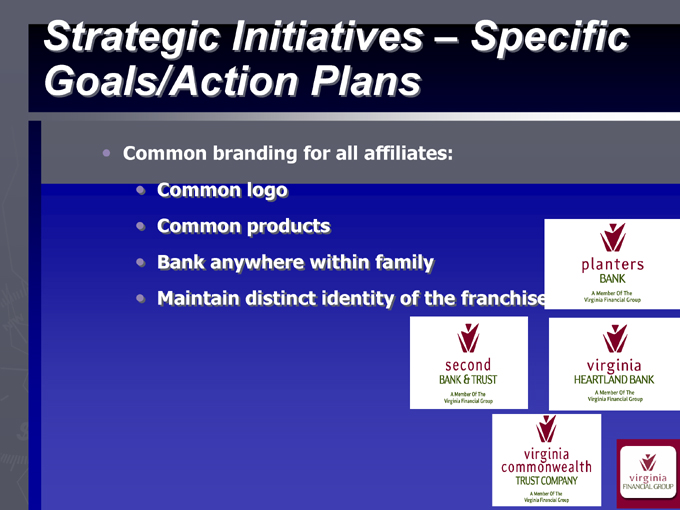
Common branding for all affiliates:
Common logo
Common products
Bank anywhere within family
Maintain distinct identity of the franchise
14
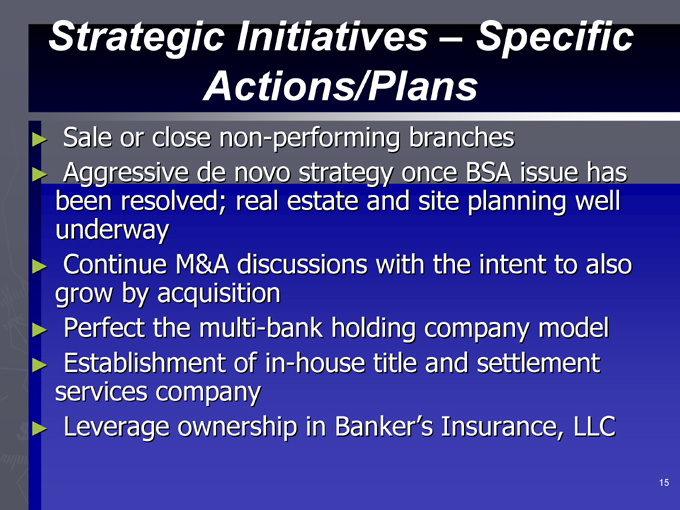
Strategic Initiatives – Specific
Actions/Plans
Sale or close non-performing branches
Aggressive de novo strategy once BSA issue has
been resolved; real estate and site planning well
underway
Continue M&A discussions with the intent to also
grow by acquisition
Perfect the multi-bank holding company model
Establishment of in-house title and settlement
services company
Leverage ownership in Banker’s Insurance, LLC
15
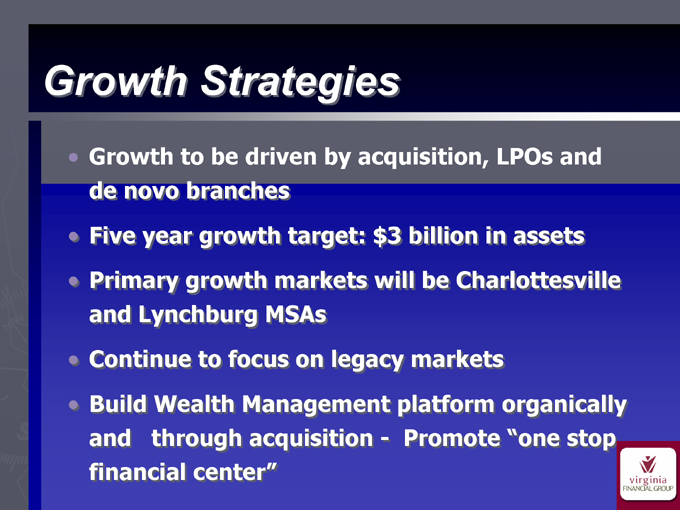
Growth Strategies
Growth to be driven by acquisition, LPOs and de novo branches Five year growth target: $3 billion in assets Primary growth markets will be Charlottesville and Lynchburg MSAs Continue to focus on legacy markets Build Wealth Management platform organically and through acquisition - Promote “one stop financial center”
16
Financial Overview
17
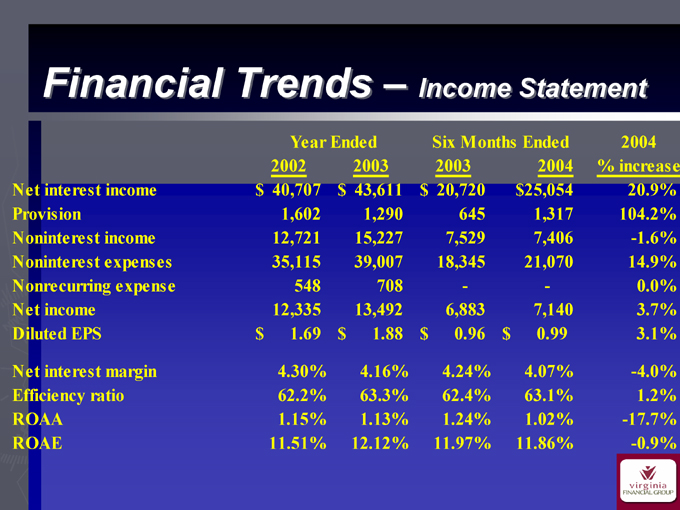
Financial Trends – Income Statement
Year Ended Six Months Ended 2004 2002 2003 2003 2004 % increase Net interest income $40,707 $43,611 $20,720 $25,054 20.9% Provision 1,602 1,290 645 1,317 104.2% Noninterest income 12,721 15,227 7,529 7,406 -1.6% Noninterest expenses 35,115 39,007 18,345 21,070 14.9% Nonrecurring expense 548 708 - - 0.0% Net income 12,335 13,492 6,883 7,140 3.7% Diluted EPS $1.69 $1.88 $0.96 $0.99 3.1%
Net interest margin 4.30% 4.16% 4.24% 4.07% -4.0% Efficiency ratio 62.2% 63.3% 62.4% 63.1% 1.2% ROAA 1.15% 1.13% 1.24% 1.02% -17.7% ROAE 11.51% 12.12% 11.97% 11.86% -0.9%
18
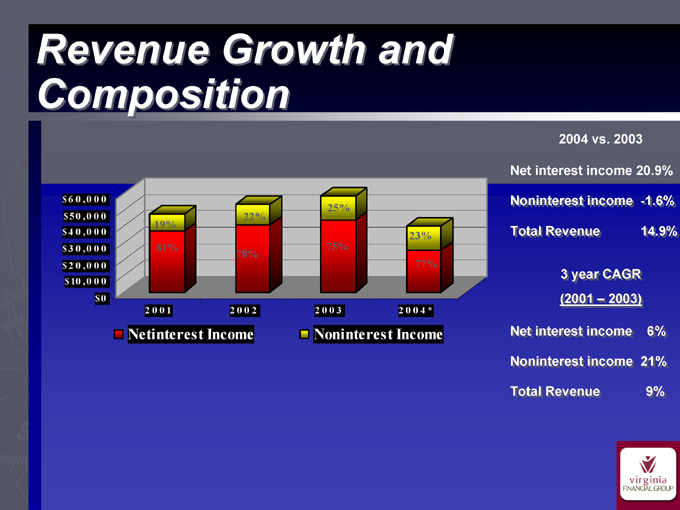
Revenue Growth and Composition $60,000 $50,000 $40,000 $30,000 $20,000 $10,000 $0
25% 22% 19%
23% 81% 75% 78% 77%
2001 2002 2003 2004*
Netinterest Income Noninterest Income
2004 vs. 2003
Net interest income 20.9% Noninterest income -1.6% Total Revenue 14.9%
3 year CAGR (2001 – 2003)
Net interest income 6% Noninterest income 21% Total Revenue 9%
19
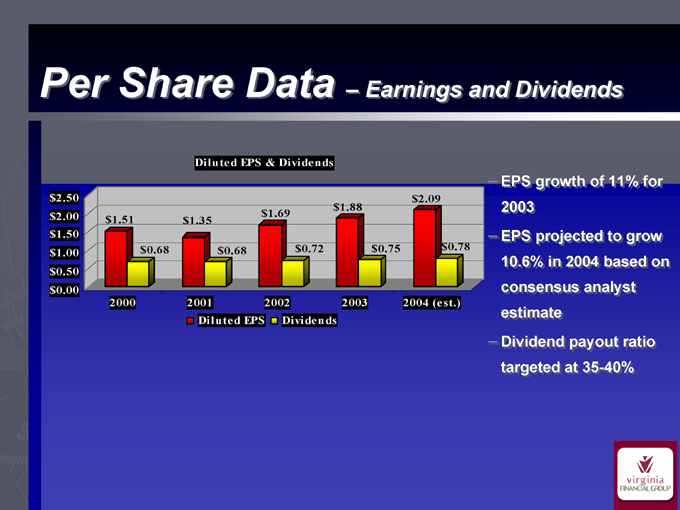
Per Share Data – Earnings and Dividends
Diluted EPS & Dividends
$2.50
$2.00
$1.50
$1.00
$0.50
$0.00
$2.09 $1.88 $1.69 $1.51 $1.35
$0.68 $0.68 $0.72 $0.75 $0.78
2000 2001 2002 2003 2004 (est.) Diluted EPS Dividends
EPS growth of 11% for 2003 EPS projected to grow 10.6% in 2004 based on consensus analyst estimate Dividend payout ratio targeted at 35-40%
20
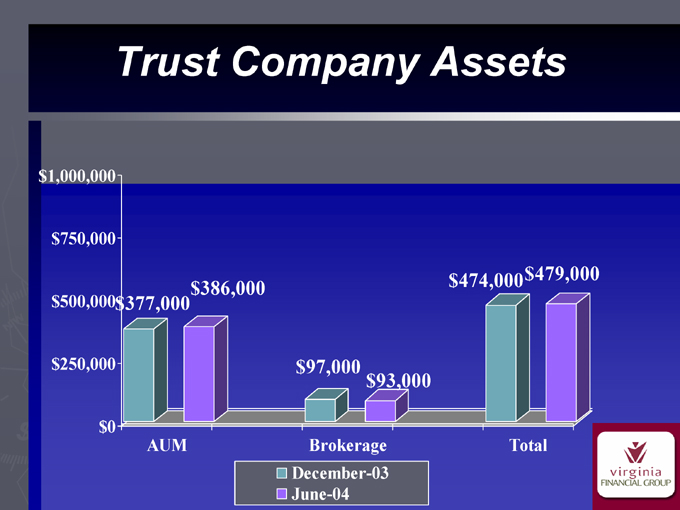
Trust Company Assets $1,000,000 $750,000 $500,000 $250,000 $0 $377,000 $386,000 $97,000 $93,000 $474,000 $479,000
AUM Brokerage Total
December-03 June-04
21
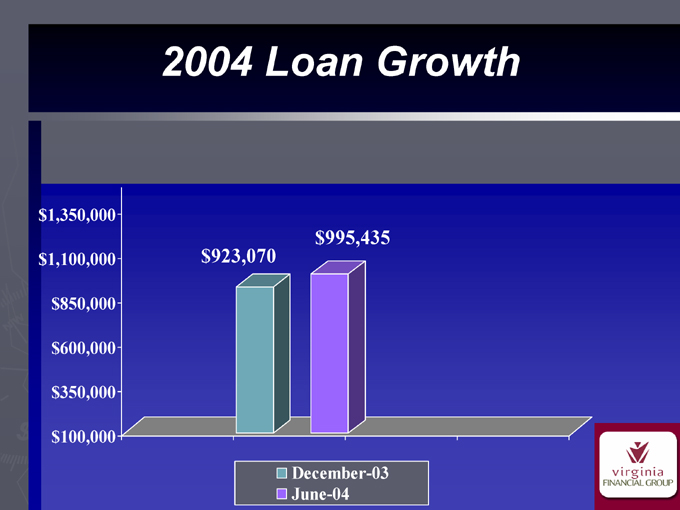
2004 Loan Growth $1,350,000 $1,100,000 $850,000 $600,000 $350,000 $100,000 $995,435 $923,070
December-03 June-04
22
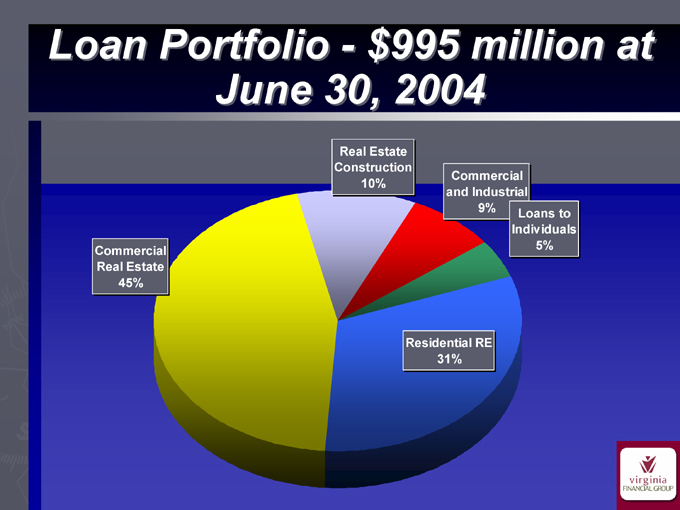
Loan Portfolio - $995 million at June 30, 2004
Commercial Real Estate 45%
Real Estate Construction 10%
Commercial and Industrial 9%
Loans to Individuals 5%
Residential RE
31%
23
Summary of Larger Loans
Predominately all of VFG’s significant commercial real estate loans are owner occupied with the real estate representing a secondary source of repayment Largest commercial real estate loan is $9 million participated among member banks Lending capacity of $18 million; in-house cap of $8 million Loans and corresponding relationship are all within VFG’s market footprint
24
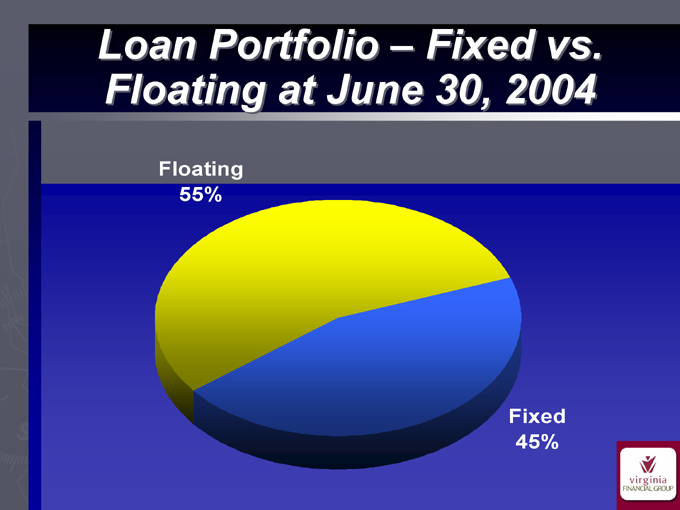
Loan Portfolio – Fixed vs. Floating at June 30, 2004
Floating 55%
Fixed 45%
25
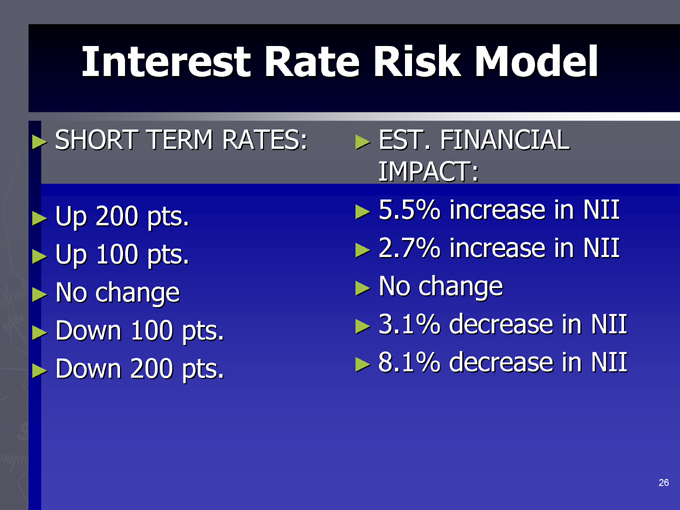
Interest Rate Risk Model
SHORT TERM RATES:
Up 200 pts. Up 100 pts. No change Down 100 pts. Down 200 pts.
EST. FINANCIAL IMPACT: 5.5% increase in NII 2.7% increase in NII No change 3.1% decrease in NII 8.1% decrease in NII
26
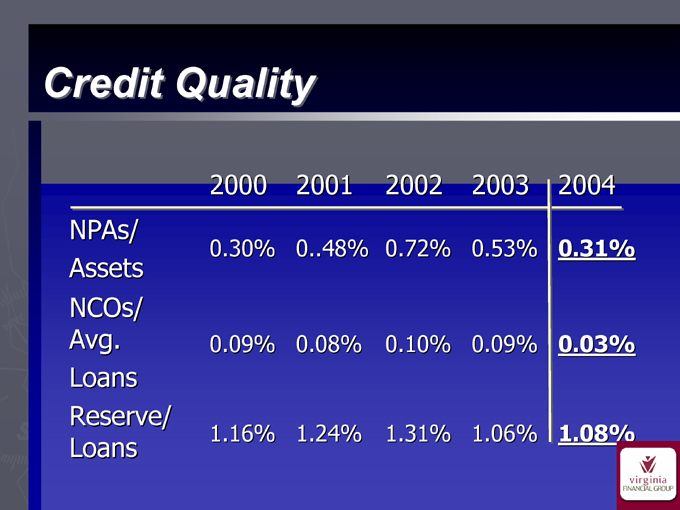
Credit Quality
2000 2001 2002 2003 2004 NPAs/
0.30% 048% 0.72% 0.53% 0.31%
Assets NCOs/
Avg. 0.09% 0.08% 0.10% 0.09% 0.03%
Loans Reserve/ Loans
1.16% 1.24% 1.31% 1.06% 1.08%
27
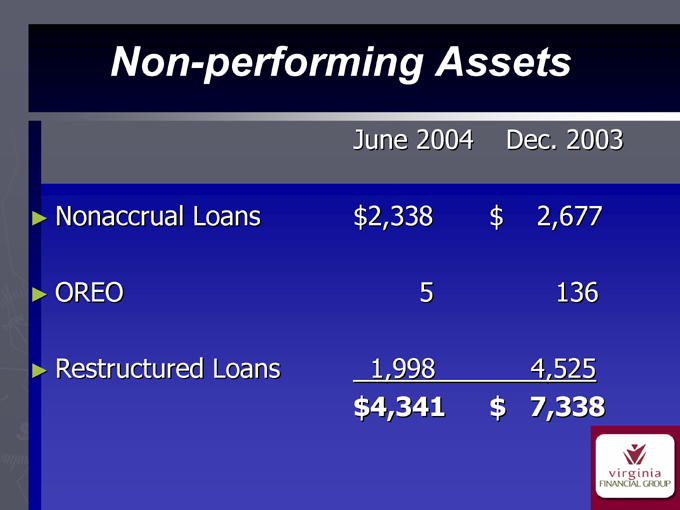
Non-performing Assets
June 2004 Dec. 2003 Nonaccrual Loans $2,338 $ 2,677 OREO 5 136
Restructured Loans 1,998 4,525 $4,341 $ 7,338
28
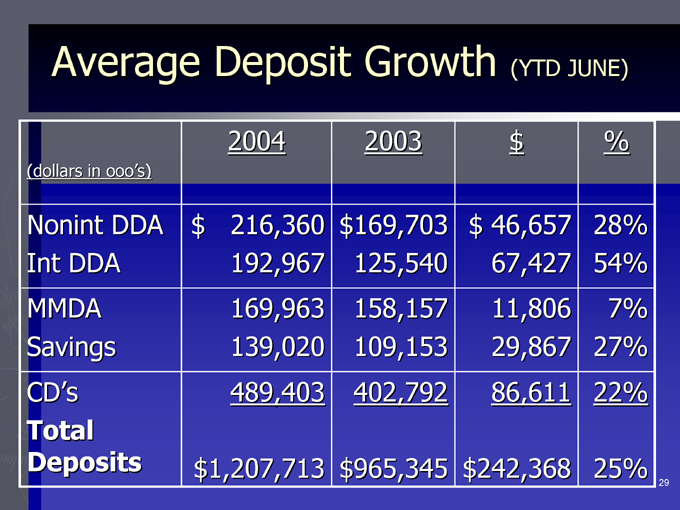
Average Deposit Growth (YTD JUNE)
2004 2003 $ %
(dollars in ooo’s)
Nonint DDA $216,360 $169,703 $46,657 28% Int DDA 192,967 125,540 67,427 54% MMDA 169,963 158,157 11,806 7% Savings 139,020 109,153 29,867 27% CD’s 489,403 402,792 86,611 22%
Total
Deposits $1,207,713 $965,345 $242,368 25%
29
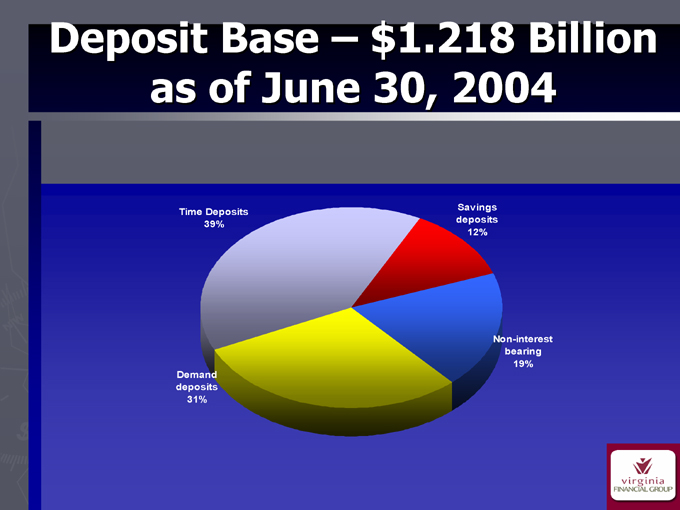
Deposit Base – $1.218 Billion as of June 30, 2004
Time Deposits 39%
Demand deposits 31%
Savings deposits 12%
Non-interest bearing 19%
30
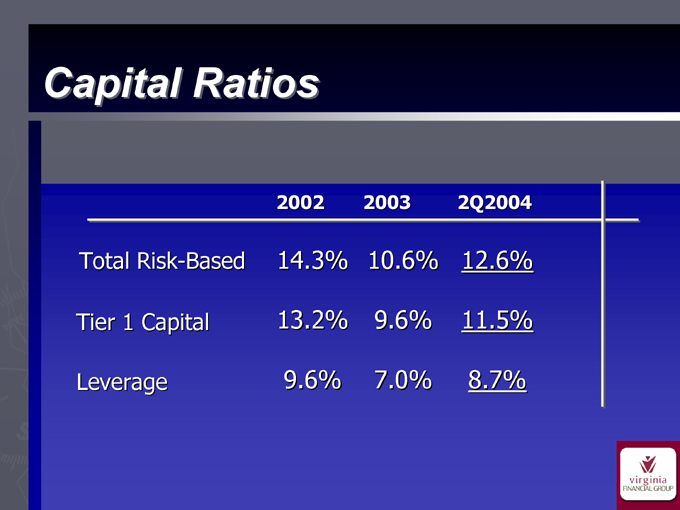
Capital Ratios
2002 2003 2Q2004
Total Risk-Based 14.3% 10.6% 12.6%
Tier 1 Capital 13.2% 9.6% 11.5%
Leverage 9.6% 7.0% 8.7%
31
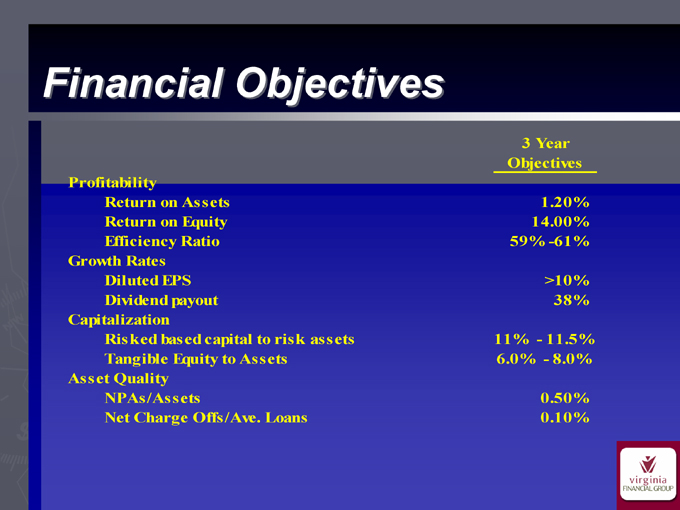
Financial Objectives
3 Year Objectives
Profitability
Return on Assets 1.20% Return on Equity 14.00% Efficiency Ratio 59% -61% Growth Rates Diluted EPS >10% Dividend payout 38% Capitalization Risked based capital to risk assets 11%—11.5% Tangible Equity to Assets 6.0%—8.0% Asset Quality NPAs/Assets 0.50% Net Charge Offs/Ave. Loans 0.10%
32
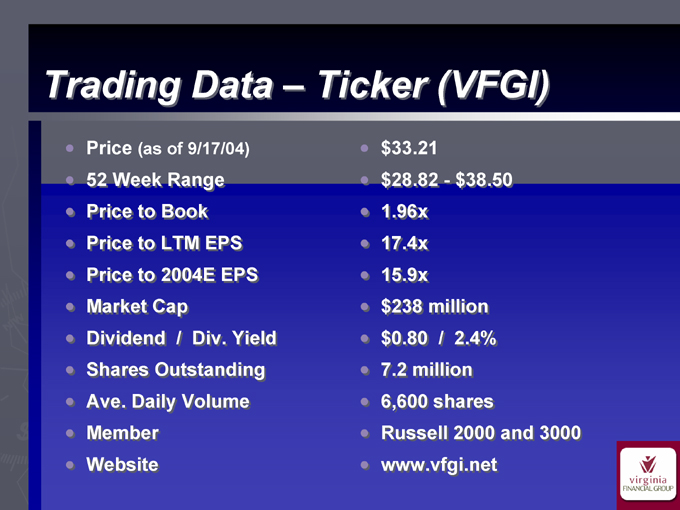
Trading Data – Ticker (VFGI)
Price (as of 9/17/04)
52 Week Range Price to Book Price to LTM EPS Price to 2004E EPS Market Cap Dividend // Div. Yield . Shares Outstanding Ave. Daily Volume Member Website $33.21 $28.82—- $38.50 1.96x
17.4x 15.9x $238 million $0.80 // 2.4% 7.2 million 6,600 shares
Russell 2000 and 3000 www.vfgi.net
33
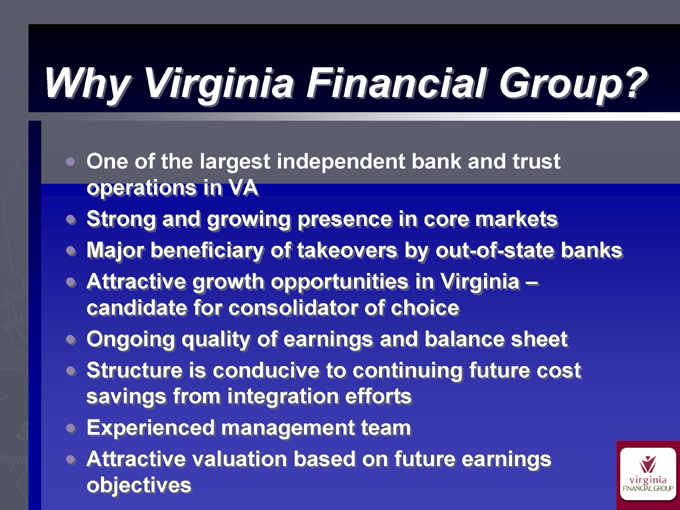
Why Virginia Financial Group?
One of the largest independent bank and trust operations in VA
Strong and growing presence in core markets Major beneficiary of takeovers by out-of-state banks Attractive growth opportunities in Virginia – candidate for consolidator of choice Ongoing quality of earnings and balance sheet Structure is conducive to continuing future cost savings from integration efforts Experienced management team Attractive valuation based on future earnings objectives
34
SunTrust Robinson Humphrey Sunbelt Community Bank Conference September 28, 2004
35