Exhibit 99.1
SunTrust Robinson Humphrey Sunbelt Community Bank Conference September 13, 2005
1
Forward-Looking Statement
The following presentation may contain forward-looking statements about VFG’s growth and acquisition strategies and future financial performance, including earnings and dividends per share, return on shareholder’s equity, efficiency ratio and capital levels. Forward-looking statements are encouraged by the Private Securities Litigation Reform Act of 1995.
Such forward-looking information is based upon certain underlying assumptions, risks and uncertainties. Because of the possibility of change in the underlying assumptions, actual results to differ materially from estimated results. Risks and uncertainties that may impact these assumptions include: (i) expected cost savings from VFG’s acquisitions and dispositions, (ii) competitive pressure in the banking industry or in VFG’s markets may increase significantly, (iii) changes in the interest rate environment may reduce margins, (iv) general economic conditions, either nationally or regionally, may be less favorable than expected, resulting in, among other things, credit quality deterioration, (v) changes may occur in banking legislation and regulation (vi) changes may occur in general business conditions and (vii) changes may occur in the securities markets.
2
Company Overview
3
Company Overview
A $1.5 billion bank holding company headquartered in Culpeper, Virginia.
Three bank subsidiaries and two financial service subsidiaries.
35 banking offices, two loan production offices and five trust and investment locations.
$480 million in trust and managed assets under administration at Virginia Commonwealth Trust subsidiary.
Origin of the company dates back to the inception of Second Bank & Trust in 1900.
4
Company Overview
Landmark transaction was the merger-of-equals of Virginia Commonwealth Financial and Virginia Financial Corp. to form Virginia Financial Group in 2002.
Most recent M&A transaction was purchase of eight branches from First Virginia Bank in connection with BBT merger in 2003.
Traded on the Nasdaq National Market (symbol: VFGI)
5
Corporate Structure
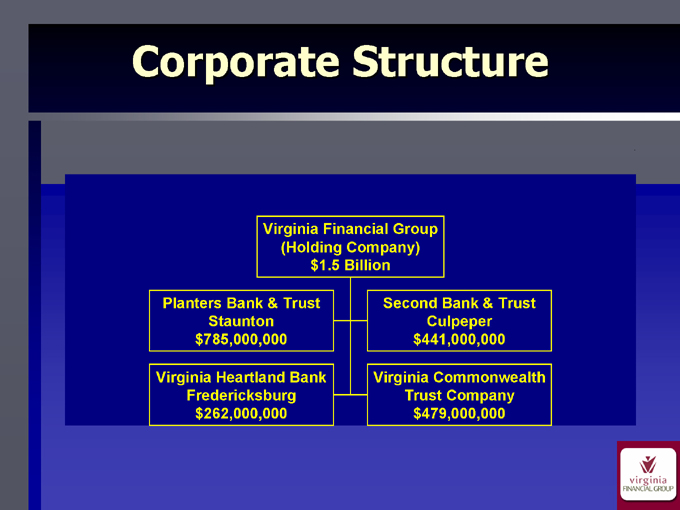
Virginia Financial Group (Holding Company) $1.5 Billion
Planters Bank & Trust Staunton $785,000,000
Virginia Heartland Bank Fredericksburg $262,000,000
Second Bank & Trust Culpeper $441,000,000
Virginia Commonwealth Trust Company $479,000,000
6
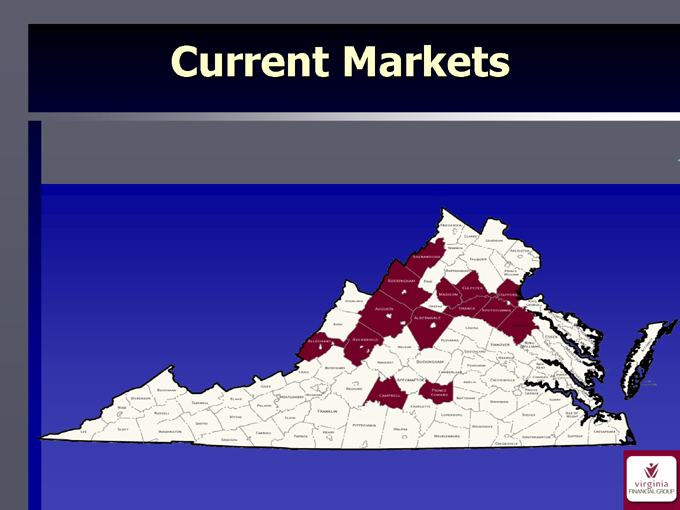
Current Markets
7
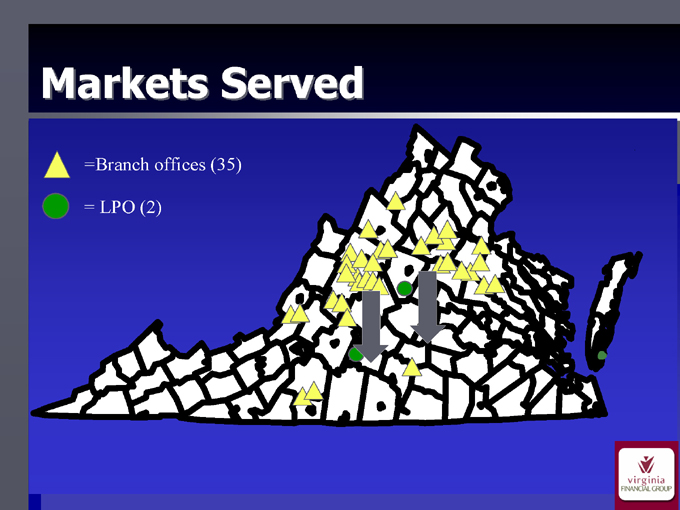
Markets Served
=Branch offices (35)
= LPO (2)
8
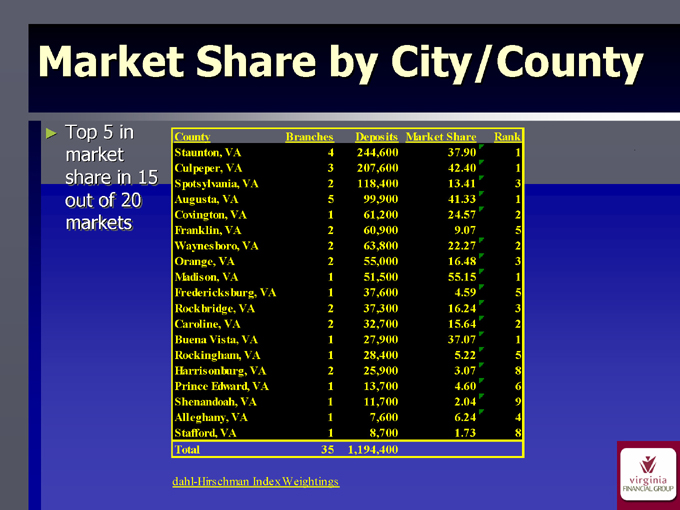
Market Share by City/County
Top 5 in market share in 15 out of 20 markets
County Branches Deposits Market Share Rank
Staunton, VA 4 244,600 37.90 1
Culpeper, VA 3 207,600 42.40 1
Spotsylvania, VA 2 118,400 13.41 3
Augusta, VA 5 99,900 41.33 1
Covington, VA 1 61,200 24.57 2
Franklin, VA 2 60,900 9.07 5
Waynesboro, VA 2 63,800 22.27 2
Orange, VA 2 55,000 16.48 3
Madison, VA 1 51,500 55.15 1
Fredericksburg, VA 1 37,600 4.59 5
Rockbridge, VA 2 37,300 16.24 3
Caroline, VA 2 32,700 15.64 2
Buena Vista, VA 1 27,900 37.07 1
Rockingham, VA 1 28,400 5.22 5
Harrisonburg, VA 2 25,900 3.07 8
Prince Edward, VA 1 13,700 4.60 6
Shenandoah, VA 1 11,700 2.04 9
Alleghany, VA 1 7,600 6.24 4
Stafford, VA 1 8,700 1.73 8
Total 35 1,194,400
dahl-Hirschman Index Weightings
9
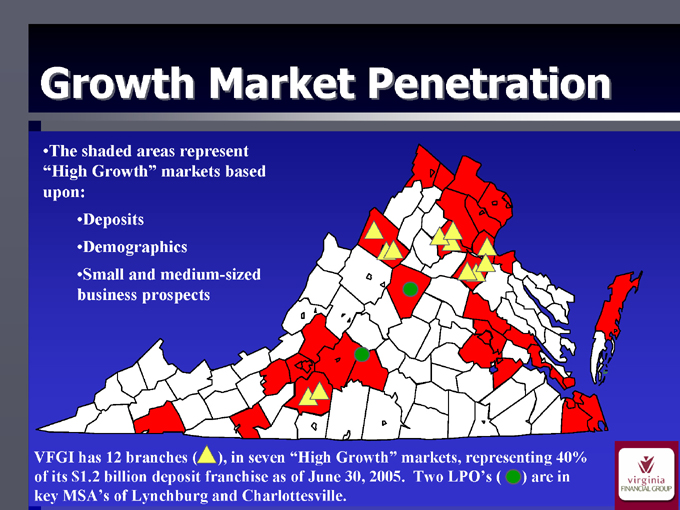
Growth Market Penetration
The shaded areas represent “High Growth” markets based upon:
Deposits
Demographics
Small and medium-sized business prospects
VFGI has 12 branches ( ), in seven “High Growth” markets, representing 40% of its $1.2 billion deposit franchise as of June 30, 2005. Two LPO’s ( ) are in key MSA’s of Lynchburg and Charlottesville.
10

Growth Market Penetration — New Branches Under Construction
11
Regulatory Update
Bank Secrecy Act / Anti-Money Laundering
Focused exam recently conducted and went very well.
Richmond Federal Reserve has recommended release from Supervisory Agreement to the Federal Reserve Board.
Management priority throughout the Company.
Policies and Systems that are “State of the Art”.
12
Strategic Initiatives
13
Philosophy
Become Virginia’s premier financial services provider, able to successfully compete with all competitors.
Achieved through development of superior products, people and technology.
Embark on important new “people first” initiatives to meet the vision.
Become the largest Virginia based institution, but only as a by-product of our focus on quality improvement.
14
Strategic Initiatives
Maintaining consistent EPS growth.
Become the “Community Bank of Choice” in Virginia.
Become second to none in quality of service.
Continue to attract and retain the best talent.
Expand the franchise statewide.
Improve leverage of capital base.
15
Strategic Initiatives — Specific Actions/Plans
Aggressive de novo strategy once BSA issue has been resolved; construction and site planning well underway.
Continue M&A discussions with the intent to also grow by acquisition as early as 2006.
Refinement of the multi-bank holding company model.
Establishment of in-house title and settlement services company.
Leverage ownership in Banker’s Insurance, LLC
16
Employee Culture Building Initiatives
What is “Corporate Culture”
Simply stated, The corporate culture is defined by the consistent behavior of a company’s people.
Why spend time and resources on Culture Building Initiatives?
The only true sustainable differentiation available today in our industry is our people. How our people behave will define our level of success.
17
Employee Culture Building Initiatives
“I came to see, in my decade at IBM, that culture isn’t just one aspect of the game—it is the game.”
Lou Gerstner, former Chairman & CEO of IBM
“Most business leaders are afraid to talk about culture. They’re far more comfortable with numbers. While I am very numbers focused, you can’t change a business with numbers. Numbers are the end result. You change a business by changing the behavior of its people.”
Dick Brown, CEO, EDS
18
Employee Culture Building Initiatives
What is VFG’s Cultural Goal?
Stated earlier — One of Empowered, Involved and Caring Owners.
Expanded a bit — Employees committed to providing a level of service to our customers that differentiates VFG and its affiliates from the competition.
19
Growth Strategies
Growth to be driven by acquisition, LPOs and de novo branches
Three year growth target: $3 billion in assets
Primary growth markets will be Charlottesville and Lynchburg MSAs
Continue to focus on legacy markets
Build Wealth Management platform organically and through acquisition – Promote “one stop financial center”
20

Financial Overview
21
Quarter Ended June 30, 2005
Earnings of $4.5 million representing an increase of 21% over 2004.
Diluted earnings per share $.62 per share representing a 22% increase over 2004.
ROA and ROE of 1.22% and 13.80%.
Return on tangible equity of 15.85%.
Cash dividend of $.21 per share.
22

Financial Trends — Income Statement
Six Months Ended 2005
2004 2005 % increase
Net interest income $25,054 $26,972 7.7%
Provision 1,317 1,092 -17.1%
Noninterest income 7,406 7,779 5.0%
Noninterest expenses 21,070 21,335 1.3%
Net income 7,140 8,483 18.8%
Diluted EPS $0.99 $1.18 19.2%
Net interest margin 4.08% 4.19% 2.7%
Efficiency ratio 63.1% 60.4% -4.3%
ROAA 1.02% 1.18% 15.7%
ROAE 11.86% 13.28% 12.0%
23
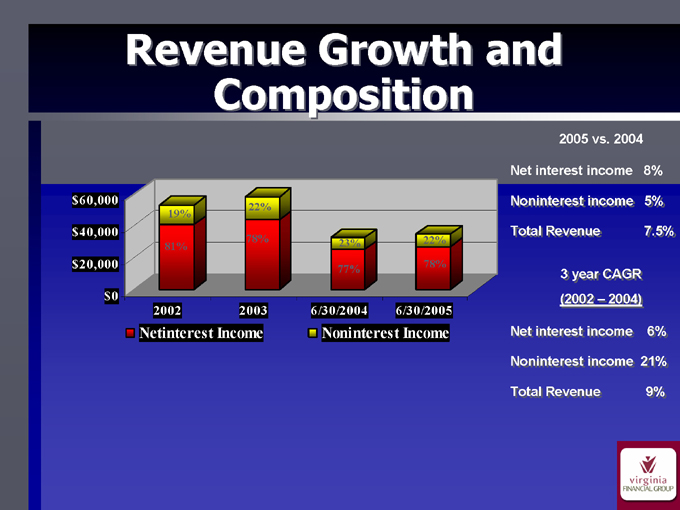
Revenue Growth and Composition
2005 vs. 2004 .
Net interest income 8%
Noninterest income 5%
Total Revenue 7.5%
3 year CAGR
(2002 – 2004)
Net interest income 6%
Noninterest income 21%
Total Revenue 9%
$60,000 $40,000 $20,000 $0
19%
81%
22%
78%
23%
77%
22%
78%
2002 2003 6/30/2004 6/30/2005
Netinterest Income
Noninterest Income
24
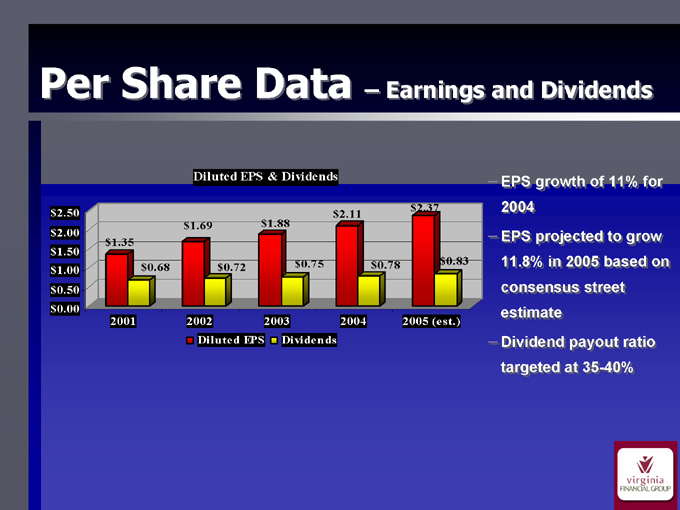
Per Share Data — Earnings and Dividends
EPS growth of 11% for 2004
EPS projected to grow 11.8% in 2005 based on consensus street estimate
Dividend payout ratio targeted at 35-40%
Diluted EPS & Dividends
$2.50
$2.00
$1.50
$1.00
$0.50
$0.00
2001 2002 2003 2004 2005 (est.)
Diluted EPS
Dividends $1.35 $0.68 $1.69 $0.72 $1.88 $0.75 $2.11 $0.78 $2.37 $0.83
25

Trust Company Assets
$1,000,000 $750,000 $500,000 $250,000 $0 $495,000 $479,000 $386,000 $377,000 $118,000 $93,000
AUM
Brokerage
Total
June-05
June-04
26
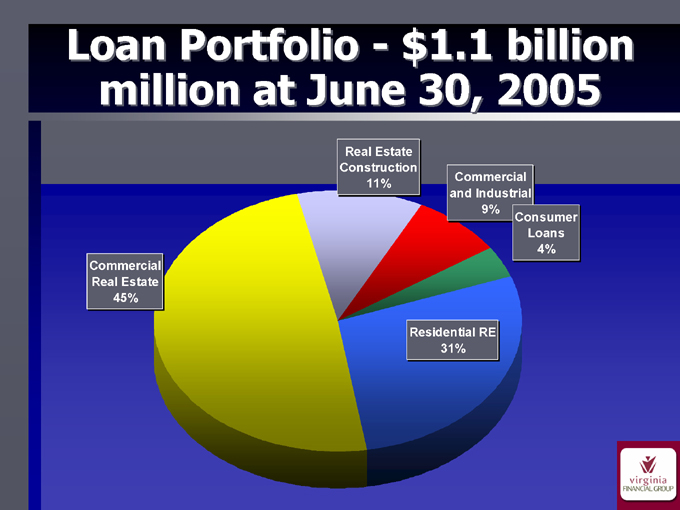
Loan Portfolio – $1.1 billion million at June 30, 2005
Real Estate Construction 11%
Commercial and Industrial 9%
Consumer Loans 4%
Residential RE 31%
Commercial Real Estate 45%
27
Large Loan Characteristics
Predominately all of VFG’s significant commercial real estate loans are owner occupied with the real estate representing a secondary source of repayment.
Largest commercial real estate loan is $12 million participated among member banks.
Lending capacity of $22 million; in-house cap of $8 million.
Loans and corresponding relationship are all within VFG’s market footprint.
28
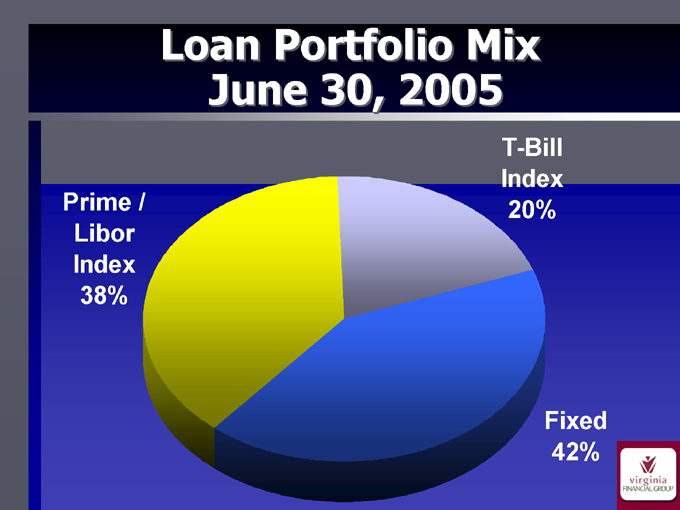
Loan Portfolio Mix June 30, 2005
T-Bill Index 20%
Fixed 42%
Prime / Libor Index 38%
29
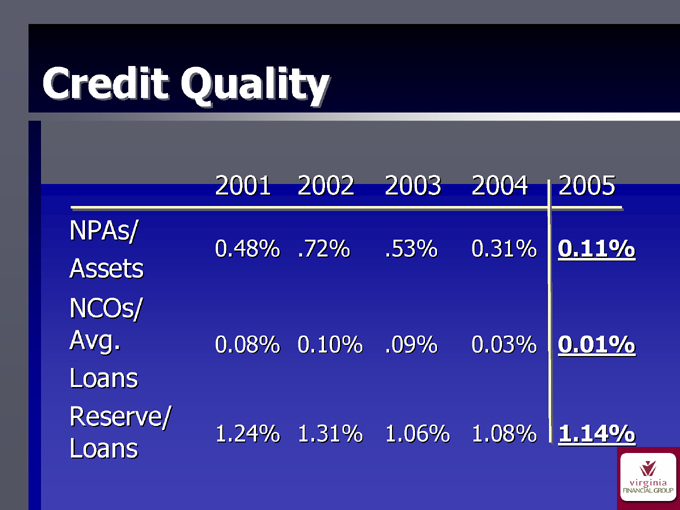
Credit Quality
2001 2002 2003 2004 2005
NPAs/ Assets 0.48% .72% .53% 0.31% 0.11%
NCOs/ Avg. Loans 0.08% 0.10% .09% 0.03% 0.01%
Reserve/ Loans 1.24% 1.31% 1.06% 1.08% 1.14%
30
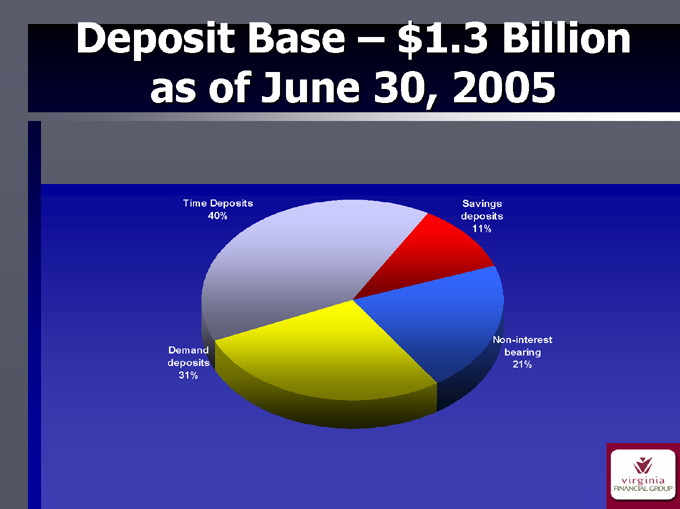
Deposit Base — $1.3 Billion as of June 30, 2005
Savings deposits 11%
Non-interest bearing 21%
Time Deposits 40%
Demand deposits 31%
31
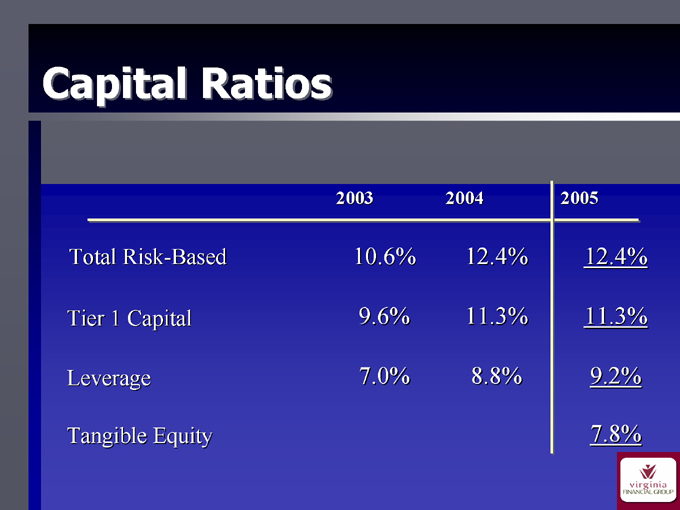
Capital Ratios
2003 2004 2005
Total Risk-Based 10.6% 12.4% 12.4%
Tier 1 Capital 9.6% 11.3% 11.3%
Leverage 7.0% 8.8% 9.2%
Tangible Equity 7.8%
32
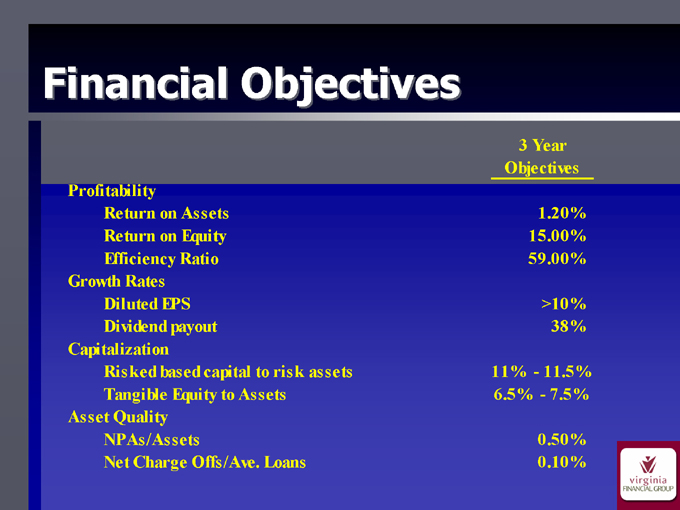
Financial Objectives
3 Year Objectives
Profitability
Return on Assets 1.20%
Return on Equity 15.00%
Efficiency Ratio 59.00%
Growth Rates
Diluted EPS >10%
Dividend payout 38%
Capitalization
Risked based capital to risk assets 11% - 11.5%
Tangible Equity to Assets 6.5% - 7.5%
Asset Quality
NPAs/Assets 0.50%
Net Charge Offs/Ave. Loans 0.10%
33
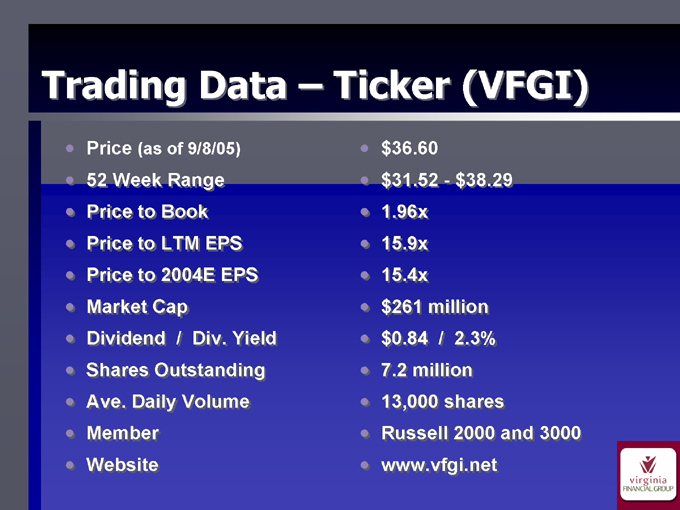
Trading Data — Ticker (VFGI)
Price (as of 9/8/05)
52 Week Range Price to Book Price to LTM EPS Price to 2004E EPS Market Cap Dividend / Div. Yield Shares Outstanding Ave. Daily Volume Member Website $36.60 $31.52 - $38.29 1.96x
15.9x 15.4x $261 million $0.84 / 2.3% 7.2 million 13,000 shares
Russell 2000 and 3000 www.vfgi.net
34
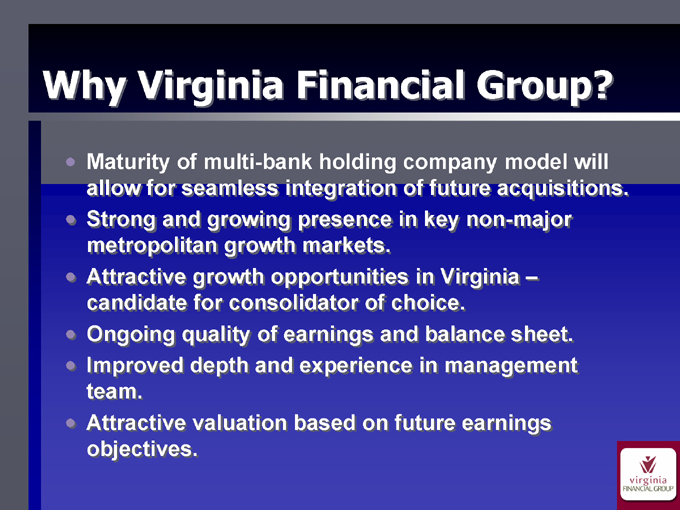
Why Virginia Financial Group?
Maturity of multi-bank holding company model will allow for seamless integration of future acquisitions.
Strong and growing presence in key non-major metropolitan growth markets.
Attractive growth opportunities in Virginia — candidate for consolidator of choice.
Ongoing quality of earnings and balance sheet.
Improved depth and experience in management team.
Attractive valuation based on future earnings objectives.
35
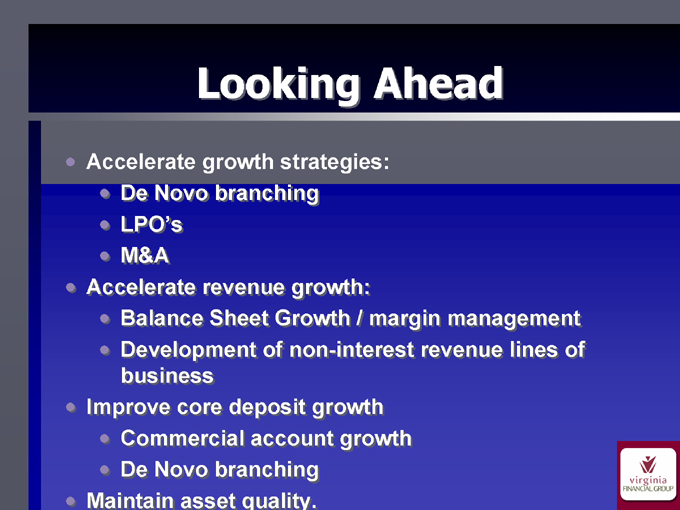
Looking Ahead
Accelerate growth strategies:
De Novo branching
LPO’s
M&A
Accelerate revenue growth:
Balance Sheet Growth / margin management
Development of non-interest revenue lines of business
Improve core deposit growth
Commercial account growth
De Novo branching
Maintain asset quality.
36

SunTrust Robinson Humphrey Sunbelt Community Bank Conference September 13, 2005
37