Virginia Financial Group, Inc. (VFGI)
and
FNB Corporation (FNBP)
are Combining in a Merger-of-Equals Transaction
July 27, 2007
Caution Regarding Forward-Looking Statements
Statements made in this presentation, other than those concerning historical financial information, may be considered forward-looking statements, which speak only as of the date of this presentation and are based on current expectations and involve a number of assumptions. These include statements as to the anticipated benefits of the merger, including future financial and operating results, cost savings, enhanced revenues and the accretion to earnings that may be realized from the merger as well as other statements of expectations regarding the merger and any other statements regarding future results or expectations. Each of VFGI and FNBP intends such forward-looking statements to be covered by the safe harbor provisions for forward-looking statements contained in the Private Securities Litigation Reform Act of 1995 and is including this statement for purposes of these safe harbor provisions. The companies’ respective abilities to predict results, or the actual effect of future plans or strategies, is inherently uncertain. Factors which could have a material effect on the operations and future prospects of each of VFGI and FNBP and the resulting company, include but are not limited to: (1) the businesses of VFGI and/or FNBP may not be integrated successfully or such integration may be more difficult, time-consuming or costly than expected; (2) expected revenue synergies and cost savings from the merger may not be fully realized or realized within the expected time frame; (3) revenues following the merger may be lower than expected; (4) customer and employee relationships and business operations may be disrupted by the merger; (5) the ability to obtain required regulatory and shareholder approvals, and the ability to complete the merger on the expected timeframe may be more difficult, time-consuming or costly than expected; (6) changes in interest rates, general economic conditions, legislative/regulatory changes, monetary and fiscal policies of the U.S. government, including policies of the U.S. Treasury and the Federal Reserve Board; the quality and composition of the loan and securities portfolios; demand for loan products; deposit flows; competition; demand for financial services in the companies’ respective market areas; their implementation of new technologies; their ability to develop and maintain secure and reliable electronic systems; and accounting principles, policies, and guidelines; and (7) other risk factors detailed from time to time in filings made by VFGI or FNBP with the SEC. VFGI and FNBP undertake no obligation to update or clarify these forward-looking statements, whether as a result of new information, future events or otherwise.
Transaction Summary
Transaction Structure: 100% Stock Swap, Merger-of-Equals
Name of New Company: To be determined prior to close
Fixed Exchange Ratio: 1.5850 VFGI Shares for each FNBP share
Pro Forma Ownership: 48% VFGI; 52% FNBP
Board of Directors: Equal representation
Headquarters: Charlottesville, Virginia
Bank/Operations Center: Christiansburg, Virginia
Pro Forma Market Cap.: Approximately $450 Million
Annual Dividend: $0.64 per share ($1.014 per FNBP equiv. share)
Expected Closing: Late 4Q2007
Required Approvals: Shareholder and regulatory approvals
Due Diligence: Completed
Other: Dual 19.9% Lock-up Option
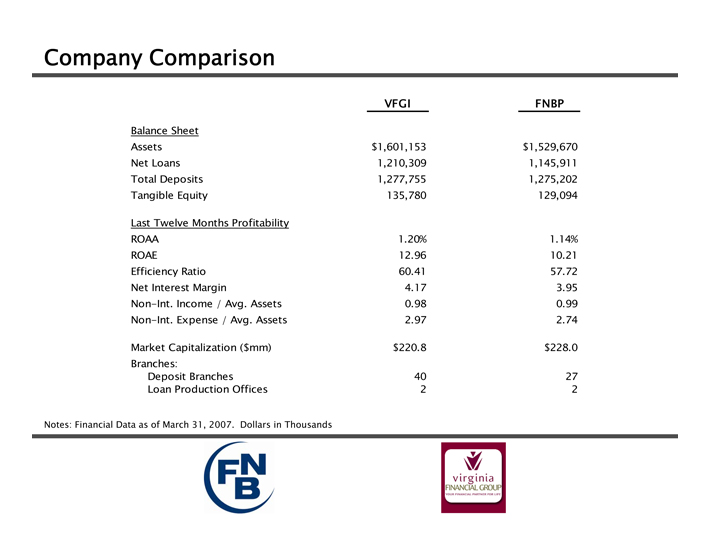
Company Comparison
VFGI FNBP
Balance Sheet
Assets $1,601,153 $1,529,670 Net Loans 1,210,309 1,145,911 Total Deposits 1,277,755 1,275,202 Tangible Equity 135,780 129,094
Last Twelve Months Profitability
ROAA 1.20% 1.14% ROAE 12.96 10.21 Efficiency Ratio 60.41 57.72 Net Interest Margin 4.17 3.95 Non-Int. Income / Avg. Assets 0.98 0.99 Non-Int. Expense / Avg. Assets 2.97 2.74
Market Capitalization ($mm) $220.8 $228.0 Branches: Deposit Branches 40 27 Loan Production Offices 2 2
Notes: Financial Data as of March 31, 2007. Dollars in Thousands

Senior Management Team
Chairman of the Board: Bill Heath (FNBP)
President and CEO: Ed Barham (VFGI)
Chief Financial Officer: Jeff Farrar (VFGI)
Chief Operating Officer: Litz Van Dyke (VFGI)
Bank President: Greg Feldmann (FNBP)
Chairman of Bank Board: Raymond Smoot, Jr. (FNBP)
Transaction Rationale
Creates the largest independent bank headquartered in Virginia
Combines the best banking talent from both VFGI and FNBP
Creates a Wealth Management division with nearly $1 billion of assets under management
Expands presence in the highly attractive Virginia marketplace
Enhances competitive position
Expected to be accretive to Earnings Per Share for both VFGI and FNBP in first full year following close
Increases stock trading liquidity and market capitalization
Significantly improves the possibility that combined company could be included in the Russell 3000 Index in 2008
Pro Forma Franchise
#1—Largest Bank Holding Company Headquartered in Virginia Ranked by Assets
#1—Largest Bank Holding Company Headquartered in Virginia Ranked by Loans
#1—Largest Bank Holding Company Headquartered in Virginia Ranked by Deposits*
#2—Second Most Branches of Any Virginia-Based Bank Holding Company
NOTE: Excludes Capital One Financial Corp, E*Trade Financial Corp, Countrywide Financial Corp., and UNIFI Mutual Holding Co.
* Deposit Data at June 30, 2006 Adjusted for all Pending and Completed Mergers as of 7/19/2007. Dollars in thousands.
Source: SNL Securities
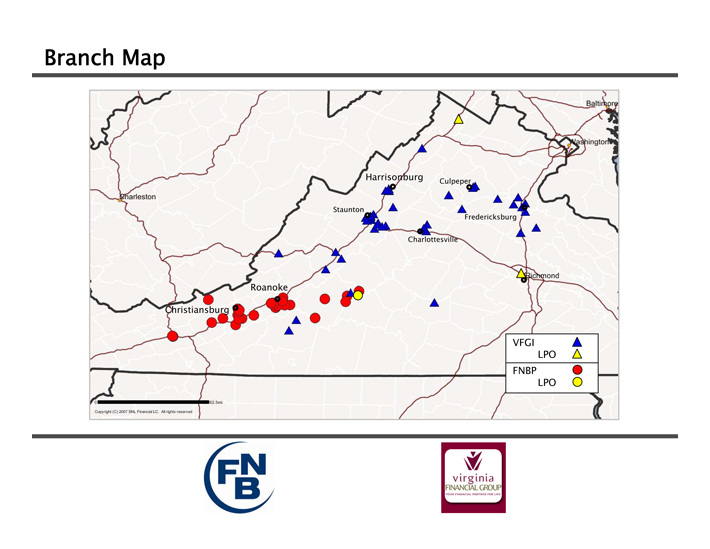
Branch Map
Harrisonburg Culpeper
Staunton
Fredericksburg
Charlottesville
Roanoke
Christiansburg
VFGI
LPO FNBP
LPO

Virginia Deposit Market Share
# of Virginia Market Rank Ticker Company Name City State Branches Deposits * Share
1 WB Wachovia Corp. Charlotte NC 649 $25,465,221 19.97 %
2 BBT BB&T Corp. Winston-Salem NC 686 19,411,042 15.22
3 BAC Bank of America Corp. Charlotte NC 254 16,900,970 13.25
4 STI SunTrust Banks Inc. Atlanta GA 355 14,083,510 11.05
5 C Citigroup Inc. New York NY 9 6,906,541 5.42
6 Pro Forma Combined Company Charlottesville VA 67 2,595,278 2.04
6 PNC PNC Financial Services Group Pittsburgh PA 73 2,346,076 1.84
7 B.F. Saul Company Chevy Chase MD 109 2,287,460 1.79
8 CARE Carter Bank & Trust Martinsville VA 95 2,099,405 1.65
9 UBSI United Bankshares Inc. Charleston WV 61 1,996,530 1.57
10 UBSH Union Bankshares Corp. Bowling Green VA 60 1,663,505 1.30
11 TOWN TowneBank Portsmouth VA 22 1,619,993 1.27
12 VCBI Virginia Commerce Bancorp Inc. Arlington VA 21 1,432,267 1.12
13 VFGI Virginia Financial Group Culpeper VA 40 1,303,200 1.02
14 FNBP FNB Corp. Christiansburg VA 27 1,292,078 1.01
15 BHRB Burke & Herbert Bank & Trust Alexandria VA 16 1,155,366 0.91
16 CFNL Cardinal Financial Corp. McLean VA 26 1,127,857 0.88
17 FCNCA First Citizens BancShares Inc. Raleigh NC 54 1,103,768 0.87
18 Ukrop’s Super Markets Inc. Richmond VA 39 1,004,389 0.79
19 FULT Fulton Financial Corp. Lancaster PA 9 905,814 0.71
20 NKSH National Bankshares Inc. Blacksburg VA 31 746,787 0.59
NOTE: Excludes Capital One Financial Corp, E*Trade Financial Corp, Countrywide Financial Corp., and UNIFI Mutual Holding Co.
* Deposit Data at June 30, 2006 Adjusted for all Pending and Completed Mergers as of 7/19/2007. Dollars in thousands.
Source: SNL Securities
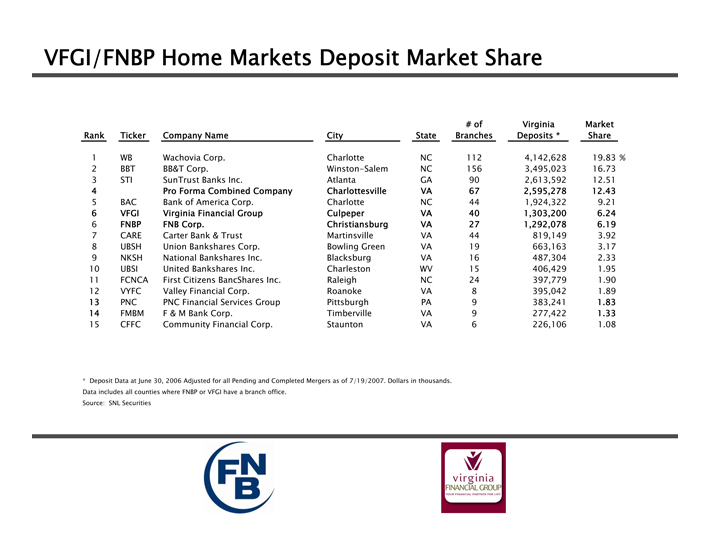
VFGI/FNBP Home Markets Deposit Market Share
# of Virginia Market Rank Ticker Company Name City State Branches Deposits * Share
1 WB Wachovia Corp. Charlotte NC 112 4,142,628 19.83 %
2 BBT BB&T Corp. Winston-Salem NC 156 3,495,023 16.73
3 STI SunTrust Banks Inc. Atlanta GA 90 2,613,592 12.51
4 Pro Forma Combined Company Charlottesville VA 67 2,595,278 12.43
5 BAC Bank of America Corp. Charlotte NC 44 1,924,322 9.21
6 VFGI Virginia Financial Group Culpeper VA 40 1,303,200 6.24
6 FNBP FNB Corp. Christiansburg VA 27 1,292,078 6.19
7 CARE Carter Bank & Trust Martinsville VA 44 819,149 3.92
8 UBSH Union Bankshares Corp. Bowling Green VA 19 663,163 3.17
9 NKSH National Bankshares Inc. Blacksburg VA 16 487,304 2.33
10 UBSI United Bankshares Inc. Charleston WV 15 406,429 1.95
11 FCNCA First Citizens BancShares Inc. Raleigh NC 24 397,779 1.90
12 VYFC Valley Financial Corp. Roanoke VA 8 395,042 1.89
13 PNC PNC Financial Services Group Pittsburgh PA 9 383,241 1.83
14 FMBM F & M Bank Corp. Timberville VA 9 277,422 1.33
15 CFFC Community Financial Corp. Staunton VA 6 226,106 1.08
* Deposit Data at June 30, 2006 Adjusted for all Pending and Completed Mergers as of 7/19/2007. Dollars in thousands.
Data includes all counties where FNBP or VFGI have a branch office. Source: SNL Securities
Overview of Virginia Financial Group, Inc.
Headquartered in Charlottesville, Virginia
Operates two banking subsidiaries, Second Bank & Trust and Planters Bank, with a total of 40 branches
Assets over $1.6 billion, deposits of $1.3 billion and equity of $153 million
#1 Deposit Market Share in four Virginia Counties
5 year EPS Compound Annual Growth Rate of 11.3%
Middle-market commercial banking tradition with three lines of business:
Retail Banking
Commercial Banking
Wealth Management
Market Capitalization: $221 million
Overview of FNB Corporation
Headquartered in Christiansburg, Virginia
Assets of $1.5 billion, deposits of $1.3 billion and equity of $176 million
Through its subsidiary, First National Bank, the Corporation operates 27 full-service branches and 2 loan production offices
#1 Deposit Market Share in four Virginia Counties
Community Bank model with four lines of business:
Retail Banking
Commercial Banking
Private Banking
Wealth Management
Growing financial services niche
Market Capitalization: $228 million
Overview of Combined Company
Creates a Virginia financial services holding company with over $3 billion in assets with strong growth profile
Commercial banking foundation
Strong core deposits
Significant Virginia market presence
#1 deposit market share in 3 of 7 MSAs, top five in 5 of 7
Top five deposit market share in 22 of 32 counties
Geographic diversification of loan portfolio and increased legal lending limit
Growing fee income businesses
Strong capital base
Pro Forma $450 Million Market Capitalization
Enhances strategic position in the merger market arena
Increased opportunity for growth through de novo branching and/or acquisitions
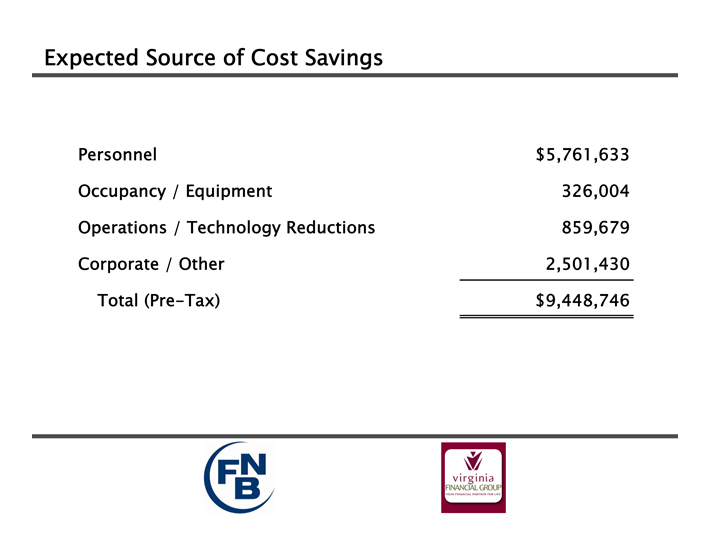
Expected Source of Cost Savings
Personnel $5,761,633
Occupancy / Equipment 326,004
Operations / Technology Reductions 859,679
Corporate / Other 2,501,430
Total (Pre-Tax) $9,448,746
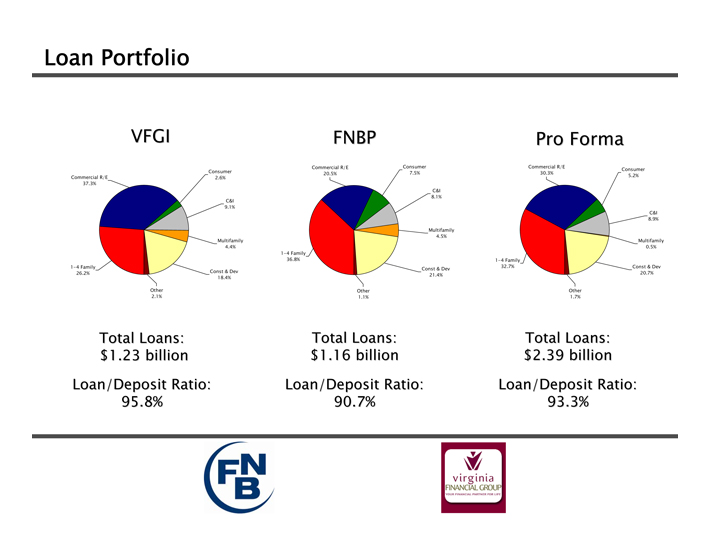
Loan Portfolio
VFGI FNBP
Pro Forma
Commercial R/E Consumer Commercial R/E
Consumer Consumer 20.5% 7.5% 30.3% Commercial R/E 2.6% 5.2% 37.3% C&I
8.1% C&I
9.1%
C&I 8.9% Multifamily 4.5% Multifamily Multifamily 4.4% 0.5% 1-4 Family 36.8% 1-4 Family 1-4 Family Const & Dev 32.7% Const & Dev 26.2% Const & Dev 20.7% 21.4% 18.4%
Other Other Other 2.1% 1.1% 1.7%
Total Loans: Total Loans: Total Loans: $1.23 billion $1.16 billion $2.39 billion Loan/Deposit Ratio: Loan/Deposit Ratio: Loan/Deposit Ratio: 95.8% 90.7% 93.3%
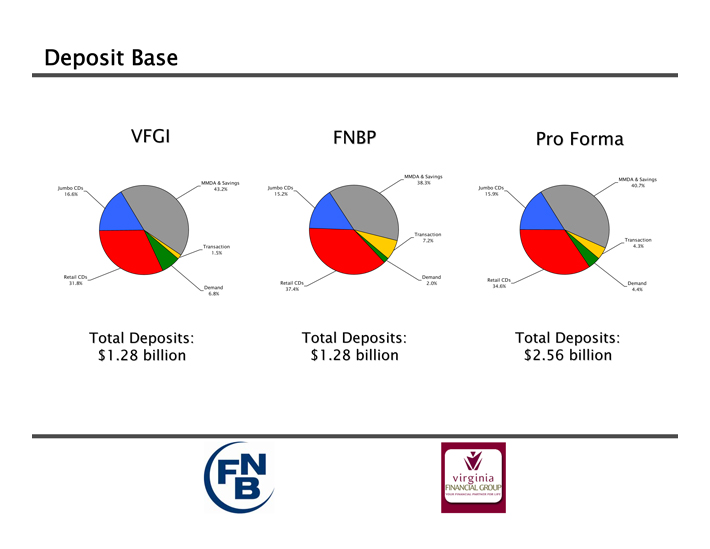
Deposit Base
VFGI FNBP
Pro Forma
MMDA & Savings
MMDA & Savings MMDA & Savings 38.3% Jumbo CDs Jumbo CDs Jumbo CDs 40.7% 43.2% 16.6% 15.2% 15.9%
Transaction
7.2% Transaction Transaction 4.3% 1.5%
Retail CDs Demand
Retail CDs
31.8% Retail CDs 2.0% Demand Demand 34.6% 37.4% 4.4% 6.8%
Total Deposits: Total Deposits: Total Deposits: $1.28 billion $1.28 billion $2.56 billion
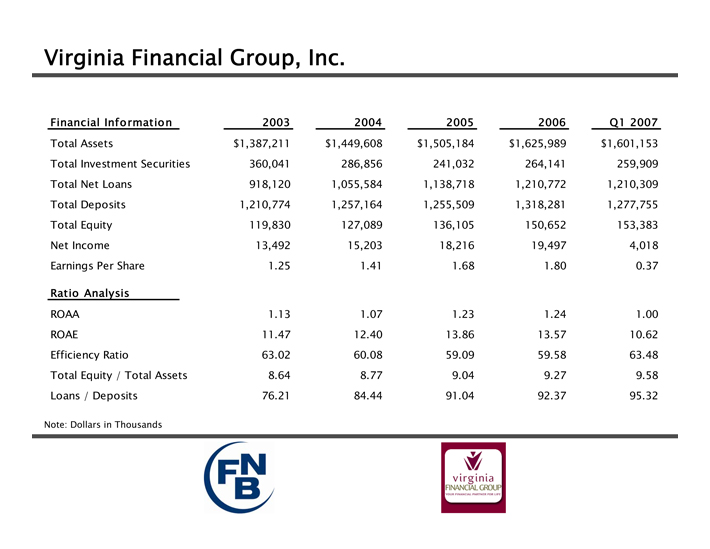
Virginia Financial Group, Inc.
Financial Information 2003 2004 2005 2006 Q1 2007 Total Assets $1,387,211 $1,449,608 $1,505,184 $1,625,989 $1,601,153 Total Investment Securities 360,041 286,856 241,032 264,141 259,909 Total Net Loans 918,120 1,055,584 1,138,718 1,210,772 1,210,309 Total Deposits 1,210,774 1,257,164 1,255,509 1,318,281 1,277,755 Total Equity 119,830 127,089 136,105 150,652 153,383 Net Income 13,492 15,203 18,216 19,497 4,018 Earnings Per Share
1.25 1.41 1.68 1.80 0.37
Ratio Analysis
ROAA 1.13 1.07 1.23 1.24 1.00 ROAE 11.47 12.40 13.86 13.57 10.62 Efficiency Ratio 63.02 60.08 59.09 59.58 63.48 Total Equity / Total Assets 8.64 8.77 9.04 9.27 9.58 Loans / Deposits 76.21 84.44 91.04 92.37 95.32
Note: Dollars in Thousands

FNB Corporation
Financial Information 2003 2004 2005 2006 Q1 2007 Total Assets $1,326,811 $1,396,116 $1,481,482 $1,518,715 $1,529,670 Total Investment Securities 193,237 156,732 171,340 189,479 195,253 Total Net Loans 994,108 1,101,210 1,157,102 1,174,642 1,145,911 Total Deposits 1,048,802 1,124,267 1,217,006 1,262,982 1,275,202 Total Equity 141,108 150,001 160,476 173,417 176,339 Net Income 12,932 14,247 17,533 17,912 4,027 Earnings Per Share 2.01 1.95 2.39 2.41 0.54
Ratio Analysis
ROAA 1.14 1.04 1.22 1.19 1.07 ROAE 11.26 9.82 11.35 10.81 9.20 Efficiency Ratio 58.85 56.49 54.89 56.81 58.95 Total Equity / Total Assets 10.64 10.74 10.83 11.42 11.53 Loans / Deposits 95.34 98.15 95.59 92.64 90.15
Note: Dollars in Thousands