 Excellence. Partnership. Service Creating a Virginia Banking Powerhouse Ed Barham, President and CEO Jeff Farrar, EVP and CFO July 29, 2009 Exhibit 99.1 |
 Excellence. Partnership. Service Forward Looking Statements • StellarOne Corporation (StellarOne) may from time to time make written or oral statements, including statements in this presentation which may constitute forward looking statements within the meaning of Section 27A of the Securities Act of 1933, as amended, and Section 21E of the Securities Exchange Act of 1934, as amended. The forward-looking statements are subject to certain risks and uncertainties, which could cause actual results to differ materially from historical results, or those anticipated. When we use words such as “believes”, “expects”, “anticipates” or similar expressions, we are making forward-looking statements. Readers are cautioned not to place undue reliance on these forward-looking statements, which reflect management’s analysis only as of the date thereof. StellarOne wishes to caution the reader that factors, such as those listed below, in some cases have affected and could affect StellarOne’s actual results, causing actual results to differ materially from those in any forward looking statement. These factors include: (i) continuation of the historically low short-term interest rates, (ii) a change in real estate or capital market conditions which could lead to asset quality deterioration or asset impairments including intangibles, (iii) the inability of StellarOne to grow its portfolio at historical growth rates, (iv) the impact of governmental restrictions on entities participating in the US Treasury Department Capital Purchase Program, and (v) mergers and acquisitions. Please refer to StellarOne’s filings with the Securities and Exchange Commission for additional information, which may be accessed at www.stellarone.com. |
 Excellence. Partnership. Service Agenda 1. Company Profile 2. Franchise and Capital 3. Loan Portfolio and Asset Quality 4. Core Earnings Analysis 5. Strategic Outlook and Concluding Remarks |
 Excellence. Partnership. Service Corporate Profile • $3.0 billion bank holding company headquartered in Charlottesville, VA. • Legacy bank established in 1900. • Fifty-nine financial centers • Commercial loan production office in Richmond, VA • Combination of eight legacy community banks with significant market share in their respective markets. |
 Excellence. Partnership. Service Franchise and Capital |
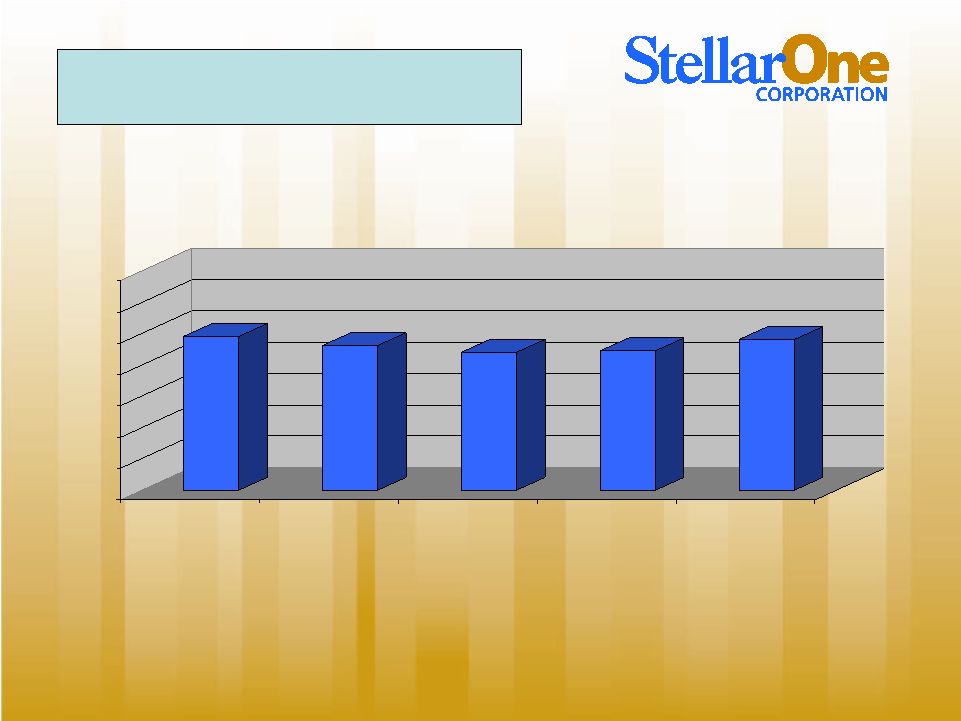
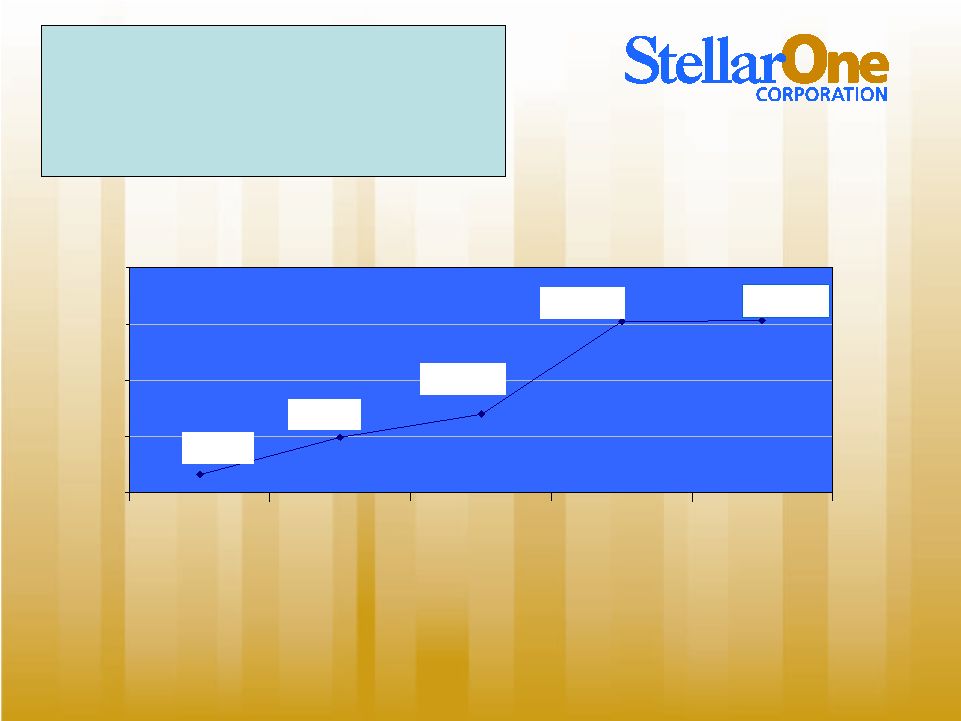 Excellence. Partnership. Service $3,050,000 $1,387,000 $985,000 $325,000 $3,057,000 $0 $1,000,000 $2,000,000 $3,000,000 $4,000,000 MOE with Virginia Heartland Bank - 1998 MOE with Virginia Financial Corp. - 2001 Purchase of Eight First VA Branches - 2003 MOE with FNB Corporation - 2008 Current Merger of Equals - Strategy for Growth (Dollars in thousands) |
 Excellence. Partnership. Service Strong Position In Strong Virginia Market - Banks 2008 Number of Branches 2008 Total Deposits in Market ($M) 2008 Total Market Share (%) Wells Fargo Bank 293 $25,888 13.35 BB&T Corp. (NC) Bank 392 19,752 10.19 Bank of America Corp. (NC) Bank 209 18,687 9.64 SunTrust Banks Inc. (GA) Bank 247 14,208 7.33 StellarOne Corp. (VA) Bank 64 2,427 1.25 Carter Bank & Trust (VA) Bank 89 2,270 1.17 Virginia Commerce (VA) Bank 27 2,100 1.08 Townebank (VA) Bank 18 1,991 1.03 United Bankshares Inc. (WV) Bank 43 1,889 .97 Union Bankshares Corp. (VA) Bank 58 1,792 .92 Total for Top Ten Banks 1,440 $91,004 46.93% |
 Excellence. Partnership. Service Deposit Franchise NOW - WAC of .93% MMDA - WAC of 1.55% Savings - WAC of .88% Time Deposits - WAC of 3.13% Non-interest bearing Total Deposits: Total Deposits: $2.45 $2.45 billion billion – – WAC WAC of 2.13% of 2.13% Note: Deposit composition as of June 30, 2009 |
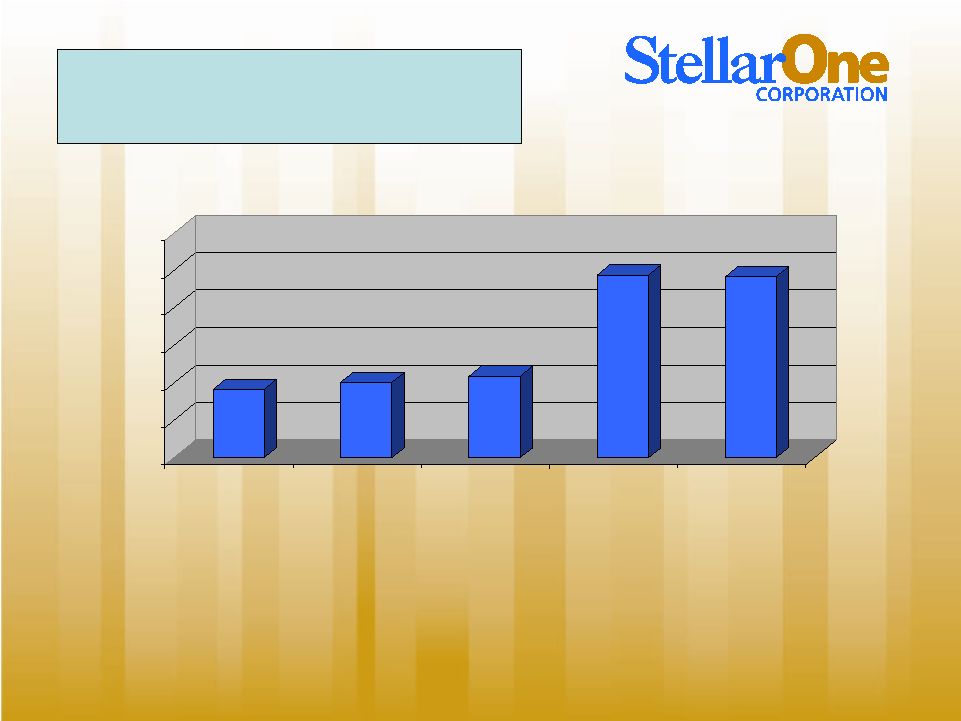 Excellence. Partnership. Service $136,105 $150,652 $162,768 $364,785 $361,482 $0 $75,000 $150,000 $225,000 $300,000 $375,000 $450,000 2005 2006 2007 2008 2Q 2009 Common Equity (Dollars in thousands) |
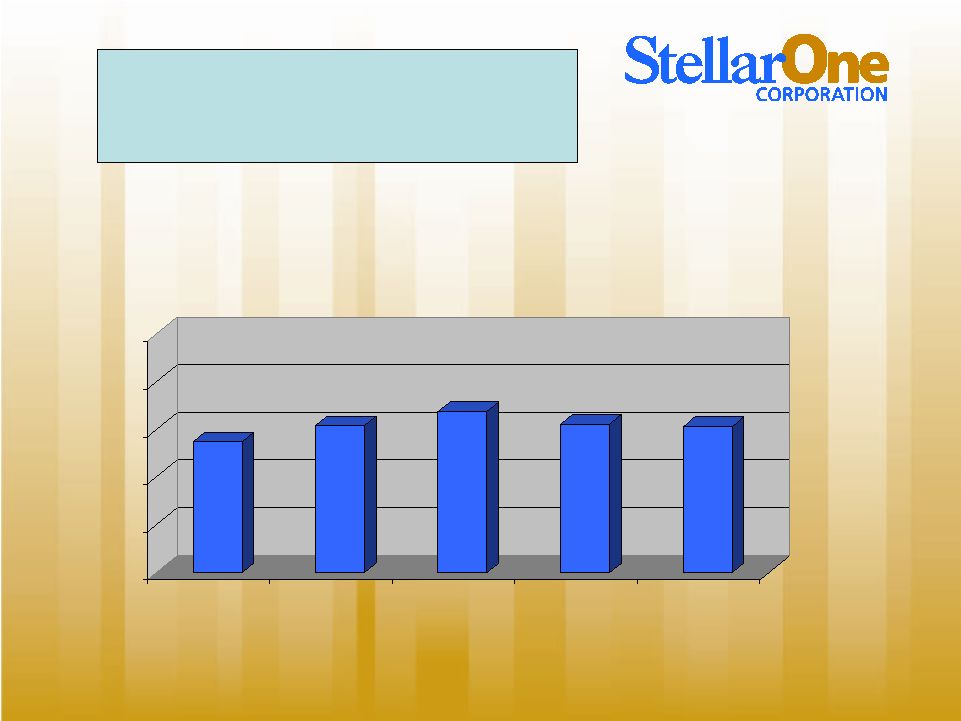 Excellence. Partnership. Service $10.95 $12.32 $13.49 $12.47 $12.24 $0.00 $4.00 $8.00 $12.00 $16.00 $20.00 2005 2006 2007 2008 2Q - 2009 Tangible Book Value per Common Share |
 Excellence. Partnership. Service Capital Ratios 2Q 2009 StellarOne 1Q 2009 Peer Median Tier 1 Risk-based Capital to Risk Adjusted Assets 13.47% 12.92% Tangible Equity to Tangible Assets 10.27% 8.34% Total Equity to Total Assets 13.09% 10.59% |
 Excellence. Partnership. Service Loan Portfolio and Asset Quality |
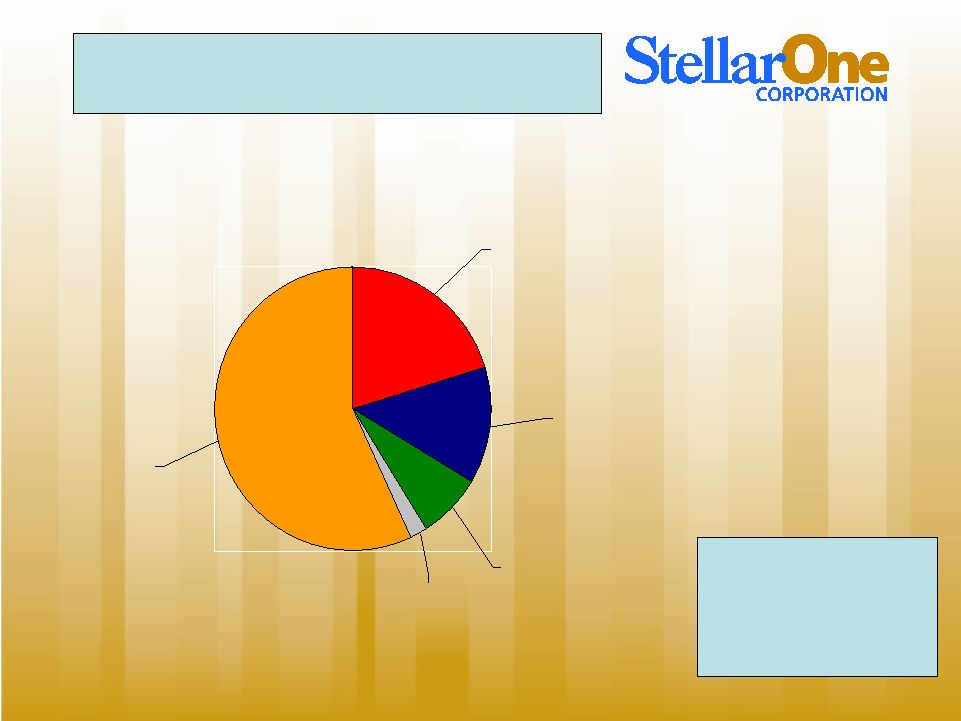
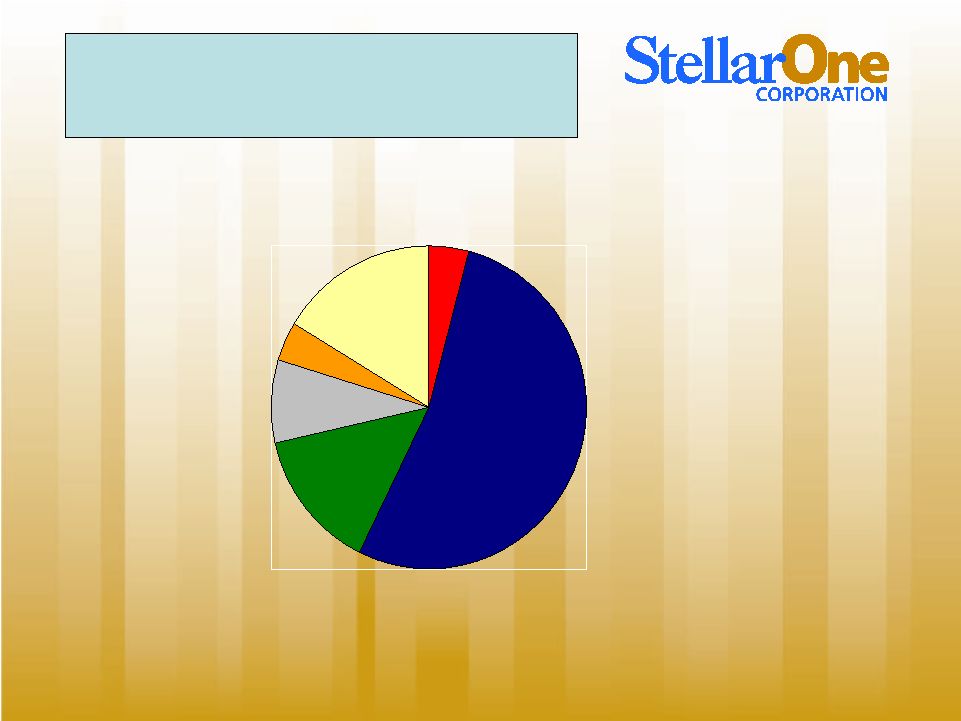
 Excellence. Partnership. Service Loan Diversification Commercial and Industrial 9.8% Commercial R/E 35.9% Consumer 2.1% Const. & Development 14.4% Other 0.8% 1-4 Family R/E 37.0% Gross Loans: Gross Loans: $2.21 billion $2.21 billion Loan/Deposit Ratio: Loan/Deposit Ratio: 91.5% 91.5% Note: Loan composition as of June 30, 2009 |
 Excellence. Partnership. Service 2006 2007 2008 2009 1 Qtr. 2009 2 Qtr. Non-Performing Assets / Total Assets 0.19% 0.44% 1.66% 2.38% 2.60% Net Charge-offs / Average Loans (0.01)% 0.12% 0.80% 0.51% 1.20% Allowance / Loans 1.19% 1.23% 1.35% 1.56% 1.56% Asset Quality st nd |
 Excellence. Partnership. Service Past Dues by Loan Type 1.56% 4.29% 1.02% 1.71% C&I .42% .09% 1.22% .81% Consumer .55% 13.13% STEL NPA’s & >90 days 2Q09 .98% 1.97% Peer 30-89 days past due * 1.64% 7.77% Peer NPA’s & >90 days past due * STEL 30-89 days past due 2Q09 Const. and Land Development 1.55% Commercial RE .54% (*) Uniform Bank Performance Report – 3/31/09 |
 Excellence. Partnership. Service Net Charge-Offs by Loan Type 1.02% .90% C&I 1.22% 1.50% Consumer .98% 1.97% Peer Group * STEL 2Q09 Const. and Land Development 1.70% Commercial RE .54% (*) Uniform Bank Performance Report – 3/31/09 |
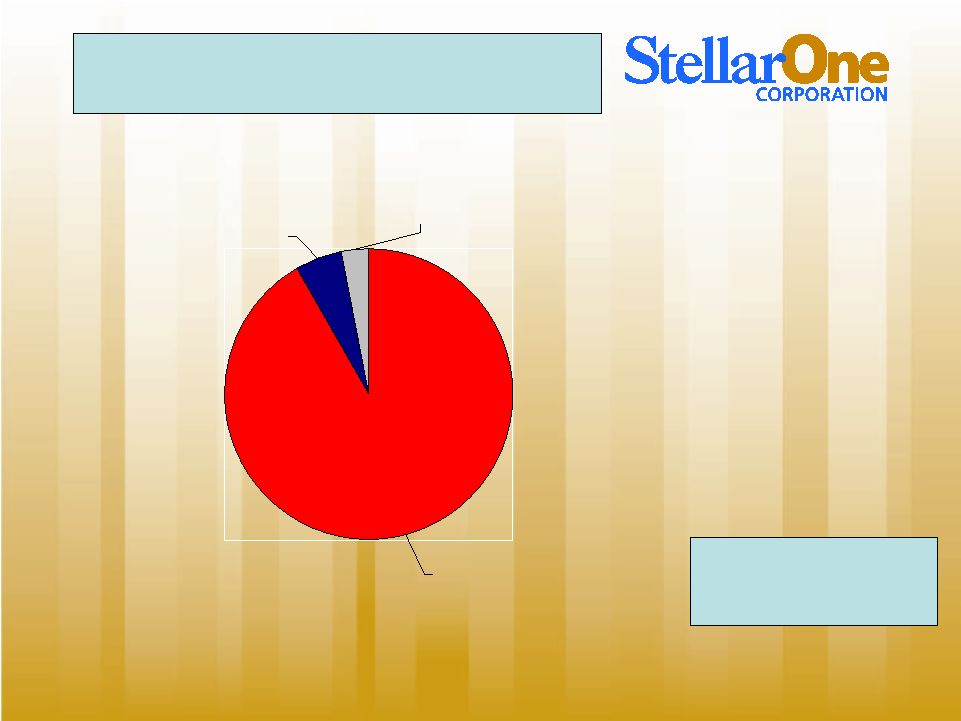
 Excellence. Partnership. Service Non-Performing Loans (dollars in thousands) Gross Non- performing Loans - $73.0 million or 3.26% of Gross Loans Receivable Commercial and Industrial, $9,839, 13.5% Commercial R/E, $5,463, 7.5% Consumer, $1,307 1.8% Const. & Development $41,597, 57% 1-4 Family R/E, $14,790, 20% Note: Nonaccrual loan composition as of June 30, 2009 |
 Excellence. Partnership. Service Non-Performing Loans – Acquisition and Development Component (dollars in thousands) Gross Non- Performing A&D Loans: $41.6 million Note: Nonaccrual A&D loan composition as of June 30, 2009 Acquisition & Development Non-Smith Mtn. Lake $16,410 Acquistion and Development Smith Mtn. Lake, $25,187 - - |
 Excellence. Partnership. Service Non-Performing Loans by Geographic Footprint (dollars in thousands) New River Valley, $2,129, 4% Smith Mtn. Lake, $26,972, 53% Central VA, $7,226, 14% Roanoke, $4,184, 8% Northern VA, $1,958, 4% Richmond, 8,404, 17% Note: Nonaccrual loan composition as of June 30, 2009 |
 Excellence. Partnership. Service Non-Performing Assets (dollars in thousands) OREO, $4,121 Loans Greater Thank 90 Days, $2,458 Nonaccrual loans, $72,995 NPA’s as a percentage of Loans and OREO – 3.55% Note: Data as of June 30, 2009 |
 Excellence. Partnership. Service Asset Quality Metrics • Largest NPL’s: – $14.2 million in loans to a SML developer (mixed use property, lots and single-family dwellings) – $6.5 million in loans to an aggregates contractor. – Two $5.5 million relationships with SML developers on separate projects consisting of residential developments with a commercial component. |
 Excellence. Partnership. Service Core Earnings Analysis |
 Excellence. Partnership. Service 2Q Highlights • Loss available to common shareholders of $785 thousand compared to earnings of $6.1 million in 2Q08 and a loss of $298 thousand for 1Q09. • EPS loss of $0.03 in 2Q09 compared to earnings of $.27 for 2Q08 and a loss of $.01 for 1Q09. • Provision levels down modestly from 4Q08 and 1Q09, and while absolute NPA’s were up, the rate of increase has leveled (11%). • Total past dues including non-performing loans down 15% sequentially. • Earnings substantially absorbed $1 million increase in FDIC insurance compared to 1Q09; and a $2 million increase when compared to 2Q08. • Average deposit growth for the quarter of $78.9 million, representing an annualized rate of 13.6%. Deposit growth year-to-date of $126.2 million. |
 Excellence. Partnership. Service $6,397 $8,743 $9,091 $7,304 $5,689 $0 $5,000 $10,000 $15,000 2Q - 2008 3Q - 2008 4Q - 2008 1Q - 2009 2Q - 2009 PPPT (Pre-provision, pre-tax) Earnings by Quarter (Dollars in thousands) |
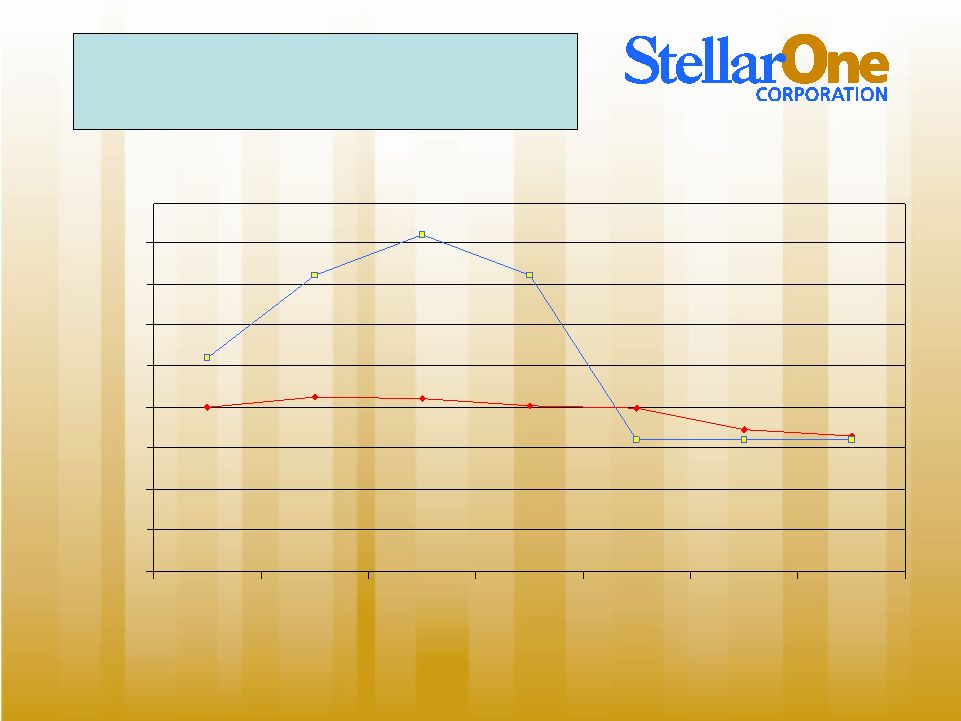 Excellence. Partnership. Service 3.50% 5.25% 7.25% 8.25% 7.25% 3.34% 4.04% 4.29% 4.25% 4.08% 4.03% 3.25% 3.25% 3.25% 0.05% 1.05% 2.05% 3.05% 4.05% 5.05% 6.05% 7.05% 8.05% 2004 2005 2006 2007 2008 1Q 2009 2Q 2009 Net Interest Margin Versus Prime Rate |
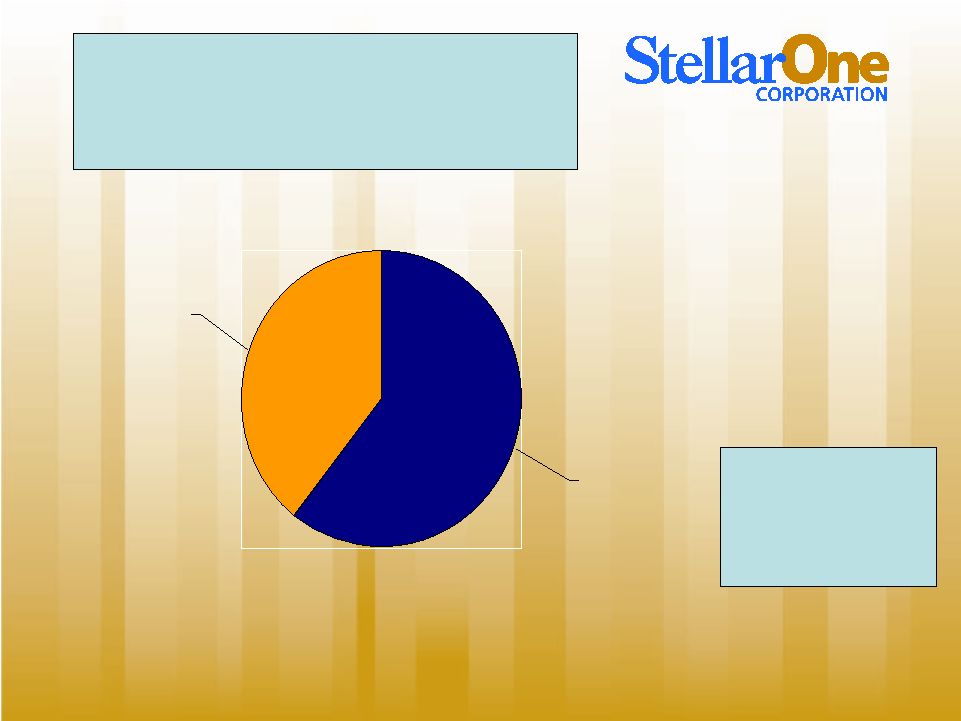
 Excellence. Partnership. Service Prime / Libor Index 37.1% Fixed 38.3% T-Bill Index 24.6% Loan Pricing Mix |
 Excellence. Partnership. Service Prime / Libor Index 3.93% Fixed 6.58% T-Bill Index 6.14% Loan Pricing Mix with Yields |
 Excellence. Partnership. Service $24,609 $23,159 $22,054 $22,225 $24,057 $0 $5,000 $10,000 $15,000 $20,000 $25,000 $30,000 $35,000 2Q - 2008 3Q - 2008 4Q - 2008 1Q - 2009 2Q - 2009 Overhead by Quarter (Dollars in thousands) |
 Excellence. Partnership. Service Strategic Outlook and Concluding Remarks |
 Excellence. Partnership. Service • Reduce NPA’s as soon as practical. • Repay TARP once comfort level with asset quality and economy warrants. • Continue initiatives to reduce overhead structure. • Accelerate growth in non-interest revenues. • Initiate acquisition strategy in higher growth markets. Strategic Outlook |
 Excellence. Partnership. Service Final Considerations • Reliable track record for merger integration and growth. • Highly liquid and well-capitalized balance sheet with minimal intangibles when compared to peer. • Franchise sits in most stable portion of a good Virginia market. • Opportunity for growth in Richmond and Tidewater are compelling. |
 Excellence. Partnership. Service July 29, 2009 Keefe, Bruyette & Woods Community Bank Investor Conference |