 Excellence. Partnership. Service Investor Presentation First Quarter 2010 Ed Barham, President and Chief Executive Officer Jeff Farrar, Executive Vice President and Chief Financial Officer EXHIBIT 99.1 |
 Excellence. Partnership. Service Forward-Looking Statements • StellarOne Corporation (StellarOne) may from time to time make written or oral statements, including statements in this presentation which may constitute forward- looking statements within the meaning of Section 27A of the Securities Act of 1933, as amended, and Section 21E of the Securities Exchange Act of 1934, as amended. The forward-looking statements are subject to certain risks and uncertainties, which could cause actual results to differ materially from historical results, or those anticipated. When we use words such as “believes”, “expects”, “anticipates” or similar expressions, we are making forward-looking statements. Readers are cautioned not to place undue reliance on these forward-looking statements, which reflect management’s analysis only as of the date thereof. StellarOne wishes to caution the reader that factors, such as those listed below, in some cases have affected and could affect StellarOne’s actual results, causing actual results to differ materially from those in any forward-looking statement. These factors include: (i) continuation of the historically low short-term interest rates, (ii) a change in real estate or capital market conditions which could lead to asset quality deterioration or asset impairments including intangibles, (iii) the inability of StellarOne to grow its portfolio at historical growth rates, (iv) the impact of governmental restrictions on entities participating in the US Treasury Department Capital Purchase Program, and (v) mergers and acquisitions. Please refer to StellarOne’s filings with the Securities and Exchange Commission for additional information, which may be accessed at www.stellarone.com. |
 Excellence. Partnership. Service Corporate Profile • $3.0 billion bank holding company headquartered in Charlottesville, Virginia. • Legacy bank established in 1900. • Fifty-five financial centers. • Commercial and mortgage loan production office in Richmond, Virginia. • Combination of eight legacy community banks with significant market share in their respective markets. |
 Excellence. Partnership. Service Strong Position In Strong Virginia Market 2009 Total Market Share (%) 2009 Total Deposits in Market ($M) 2009 Number of Branches Source: SNL Financial 16.73% $25,666 292 Bank Wells Fargo (CA) 13.32% 20,427 91 Bank Capital One Financial (VA) 13.05% 20,014 392 Bank BB&T Corp. (NC) 12.10% 18,554 207 Bank Bank of America Corp. (NC) 9.88% 15,162 247 Bank SunTrust Banks Inc. (GA) 2.13% 3,263 95 Bank Union First Market Corp. (VA) 1.70% 2,605 18 Bank Townebank (VA) 1.61% 2,464 89 Bank Carter Bank & Trust (VA) 1.60% 2,447 56 Bank StellarOne Corporation (VA) 1.43% 2,191 28 Bank Virginia Commerce (VA) |
 Excellence. Partnership. Service Deposit Franchise Total Deposits: Total Deposits: $2.41 billion $2.41 billion Note: Deposit composition as of March 31, 2010 NOW – 23% MMDA – 17% Savings – 9% Time Deposits – 39% Non-interest bearing – 12% |
 Excellence. Partnership. Service $3,050,000 $1,387,000 $985,000 $325,000 $3,003,000 $0 $1,000,000 $2,000,000 $3,000,000 $4,000,000 1998 MOE with Virginia Heartland Bank 2001 MOE with Virginia Financial Corporation 2003 Purchase of Eight First VA Branches 2008 MOE with FNB Corporation Current Merger of Equals - Strategy for Growth (Dollars in thousands) |
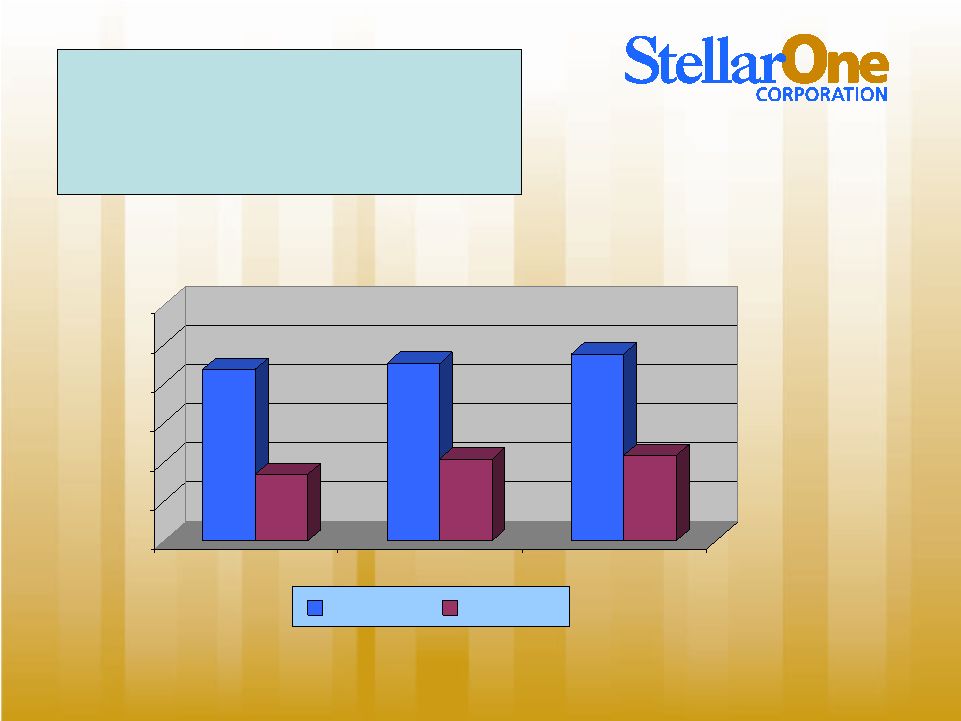 Excellence. Partnership. Service $437,134 $170,175 $452,616 $209,075 $476,509 $218,501 $0 $100,000 $200,000 $300,000 $400,000 $500,000 $600,000 2008 2009 1Q 2010 Fiduciary Brokerage Wealth Management (AUM) (Dollars in thousands) |
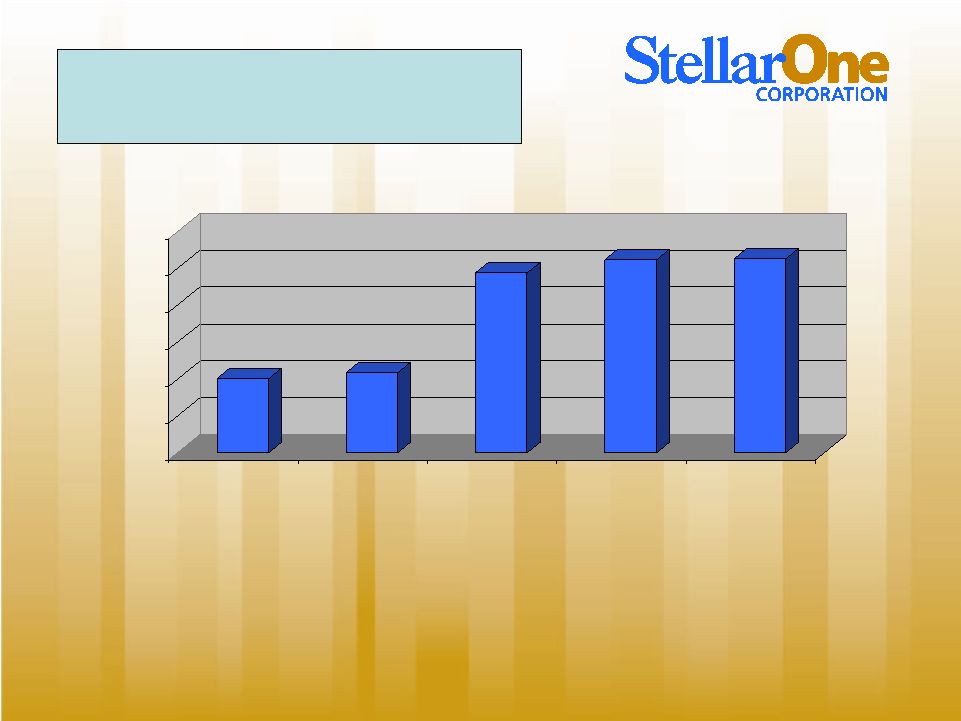 Excellence. Partnership. Service $150,652 $162,768 $364,785 $392,387 $394,006 $0 $75,000 $150,000 $225,000 $300,000 $375,000 $450,000 2006 2007 2008 2009 1Q 2010 Common Equity (Dollars in thousands) |
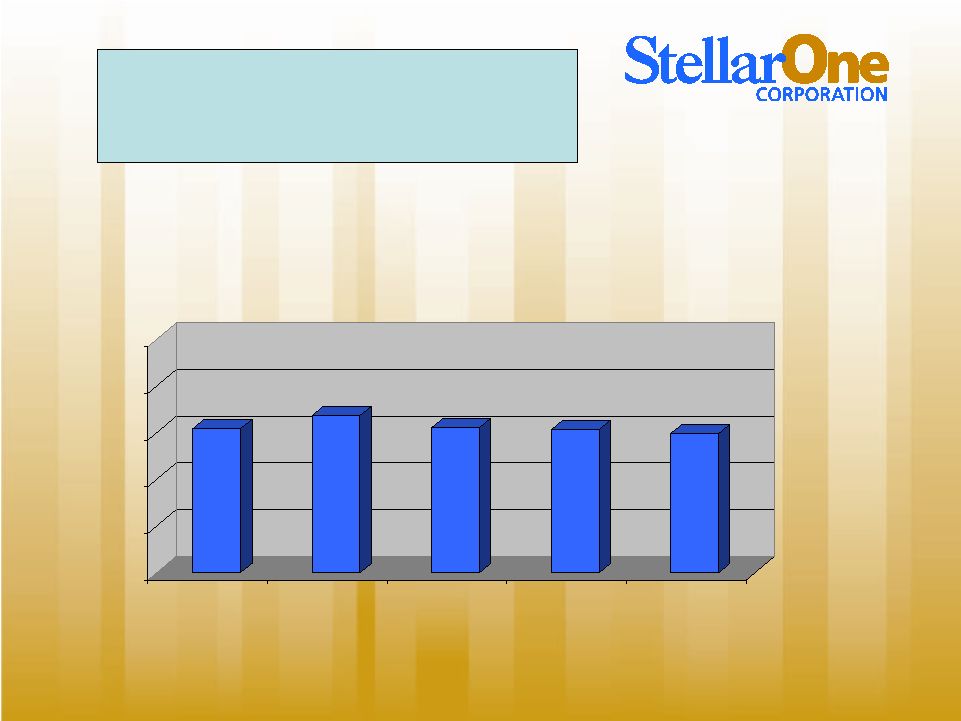 Excellence. Partnership. Service $12.32 $13.49 $12.47 $12.30 $11.94 $0.00 $4.00 $8.00 $12.00 $16.00 $20.00 2006 2007 2008 2009 1Q - 2010 Tangible Book Value per Common Share |
 Excellence. Partnership. Service Capital Ratios StellarOne Peer Median Tier 1 Risk-based Capital to Risk Adjusted Assets 13.67% 13.21% Tangible Equity to Tangible Assets 10.45% 8.31% Total Equity to Total Assets 14.07% 10.40% |
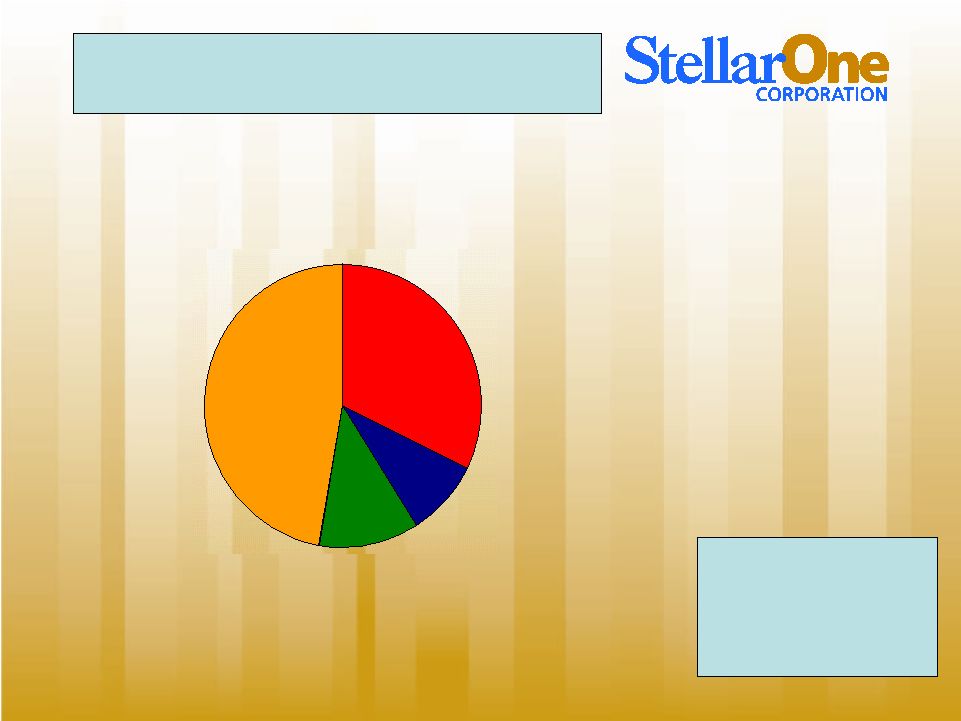
 Excellence. Partnership. Service Loan Diversification Commercial and Industrial 10% Commercial R/E 39% Consumer 2% Const. & Development 13% 1-4 Family R/E 36% Gross Loans: Gross Loans: $2.16 billion $2.16 billion Loan/Deposit Ratio: Loan/Deposit Ratio: 89.7% 89.7% Note: Loan composition as of March 31, 2010 |
 Excellence. Partnership. Service 2006 2007 2008 2009 2010 1st Qtr. Non-Performing Assets / Total Assets 0.19% 0.44% 1.66% 2.18% 2.07% Net Charge-offs / Average Loans (0.01)% 0.12% 0.80% 1.24% 1.13% Allowance / Loans 1.19% 1.23% 1.35% 1.84% 1.88% Asset Quality |
 Excellence. Partnership. Service Gross Gross Non Non – – Performing Performing Loans Loans - - $59.2 $59.2 million million or or 2.74% 2.74% of of Gross Gross Loans Loans Receivable Receivable Non-Performing Loans (dollars in thousands) Note: Nonaccrual loan composition as of March 31, 2010 Commercial and Industrial $5,263, 9% Commercial R/E, $6,857 12% Const & Development $27,864, 47% 1-4 Family R/E, $19,044 32% |
 Excellence. Partnership. Service Non-Performing Loans – Acquisition and Development Component (dollars in thousands) Nonperforming Acquistion and Development (SML) - $16.2 million Nonperforming Acquisition & Development (Exclusive of SML) - $11.7 million Gross Gross Non Non – – Performing Performing A&D A&D Loans: Loans: $27.9 million $27.9 million Note: Nonaccrual A&D loan composition as of March 31, 2010 |
 Excellence. Partnership. Service Non-Performing Assets (dollars in thousands) OREO, $2,267 LHFS, $608 TDR's, $1,810 Nonaccrual loans, $57,343 NPA’s as a Percentage of Loans and OREO – 2.87% Note: Data as of March 31, 2010 |
 Excellence. Partnership. Service Asset Quality Metrics • Largest NPL’s: – $10.1 million in loans to a SML developer (mixed use property, lots and single-family dwellings). – $10.2 million residential A&D construction relationship on a highly attractive and established project (non-SML) which will likely move to OREO in 2 nd Quarter. |
 Excellence. Partnership. Service 1 st Quarter Highlights • Earnings improvement that exceeded consensus estimate. • Significant improvement in PTPP earnings. • Decrease in total non-performing assets for the second consecutive quarter. • Continued improvement in net interest margin for second consecutive quarter. • Improved contributions from mortgage and wealth management units. |
 Excellence. Partnership. Service $5,689 $5,112 $3,572 $8,766 $0 $5,000 $10,000 $15,000 2Q - 2009 3Q - 2009 4Q - 2009 1Q - 2010 PPPT (Pre-provision, pre-tax) Earnings by Quarter (Dollars in thousands) |
 Excellence. Partnership. Service 3.25% 3.25% 3.25% 3.25% 3.52% 3.45% 3.30% 3.34% 3.50% 3.25% 2.50% 3.00% 3.50% 4.00% 4.50% 5.00% 1Q 2009 2Q 2009 3Q 2009 4Q 2009 1Q 2010 Net Interest Margin Versus Prime Rate |
 Excellence. Partnership. Service Overhead by Quarter (Dollars in thousands) $22,224 $24,057 $22,748 $24,875 $22,547 $0 $5,000 $10,000 $15,000 $20,000 $25,000 $30,000 $35,000 1Q - 2009 2Q - 2009 3Q - 2009 4Q - 2009 1Q -2010 |
 Excellence. Partnership. Service • Offense vs. defense on lending front. • Reduce NPA’s as soon as practical. • Continue initiatives to leverage overhead structure. • Accelerate growth in non-interest revenues. • Repay TARP as soon as practical. • Initiate acquisition strategy in higher growth markets. Strategic Outlook |
 Excellence. Partnership. Service Final Considerations • Reliable track record for merger integration and growth. • Highly liquid and well-capitalized balance sheet with minimal intangibles when compared to peer. • Franchise sits in most stable portion of a good Virginia market. • Opportunity for growth in Richmond and Tidewater are compelling. |
 Excellence. Partnership. Service Investor Presentation First Quarter 2010 Thank you! |