 Investor Presentation June 10, 2013 The Next Great Virginia Bank The Next Great Virginia Bank Exhibit 99.2 |
 Forward-Looking Statement 2 Statements made in this presentation, other than those concerning historical financial information, may be considered forward-looking statements, which speak only as of the date of this presentation and are based on current expectations and involve a number of assumptions. These include statements as to the anticipated benefits of the merger, including future financial and operating results, cost savings and enhanced revenues that may be realized from the merger as well as other statements of expectations regarding the merger and any other statements regarding future results or expectations. Each of Union and StellarOne intends such forward-looking statements to be covered by the safe harbor provisions for forward- looking statements contained in the Private Securities Litigation Reform Act of 1995 and is including this statement for purposes of these safe harbor provisions. The companies’ respective abilities to predict results, or the actual effect of future plans or strategies, is inherently uncertain. Factors which could have a material effect on the operations and future prospects of each of Union and StellarOne and the resulting company, include but are not limited to: (1) the businesses of Union and/or StellarOne may not be integrated successfully or such integration may be more difficult, time-consuming or costly than expected; (2) expected revenue synergies and cost savings from the merger may not be fully realized or realized within the expected time frame; (3) revenues following the merger may be lower than expected; (4) customer and employee relationships and business operations may be disrupted by the merger; (5) the ability to obtain required regulatory and stockholder approvals, and the ability to complete the merger on the expected timeframe may be more difficult, time-consuming or costly than expected; (6) changes in interest rates, general economic conditions, legislative/regulatory changes, monetary and fiscal policies of the U.S. government, including policies of the U.S. Treasury and the Board of Governors of the Federal Reserve; the quality and composition of the loan and securities portfolios; demand for loan products; deposit flows; competition; demand for financial services in the companies’ respective market areas; their implementation of new technologies; their ability to develop and maintain secure and reliable electronic systems; and accounting principles, policies, and guidelines, and (7) other risk factors detailed from time to time in filings made by Union or StellarOne with the SEC. Union and StellarOne undertake no obligation to update or clarify these forward-looking statements, whether as a result of new information, future events or otherwise. |
 Creates the dominant community bank in Virginia Scale overshadows in-state competitors Expands presence to include all major Virginia markets Broadens and deepens competitive strengths Transaction Rationale 3 Results in top tier financial performance post integration Double-digit EPS accretion with manageable tangible book value dilution Accretive to capitalization Positioned to deploy excess capital post closing Exceeds internal rate of return thresholds Acquisition Highlights Strategic Merit Financially Attractive |
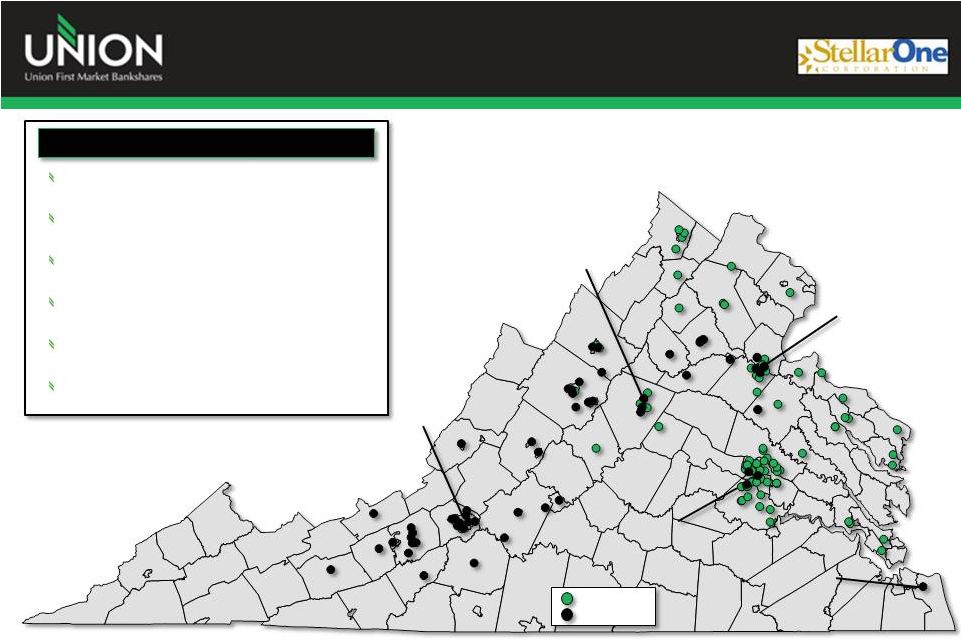 The Next Great Virginia Bank 4 Pro Forma Highlights (1) UBSH (90) STEL (56) Roanoke Roanoke Charlottesville Charlottesville Richmond Richmond Virginia Beach Virginia Beach Source: SNL Financial and MapInfo Professional (1) Assumes transaction was consummated on 3/31/2013 (2) Estimated at close Branches FTEs Assets Loans Deposits TCE / TA Ratio (2) 146 1,766 $7.1 Billion $5.2 Billion $5.8 Billion ~ 9.3% Fredericksburg Fredericksburg |
 Rank Institution (ST) Number of Branches Deposits in Market ($mm) Market Share (%) 1 Wells Fargo & Co. (CA) 295 29,350 17.4 2 Bank of America Corp. (NC) 177 22,233 13.2 3 BB&T Corp. (NC) 379 21,452 12.7 4 Capital One Financial Corp. (VA) 86 18,540 11.0 5 SunTrust Banks Inc. (GA) 239 17,168 10.2 Pro Forma - Union First Market Bkshs Corp. (VA) 146 5,702 3.4 6 United Bankshares Inc. (WV) 68 4,176 2.5 7 Carter Bank & Trust (VA) 88 3,502 2.1 8 Union First Market Bkshs Corp. (VA) 90 3,227 1.9 9 TowneBank (VA) 21 3,096 1.8 10 PNC Financial Services Group (PA) 101 2,829 1.7 11 StellarOne Corp. (VA) 56 2,475 1.5 12 Burke & Herbert Bank & Trust (VA) 25 2,077 1.2 13 Cardinal Financial Corp. (VA) 25 1,893 1.1 14 Citigroup Inc. (NY) 12 1,763 1.0 15 First Citizens BancShares Inc. (NC) 47 1,249 0.7 Totals (1-10) 1,544 125,572 74.3 Totals (1-136) 2,616 169,012 100.0 Growing Market Share 5 Virginia Deposit Market Share Source: SNL Financial Deposit data as of 6/30/2012; pro forma for pending transactions |
 Competitive Positioning 6 Richmond Charlottesville Source: SNL Financial and U.S. Census Bureau; Deposit data as of 6/30/2012 Note: Small businesses have less than 100 employees Staunton / Harrisonburg Population: Households: Small Businesses: Market Deposits ($mm): UBSH Branches: Deposits ($mm): Pro Forma 42 4 46 $1,551 $44 $1,595 1,285,296 498,695 29,814 $73,641 STEL Population: Households: Small Businesses: Market Deposits ($mm): UBSH Branches: Deposits ($mm): Pro Forma 7 3 10 $330 $89 $419 205,406 80,055 5,449 $3,610 STEL Population: Households: Small Businesses: Market Deposits ($mm): UBSH Branches: Deposits ($mm): Pro Forma 4 10 14 $51 $437 $488 246,985 94,146 5,583 $3,368 STEL Market Rank: 5 27 5 Market Rank: 6 8 5 Roanoke Population: Households: Small Businesses: Market Deposits ($mm): UBSH Branches: Deposits ($mm): Pro Forma 1 10 11 $16 $339 $355 311,468 129,484 7,864 $7,148 STEL Market Rank: 15 6 6 Blacksburg Population: Households: Small Businesses: Market Deposits ($mm): UBSH Branches: Deposits ($mm): Pro Forma - 9 9 - $696 $696 165,000 64,572 3,135 $2,665 STEL Market Rank: - 1 1 Market Rank: 14 2 2 Fredericksburg Population: Households: Small Businesses: Market Deposits ($mm): UBSH Branches: Deposits ($mm): Pro Forma 14 5 19 $664 $156 $820 332,897 114,196 6,326 $3,449 STEL Market Rank: 3 10 2 |
 Pro Forma Branch Franchise 7 Source: SNL Financial and MapInfo Professional (1) Represents the number of STEL branches within a given radius of a UBSH branch; Shown as a percent of STEL total branches Richmond Rank: #5 Deposits: $1.6 bn Market Tot.: $73.6 bn Mkt. Share: 5.3% Blacksburg Rank: #1 Deposits: $696 mm Market Tot.: $2.7 bn Mkt. Share: 26.1% Staunton / Harrisonburg Rank: #2 Deposits: $488 mm Market Tot.: $3.4 bn Mkt. Share: 14.4% Culpeper Rank: #1 Deposits: $202 mm Market Tot.: $0.6 bn Mkt. Share: 33.5% MSA Market Share Rank Company Deposits Total Market Deposits Market Share Roanoke Deposits: $355 mm Market Tot.: $7.2 bn Mkt. Share: 4.9% Rank: #6 Charlottesville Rank: #5 Deposits: $419 mm Market Tot.: $3.6 bn Mkt. Share: 11.6% VA VA Fredericksburg Rank: #2 Deposits: $820mm Market Tot.: $3.4 bn Mkt. Share: 23.7% UBSH Counties STEL Counties Overlapping Counties UBSH (90) STEL (56) Branch Overlap (1) Distance Branches % of Franchise < 1/2 mi: 8 14.3% < 1 mi: 13 23.2% < 2 mi: 19 33.9% < 5 mi: 26 46.4% |
 Transaction Terms 8 Transaction: Union First Market Bankshares Corporation acquisition of StellarOne Corporation Fixed Exchange Ratio: 0.9739x shares of UBSH common stock for each share of STEL Consideration: 100% stock Transaction Value (1) : $19.50 per share or $445.1 million Ownership Split: 52.9% UBSH / 47.1% STEL Name: Union First Market Bankshares Corporation Named Executives: Chief Executive Officer: President of the Bank: Chief Financial Officer: Chief Banking Officer: Chief Retail Officer: G. William Beale (UBSH) John Neal (UBSH) Robert Gorman (UBSH) D. Anthony Peay (UBSH) Elizabeth Bentley (UBSH) Board Composition: (11) UBSH / (8) STEL Chairman: Vice Chairman: Raymond Smoot Jr. (STEL) Ronald Hicks (UBSH) Capital: Excess capital generated in the transaction will be used to repurchase shares post closing of the acquisition Required Approval: Customary regulatory and shareholder approvals of both UBSH and STEL shareholders Expected Close: Q4 2013 / Q1 2014 (1) Based on UBSH closing price of $20.02 as of 6/7/2013 |
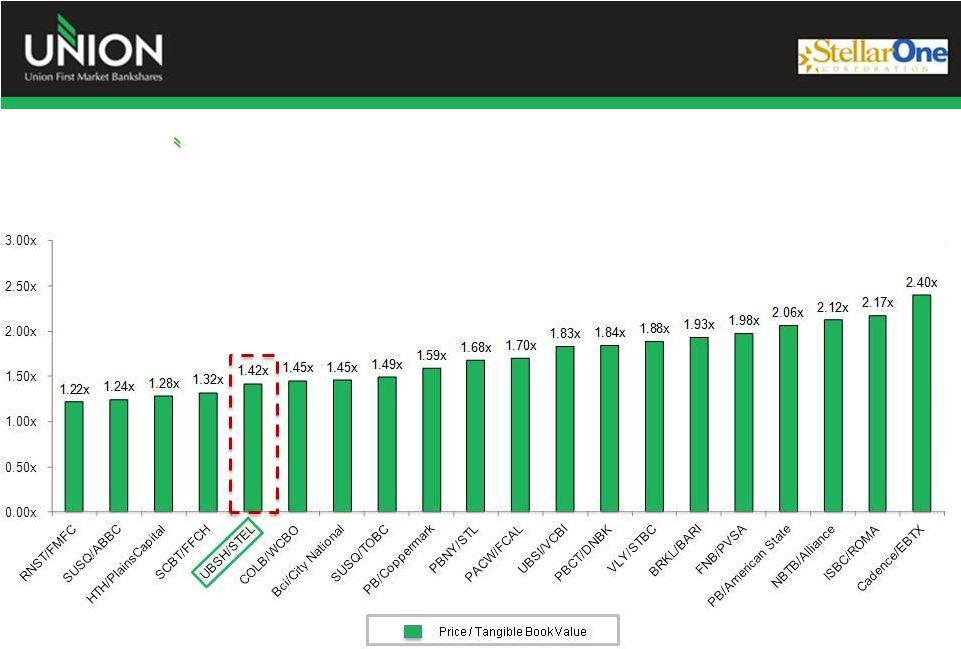 Transaction Pricing Comparison 9 Source: SNL Financial; Based on STEL’s tangible book value per share of $13.76 Recent nationwide bank & thrift transactions with deal values between $150 million and $1 billion since 1/1/2011 |
 Due Diligence 10 Comprehensive 4 week due diligence process Face-to-face interview sessions for all lines of business 3 rd party resources Loan review Legal & Tax Reviewed individual loan files for $842 million or 61% of outstanding commercial loans Examined an additional $156 million of unfunded commitments Sample included 61% of Bank-rated special mention and substandard loans totaling $134 million or 10% of the commercial portfolio Reviewed residential, consumer and OREO on a portfolio level Modeled a credit mark of $53.5 million or 2.5% of the loan and OREO portfolio Due Diligence Highlights Credit Due Diligence |
 Financial Impact 11 Impact Assumptions Net expense savings of 32% (2) , or $28 million pre-tax 65% phased in by 2014 100% thereafter No revenue enhancements were modeled Share repurchases planned for 2014 and 2015 with excess capital One time merger related expenses of approximately $19.5 million after-tax No significant data processing termination charge (1) Estimated at closing (2) Net expense savings contemplates the potential for lost revenue in specific areas EPS Book Value Capital (1) IRR Double digit accretion to earnings per share with fully phased in expense savings Single digit tangible book value per share dilution Accretive in approximately 5 years Approximately 25 bps accretive to tangible common equity / tangible assets Total risk-based capital in excess of 14.0% Internal rate of return > 20% |
 Creates the dominant community bank in Virginia Enhances competitive position in major markets Accretive to EPS Generates excess capital Strong IRR Summary 12 The Next Great Virginia Bank |
 APPENDIX |
 Union First Market Bankshares Overview Source: SNL Financial; Market data as of 6/7/2013 (1) First Call Consensus estimates (2) Core income excludes extraordinary items, non-recurring items and gains/losses on sale of securities Market Valuation Net Charge-Offs / Average Loans 0.05% 0.21% 0.69% 0.58% 0.55% 0.56% 0.33% 0.00% 0.50% 1.00% 1.50% 2007 2008 2009 2010 2011 2012 Q1 2013 Headquarters: Richmond, Virginia Ticker: UBSH Established: 1902 Branches: 90 Chief Executive Officer: G. William Beale Chief Financial Officer: Robert Gorman 14 Price (6/7/13): Market Cap. ($mm): Price / Book: Price / Tang. Book: Price / 2014 EPS: (1) Dividend Yield: Financial Highlights (Dollars in thousands) Years Ended, December 31, Quarter Ended 2010 2011 2012 3/31/2013 Balance Sheet Items Total Assets $3,837,247 $3,907,087 $4,095,865 $4,051,135 Total Net Loans 2,872,821 2,853,936 3,099,629 3,066,238 Deposits 3,070,059 3,175,105 3,297,767 3,311,749 Equity 428,085 421,639 435,863 430,773 Tangible Common Equity 308,440 341,092 360,652 356,631 Profitability Net Income to Common $21,008 $27,769 $35,411 $8,983 Core ROAA (2) 0.91 % 0.91 % 0.98 % 0.95 % Core ROAE (2) 8.2 7.9 9.0 8.9 Net Interest Margin 4.56 4.57 4.34 4.23 Efficiency Ratio 59.3 63.0 63.5 67.0 Fee Income / Op. Rev. 18.4 17.5 20.9 20.7 Balance Sheet Ratios TCE / TA 8.22 % 8.91 % 8.97 % 8.97 % Total Capital Ratio 14.68 14.51 14.57 14.44 Asset Quality NPLs / Loans 2.57 % 4.97 % 2.48 % 2.12 % NPAs / Loans + OREO 3.76 6.01 3.49 3.24 LLR / Loans 1.32 1.36 1.11 1.11 $20.02 $497.7 1.16x 1.40x 12.8x 2.6% |
 StellarOne Corporation Overview Source: SNL Financial; Market data as of 6/7/2013 (1) First Call Consensus estimates (2) Core income excludes extraordinary items, non-recurring items and gains/losses on sale of securities Market Valuation Net Charge-Offs / Average Loans 0.12% 0.80% 1.24% 1.17% 0.86% 0.40% 0.28% 0.00% 0.50% 1.00% 1.50% 2007 2008 2009 2010 2011 2012 Q1 2013 Headquarters: Charlottesville, Virginia Ticker: STEL Established: 1900 Branches: 56 Chief Executive Officer: O.R. Barham Jr. Chief Financial Officer: Jeffrey Farrar 15 Price (6/7/13): Market Cap. ($mm): Price / Book: Price / Tang. Book: Price / 2014 EPS: (1) Dividend Yield: Financial Highlights (Dollars in thousands) Years Ended, December 31, Quarter Ended 2010 2011 2012 3/31/2013 Balance Sheet Items Total Assets $2,940,442 $2,917,928 $3,023,204 $3,013,889 Total Net Loans 2,114,071 2,041,082 2,087,547 2,142,477 Deposits 2,386,102 2,395,600 2,484,324 2,476,005 Equity 426,437 414,173 431,642 428,753 Tangible Common Equity 277,360 294,327 313,741 310,479 Profitability Net Income to Common $7,900 $13,430 $22,163 $5,911 Core ROAA (2) 0.32 % 0.57 % 0.77 % 0.84 % Core ROAE (2) 2.3 3.9 5.4 5.9 Net Interest Margin 3.65 3.80 3.80 3.73 Efficiency Ratio 70.8 70.4 68.3 68.2 Fee Income / Op. Rev. 25.7 25.0 24.0 23.8 Balance Sheet Ratios TCE / TA 9.84 % 10.52 % 10.80 % 10.72 % Total Capital Ratio 15.44 16.42 16.86 16.47 Asset Quality NPLs / Loans 3.87 % 3.36 % 2.79 % 2.42 % NPAs / Loans + OREO 4.35 3.76 3.06 2.71 LLR / Loans 1.75 1.57 1.41 1.34 $16.21 $365.9 0.85x 1.18x 14.8x 2.5% |
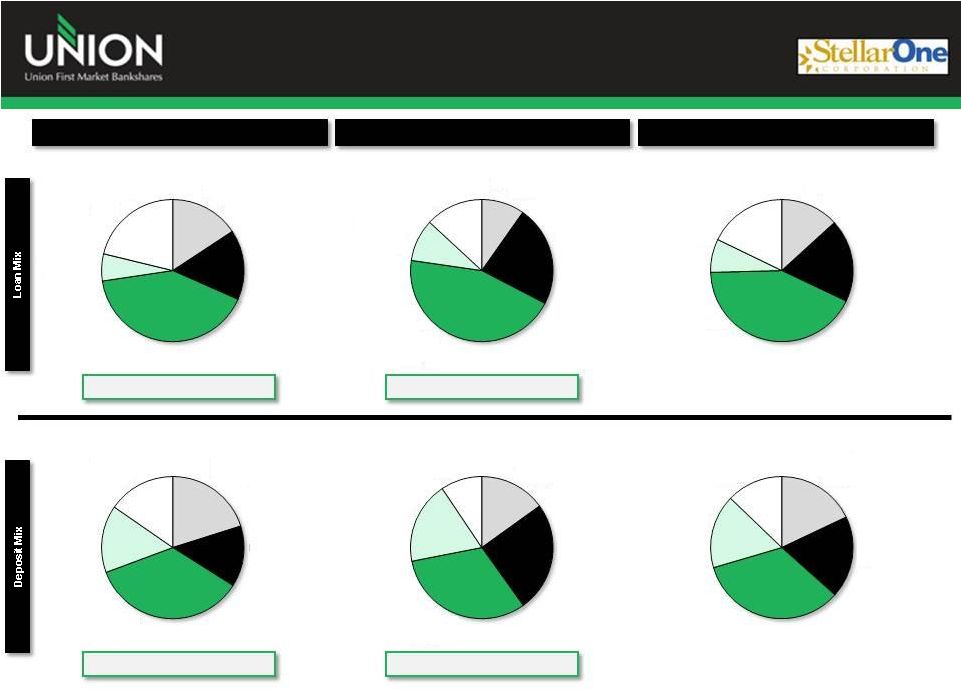 Loan and Deposit Composition 16 Cost of Total Deposits: 0.48% Cost of Total Deposits: 0.51% Union First Market Bankshares Corporation StellarOne Corporation Pro Forma Total: Total: Total: Yield on Loans: 5.05% Yield on Loans: 4.82% Total: Total: Total: $2,974mm $2,141mm $5,115mm $3,312mm $2,476mm $5,788mm Source: SNL Financial UBSH loan and deposit data as of 3/31/2013 per SEC filings STEL loan and deposit data as of 3/31/2013 per SEC filings Construction 15.7% Residential R.E. 15.9% Commercial R.E. 41.0% Commercial & Industrial 6.2% Consumer & Other 21.2% Construction 9.8% Residential R.E. 22.9% Commercial R.E. 44.7% Commercial & Industrial 9.6% Consumer & Other 13.1% Demand Deposits 20.1% NOW & Other Trans. Accts 13.9% MMDA & Other Savings 35.4% Retail Time Deposits 15.3% Jumbo Time Deposits 15.3% Demand Deposits 15.1% NOW & Other Trans. Accts 25.1% MMDA & Other Savings 31.8% Retail Time Deposits 18.7% Jumbo Time Deposits 9.4% Demand Deposits 17.9% NOW & Other Trans. Accts 18.7% MMDA & Other Savings 33.8% Retail Time Deposits 16.8% Jumbo Time Deposits 12.8% Construction 13.2% Residential R.E. 18.8% Commercial R.E. 42.5% Commercial & Industrial 7.6% Consumer & Other 17.8% |
 Additional Information 17 Additional Information and Where to Find It In connection with the proposed merger, Union will file with the Securities and Exchange Commission (the “SEC”) a registration statement on Form S-4 to register the shares of Union common stock to be issued to the stockholders of StellarOne. The registration statement will include a joint proxy statement/prospectus which will be sent to the stockholders of Union and StellarOne seeking their approval of the merger and related matters. In addition, each of Union and StellarOne may file other relevant documents concerning the proposed merger with the SEC. Investors and stockholders of both companies are urged to read the registration statement on Form S-4 and the joint proxy statement/prospectus included within the registration statement and any other relevant documents to be filed with the SEC in connection with the proposed merger because they will contain important information about Union, StellarOne and the proposed transaction. Investors and stockholders may obtain free copies of these documents through the website maintained by the SEC at www.sec.gov. Free copies of the joint proxy statement/prospectus also may be obtained by directing a request by telephone or mail to Union First Market Bankshares Corporation, 1051 East Cary Street, Suite 1200, Richmond, Virginia 23219, Attention: Investor Relations (telephone: (804) 633-5031), or StellarOne Corporation, 590 Peter Jefferson Pkwy, Suite 250, Charlottesville, Virginia 22911, Attention: Investor Relations (telephone: (434) 964-2217), or by accessing Union’s website at www.bankatunion.com under “Investor Relations” or StellarOne’s website at www.stellarone.com under “Investor Relations.” The information on Union’s and StellarOne’s websites is not, and shall not be deemed to be, a part of this presentation or incorporated into other filings either company makes with the SEC. Union and StellarOne and their respective directors and executive officers may be deemed to be participants in the solicitation of proxies from the stockholders of Union and/or StellarOne in connection with the merger. Information about the directors and executive officers of Union is set forth in the proxy statement for Union’s 2013 annual meeting of stockholders filed with the SEC on April 23, 2013. Information about the directors and executive officers of StellarOne is set forth in the proxy statement for StellarOne’s 2013 annual meeting of stockholders filed with the SEC on April 9, 2013. Additional information regarding the interests of these participants and other persons who may be deemed participants in the merger may be obtained by reading the joint proxy statement/prospectus regarding the merger when it becomes available. |