QuickLinks -- Click here to rapidly navigate through this document
CONFIDENTIAL
Project Colors
Presentation to the Special Committee
of the Board of Directors
June 2, 2001

![]()
The following materials were prepared solely for discussion at the meeting of the Special Committee of the Board of Directors of Blue ("Company") scheduled for June 2, 2001.
In preparing this presentation, we have, with your consent, relied upon information provided by the Company and other publicly available information. We have not independently verified any of such information, and have relied on it being complete and accurate in all material respects.
Please note that this presentation is based on the business and operations of Blue as represented to us as of the date hereof and does not purport to take into consideration any information or events arising subsequent to such date. SG Cowen makes no representation or warranty that there has been no material change in the information provided or reviewed by us in connection herewith.
The information contained herein is confidential and has been prepared exclusively for the benefit and use of the Special Committee of the Board of Directors of the Company in its consideration of the proposed transaction, and may not be used for any other purpose or be discussed, reproduced, disseminated, quoted or referred to at any time, in any manner or for any purpose without our prior written consent. This presentation is not for the benefit of, and does not convey any rights or remedies to, any holder of securities of the Company or any other person.
This presentation is subject to the assumptions, qualifications and limitations set forth herein and in the form of our fairness opinion letter, included as an appendix to this presentation, and does not constitute a recommendation by SG Cowen to the Special Committee of the Board of Directors or shareholders of the Company on how to vote with respect to the proposed transaction.
| 1. | TRANSACTION OVERVIEW | |
2. | BLUE OVERVIEW | |
3. | VALUATION CONSIDERATIONS | |
APPENDICES | ||
A. | QUARTERLY FINANCIAL STATEMENTS | |
B. | FORM OF SG COWEN FAIRNESS OPINION | |
1
Structure and Consideration
- •
- Proposed acquisition of the outstanding shares of Blue not currently owned by certain shareholders led by White and John W.P. Holt ("Purchasing Shareholders")
- •
- Transaction structured as a merger
- •
- Transaction is a "going private" transaction subject to SEC rule 13E-3
- •
- Intended to be accounted for under recapitalization accounting
- •
- Purchasing Shareholders will "roll-over" their shares
- •
- Additional shareholders may choose to "roll-over" shares and join Purchasing Shareholders
- •
- There are 20.354(a) million shares outstanding, White proposes to pay $3.50 per share in cash for the 10.405 million outstanding shares not owned by the Purchasing Shareholders
- •
- In addition, Purchase Shareholders will buy out in the money options and warrants
- •
- Transaction Value:
- •
- $75.2 million Total Equity Value(b)
- •
- $66.6 million Enterprise Value(c)
Transaction Voting Shareholder Breakdown(d)
(in millions)
| Shareholders | Total Shares | % | |||
|---|---|---|---|---|---|
| White(e) | 9.377 | 46.1 | % | ||
| John W.P. Holt(e) | 0.572 | 2.8 | % | ||
| Total Purchasing Shareholders | 9.949 | 48.9 | % | ||
| Other Shareholders | 10.405 | 51.1 | % | ||
| Total Shares Outstanding(a) | 20.354 | 100.0 | % | ||
- (a)
- Source: Blue Form 10-Q for the period ended March 31, 2001.
- (b)
- Fully Diluted Shares Outstanding of 21,484,782 include 1,130,539 dilutive options and no dilutive warrants at an offer price of $3.50 calculated using the Treasury Stock Method accounting.
- (c)
- Enterprise Value calculated as Total Equity Value plus Total Debt of $1.8 million less Cash of $10.4 million.
- (d)
- Excludes options and warrants to purchase common shares.
- (e)
- Source: Blue Proxy Statement dated May 22, 2001.
2
- •
- At the effective time, as defined in the Merger Agreement, each share of common stock other than those of the Purchasing Shareholders listed above and of shareholders exercising dissenting rights will be converted into the right to receive $3.50 per share, without interest ("Per Share Amount")
- •
- The shares of Purchasing Shareholders shall remain outstanding and after the Merger shall represent one share of common stock of the surviving corporation after the Merger ("Surviving Corporation")
- •
- Following the transaction, the Company shall cease to be a publicly traded company
- •
- Dissenting Shares shall not be converted into the right to receive cash, but Dissenting Shares will be cancelled in accordance with state law
- •
- In connection with the execution of the Merger Agreement, Purchasing Shareholders will enter into a voting agreement wherein such shareholders will agree to vote their shares in favor of the merger
- •
- Certain shareholders, including White, will enter into a Stockholders' Agreement and Registration Rights Agreement containing agreements as to, among other things, the election of directors, transfer of shares and registration rights in the event of a public offering
- •
- All vested and unvested options, in-the-money options will exchanged for an amount in cash equal to the number of underlying shares multiplied by the (Per Share Amount less the exercise price), such amount to be paid promptly following the effective time
| Shares | Exercise Price | | |||||||||
|---|---|---|---|---|---|---|---|---|---|---|---|
| Average Price | |||||||||||
| Outstanding | Exercisable | Low | High | ||||||||
| 482,367 | 418,452 | $ | 0.10 | $ | 0.75 | $ | 0.43 | ||||
| 549,631 | 341,505 | 1.85 | 1.85 | 1.85 | |||||||
| 196,165 | 2,664 | 1.88 | 2.00 | 1.94 | |||||||
| 1,208,853 | — | 2.56 | 2.56 | 2.56 | |||||||
| 2,145,115 | 396,493 | 2.81 | 19.50 | 8.26 | |||||||
| 4,582,131 | 1,159,114 | $ | 4.89 | ||||||||
- •
- Company shall use commercially reasonable efforts to obtain the agreement of holders of warrants outstanding under certain warrant agreements as to which the per share exercise price is less than the Per Share Amount to terminate such warrants in exchange for an amount in cash equal to the underlying shares multiplied by the (Per Share Amount less the exercise price), such amount to be paid promptly following the effective time
| Holder | Shares | Strike Price | Expires | |||
|---|---|---|---|---|---|---|
| Locators, Inc. | 83,000 | $6.00 | 4/04 | |||
| Compu-Time, Inc. | 35,000 | $6.00 | 4/04 | |||
| Parts Finder Locating Systems, Inc. | 42,000 | $6.00 | 4/04 | |||
| DaimlerChrysler AG | 1,454,324 | $10.03 - $15.04 | 5/08 - 5/10 | |||
| Warburg, Pincus EP, L.P. | 416,390 | $6.86 | 6/05 | |||
| Riverside Partnership | 138,797 | $6.86 | 6/05 | |||
| Third Point | 125,981 | $6.86 | 6/05 | |||
| Points West Intl. Inv. Ltd. | 12,816 | $6.86 | 6/05 | |||
| General Electric Capital | 400,000 | $6.50 | 12/05 | |||
| 2,708,308 | $9.40 | |||||
3
Additional Key Transaction Items
- •
- Company agrees not to solicit or encourage any inquiries regarding any alternative merger proposal or participate in any discussions relating to any alternative merger proposal, but may respond to an unsolicited proposal submitted to Blue that Company Board of Directors determines in good faith is reasonably likely to represent a Superior Proposal as required to discharge Company Board of Directors' fiduciary duties
- •
- Company may not withdraw or modify its approval of the Merger upon receipt of a Superior Proposal, or approve, recommend or enter into an agreement with respect to a Superior Proposal unless Company gives Merger Sub written notice of the Superior Proposal, and allows Merger Sub at least 5 business days to adjust the terms of the Merger in response to the Superior Proposal
- •
- Notwithstanding the receipt of a Superior Proposal and the withdrawal of Company Board of Director approval of the Merger, Company shall hold a shareholders' meeting to vote upon the Merger
- •
- Company (and Surviving Corporation if the Merger becomes effective) shall indemnify Company's directors, officers, employees and agents for 6 years after the Merger against any costs and expenses in connection with any claim arising out of the Merger and shall maintain directors' and officers' insurance for 3 years with respect to current directors and officers
- •
- The Merger is conditional upon, among other things:
- •
- Company shareholder approval
- •
- No government action restricting or limiting the ownership or operation by Merger Sub of Company's business or material assets, requiring disposition of any portion of Company's business or material assets or imposing material limitations on the ability of Merger Sub to hold or exercise full rights of ownership of any shares of Company common stock or effectively to control the Company's business
- •
- Receipt of all necessary government approvals and expiration of any applicable waiting periods, including Hart-Scott-Rodino waiting periods
4
- •
- Receipt of all necessary consents
- •
- White and its affiliates executing a subscription agreement pursuant to which White and its affiliates shall purchase from the Company preferred stock in exchange for an aggregate amount of cash sufficient to pay the Per Share Amount in the merger and all fees and expenses of White, Merger Sub and the Company incurred in the merger
- •
- Aggregate number of Dissenting Shares not exceeding 15% of the issued and outstanding shares of Company common stock excluding shares of Purchasing Shareholders and Dissenting Shares
- •
- The merger agreement may be terminated in the following situations, among others:
- •
- By mutual written consent of Company and Merger Sub
- •
- By Company or Merger Sub if Company shareholders do not approve the Merger at the shareholder meeting
- •
- By Company or Merger Sub if the Merger has not closed by December 31, 2001 (the "Outside Date")
- •
- By Company if (i) Merger Sub or White has materially breached any of its representations, warranties or covenants, and such breach has not been cured within 10 business days following written notice of the breach has been given or (ii) if White fails to vote or advises that it will not vote all of its shares in favor of the Merger
- •
- By Merger Sub if:
- —
- Company Board of Directors changes its approval of the Merger in a manner adverse to Merger Sub
- —
- Any person or group other than Merger Sub and its affiliates acquires beneficial ownership of 10% or more of the Company's common stock and Company Board of Directors approves the acquisition
- —
- Company materially breaches any representation, warranty, covenant or other agreement provided such breach has not been cured within 10 business days following written notice of the breach has been given
- —
- Company has not held the shareholders' meeting by six days prior to Outside Date
5
- •
- Company shall pay to White a termination fee plus expenses, which expenses are not to exceed $750,000, at the time of the termination of the Agreement by Merger Sub in the event the Company (a) materially breaches any of its representations, warranties or covenants, (b) violates its non-soliciation covenant or (c) fails to call and hold a shareholders' meeting six days prior to the Outside Date
- •
- Subject to the terms of the Agreement, the Company shall pay to White a termination fee if the Company enters into agreement with another acquiror within 6 months of termination of the Agreement by Merger Sub in the event:
- •
- the Merger is not consummated by the Outside Date (except where Merger Sub would otherwise be prohibited from terminating the Agreement for such reason)
- •
- of a material breach by the Company of a representation, warranty or covenant of the Company (other than a breach of the Company's non-solicitation covenant)
6
CERTAIN TRANSACTION BACKGROUND INFORMATION
- •
- The Board of Directors of Blue was made aware that White was considering a proposal for the Company on April 25, 2001
- •
- SG Cowen was engaged on May 18, 2001 by the Special Committee of the Board of Directors of Blue
- •
- On November 1, 2000, White, First Analysis and Third Point Partners purchased $15M of Preferred Stock of Blue convertible into Blue common stock at $6.86 per share
- •
- On April 3, 2001, White purchased 200,000 shares of Common Stock from Geoffrey T. Barker at $3.50 per share
- •
- SG Cowen did not contact, nor was it requested to contact, additional prospective purchasers for the assets or stock of Blue because SG Cowen was informed by the Special Committee of the Board of Directors that White was not interested in selling any of its shares or participating in any other transaction that might result in a dilution of its equity ownership
7
Implied Multiples of Proposed Transaction
(US$ in millions)
| Valuation Summary | | |||
|---|---|---|---|---|
| Offer Price per Share | $ | 3.50 | ||
| Primary Shares Outstanding(a) | 20.354 | |||
| Options and Warrants(b) | 1.131 | |||
| Fully Diluted Shares Outstanding | 21.485 | |||
| Implied Equity Value | $ | 75.2 | ||
| Plus: Debt(a) | 1.8 | |||
| Less: Cash(a) | 10.4 | |||
| Enterprise Value | $ | 66.6 | ||
| Blue Stock Price as of June 1, 2001 | $ | 1.95 | ||
| Premium to Market | 79.5% | |||
Total Consideration as a Multiple of:
Revenue(c)
| | Operating Statistic | Implied Multiples | ||||
|---|---|---|---|---|---|---|
| LTM(d) | $ | 44.9 | 1.5 | x | ||
| LQA(d) | 49.1 | 1.4 | ||||
| CY2001 - Base Case(e) | 54.2 | 1.2 | ||||
| CY2002 - Base Case(e) | 72.9 | 0.9 | ||||
- (a)
- Source: Blue Form 10-Q for the period ended March 31, 2001.
- (b)
- Options and Warrants per Blue Management as of April 30, 2001 calculated using the treasury stock method.
- (c)
- Revenue is net of amounts relating to the fair value of warrants and common stock issued pursuant to the DaimlerChrysler Services Agreement which is consistent with Generally Accepted Accounting Principles ("GAAP").
- (d)
- Latest Twelve Months ("LTM") and Latest Quarter Annualized ("LQA") per Blue Form 10-Q for the period ended March 31, 2001 and Blue Form 10-K for the period ended December 31, 2000.
- (e)
- Source: Blue Management's Base Case scenario as of May 24, 2001.
8
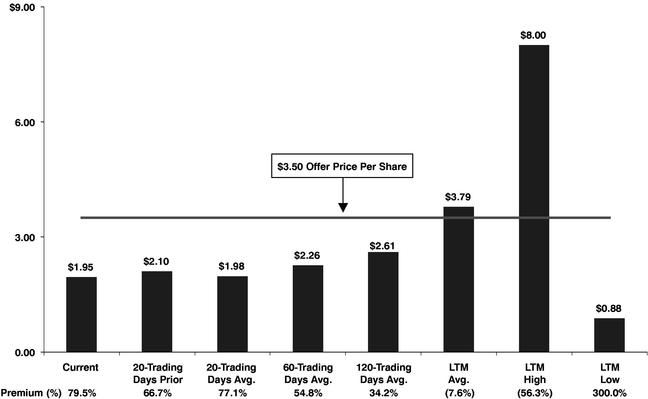
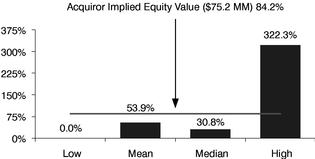
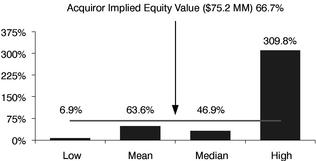
TRANSACTION PREMIUMS ANALYSIS(a)
Premiums Based on Blue Closing Stock Price

- (a)
- Source: FactSet Data Systems as of June 1, 2001.
9
- •
- In the event the SEC does not review the proxy statement filed in connection with the merger
| Event | Approximate Timing | |
|---|---|---|
| Delivery of Opinion to Blue Special Committee of the Board of Directors | June 2, 2001 | |
Blue Board of Directors Meeting | June 2, 2001 | |
Execution of Agreement / Transaction Announcement | June 4, 2001 | |
File Proxy Statement | Mid / Late June 2001 | |
Distribute Proxy Statement to Blue Shareholders | Late June / Early July 2001 | |
Special Meeting of Blue Shareholders | Late July / Early August 2001 | |
Closing | Late July / Early August 2001 |
10
11
BLUE OVERVIEW (SEATTLE, WA)(a)
- •
- Blue provides e-Business products and services to the retail automotive industry
- •
- Design and host dealer web sites and provide customer relationship management (CRM) tools
- •
- Collect, aggregate, and distribute dealer data
- •
- Other e-Business products include training and consulting, and portal services for industry information on parts and wholesale used vehicle sales
- •
- The Company's core e-Business solutions are endorsed by the National Automotive Dealers Association (NADA)
- •
- Client base is comprised of approximately 8,950 auto dealers as well as 14 auto manufacturers
- •
- DaimlerChrysler is the Company's largest customer, accounting for approximately 20% of FY2000 revenues
- •
- Blue's strategy is to expand its network of clients and to leverage it with solutions that allow dealers to increase customer loyalty and revenue growth
- •
- The Company is headquartered in Seattle, WA and had 674 employees as of April 30, 2001
- •
- Selected affiliates include Vicinity, AutoVantage, Excite Classifieds2000, Yahoo Autos, BuySellBid.com, InfoSpace.com
- (a)
- Source: Blue Web site, Blue Form 10-K for the period ended December 31, 2000 and Blue Management as of April 30, 2001.
12
Summary Product Review
(US$ in millions)
| | | | | Revenue Contribution(b) | ||||||||||||||||||||||
|---|---|---|---|---|---|---|---|---|---|---|---|---|---|---|---|---|---|---|---|---|---|---|---|---|---|---|
| | Product Offering | Description | 2002E | 2001E | 2000A | 1999A | ||||||||||||||||||||
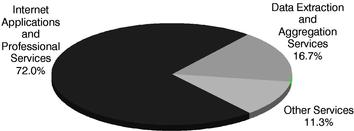
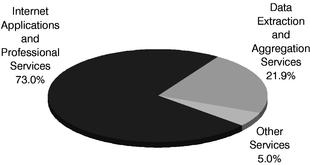
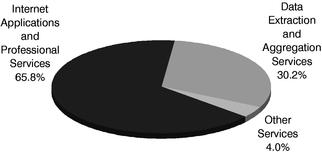
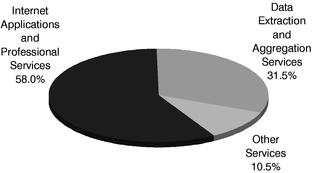
| Internet Applications and Professional Services | Packaged e-Business Services | • | Standardized dealer Web site and advertising tools | $ | 52.5 | 72.0 | % | $ | 39.6 | 73.0 | % | $ | 27.3 | 65.8 | % | $ | 13.5 | 58.0 | % | |||||||
Custom Development Services | • | Provide upgrades and enhancements to standard solutions | ||||||||||||||||||||||||
CRM Tools | • | Internet-based lead management, maintenance record tracking, and lead "pick-or-pass" | ||||||||||||||||||||||||
Data Extraction and Aggregation Services | IntegraLink (subsidiary) | • | Collects service, inventory, sales, parts and accounting data from dealerships | 12.1 | 16.7 | % | 11.9 | 21.9 | % | 12.5 | 30.2 | % | 7.3 | 31.5 | % | |||||||||||
PartsVoice (subsidiary) | • | Database of original equipment manufacturers (OEM) parts | ||||||||||||||||||||||||
• | Includes inventory information for 9,000 dealers | |||||||||||||||||||||||||
Other Services | Dealer Advisory Services | • | Best practices e-Business training and consulting for dealers and manufacturers | 8.3 | 11.3 | % | 2.7 | 5.0 | % | 1.7 | 4.0 | % | 2.4 | 10.5 | % | |||||||||||
Internet Portals | • | Host industry information site MotorPlace.com and automotive research portal DealerNet.com | ||||||||||||||||||||||||
MotorPlace Auto Exchange | • | Marketplace for auto leasing companies to sell wholesale used vehicles | ||||||||||||||||||||||||
| $ | 72.9 | 100.0 | % | $ | 54.2 | 100.0 | % | $ | 41.5 | 100.0 | % | $ | 23.3 | 100.0 | % | |||||||||||
- (a)
- Source: Form 10-K for the period ended December 31, 2000 and Blue Management's Base Case scenario as of May 24, 2001.
- (b)
- Revenue is net of amounts relating to the fair value of warrants and common stock issued pursuant to the DaimlerChrysler Services Agreement which is consistent with Generally Accepted Accounting Principles ("GAAP").
13
| Revenue Contribution—2002E | Revenue Contribution—2001E | |
 |  | |
Revenue Contribution—2000A | Revenue Contribution—1999A | |
 |  |
- (a)
- Source: Form 10-K for the period ended December 31, 2000 and Blue Management's Base Case scenario as of May 24, 2001.
- (b)
- Revenue is net of amounts relating to the fair value of warrants and common stock issued pursuant to the DaimlerChrysler Services Agreement which is consistent with Generally Accepted Accounting Principles ("GAAP").
14
- •
- May 7, 2001—Announced the availability of NADA Sales Accelerator Package, a suite of e-business tools for automotive dealers that gives consumers the ability to research, locate and arrange purchase of a vehicle from a dealer online
- •
- April 24, 2001—Announced financial results for the first quarter ended March 31, 2001. Pro forma revenue for the first quarter of 2001 was $13.6 million, compared to $8.9 million for the first quarter of 2000
- •
- April 3, 2001—White purchases 200,000 common shares from Geoffrey Barker, Blue Director, at $3.50 per share
- •
- March 14, 2001—Announced that it has secured a $10 million revolving credit facility from Silicon Valley Bank of Santa Clara, CA
- •
- January 25, 2001—Announced that gross revenue for the fourth quarter of 2000, excluding certain adjustments, increased 58% to $13.2 million, compared to $8.4 million in the fourth quarter of 1999
- •
- November 1, 2000—Added $15 million in private equity funding to finance the continued development of e-business products and services for automotive dealer and manufacturer customers. The $15 million investment at $6.86 per share results from a private equity agreement announced in June with White, First Analysis Venture Capital, and Third Point Partners L.P.
- (a)
- Source: Blue web site, press releases and SEC filings.
15
MANAGEMENT AND BOARD OF DIRECTORS(a)
Executive Officers
| Name | Age | Position | ||
|---|---|---|---|---|
| John W.P. Holt(b) | 44 | President and Chief Executive Officer | ||
David S. Snyder | 40 | Executive Vice President and Chief Financial Officer | ||
Rajan Krishnamurty | 43 | Executive Vice President and Chief Technology Officer | ||
Terrence E. Smail | 57 | Executive Vice President, Sales and Account Services | ||
Kevin M. Distelhorst | 39 | Vice President and General Manager, IntegraLink | ||
Michael D. Bell | 43 | Vice President and General Manager, PartsVoice |
Board of Directors
| Name | Age | Position | ||
|---|---|---|---|---|
| Geoffrey T. Barker | 39 | Co-Founder, Blue; Chairman and CEO, Vigilos, Inc. | ||
Mark T. Koulogeorge | 37 | Managing Director, First Analysis Corporation | ||
Joseph P. Landy | 39 | Managing Director, White | ||
Ernest H. Pomerantz | 59 | Senior Managing Director, Mesa Partners, Inc. | ||
J.D. Power, III | 69 | Chairman and CEO, J.D. Power and Associates | ||
Howard A. Tullman | 55 | CEO, Worldwide Xceed Group, Inc. |
- (a)
- Source: Blue Proxy Statement dated May 22, 2001 and Company Web site.
- (b)
- Management member is on the Board of Directors.
16
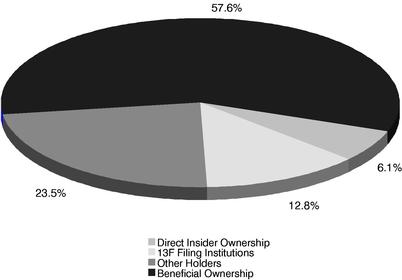
Ownership by Major Classification
| Shareholder Class / Owner | Shares | % of Total | ||||
|---|---|---|---|---|---|---|
| Direct Insider Ownership(a) | ||||||
| John W.P. Holt | 572,132 | 2.8 | % | |||
| Geoffrey Barker | 427,492 | 2.1 | % | |||
| Mark Koulogeorge | 156,574 | 0.8 | % | |||
| Howard Tullman | 36,000 | 0.2 | % | |||
| Ernest Pomerantz | 30,000 | 0.1 | % | |||
| David Snyder | 7,500 | 0.0 | % | |||
| Michael Bell | 7,250 | 0.0 | % | |||
| Rajan Krishnamurty | 2,441 | 0.0 | % | |||
| J.D. Power, III | 1,000 | 0.0 | % | |||
| Terrence Smail | — | 0.0 | % | |||
| Joseph Landy | — | 0.0 | % | |||
| 1,240,389 | 6.1 | % | ||||
| Beneficial Ownership(a) | ||||||
| White | 9,377,068 | 46.1 | % | |||
| First Analysis Corporation | 1,642,962 | 8.1 | % | |||
| General Electric Capital Assurance Company | 713,065 | 3.5 | % | |||
| 11,733,095 | 57.6 | % | ||||
| 13F Filing Institutions(b) | ||||||
| Third Point Management Co, LLC | 798,258 | 3.9 | % | |||
| Peter A. Wright Capital | 252,100 | 1.2 | % | |||
| Dimensional Fund Advisors | 250,900 | 1.2 | % | |||
| 1,301,258 | 6.4 | % | ||||
Other Institutional Holders | 1,304,968 | 6.4 | % | |||
Total Institutional Holders | 2,606,226 | 12.8 | % | |||
Other Holders | 4,774,533 | 23.5 | % | |||
Total Common Shares Outstanding(c) | 20,354,243 | 100.0 | % | |||
- (a)
- Source: Blue Proxy Statement dated May 22, 2001 as of March 14, 2001.
- (b)
- Source: CDA/Prism as of May 29, 2001 as of April 30, 2001.
- (c)
- Source: Blue Form 10-Q for the period ended March 31, 2001. Assumes 20,354,243 common shares outstanding as of April 30, 2001.
17
HISTORICAL STOCK PRICE PERFORMANCE(a)
| Trading Statistics | |||
| Current | $ | 1.95 | |
| 5-Day Average | 1.99 | ||
| 10-Day Average | 1.95 | ||
| 20-Day Average | 1.98 | ||
| Closing Average Since IPO | 7.01 | ||
| Trading High Since IPO | 34.00 | ||
| Trading Low Since IPO | 0.88 | ||
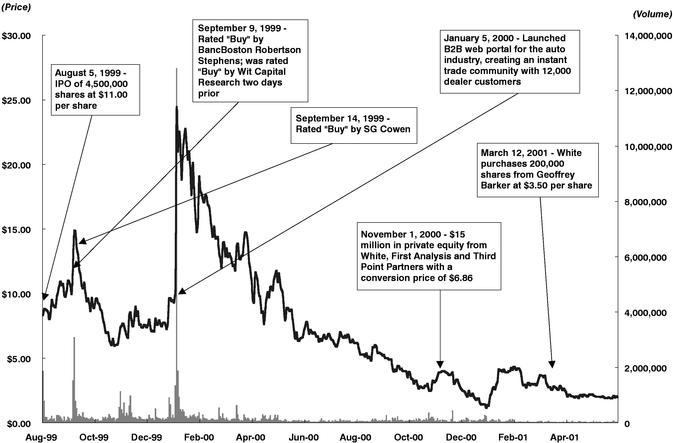
- (a)
- Source: FactSet Data Systems as of June 1, 2001.
18
HISTORICAL STOCK PRICE PERFORMANCE(a)
Blue vs. NASDAQ and Indices—LTM
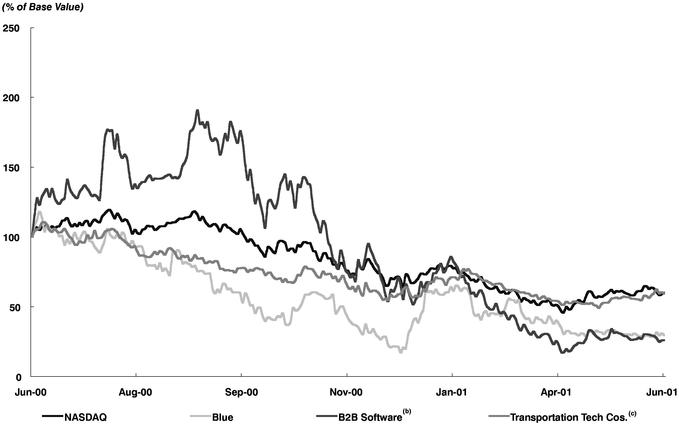
- (a)
- Source: FactSet Data Systems as of June 1, 2001.
- (b)
- B2B Software Index includes: ARBA CMRC FMKT PPRO SQST VERT WEBM.
- (c)
- Transportation Tech Cos. Index includes: ABTL CCCG PRTS REY TRDR.
19
HISTORICAL STOCK PRICE PERFORMANCE(a)
| Trading Statistics | |||
| Current | $ | 1.95 | |
| 5-Day Average | 1.99 | ||
| 10-Day Average | 1.95 | ||
| 20-Day Average | 1.98 | ||
| LTM Average | 3.79 | ||
| LTM High | 8.00 | ||
| LTM Low | 0.88 | ||
Last Twelve Months
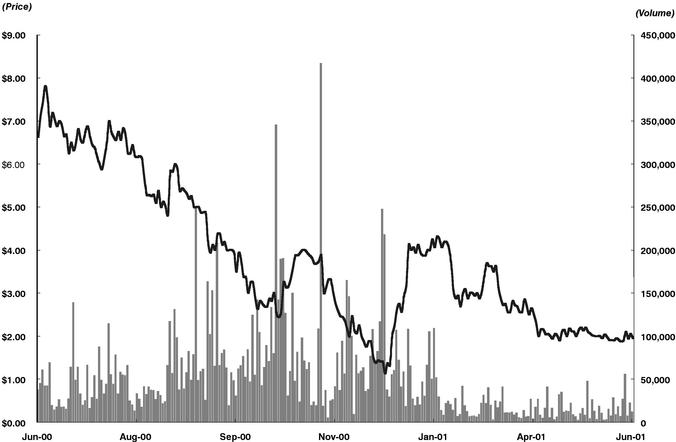
- (a)
- Source: FactSet Data Systems as of June 1, 2001.
20
HISTORICAL STOCK PRICE PERFORMANCE(a)
| Avg. Close | $ | 2.59 | ||
| Avg. Volume | 34,324 | |||
| Avg. $/ Day | $ | 84,817 | ||
| Total Volume | 4,290,500 | |||
| Shares O/S | 20,354,243 | |||
| Float | 7,380,759 | |||
| Float Turnover | 0.6 | x |
Shares at Specific Prices—Last 6 months
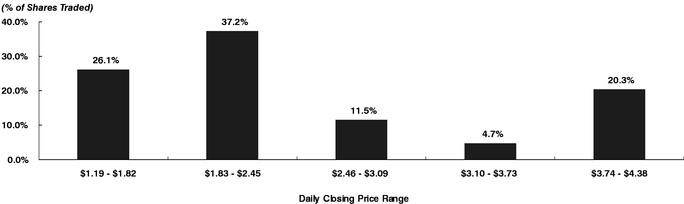
Cumulative Shares Traded at Specific Prices—Last 6 months
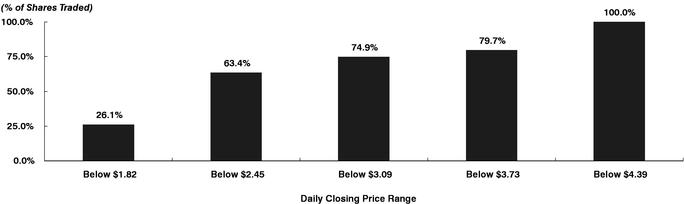
- (a)
- Source: FactSet Data Systems as of June 1, 2001.
21
HISTORICAL STOCK PRICE PERFORMANCE(a)
| Avg. Close | $ | 3.79 | ||
| Avg. Volume | 50,358 | |||
| Avg. $/ Day | $ | 192,968 | ||
| Total Volume | 12,740,600 | |||
| Shares O/S | 20,354,243 | |||
| Float | 7,380,759 | |||
| Float Turnover | 1.7 | x |
Shares at Specific Prices—LTM
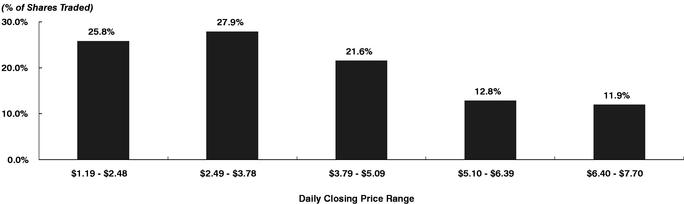
Cumulative Shares Traded at Specific Prices—LTM

- (a)
- Source: FactSet Data Systems as of June 1, 2001.
22
ACQUISITION / DIVESTITURE HISTORY
Historical Acquisition and Divestiture Activity(a)
(US$ in millions)
| Date | Target Name | Deal Value | Description | ||||
|---|---|---|---|---|---|---|---|
| January 2000 | IntegraLink Corporation | $ | 3.7 | Acquisition enhanced data acquisition capabilities and provided access to additional clients | |||
January 2000 | YachtWorld.com | 14.0 | (b) | Sale of YachtWorld.com assets to Boats.com, Inc. | |||
April 1999 | PartsVoice, LLC | 30.7 | (c) | Acquisition of vehicle parts data aggregation and management services business | |||
- (a)
- Source: Blue Form 10-K for the period ended December 31, 2000 and Company Press Releases.
- (b)
- Plus warrants. As of March 28, 2001, the Company had received $7.2 million of a $10.5 million promissory note issued by Boats.com in conjunction with this sale. The Company has agreed to forgive the remaining $3.6 million of the note receivable balance in exchange for release of certain obligations in connection with the transaction.
- (c)
- Weaker than expected sales and greater than expected client attrition in this business unit led the Company to recognize a $9.7 million impairment charge during the third quarter of 2000 which was allotted entirely to goodwill.
23
| Revenue(b) | Gross Profit | |
 |  |
EBIT(c)

- (a)
- Source: Historical figures per Blue Form 10-K for the period ended December 31, 2000. Projections per Blue Management's Base Case scenario as of May 24, 2001.
- (b)
- Revenue is net of amounts relating to the fair value of warrants and common stock issued pursuant to the DaimlerChrysler Services Agreement which is consistent with Generally Accepted Accounting Principles ("GAAP").
- (c)
- Excludes Stock-based Compensation, Amortization of Intangibles and other extraordinary items.
24
Financial Performance(a)(b)
(US$ in millions, except per share data)
| | Historical | Projected—Base Case | | |||||||||||||||||||
|---|---|---|---|---|---|---|---|---|---|---|---|---|---|---|---|---|---|---|---|---|---|---|
| Fiscal Year Ending December 31, | CAGR 1998-2002E | |||||||||||||||||||||
| 1998 | 1999 | 2000 | LTM(c) | 2001E | 2002E | |||||||||||||||||
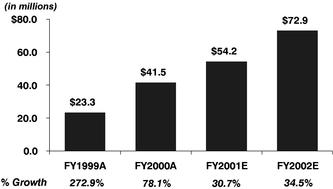
| Revenue(d) | $ | 6.2 | $ | 23.3 | $ | 41.5 | $ | 44.9 | $ | 54.2 | $ | 72.9 | 84.9 | % | ||||||||
% Growth | 265.0 | % | 272.9 | % | 78.1 | % | — | 30.7 | % | 34.5 | % | |||||||||||
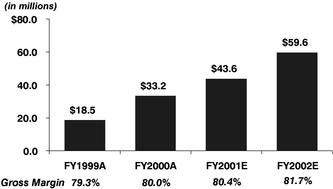
Gross Profit | $ | 5.0 | $ | 18.5 | $ | 33.2 | $ | 35.8 | $ | 43.6 | $ | 59.6 | 85.4 | % | ||||||||
% of Revenue | 80.8 | % | 79.3 | % | 80.0 | % | 79.9 | % | 80.4 | % | 81.7 | % | ||||||||||
EBIT | $ | (4.3 | ) | $ | (9.5 | ) | $ | (16.2 | ) | $ | (20.4 | ) | $ | (23.1 | ) | $ | (9.9 | ) | NM | |||
% of Revenue | (68.7 | )% | (40.8 | )% | (39.0 | )% | (45.5 | )% | (42.6 | )% | (13.6 | )% | ||||||||||
Net Income | $ | (4.2 | ) | $ | (10.0 | ) | $ | (15.4 | ) | $ | (19.6 | ) | $ | (23.0 | ) | $ | (9.7 | ) | NM | |||
% of Revenue | (67.9 | )% | (43.0 | )% | (37.2 | )% | (43.8 | )% | (42.5 | )% | (13.3 | )% | ||||||||||
Earnings Per Share | $ | (0.50 | ) | $ | (0.74 | ) | $ | (0.86 | ) | $ | (1.05 | ) | $ | (1.13 | ) | $ | (0.47 | ) | NM | |||
- (a)
- Source: Historical figures per Blue SEC filings. Projections per Blue Management's Base Case scenario as of May 24, 2001.
- (b)
- Excludes Stock-based Compensation, Amortization of Intangibles and other extraordinary items.
- (c)
- Latest Twelve Months ("LTM") per Blue Form 10-Q for the period ended March 31, 2001 and Blue Form 10-K for the period ended December 31, 2000.
- (d)
- Revenue is net of amounts relating to the fair value of warrants and common stock issued pursuant to the DaimlerChrysler Services Agreement which is consistent with Generally Accepted Accounting Principles ("GAAP").
25
COMPARISON OF BASE CASE AND OPTIMISTIC CASE(a)
- •
- Management has provided us with revenue detail on an optimistic case
- •
- Management has not provided us with expense detail with respect to the optimistic case
Base Case vs. Optimistic Case Revenue Analysis
(US$ in millions)
| | 2001E | 2002E | |||||||||||||||||||||
|---|---|---|---|---|---|---|---|---|---|---|---|---|---|---|---|---|---|---|---|---|---|---|---|
| | Base | Optimistic | Difference | Percentage | Base | Optimistic | Difference | Percentage | |||||||||||||||
| Internet Applications | $ | 37.1 | $ | 37.2 | $ | 0.1 | 0.4 | % | $ | 49.6 | $ | 52.5 | $ | 2.9 | 5.8 | % | |||||||
| Professional Services | 8.6 | 8.6 | — | — | 9.5 | 10.6 | 1.1 | 11.5 | % | ||||||||||||||
| Dealer Advisory Services | 0.8 | 1.2 | 0.4 | 51.9 | % | 1.3 | 3.0 | 1.7 | 134.1 | % | |||||||||||||
| PartsVoice | 10.0 | 10.1 | 0.1 | 1.0 | % | 10.1 | 10.7 | 0.5 | 5.4 | % | |||||||||||||
| IntegraLink | 1.9 | 1.9 | — | — | 2.0 | 2.4 | 0.4 | 20.0 | % | ||||||||||||||
| MotorPlace Auto Exchange | 1.0 | 1.0 | — | — | 6.0 | 7.8 | 1.8 | 30.0 | % | ||||||||||||||
| Portals & Advertising | 1.0 | 1.0 | — | — | 1.0 | 1.0 | — | — | |||||||||||||||
| Pro Forma Revenue(b) | $ | 60.3 | $ | 61.0 | $ | 0.6 | 1.1 | % | $ | 79.5 | $ | 88.0 | $ | 8.5 | 10.6 | % | |||||||
| Chrysler Equity Subscriptions | 6.1 | 6.1 | — | 6.6 | 6.6 | — | |||||||||||||||||
| Revenue(c) | $ | 54.2 | $ | 54.8 | $ | 0.6 | 1.2 | % | $ | 72.9 | $ | 81.4 | $ | 8.5 | 11.6 | % | |||||||
- (a)
- Source: Blue Management as of May 24, 2001.
- (b)
- Pro Forma Revenue includes amounts relating to the fair value of warrants and common stock issued pursuant to the DaimlerChrysler Services Agreement.
- (c)
- Revenue is net of amounts relating to the fair value of warrants and common stock issued pursuant to the DaimlerChrysler Services Agreement which is consistent with Generally Accepted Accounting Principles ("GAAP").
26
BLUE PROJECTED CASH FLOW ANALYSIS
Projected Cash Flow Analysis(a)
(US$ in millions)
| | CY 2001 | CY 2002 | |||||||||||||||||||||||
|---|---|---|---|---|---|---|---|---|---|---|---|---|---|---|---|---|---|---|---|---|---|---|---|---|---|
| | Q1A | Q2E | Q3E | Q4E | Q1E | Q2E | Q3E | Q4E | |||||||||||||||||
| Net loss | $ | (6.2 | ) | $ | (6.4 | ) | $ | (5.8 | ) | $ | (4.6 | ) | $ | (4.2 | ) | $ | (3.4 | ) | $ | (2.0 | ) | $ | (0.1 | ) | |
| Chrysler Equity Subscriptions | 1.3 | 1.5 | 1.6 | 1.7 | 1.7 | 1.7 | 1.7 | 1.7 | |||||||||||||||||
| Amortization of Deferred Equity Expenses | 0.1 | — | — | — | — | — | — | — | |||||||||||||||||
| Depreciation & Amortization | 1.3 | 1.3 | 1.4 | 1.8 | 1.8 | 1.8 | 1.9 | 1.9 | |||||||||||||||||
| Deferral of Revenue per SAB 101 | 1.0 | 0.7 | 1.1 | 0.6 | 1.0 | 0.6 | 0.4 | 0.2 | |||||||||||||||||
| Adjusted EBDA | $ | (2.6 | ) | $ | (2.9 | ) | $ | (1.8 | ) | $ | (0.4 | ) | $ | 0.3 | $ | 0.7 | $ | 1.9 | $ | 3.6 | |||||
| Capital Purchases | (1.0 | ) | (3.4 | ) | (0.9 | ) | (0.7 | ) | (1.0 | ) | (0.7 | ) | (0.0 | ) | (0.6 | ) | |||||||||
| Cash Provided by (used in) Financing Activities | (0.5 | ) | (0.5 | ) | (0.3 | ) | (0.4 | ) | (0.3 | ) | (0.1 | ) | (0.0 | ) | 0.0 | ||||||||||
| Cash Flow Before Changes in Working Capital | (4.1 | ) | (6.7 | ) | (3.0 | ) | (1.4 | ) | (1.0 | ) | (0.2 | ) | 1.9 | 3.1 | |||||||||||
| Changes in Working Capital | (2.2 | ) | 1.9 | (1.1 | ) | (0.2 | ) | (0.3 | ) | 1.2 | (0.5 | ) | (0.2 | ) | |||||||||||
| Net (Decrease) Increase in Cash | $ | (6.2 | ) | $ | (4.8 | ) | $ | (4.1 | ) | $ | (1.7 | ) | $ | (1.3 | ) | $ | 1.0 | $ | 1.4 | $ | 2.9 | ||||
| Cash, Beginning of Quarter | 16.6 | 10.4 | 5.6 | 1.5 | (0.2 | ) | (1.4 | ) | (0.4 | ) | 1.0 | ||||||||||||||
| Cash, End of Quarter | $ | 10.4 | $ | 5.6 | $ | 1.5 | $ | (0.2 | ) | $ | (1.4 | ) | $ | (0.4 | ) | $ | 1.0 | $ | 3.9 | ||||||
- (a)
- Source: Blue Management's Base Case scenario as of May 24, 2001.
27
BLUE PROJECTED BALANCE SHEET ANALYSIS
Projected Balance Sheet Analysis(a)
(US$ in millions)
| | CY 2001 | CY 2002 | |||||||||||||||||||||||
|---|---|---|---|---|---|---|---|---|---|---|---|---|---|---|---|---|---|---|---|---|---|---|---|---|---|
| | Q1A | Q2E | Q3E | Q4E | Q1E | Q2E | Q3E | Q4E | |||||||||||||||||
| Cash and Cash Equivalents | $ | 10.4 | $ | 5.6 | $ | 1.5 | $ | (0.2 | ) | $ | (1.4 | ) | $ | (0.4 | ) | $ | 1.0 | $ | 3.9 | ||||||
| Accounts Receivable | 10.4 | 10.0 | 11.3 | 12.4 | 13.4 | 13.2 | 14.0 | 15.4 | |||||||||||||||||
| Other Current Assets | 1.5 | 1.5 | 1.4 | 0.9 | 1.4 | 1.1 | 1.7 | 1.5 | |||||||||||||||||
| Total Current Assets | 22.3 | 17.1 | 14.1 | 13.1 | 13.3 | 13.9 | 16.6 | 20.7 | |||||||||||||||||
| Capital Assets, net | 15.1 | 17.2 | 16.7 | 15.6 | 14.7 | 13.6 | 11.8 | 10.4 | |||||||||||||||||
| Intangible Assets, net | 14.4 | 13.3 | 12.2 | 11.1 | 10.2 | 9.3 | 8.3 | 7.4 | |||||||||||||||||
| Other Assets | 0.7 | 0.6 | 0.5 | 0.4 | 0.4 | 0.3 | 0.3 | 0.2 | |||||||||||||||||
| Total Assets | $ | 52.5 | $ | 48.2 | $ | 43.5 | $ | 40.2 | $ | 38.6 | $ | 37.1 | $ | 37.1 | $ | 38.7 | |||||||||
| Accounts Payable and Other Current Liabilities | $ | 5.8 | $ | 7.0 | $ | 6.4 | $ | 6.3 | $ | 6.9 | $ | 7.0 | $ | 7.2 | $ | 7.5 | |||||||||
| Deferred Revenues | 7.3 | 8.1 | 9.6 | 10.8 | 12.4 | 13.5 | 14.6 | 15.4 | |||||||||||||||||
| Current Portion of Financing | 1.4 | 1.3 | 0.9 | 0.5 | 0.2 | 0.0 | 0.0 | 0.0 | |||||||||||||||||
| Total Current Liabilities | 14.3 | 16.4 | 17.0 | 17.6 | 19.4 | 20.6 | 21.8 | 22.9 | |||||||||||||||||
| Total Non-current Liabilities | 0.4 | 0.1 | (0.0 | ) | (0.0 | ) | (0.0 | ) | (0.0 | ) | (0.0 | ) | (0.0 | ) | |||||||||||
| Total Shareholders' Equity | 37.7 | 31.8 | 26.5 | 22.6 | 19.2 | 16.5 | 15.2 | 15.9 | |||||||||||||||||
| Total Liabilities & Shareholders' Equity | $ | 52.5 | $ | 48.2 | $ | 43.5 | $ | 40.2 | $ | 38.6 | $ | 37.1 | $ | 37.1 | $ | 38.7 | |||||||||
- (a)
- Source: Blue Form 10-Q for the period ended March 31, 2001 and Blue Management's Base Case scenario as of May 24, 2001.
28
Selected Balance Sheet Items(a)
(US$ in thousands)
| | | December 31, | |||||||||
|---|---|---|---|---|---|---|---|---|---|---|---|
| | March 31, 2001 | ||||||||||
| | 2000 | 1999 | |||||||||
| Balance Sheet Data | |||||||||||
| Cash and Cash Equivalents | $ | 10,354 | $ | 16,577 | $ | 14,224 | |||||
| Working Capital (Deficit) | 9,210 | 13,367 | 13,828 | ||||||||
| Total Assets | 52,513 | 57,926 | 54,032 | ||||||||
| Long-term Obligations, net of Current Portion | 435 | 548 | 1,245 | ||||||||
| Total Shareholders' Equity | 37,701 | 42,255 | 45,585 | ||||||||
- (a)
- Source: Blue Form 10-K for the period ended December 31, 2000 and Blue Form 10-Q for the period ended March 31, 2001.
29
30
TRANSACTION PREMIUMS ANALYSIS(a)
Premiums Based on Blue Closing Stock Price
- (a)
- Source: FactSet Data Systems as of June 1, 2001.
31
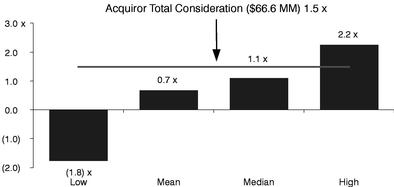
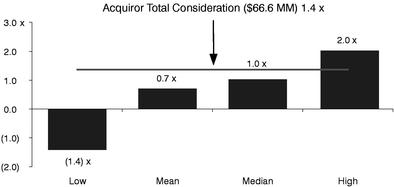
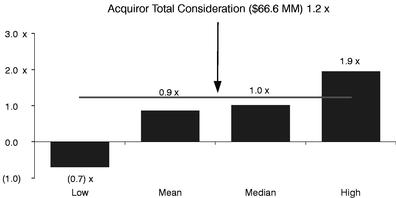
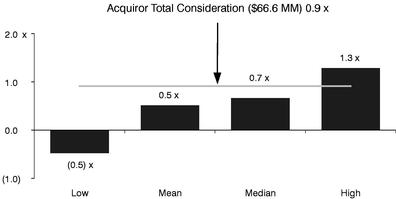
IMPLIED MULTIPLES OFFERED VS. INDUSTRY TRADING MULTIPLES(a)
| Total Consideration / LTM Revenue(b) | Total Consideration / LQA Revenue(b) | |
 |  | |
Total Consideration / CY01 Revenue(c) | Total Consideration / CY02 Revenue(c) | |
 |  |
- (a)
- Source: FactSet Data Systems as of June 1, 2001.
- (b)
- Latest Twelve Months ("LTM") and Latest Quarter Annualized ("LQA") data as of last reported quarter.
- (c)
- Projections per First Call where available. Blue Projections per Blue Management's Base Case Scenario as of May 24, 2001.
32
Trading Multiples of Selected Companies
(US$ in millions, except per share data)
| | | | | | Enterprise Value as a Multiple of (b)(c)(d) | | ||||||||||||||||
|---|---|---|---|---|---|---|---|---|---|---|---|---|---|---|---|---|---|---|---|---|---|---|
| | | | | | Revenue | | ||||||||||||||||
| Company (FYE) | Stock Price(a) | % of 52 Week High(a) | Market Value | Enterprise Value(b) | Estimated 5yr EPS Growth(e) | |||||||||||||||||
| LTM | LQA | CY01E | CY02P | |||||||||||||||||||
| ASPs | ||||||||||||||||||||||
| Corio, Inc. (12/31) | $ | 1.25 | 5.7 | % | $ | 66.1 | ($ | 35.5 | ) | (0.7 | )x | (0.7 | )x | (0.7 | )x | (0.5 | )x | 20.0 | % | |||
| Interliant, Inc. (12/31)(f) | 1.28 | 4.4 | 63.6 | 212.2 | 1.2 | 1.3 | 1.7 | NA | 32.5 | |||||||||||||
| NaviSite, Inc. (7/31)(g) | 1.70 | 2.9 | 100.5 | 99.5 | 1.1 | 0.9 | 0.8 | 0.5 | 122.9 | |||||||||||||
| eCRM | ||||||||||||||||||||||
| Chordiant Software Inc. (12/31) | $ | 3.25 | 17.0 | % | $ | 171.6 | $ | 93.5 | 2.2 | x | 1.8 | x | 1.3 | x | 0.9 | x | 45.0 | % | ||||
| FirePond, Inc. (10/31)(h) | 1.72 | 4.0 | 66.7 | (4.1 | ) | (0.1 | ) | (0.1 | ) | (0.1 | ) | NA | 50.0 | |||||||||
| Onyx Software Corp. (12/31) | 5.95 | 18.5 | 256.4 | 224.3 | 1.8 | 2.0 | 1.7 | 1.3 | 41.0 | |||||||||||||
| B2B | ||||||||||||||||||||||
| PurchasePro.com, Inc. (12/31) | $ | 1.82 | 3.8 | % | $ | 133.4 | $ | 110.3 | 1.4 | x | 1.7 | x | 1.0 | x | 0.8 | x | 40.0 | % | ||||
| SciQuest.com, Inc. (12/31) | 1.61 | 10.9 | 53.7 | (5.2 | ) | (0.1 | ) | (0.1 | ) | (0.1 | ) | (0.1 | ) | 60.0 | ||||||||
| VerticalNet, Inc. (12/31) | 2.14 | 3.4 | 216.3 | 150.3 | 1.1 | 1.0 | 1.0 | 0.7 | NM | |||||||||||||
| Transportation / Data Aggregation | ||||||||||||||||||||||
| Autobytel.com, Inc. (12/31) | $ | 1.39 | 16.2 | % | $ | 28.3 | ($ | 39.1 | ) | (0.6 | )x | (0.6 | )x | NA | NA | 20.0 | % | |||||
| CCC Information Services Group, Inc. (12/31) | 7.60 | 56.8 | 166.6 | 221.0 | 1.1 | 1.2 | NA | NA | NM | |||||||||||||
| PartsBase.com, Inc. (12/31) | 1.40 | 16.0 | 20.2 | (9.1 | ) | (1.8 | ) | (1.4 | ) | NA | NA | NM | ||||||||||
| The Reynolds and Reynolds Co. (9/30) | 22.85 | 99.3 | 1,764.2 | 1,944.9 | 2.0 | 2.0 | 1.9 | x | NA | 13.0 | ||||||||||||
| High | 99.3 | % | 2.2 | x | 2.0 | x | 1.9 | x | 1.3 | x | 122.9 | % | ||||||||||
| Median | 10.9 | 1.1 | 1.0 | 1.0 | 0.7 | 40.5 | ||||||||||||||||
| Mean | 19.9 | 0.7 | 0.7 | 0.9 | 0.5 | 44.4 | ||||||||||||||||
| Low | 2.9 | (1.8 | ) | (1.4 | ) | (0.7 | ) | (0.5 | ) | 13.0 | ||||||||||||
| Blue at Market (12/31) | $ | 1.95 | 24.4 | % | $ | 40.5 | $ | 31.9 | 0.7 | x | 0.6 | x | 0.6 | x | 0.4 | x | NM | |||||
| Blue at $3.50 Offer Price Per Share | $ | 3.50 | 43.8 | % | $ | 75.2 | $ | 66.6 | 1.5 | x | 1.4 | x | 1.2 | x | 0.9 | x | NM | |||||
- (a)
- Stock price data as of June 1, 2001.
- (b)
- Enterprise Value defined as Market Value plus Total Debt less Cash.
- (c)
- Latest Twelve Months ("LTM") and Latest Quarter Annualized ("LQA") as of last reported quarter.
- (d)
- Estimates are calendar year end per First Call where available.
- (e)
- Five Year Growth Rate Estimates are from First Call where available; otherwise IBES, Zacks or S&P Earnings Report.
- (f)
- Interliant Revenue estimates per C. E. Unterberg Research Report dated May 7, 2001.
- (g)
- NaviSite Revenue and EPS estimates per Prudential Securities Research Report dated April 23, 2001.
- (h)
- FirePond Revenue and EPS estimates per Dain Rauscher Wessels Research Report dated May 24, 2001.
33
SELECTED COMPANY ANALYSIS
Operating Statistics of Selected Companies
(US$ in millions, except per share data)
| | | Operating Results(a)(b)(c) | | | | | | | | | | | ||||||||||||||||||||||||||||||
|---|---|---|---|---|---|---|---|---|---|---|---|---|---|---|---|---|---|---|---|---|---|---|---|---|---|---|---|---|---|---|---|---|---|---|---|---|---|---|---|---|---|---|
| | | Revenue | Margins | EPS(a)(b)(c) | | | | | | |||||||||||||||||||||||||||||||||
| Company (FYE) | Revenue Growth Rate CY / CY+1 | | | | Book Value(d) | Debt/ Cap. | ||||||||||||||||||||||||||||||||||||
| LTM | LQA | CY01E | CY02P | Gross | EBIT | LTM | CY01E | CY02P | Cash(d) | STD(d) | LTD(d) | |||||||||||||||||||||||||||||||
| ASPs | ||||||||||||||||||||||||||||||||||||||||||
| Corio, Inc. (12/31) | 47.9 | % | $ | 51.9 | $ | 54.3 | $ | 50.3 | $ | 74.4 | (23.1 | %) | (158.1 | %) | ($ | 1.63 | ) | ($ | 1.66 | ) | ($ | 1.49 | ) | $ | 117.1 | $ | 6.7 | $ | 8.9 | $ | 120.9 | 11.4 | % | |||||||||
| Interliant, Inc. (12/31)(e) | NM | 170.8 | 158.3 | 124.6 | NA | 27.3 | (57.6 | ) | (2.12 | ) | (3.26 | ) | (2.63 | ) | 49.1 | 14.1 | 183.6 | 10.3 | 95.1 | |||||||||||||||||||||||
| NaviSite, Inc. (7/31)(f) | 74.1 | 88.5 | 110.8 | 123.3 | 214.7 | (27.7 | ) | (102.0 | ) | (1.58 | ) | (1.81 | ) | (0.93 | ) | 68.7 | 0.1 | 67.6 | 57.2 | 54.2 | ||||||||||||||||||||||
| eCRM | ||||||||||||||||||||||||||||||||||||||||||
| Chordiant Software Inc. (12/31) | 43.5 | % | $ | 41.7 | $ | 52.2 | $ | 72.3 | $ | 103.7 | 51.1 | % | (63.8 | %) | ($ | 0.57 | ) | ($ | 0.52 | ) | ($ | 0.04 | ) | $ | 78.7 | $ | 0.5 | $ | 0.0 | $ | 94.8 | 0.5 | % | |||||||||
| FirePond, Inc. (10/31)(g) | NM | 63.3 | 49.3 | 50.3 | NA | 47.5 | (48.3 | ) | (0.73 | ) | (0.83 | ) | NA | 71.0 | 0.2 | 0.0 | 84.3 | 0.2 | ||||||||||||||||||||||||
| Onyx Software Corp. (12/31) | 36.3 | 126.7 | 113.6 | 128.2 | 174.8 | 74.3 | (8.9 | ) | (0.29 | ) | (0.56 | ) | 0.08 | 36.4 | 1.2 | 3.0 | 87.7 | 4.6 | ||||||||||||||||||||||||
| B2B | ||||||||||||||||||||||||||||||||||||||||||
| PurchasePro.com, Inc. (12/31) | 23.6 | % | $ | 76.5 | $ | 64.1 | $ | 108.3 | $ | 133.9 | 91.7 | % | (32.9 | %) | ($ | 0.31 | ) | $ | 0.01 | $ | 0.28 | $ | 54.9 | $ | 24.7 | $ | 7.2 | $ | 248.4 | 11.4 | % | |||||||||||
| SciQuest.com, Inc. (12/31) | 40.8 | 59.2 | 50.6 | 60.3 | 84.9 | 9.5 | (99.2 | ) | (1.83 | ) | (1.23 | ) | (0.84 | ) | 61.3 | 1.1 | 1.3 | 164.9 | 1.5 | |||||||||||||||||||||||
| VerticalNet, Inc. (12/31) | 50.0 | 136.3 | 146.7 | 150.0 | 225.0 | 61.2 | (83.4 | ) | (1.30 | ) | (0.66 | ) | (0.01 | ) | 107.3 | 2.1 | 39.1 | 550.9 | 7.0 | |||||||||||||||||||||||
| Transportation / Data Aggregation | ||||||||||||||||||||||||||||||||||||||||||
| Autobytel.com, Inc. (12/31) | NM | $ | 68.1 | $ | 66.6 | NA | NA | NM | (44.2 | %) | ($ | 1.18 | ) | NA | NA | $ | 76.2 | $ | 0.0 | $ | 8.8 | $ | 86.2 | 9.3 | % | |||||||||||||||||
| CCC Information Services Group, Inc. (12/31) | NM | 209.5 | 189.6 | NA | NA | 64.5 | % | (3.1 | ) | (1.06 | ) | ($ | 0.34 | ) | NA | 11.6 | 0.4 | 65.6 | (5.5 | ) | NM | |||||||||||||||||||||
| PartsBase.com, Inc. (12/31) | NM | 5.1 | 6.4 | NA | NA | (21.1 | ) | (213.4 | ) | (0.60 | ) | NA | NA | 29.3 | 0.0 | 0.0 | 30.3 | 0.0 | ||||||||||||||||||||||||
| The Reynolds and Reynolds Co. (9/30) | NM | 967.4 | 965.3 | $ | 998.2 | NA | 58.6 | 16.4 | 1.25 | 1.37 | NA | 140.3 | 0.0 | 321.0 | 498.1 | 39.2 | ||||||||||||||||||||||||||
| High | 74.1 | % | 91.7 | % | 16.4 | % | 95.1 | % | ||||||||||||||||||||||||||||||||||
| Median | 43.5 | �� | 49.3 | (57.6 | ) | 8.1 | ||||||||||||||||||||||||||||||||||||
| Mean | 45.2 | 34.5 | (69.1 | ) | 19.5 | |||||||||||||||||||||||||||||||||||||
| Low | 23.6 | (27.7 | ) | (213.4 | ) | 0.0 | ||||||||||||||||||||||||||||||||||||
| Blue at Market (12/31) | 34.5 | % | $ | 44.9 | $ | 49.1 | $ | 54.2 | $ | 72.9 | 79.9 | % | (45.4 | %) | ($ | 1.05 | ) | ($ | 1.13 | ) | ($ | 0.47 | ) | $ | 10.4 | $ | 1.4 | $ | 0.4 | $ | 37.7 | 4.5 | % | |||||||||
- (a)
- EBIT, net income and earnings per share before extraordinary item(s) and cumulative effect of accounting change.
- (b)
- Latest Twelve Months ("LTM") and Latest Quarter Annualized ("LQA") as of last reported quarter.
- (c)
- Estimates are calendar year end per First Call where available.
- (d)
- Book Value, Total Debt and Cash as of last reported quarter.
- (e)
- Interliant Revenue estimates per C. E. Unterberg Research Report dated May 7, 2001.
- (f)
- NaviSite Revenue and EPS estimates per Prudential Securities Research Report dated April 23, 2001.
- (g)
- FirePond Revenue and EPS estimates per Dain Rauscher Wessels Research Report dated May 24, 2001.
34
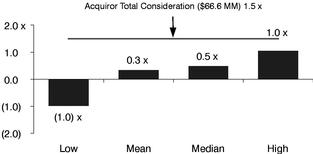
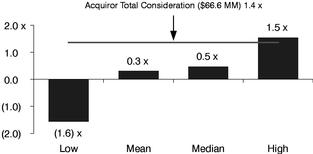
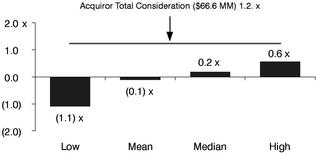
IMPLIED MULTIPLES OFFERED VS. SELECTED M&A TRANSACTIONS(a)
| Blue Statistics | |||
| Offer Price Per Share | $ | 3.50 | |
| Implied Enterprise Value | $ | 66.6 | |
| LTM Revenues(b) | $ | 44.9 | |
| LQA Revenue(b) | $ | 49.1 | |
| CY+1 Revenue(c) | $ | 54.2 | |
| Total Consideration / LTM Revenue(b) | Total Consideration / LQA Revenue(b) | |
 |  |
Total Consideration / CY+1 Revenue(d)
- (a)
- Assumes an offer price per share of $3.50.
- (b)
- Latest Twelve Months ("LTM") and Latest Quarter Annualized ("LQA") as of last reported quarter prior to announcement.
- (c)
- Source: Blue Management's Base Case scenario as of May 24, 2001.
- (d)
- Source: Wall Street Research. Assumes CY+1 Revenue estimates for the calendar year ending December 31, 2001.
35
IMPLIED PREMIUMS OFFERED VS. SELECTED M&A TRANSACTIONS(a)
| Blue Statistics | ||||
| Offer Price Per Share | $ | 3.50 | ||
| Price as of: | ||||
| 6/1/01 | $ | 1.95 | ||
| 5/4/01 | $ | 2.10 | ||
One Trading Day Prior to Announce
20 Trading Days Prior to Announce
- (a)
- Source: FactSet Data Systems as of June 1, 2001. Assumes an offer price per share of $3.50.
36
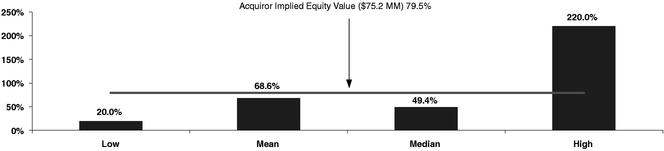
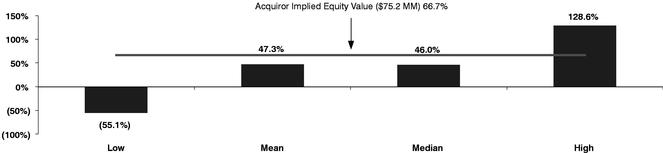
SELECTED TRANSACTION ANALYSIS(a)
Analysis of Selected M&A Transactions
(US$ in millions)
| | | | | | Total Consideration as a Multiple of: | Premiums Paid to Market(d) | |||||||||||||||
|---|---|---|---|---|---|---|---|---|---|---|---|---|---|---|---|---|---|---|---|---|---|
| Announce Date | Closing Date | Acquiring Company/ Target Company | Equity Value | Enterprise Value | LTM(b) Revenue | LQA(b) Revenue | CY+1(c) Revenue | 4 Weeks Prior | One Day Prior | ||||||||||||
| 4/11/01 | Pending | Autobytel.com Inc. Autoweb.com, Inc. | $ | 15.6 | $ | 2.6 | 0.1 | x | 0.1 | x | NA | 69.4 | % | 82.6 | % | ||||||
4/9/01 | Pending | Kana Communications, Inc. Broadbase Software, Inc. | 77.8 | (54.4 | ) | (1.0 | ) | (1.0 | ) | (0.9 | )x | (55.1 | %) | 27.8 | % | ||||||
4/9/01 | Pending | National Broadcasting Company, Inc. NBC Internet, Inc. | 152.2 | (96.9 | ) | (0.9 | ) | (1.6 | ) | (1.1 | ) | 24.0 | % | 46.0 | % | ||||||
1/8/01 | 3/27/01 | Chordiant Software Inc. Prime Response Inc. | 33.0 | 6.0 | 0.2 | 0.3 | 0.1 | (12.0 | %) | 20.0 | % | ||||||||||
12/19/00 | 4/12/01 | Vitamin Shoppe Industries Inc. VitaminShoppe.com, Inc. | 20.4 | 16.3 | 0.5 | 0.4 | 0.2 | 128.6 | % | 220.0 | % | ||||||||||
12/11/00 | 1/23/01 | Bosch Security Systems Corp. Detection Systems, Inc.(e) | 124.6 | 142.5 | 1.0 | 1.0 | NA | 108.7 | % | 97.3 | % | ||||||||||
10/25/00 | 12/8/00 | Telelogic AB Continuus Software Corp. | 41.9 | 42.1 | 1.0 | 1.0 | 0.6 | 90.9 | % | 28.7 | % | ||||||||||
10/25/00 | 12/21/00 | Trilogy Software, Inc. pcOrder.com, Inc. | 105.5 | 27.5 | 0.5 | 0.5 | 0.5 | 55.7 | % | 85.5 | % | ||||||||||
6/27/00 | 9/29/00 | Integrated Defense Technologies, Inc. Tech-Sym Corp. | 183.0 | 151.6 | 0.9 | 0.8 | NA | 36.4 | % | 25.0 | % | ||||||||||
4/27/00 | 9/1/00 | Allen Systems Group, Inc. Viasoft, Inc. | 157.4 | 69.1 | 1.0 | 1.5 | NA | 26.8 | % | 52.7 | % | ||||||||||
High | $ | 183.0 | $ | 151.6 | 1.0 | x | 1.5 | x | 0.6 | x | 128.6 | % | 220.0 | % | |||||||
Median | 91.7 | 21.9 | 0.5 | 0.5 | 0.2 | 46.0 | % | 49.4 | % | ||||||||||||
Mean | 91.1 | 30.7 | 0.3 | 0.3 | (0.1 | ) | 47.3 | % | 68.6 | % | |||||||||||
Low | 15.6 | (96.9 | ) | (1.0 | ) | (1.6 | ) | (1.1 | ) | (55.1 | %) | 20.0 | % | ||||||||
- (a)
- Source: SEC Filings and Press Releases of acquiror or target.
- (b)
- Latest Twelve Months ("LTM") and Latest Quarter Annualized ("LQA") as of last reported quarter prior to transaction announcement.
- (c)
- Source: Wall Street Research. Assumes CY+1 Revenue estimates for the calendar year ending December 31, 2001.
- (d)
- Premiums analysis based on the closing price four weeks and one day prior to announcement, respectively.
- (e)
- Premiums calculated relative to October 13, 2000, the date of the initial offer of $14.00 per share. Initial offer was rejected, offer of $18.00 was accepted on December 11, 2000.
37
IMPLIED PREMIUMS VS. RECENT TECHNOLOGY GOING PRIVATE TRANSACTIONS(a)
| Premium Paid to One Day Prior | Premium Paid to One Week Prior | |
 |  |
Premium Paid to One Month Prior
- (a)
- Source: SEC Filings or Press Releases of target or acquiror. Stock price data per FactSet Data Systems as of June 1, 2001. Assumes an offer price per share of $3.50.
38
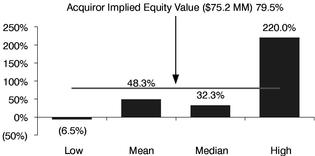
PREMIUMS PAID IN RECENT TECHNOLOGY GOING PRIVATE TRANSACTIONS(a)
Recent Technology Going Private Premiums Paid
| | | | | Premiums Paid to Market: | |||||||||
|---|---|---|---|---|---|---|---|---|---|---|---|---|---|
| Announce Date | Closing Date | Target Company | Acquiring Company | 1 day prior | 1 week prior | 1 month prior | |||||||
| 12/20/2000 | 04/12/2001 | Vitaminshoppe.com Inc. | Vitamin Shoppe Industries Inc. | 220.0 | % | 113.3 | % | 128.6 | % | ||||
| 12/19/2000 | 01/31/2001 | Loislaw.com Inc. | Wolters Kluwer NV | 190.3 | % | 322.3 | % | 309.8 | % | ||||
| 12/11/2000 | 01/23/2001 | Detection Systems Inc.(b) | Robert Bosch GmbH | 97.3 | % | 100.0 | % | 108.7 | % | ||||
| 10/25/2000 | 12/22/2000 | pcOrder.com | Trilogy Software Inc. | 85.5 | % | 108.2 | % | 55.7 | % | ||||
| 08/11/2000 | 10/06/2000 | BI Inc. | Investor Group | 78.4 | % | 106.3 | % | 65.0 | % | ||||
| 07/17/2000 | 08/24/2000 | CareerBuilder Inc. | Investor Group | 93.9 | % | 106.5 | % | 156.0 | % | ||||
| 06/27/2000 | 09/29/2000 | Tech-Sym Corp. | Integrated Defense Tech. | 25.0 | % | 23.7 | % | 36.4 | % | ||||
| 04/27/2000 | 09/01/2000 | VIASOFT Inc. | Allen Systems Group | 52.7 | % | 63.9 | % | 26.8 | % | ||||
| 03/06/2000 | 04/25/2000 | Data Transmission Network Corp. | Veronis Suhler & Assoc. Commun. | 16.0 | % | 16.6 | % | 68.7 | % | ||||
| 02/25/2000 | 04/13/2000 | Spanlink Communications Inc. | Spanlink Acquisition Group | (2.3 | %) | 7.7 | % | 37.7 | % | ||||
| 02/19/2000 | 02/19/2000 | Diehl Graphsoft Inc. | Nemetschek AG | 33.3 | % | 52.0 | % | 94.9 | % | ||||
| 02/14/2000 | 03/29/2000 | GRC International Inc. | AT&T Corp. | 12.1 | % | 16.5 | % | 18.8 | % | ||||
| 01/31/2000 | 05/12/2000 | ThermoQuest Corp. | Thermo Instrument Systems Inc. | 36.0 | % | 47.0 | % | 64.8 | % | ||||
| 01/31/2000 | 05/03/2000 | Metrika Systems Corp. | Thermo Instrument Systems Inc. | (6.5 | %) | 0.0 | % | 50.0 | % | ||||
| 01/31/2000 | 04/13/2000 | ONIX Systems Inc. | Thermo Instrument Systems Inc. | 2.9 | % | 16.1 | % | 46.9 | % | ||||
| 01/31/2000 | 04/04/2000 | Thermo Sentron Inc. (Thermedics) | Thermedics (Thermo Electron) | 7.4 | % | 6.9 | % | 6.9 | % | ||||
| 12/21/1999 | 02/03/2000 | Micro Warehouse Inc. | Investor Group | 24.6 | % | 51.2 | % | 45.5 | % | ||||
| 12/03/1999 | 03/23/2000 | Analogy Inc. | Avant Corp. | 32.3 | % | 24.0 | % | 20.2 | % | ||||
| 11/12/1999 | 02/09/2000 | Vertex Communications Corp. | TriPoint Global Communications | 48.5 | % | 37.5 | % | 71.7 | % | ||||
| 10/26/1999 | 01/31/2000 | Watkins-Johnson Co. | Fox Paine & Co L.L.C. | 30.0 | % | 29.0 | % | 24.6 | % | ||||
| 10/21/1999 | 12/22/1999 | Premisys Communications Inc. | Zhone Technologies Inc. | 12.7 | % | 23.1 | % | 22.1 | % | ||||
| 10/19/1999 | 12/10/1999 | TeleSciences Inc. | EDB AS | 181.3 | % | 219.6 | % | 251.6 | % | ||||
| 08/24/1999 | 02/02/2000 | Aavid Thermal Technologies Inc. | Willis Stein & Partners L.P. | 29.1 | % | 23.3 | % | 28.7 | % | ||||
| 07/28/1999 | 10/19/1999 | Kofax Image Products | Investor Group | 36.0 | % | 30.8 | % | 32.3 | % | ||||
| 05/21/1999 | 12/10/1999 | ThermoSpectra (Thermo Instr.) | Thermo Instrument Systems Inc. | 39.1 | % | 43.8 | % | 61.0 | % | ||||
| 05/18/1999 | 08/16/1999 | Varlen Corp. | AMSTED Industries Inc. | 61.9 | % | 50.0 | % | 68.4 | % | ||||
| 05/14/1999 | 10/29/1999 | Kentek Information Systems Inc. | Investor Group | 8.7 | % | 8.7 | % | 18.4 | % | ||||
| 05/12/1999 | 06/21/1999 | Optek Technology Inc. | Dyson-Kissner-Moran Corp. | 29.9 | % | 47.8 | % | 81.3 | % | ||||
| 05/07/1999 | 09/29/1999 | Instron Corp. | Kirtland Capital Partners | 36.4 | % | 29.4 | % | 31.3 | % | ||||
- (a)
- Source: SEC Filings or Press Releases of target or acquiror.
- (b)
- Premiums calculated relative to October 13, 2000, the date of the initial offer of $14.00 per share. Initial offer was rejected, offer of $18.00 was accepted on December 11, 2000.
39
PREMIUMS PAID IN RECENT TECHNOLOGY GOING PRIVATE TRANSACTIONS(a)
Recent Technology Going Private Premiums Paid
| | | | | Premiums Paid to Market: | |||||||||
|---|---|---|---|---|---|---|---|---|---|---|---|---|---|
| Announce Date | Closing Date | Target Company | Acquiring Company | 1 day prior | 1 week prior | 1 month prior | |||||||
| 05/05/1999 | 09/17/1999 | Enterprise Software Inc. | LiveWire Ventures L.L.C. | 23.3 | % | 25.4 | % | 49.5 | % | ||||
| 05/03/1999 | 08/24/1999 | Cellular Commun of Puerto Rico | Investor Group | 24.2 | % | 12.9 | % | 7.3 | % | ||||
| 04/05/1999 | 07/22/1999 | BancTec Inc. | Welsh Carson Anderson & Stowe | 42.3 | % | 27.0 | % | 23.8 | % | ||||
| 03/15/1999 | 05/30/1999 | Haskel International Inc. | Investor Group | 42.3 | % | 49.6 | % | 51.8 | % | ||||
| 03/08/1999 | 06/24/1999 | Analysis & Technology Inc. | Anteon Corp. | 18.9 | % | 16.2 | % | 23.8 | % | ||||
| 02/17/1999 | 08/06/1999 | Equitrac Corp. | Investor Group | 25.5 | % | 31.2 | % | 35.6 | % | ||||
| High | 220.0 | % | 322.3 | % | 309.8 | % | |||||||
| Median | 32.3 | % | 30.8 | % | 46.9 | % | |||||||
| Mean | 48.3 | % | 53.9 | % | 63.6 | % | |||||||
| Low | (6.5 | %) | 0.0 | % | 6.9 | % | |||||||
- (a)
- Source: SEC Filings or Press Releases of target or acquiror.
40
- •
- SG Cowen did not perform a discounted cash flow analysis for Blue because Blue Management informed SG Cowen that because of the nature of the Company and its business there were no reliable projections for Blue beyond calendar year 2002
41
42
QUARTERLY FINANCIAL STATEMENTS
43
BLUE HISTORICAL QUARTERLY FINANCIALS(a)(b)
Historical Operating Results
(US$ in millions, except per share data)
| | CY 1999 | CY 2000 | CY 2001 | |||||||||||||||||||||||||||||||
|---|---|---|---|---|---|---|---|---|---|---|---|---|---|---|---|---|---|---|---|---|---|---|---|---|---|---|---|---|---|---|---|---|---|---|
| Fiscal Year end December | ||||||||||||||||||||||||||||||||||
| Q1A | Q2A | Q3A | Q4A | CY1999A | Q1A | Q2A | Q3A | Q4A | CY2000A | Q1A | ||||||||||||||||||||||||
| Pro Forma Revenue(c) | $ | 2.5 | $ | 5.4 | $ | 7.0 | $ | 8.4 | $ | 23.3 | $ | 8.9 | $ | 10.2 | $ | 10.9 | $ | 12.3 | $ | 42.3 | $ | 13.6 | ||||||||||||
| Chrysler Equity Subscriptions | — | — | — | — | — | — | 0.0 | 0.1 | 0.7 | 0.8 | 1.3 | |||||||||||||||||||||||
| Revenue(d) | $ | 2.5 | $ | 5.4 | $ | 7.0 | $ | 8.4 | $ | 23.3 | $ | 8.9 | $ | 10.2 | $ | 10.8 | $ | 11.6 | $ | 41.5 | $ | 12.3 | ||||||||||||
| Cost of Revenue | 0.5 | 1.1 | 1.5 | 1.7 | 4.8 | 1.8 | 2.2 | 2.1 | 2.2 | 8.3 | 2.5 | |||||||||||||||||||||||
| Gross Profit | 1.9 | 4.3 | 5.5 | 6.7 | 18.5 | 7.1 | 8.0 | 8.7 | 9.4 | 33.2 | 9.8 | |||||||||||||||||||||||
| Operating Expenses: | ||||||||||||||||||||||||||||||||||
| Sales & Marketing | 1.7 | 2.4 | 3.7 | 3.8 | 11.6 | 4.3 | 5.2 | 6.1 | 6.3 | 21.8 | 7.0 | |||||||||||||||||||||||
| General & Administrative | 1.8 | 2.7 | 3.9 | 4.8 | 13.2 | 3.8 | 5.0 | 5.5 | 5.5 | 19.8 | 6.1 | |||||||||||||||||||||||
| Research & Development | 0.4 | 0.6 | 0.8 | 1.3 | 3.2 | 1.3 | 1.7 | 2.2 | 2.5 | 7.7 | 3.2 | |||||||||||||||||||||||
| Operating Income | (1.9 | ) | (1.4 | ) | (2.9 | ) | (3.3 | ) | (9.5 | ) | (2.2 | ) | (3.9 | ) | (5.2 | ) | (4.9 | ) | (16.2 | ) | (6.4 | ) | ||||||||||||
| Interest and Other Income/(Expense) | 0.0 | (0.5 | ) | (0.2 | ) | 0.2 | (0.5 | ) | 0.2 | 0.2 | 0.2 | 0.1 | 0.7 | 0.2 | ||||||||||||||||||||
| Net Income Before Taxes | (1.9 | ) | (1.9 | ) | (3.1 | ) | (3.1 | ) | (10.0 | ) | (2.0 | ) | (3.6 | ) | (5.0 | ) | (4.8 | ) | (15.4 | ) | (6.2 | ) | ||||||||||||
| Provision for Taxes | 0.0 | 0.0 | 0.0 | 0.0 | 0.0 | 0.0 | 0.0 | 0.0 | 0.0 | 0.0 | 0.0 | |||||||||||||||||||||||
| Net Income After Taxes | $ | (1.9 | ) | $ | (1.9 | ) | $ | (3.1 | ) | $ | (3.1 | ) | $ | (10.0 | ) | $ | (2.0 | ) | $ | (3.6 | ) | $ | (5.0 | ) | $ | (4.8 | ) | $ | (15.4 | ) | $ | (6.2 | ) | |
Diluted EPS | $ | (0.18 | ) | $ | (0.17 | ) | $ | (0.21 | ) | $ | (0.18 | ) | $ | (0.74 | ) | $ | (0.12 | ) | $ | (0.21 | ) | $ | (0.28 | ) | $ | (0.25 | ) | $ | (0.86 | ) | $ | (0.31 | ) | |
| Fully Diluted Shares Outstanding | 10.6 | 11.4 | 14.9 | 16.9 | 13.5 | 17.1 | 17.4 | 17.8 | 19.4 | 17.9 | 20.3 | |||||||||||||||||||||||
Net Revenue growth rate (Q/Q) sequential | 8.5 | % | 120.5 | % | 30.3 | % | 18.8 | % | — | 6.4 | % | 14.4 | % | 5.7 | % | 7.6 | % | — | 5.9 | % | ||||||||||||||
| Net Revenue growth rate (Y/Y) | 127.3 | % | 330.0 | % | 328.0 | % | 270.4 | % | 272.9 | % | 363.4 | % | 188.5 | % | 152.9 | % | 138.5 | % | 78.1 | % | 37.8 | % | ||||||||||||
Gross Margin | 78.0 | % | 79.7 | % | 78.6 | % | 80.0 | % | 79.3 | % | 80.1 | % | 78.5 | % | 80.4 | % | 81.0 | % | 80.0 | % | 79.7 | % | ||||||||||||
| Operating Margin | (79.4 | %) | (26.3 | %) | (40.6 | %) | (39.0 | %) | (40.8 | %) | (24.4 | %) | (38.0 | %) | (48.0 | %) | (42.6 | %) | (39.0 | %) | (52.2 | %) | ||||||||||||
- (a)
- Source: Blue Form 10-Q and 10-K SEC filings.
- (b)
- Excludes Stock-based Compensation, Amortization of Intangibles and other extraordinary items.
- (c)
- Pro Forma Revenue includes amounts relating to the fair value of warrants and common stock issued pursuant to the DaimlerChrysler Services Agreement.
- (d)
- Revenue is net of amounts relating to the fair value of warrants and common stock issued pursuant to the DaimlerChrysler Services Agreement which is consistent with Generally Accepted Accounting Principles ("GAAP").
44
BLUE PROJECTED BASE CASE QUARTERLY FINANCIALS(a)(b)
Projected Operating Results
(US$ in millions, except per share data)
| | CY 2001 | CY 2002 | |||||||||||||||||||||||||||||
|---|---|---|---|---|---|---|---|---|---|---|---|---|---|---|---|---|---|---|---|---|---|---|---|---|---|---|---|---|---|---|---|
| Fiscal Year end December | |||||||||||||||||||||||||||||||
| Q1A | Q2E | Q3E | Q4E | CY2001E | Q1E | Q2E | Q3E | Q4E | CY2002E | ||||||||||||||||||||||
| Pro Forma Revenue(c) | $ | 13.6 | $ | 14.2 | $ | 15.3 | $ | 17.2 | $ | 60.3 | $ | 18.0 | $ | 18.9 | $ | 20.3 | $ | 22.3 | $ | 79.5 | |||||||||||
| Chrysler Equity Subscriptions | 1.3 | 1.5 | 1.6 | 1.7 | 6.1 | 1.7 | 1.7 | 1.7 | 1.7 | 6.6 | |||||||||||||||||||||
| Revenue(d) | $ | 12.3 | $ | 12.7 | $ | 13.7 | $ | 15.4 | $ | 54.2 | $ | 16.3 | $ | 17.3 | $ | 18.7 | $ | 20.6 | $ | 72.9 | |||||||||||
| Cost of Revenue | 2.5 | 2.6 | 2.6 | 2.9 | 10.6 | 3.1 | 3.3 | 3.5 | 3.5 | 13.3 | |||||||||||||||||||||
| Gross Profit | 9.8 | 10.2 | 11.1 | 12.6 | 43.6 | 13.3 | 14.0 | 15.2 | 17.1 | 59.6 | |||||||||||||||||||||
| Operating Expenses: | |||||||||||||||||||||||||||||||
| Sales & Marketing | 7.0 | 6.8 | 7.1 | 7.0 | 28.0 | 7.3 | 7.1 | 7.1 | 7.0 | 28.5 | |||||||||||||||||||||
| General & Administrative | 6.1 | 6.3 | 6.4 | 6.6 | 25.4 | 6.5 | 6.7 | 6.7 | 6.8 | 26.7 | |||||||||||||||||||||
| Research & Development | 3.2 | 3.3 | 3.3 | 3.5 | 13.3 | 3.6 | 3.7 | 3.6 | 3.6 | 14.4 | |||||||||||||||||||||
| Operating Income | (6.4 | ) | (6.3 | ) | (5.8 | ) | (4.6 | ) | (23.1 | ) | (4.1 | ) | (3.4 | ) | (2.1 | ) | (0.3 | ) | (9.9 | ) | |||||||||||
| Interest and Other Income/(Expense) | 0.2 | (0.0 | ) | (0.1 | ) | (0.1 | ) | 0.1 | (0.1 | ) | 0.0 | 0.1 | 0.2 | 0.2 | |||||||||||||||||
| Net Income Before Taxes | (6.2 | ) | (6.4 | ) | (5.8 | ) | (4.6 | ) | (23.0 | ) | (4.2 | ) | (3.4 | ) | (2.0 | ) | (0.1 | ) | (9.7 | ) | |||||||||||
| Provision for Taxes | 0.0 | 0.0 | 0.0 | 0.0 | 0.0 | 0.0 | 0.0 | 0.0 | 0.0 | 0.0 | |||||||||||||||||||||
| Net Income After Taxes | $ | (6.2 | ) | $ | (6.4 | ) | $ | (5.8 | ) | $ | (4.6 | ) | $ | (23.0 | ) | $ | (4.2 | ) | $ | (3.4 | ) | $ | (2.0 | ) | $ | (0.1 | ) | $ | (9.7 | ) | |
Diluted EPS | $ | (0.31 | ) | $ | (0.31 | ) | $ | (0.29 | ) | $ | (0.23 | ) | $ | (1.13 | ) | $ | (0.21 | ) | $ | (0.16 | ) | $ | (0.10 | ) | $ | (0.01 | ) | $ | (0.47 | ) | |
| Fully Diluted Shares Outstanding | 20.3 | 20.4 | 20.5 | 20.5 | 20.4 | 20.5 | 20.5 | 20.5 | 20.5 | 20.5 | |||||||||||||||||||||
Net Revenue growth rate (Q/Q) sequential | 5.9 | % | 3.7 | % | 7.8 | % | 12.5 | % | — | 5.6 | % | 5.8 | % | 8.2 | % | 10.4 | % | — | |||||||||||||
| Net Revenue growth rate (Y/Y) | 37.8 | % | 24.9 | % | 27.4 | % | 33.2 | % | 30.7 | % | 32.9 | % | 35.6 | % | 36.1 | % | 33.6 | % | 34.5 | % | |||||||||||
Gross Margin | 79.7 | % | 79.8 | % | 80.8 | % | 81.3 | % | 80.4 | % | 81.2 | % | 81.1 | % | 81.4 | % | 82.9 | % | 81.7 | % | |||||||||||
| Operating Margin | (52.2 | %) | (49.7 | %) | (42.0 | %) | (29.5 | %) | (42.6 | %) | (25.4 | %) | (19.6 | %) | (11.2 | %) | (1.5 | %) | (13.6 | %) | |||||||||||
- (a)
- Quarter ending March 31, 2001 per Blue Form 10-Q for the period ended March 31, 2001. Projections per Blue Management's Base Case scenario as of May 24, 2001.
- (b)
- Excludes Stock-based Compensation, Amortization of Intangibles and other extraordinary items.
- (c)
- Pro Forma Revenue includes amounts relating to the fair value of warrants and common stock issued pursuant to the DaimlerChrysler Services Agreement.
- (d)
- Revenue is net of amounts relating to the fair value of warrants and common stock issued pursuant to the DaimlerChrysler Services Agreement which is consistent with Generally Accepted Accounting Principles ("GAAP").
45
Blue Balance Sheet
(US$ in millions)
| | March 31, 2001 | December 31, 2000 | ||||||
|---|---|---|---|---|---|---|---|---|
| Cash and Cash Equivalents | $ | 10.4 | $ | 16.6 | ||||
| Accounts Receivable | 10.4 | 8.9 | ||||||
| Other Current Assets | 1.5 | 1.7 | ||||||
| Total Current Assets | 22.3 | 27.1 | ||||||
Capital Assets, net | 15.1 | 14.3 | ||||||
| Intangible Assets, net | 14.4 | 15.6 | ||||||
| Other Assets | 0.7 | 1.0 | ||||||
| Total Assets | $ | 52.5 | $ | 57.9 | ||||
| Accounts Payable & Accrued Liabilities | $ | 2.7 | $ | 4.7 | ||||
| Accrued Liabilities | 3.1 | 2.2 | ||||||
| Deferred Revenues | 6.0 | 4.7 | ||||||
| Notes Payable | — | 0.3 | ||||||
| Current Portion of Software Financing Contract | 0.6 | 1.1 | ||||||
| Current Portion of Capital Lease Obligations | 0.7 | 0.9 | ||||||
| Total Current Liabilities | 13.1 | 13.8 | ||||||
Deferred Revenues | 1.3 | 1.3 | ||||||
| Software Financing Contract | 0.3 | 0.3 | ||||||
| Capital Lease Obligations | 0.2 | 0.3 | ||||||
| Total Non-current Liabilities | 1.7 | 1.9 | ||||||
Common Stock | 0.2 | 0.2 | ||||||
| Additional Paid-In Capital | 124.1 | 124.0 | ||||||
| Deferred Equity Subscriptions | (11.6 | ) | (13.0 | ) | ||||
| Deferred Equity Expenses | (0.7 | ) | (2.2 | ) | ||||
| Notes Receivable from Shareholders | (0.1 | ) | (0.1 | ) | ||||
| Accumulated Deficit | (74.2 | ) | (66.7 | ) | ||||
| Shareholders' Equity | 37.7 | 42.3 | ||||||
| Total Liabilities and Shareholders' Equity | $ | 52.5 | $ | 57.9 | ||||
- (a)
- Balance Sheet data per Blue Form 10-Q for the periods ended March 31, 2001 and December 31, 2000.
46
FORM OF SG COWEN FAIRNESS OPINION
47
Project Colors Presentation to the Special Committee of the Board of Directors June 2, 2001
INTRODUCTION
TABLE OF CONTENTS
TRANSACTION OVERVIEW
CERTAIN TRANSACTION BACKGROUND INFORMATION
TRANSACTION SUMMARY
TRANSACTION PREMIUMS ANALYSIS(a)
ANTICIPATED TIMETABLE
BLUE OVERVIEW
BLUE OVERVIEW (SEATTLE, WA)(a)
PRODUCTS AND SERVICES(a)
PRODUCTS AND SERVICES(a)(b)
BLUE RECENT EVENTS(a)
MANAGEMENT AND BOARD OF DIRECTORS(a)
SUMMARY OWNERSHIP PROFILE(a)
HISTORICAL STOCK PRICE PERFORMANCE(a)
ACQUISITION / DIVESTITURE HISTORY
FINANCIAL SUMMARY(a)
INCOME STATEMENT
COMPARISON OF BASE CASE AND OPTIMISTIC CASE(a)
BLUE PROJECTED CASH FLOW ANALYSIS
BLUE PROJECTED BALANCE SHEET ANALYSIS
BLUE SUMMARY CAPITALIZATION
VALUATION CONSIDERATIONS
TRANSACTION PREMIUMS ANALYSIS(a)
IMPLIED MULTIPLES OFFERED VS. INDUSTRY TRADING MULTIPLES(a)
SELECTED COMPANY ANALYSIS
IMPLIED MULTIPLES OFFERED VS. SELECTED M&A TRANSACTIONS(a)
IMPLIED PREMIUMS OFFERED VS. SELECTED M&A TRANSACTIONS(a)
SELECTED TRANSACTION ANALYSIS(a)
IMPLIED PREMIUMS VS. RECENT TECHNOLOGY GOING PRIVATE TRANSACTIONS(a)
PREMIUMS PAID IN RECENT TECHNOLOGY GOING PRIVATE TRANSACTIONS(a)
DISCOUNTED CASH FLOW ANALYSIS
APPENDICES
QUARTERLY FINANCIAL STATEMENTS
BLUE HISTORICAL QUARTERLY FINANCIALS(a)(b)
BLUE PROJECTED BASE CASE QUARTERLY FINANCIALS(a)(b)
BLUE BALANCE SHEET(a)
FORM OF SG COWEN FAIRNESS OPINION