UNITED STATES
SECURITIES AND EXCHANGE COMMISSION
Washington, D.C. 20549
FORM 6-K
REPORT OF FOREIGN PRIVATE ISSUER
PURSUANT TO RULE 13a-16 OR 15d-16 OF
THE SECURITIES EXCHANGE ACT OF 1934
For the month of May 2011
Commission File No. 0-30148
PNI DIGITAL MEDIA INC.
(Translation of registrant's name into English)
590 - 425 Carrall Street, Vancouver, British Columbia V6B 6E3 Canada
(Address of principal executive office)
[Indicate by check mark whether the registrant files or will file annual reports under cover of Form 20-F or Form 40-F]
Form 20-F x Form 40-F ¨
Indicate by check mark if the registrant is submitting the Form 6-K in paper as permitted by Regulation S-T Rule 101(b)(1) ¨
Note: Regulation S-T Rule 101(b)(1) only permits the submission in paper of a Form 6-K if submitted solely to provide an attached annual report to security holders.
Indicate by check mark if the registrant is submitting the Form 6-K in paper as permitted by Regulation S-T Rule 101(b)(7) ¨
Note: Regulation S-T Rule 101(b)(7) only permits the submission in paper of a Form 6-K if submitted to furnish a report or other document that the registrant foreign private issuer must furnish and make public under the laws of the jurisdiction in which the registrant is incorporated, domiciled or legally organized (the registrant's "home country"), or under the rules of the home country exchange on which the registrant's securities are traded, as long as the report or other document is not a press release, is not required to be and has not been distributed to the registrant's security holders, and, if discussing a material event, has already been the subject of a Form 6-K submission or other Commission filing on EDGAR.
Indicate by check mark whether by furnishing the information contained in this Form, the registrant is also thereby furnishing the information to the Commission pursuant to Rule 12g3-2(b) under the Securities Exchange Act of 1934.
Yes ¨ No x
If "Yes" is marked, indicate below the file number assigned to the registrant in connection with Rule 12g3-2(b):
82 -
SIGNATURES
Pursuant to the requirements of the Securities Exchange Act of 1934, the registrant has duly caused this report to be signed on its behalf by the undersigned, thereunto duly authorized.
PNI DIGITAL MEDIA INC.
Date: May 26, 2011
| /s/ Simon Bodymore | |
| Simon Bodymore | |
| Chief Financial Officer |
PNI Digital Media Inc.
Unaudited Interim Consolidated Financial Statements
For the three and six month periods ended March 31, 2011
NOTICE OF NO AUDITOR REVIEW OF INTERIM FINANCIAL STATEMENTS
The accompanying unaudited interim financial statements of PNI Digital Media Inc. (the “Company”) have been prepared by and are the responsibility of the Company’s management. The Company’s independent auditor has not performed a review of these financial statements in accordance with the standards established by the Canadian Institute of Chartered Accountants for a review of interim financial statements by an entity’s auditor.
| PNI Digital Media Inc. |
| Consolidated Balance Sheets |
| Unaudited – Prepared by Management |
| (expressed in Canadian dollars) |
| March 31, 2011 | September 30, 2010 | |||||||
| Assets | ||||||||
| Current assets | ||||||||
| Cash and cash equivalents | $ | 4,745,436 | $ | 4,690,355 | ||||
| Accounts receivable (note 5) | 3,782,818 | 5,302,865 | ||||||
| Prepaid expenses and other current assets | 590,213 | 541,026 | ||||||
| Current portion of future income tax asset | 1,082,060 | 1,026,651 | ||||||
| 10,200,527 | 11,560,897 | |||||||
| Property and equipment | 5,617,962 | 5,230,829 | ||||||
| Future income tax asset | 4,531,907 | 4,953,934 | ||||||
| Intangible assets | 691,821 | 1,115,794 | ||||||
| Goodwill | 634,603 | 658,904 | ||||||
| $ | 21,667,946 | $ | 23,520,358 | |||||
| Liabilities | ||||||||
| Current liabilities | ||||||||
| Accounts payable and accrued liabilities | $ | 3,667,556 | $ | 5,471,878 | ||||
| Current portion of deferred revenue | 423,910 | 613,081 | ||||||
| Current portion of capital lease obligations | - | 107,964 | ||||||
| Future income tax liability | 109,772 | 119,081 | ||||||
| 4,201,238 | 6,312,004 | |||||||
| Deferred revenue | 55,713 | 78,876 | ||||||
| 4,256,951 | 6,390,880 | |||||||
| Shareholders’ Equity (note 6) | ||||||||
| Share capital | $ | 66,633,431 | $ | 66,200,215 | ||||
| Contributed surplus | 18,944,573 | 18,933,619 | ||||||
| 85,578,004 | 85,133,834 | |||||||
| Deficit | (65,453,778 | ) | (65,684,820 | ) | ||||
| Accumulated other comprehensive loss | (2,713,231 | ) | (2,319,536 | ) | ||||
| (68,167,009 | ) | (68,004,356 | ) | |||||
| 17,410,995 | 17,129,478 | |||||||
| $ | 21,667,946 | $ | 23,520,358 | |||||
| Approved by the Board of Directors | |||
| “Kyle Hall” | Director | “Peter Fitzgerald” | Director |
The accompanying notes are an integral part of these consolidated financial statements
PNI Digital Media Inc. |
| Consolidated Statements of (Loss) Earnings and Comprehensive (Loss) Gain |
| Unaudited – Prepared by Management |
| (expressed in Canadian dollars) |
| Three Months Ended | Six Months Ended | |||||||||||||||
| March 31, 2011 | March 31, 2010 | March 31, 2011 | March 31, 2010 | |||||||||||||
| Revenue (note 8) | $ | 5,031,263 | $ | 5,261,722 | $ | 12,765,068 | $ | 13,017,935 | ||||||||
| Expenses | ||||||||||||||||
| Network delivery | 992,498 | 1,238,269 | 2,482,453 | 3,185,953 | ||||||||||||
| Software development | 2,879,128 | 1,922,796 | 5,607,417 | 3,847,388 | ||||||||||||
| General and administration | 1,056,037 | 1,009,289 | 2,079,828 | 2,090,047 | ||||||||||||
| Sales and marketing | 257,919 | 215,027 | 561,029 | 455,530 | ||||||||||||
| Amortization | 692,853 | 1,322,910 | 1,382,232 | 2,695,726 | ||||||||||||
| 5,878,435 | 5,708,291 | 12,112,959 | 12,274,644 | |||||||||||||
| (Loss) earnings from operations before the undernoted | (847,172 | ) | (446,569 | ) | 652,109 | 743,291 | ||||||||||
| Realized foreign exchange (loss) | (57,549 | ) | (40,434 | ) | (82,998 | ) | (60,575 | ) | ||||||||
| Unrealized foreign exchange (loss) gain | (104,980 | ) | 458,835 | 90,908 | 626,808 | |||||||||||
| Interest income | - | 253 | 48 | 679 | ||||||||||||
| Interest expense – capital lease | - | (21,915 | ) | (5,536 | ) | (49,238 | ) | |||||||||
| Interest expense - other | (15 | ) | - | (15 | ) | (1,560 | ) | |||||||||
| Loss on disposal of property and equipment | (71,241 | ) | - | (90,713 | ) | - | ||||||||||
| Loss on settlement of asset retirement obligation | - | (4,810 | ) | - | (4,810 | ) | ||||||||||
| (233,785 | ) | 391,929 | (88,306 | ) | 511,304 | |||||||||||
| (Loss) earnings before income taxes | (1,080,957 | ) | (54,640 | ) | 563,803 | 1,254,595 | ||||||||||
| Current income tax benefit (expense) | - | - | - | - | ||||||||||||
| Future income tax benefit (expense) | 228,478 | (36,246 | ) | (332,761 | ) | (101,158 | ) | |||||||||
| Net (loss) earnings | (852,479 | ) | (90,886 | ) | 231,042 | 1,153,437 | ||||||||||
| Other comprehensive gain (loss): | ||||||||||||||||
| Unrealized foreign exchange gain (loss) on translation of self sustaining foreign operations | 62,942 | (659,784 | ) | (393,695 | ) | (971,840 | ) | |||||||||
| Comprehensive (loss) gain | $ | (789,537 | ) | $ | (750,670 | ) | $ | (162,653 | ) | $ | 181,597 | |||||
| (Loss) earnings per share (note 6) | ||||||||||||||||
| Basic | $ | (0.03 | ) | $ | (0.00 | ) | $ | 0.01 | $ | 0.03 | ||||||
| Fully diluted | $ | (0.03 | ) | $ | (0.00 | ) | $ | 0.01 | $ | 0.03 | ||||||
The accompanying notes are an integral part of these consolidated financial statements
| PNI Digital Media Inc. |
| Consolidated Statements of Deficit |
| Unaudited – Prepared by Management |
| (expressed in Canadian dollars) |
| Three Months Ended | Six Months Ended | |||||||||||||||
March 31, 2011 | March 31, 2010 | March 31, 2011 | March 31, 2010 | |||||||||||||
| Balance, beginning of period | $ | (64,601,299 | ) | $ | (71,292,491 | ) | $ | (65,684,820 | ) | $ | (72,536,814 | ) | ||||
| Net (loss) earnings for the period | (852,479 | ) | (90,886 | ) | 231,042 | 1,153,437 | ||||||||||
| Balance, end of the period | $ | (65,453,778 | ) | $ | (71,383,377 | ) | $ | (65,453,778 | ) | $ | (71,383,377 | ) | ||||
The accompanying notes are an integral part of these consolidated financial statements
| PNI Digital Media Inc. |
| Consolidated Statements of Cash Flows |
| Unaudited – Prepared by Management |
| (expressed in Canadian dollars) |
| Three Months Ended | Six Months Ended | |||||||||||||||
March 31, 2011 | March 31, 2010 | March 31, 2011 | March 31, 2010 | |||||||||||||
| Cash flows from operating activities | ||||||||||||||||
| Net (loss) earnings for the period | $ | (852,479 | ) | $ | (90,886 | ) | $ | 231,042 | $ | 1,153,437 | ||||||
| Items not affecting cash | ||||||||||||||||
| Amortization | 692,853 | 1,322,910 | 1,382,232 | 2,695,726 | ||||||||||||
| Stock-based compensation expense | 160,303 | 181,872 | 359,400 | 366,949 | ||||||||||||
| Unrealized foreign exchange loss (gain) | 104,980 | (458,835 | ) | (90,908 | ) | (626,808 | ) | |||||||||
| Allowance for doubtful accounts | - | 16,656 | 9,086 | 28,516 | ||||||||||||
| Loss on disposal of property and equipment | 71,241 | - | 90,713 | - | ||||||||||||
| Future income tax (benefit) expense | (228,478 | ) | 36,246 | 332,761 | 101,158 | |||||||||||
| Loss on settlement of asset retirement obligation | - | 4,810 | - | 4,810 | ||||||||||||
| Accretion expense included in general and administration expense | - | 36,357 | - | 79,426 | ||||||||||||
| (51,580 | ) | 1,049,130 | 2,314,326 | 3,803,214 | ||||||||||||
| Net change in non-cash working capital Items (note 12) | 1,370,849 | (4,189,387 | ) | (1,128,367 | ) | (2,603,655 | ) | |||||||||
| Provision for unrecoverable lease payments | - | (144,707 | ) | - | (180,336 | ) | ||||||||||
| Payments made to settle asset retirement obligations | - | (13,978 | ) | - | (45,071 | ) | ||||||||||
| 1,319,269 | (3,298,942 | ) | 1,185,959 | 974,152 | ||||||||||||
| Cash flows from investing activities | ||||||||||||||||
| Purchase of property and equipment | (479,393 | ) | (77,558 | ) | (857,417 | ) | (301,660 | ) | ||||||||
| Proceeds on disposal of property and equipment | 1,650 | 2,459 | - | |||||||||||||
| (477,743 | ) | (77,558 | ) | (854,958 | ) | (301,660 | ) | |||||||||
| Cash flows from financing activities | ||||||||||||||||
| Proceeds on exercise of options | 364,720 | - | 364,720 | - | ||||||||||||
| Repurchase of common shares | (139,589 | ) | - | (279,950 | ) | - | ||||||||||
| Repayment of loan payable | - | - | - | (937,548 | ) | |||||||||||
| Repayment of capital lease obligations | - | (100,602 | ) | (107,964 | ) | (195,799 | ) | |||||||||
| Repayment of loan used to finance the acquisition of WorksMedia Limited | - | (463,795 | ) | - | (936,343 | ) | ||||||||||
| 225,131 | (100,602 | ) | (23,194 | ) | (2,069,690 | ) | ||||||||||
| Effect of changes in foreign exchange rates on cash and cash equivalents | (58,785 | ) | (20,178 | ) | (252,726 | ) | (252,550 | ) | ||||||||
| Increase (decrease) in cash and cash equivalents during the period | 1,007,872 | (3,961,075 | ) | 55,081 | (1,649,748 | ) | ||||||||||
| Cash and cash equivalents - beginning of period | 3,737,564 | 6,548,611 | 4,690,355 | 4,237,284 | ||||||||||||
| Cash and cash equivalents - end of period | $ | 4,745,436 | $ | 2,587,536 | $ | 4,745,436 | $ | 2,587,536 | ||||||||
The accompanying notes are an integral part of these consolidated financial statements
| PNI Digital Media Inc. |
| Notes to Consolidated Financial Statements |
| Unaudited – Prepared by Management |
| (expressed in Canadian dollars) |
| 1. | Nature of operations |
On June 4, 2009, the Company changed its name from PhotoChannel Networks Inc. to PNI Digital Media Inc.
PNI Digital Media Inc. (the “Company”) offers the photofinishing retailer and its customers an online and in-store solution for producing prints and gifting products from their digital images. The Company’s online platform electronically connects the photofinishing retailer and its customers through the internet and provides digital image delivery, hosting, transaction processing and storage. In addition, the Company provides the photofinishing retailer with kiosk software which allows consumers to offload digital images from their digital media and order prints and gifting products within the retailer’s locations. The kiosk software is also connected to the Company’s online platform permitting customers in-store to order gifting products from the kiosk, which are then transmitted from the kiosk to a remote fulfillment facility via the online platform.
| 2. | Summary of significant accounting policies |
General
These unaudited interim consolidated financial statements have been prepared in accordance with generally accepted accounting principles (GAAP) in Canada, using the same accounting policies as outlined in Note 2 to the audited consolidated financial statements for the year ended September 30, 2010. These unaudited interim consolidated financial statements do not include all disclosures required for annual financial statements and should be read in conjunction with the audited consolidated financial statements for the year ended September 30, 2010.
In the opinion of management, all adjustments (which include reclassifications and normal recurring adjustments) necessary to present fairly the consolidated financial position, consolidated earnings and comprehensive earnings, and consolidated cash flows as at and for the three months ended March 31, 2011 and for all periods presented, have been made. All amounts herein are expressed in Canadian dollars unless otherwise noted.
Basis of consolidation
These consolidated financial statements are prepared in accordance with generally accepted accounting principles (“GAAP”) in Canada, and include the accounts of the Company and each of its wholly-owned subsidiaries, PhotoChannel Capital Inc., PhotoChannel Management Inc., PNI Digital Media Ltd., PNI Digital Media Europe Ltd., Pixology Incorporated and WorksMedia Limited.
All material intercompany balances and transactions are eliminated upon consolidation.
| PNI Digital Media Inc. |
| Notes to Consolidated Financial Statements |
| Unaudited – Prepared by Management |
| (expressed in Canadian dollars) |
Reporting currency and foreign currency translation
These consolidated financial statements are reported in Canadian dollars. Foreign currency denominated revenues and expenses are translated using average rates of exchange during the year. Foreign currency denominated assets and liabilities are translated at the rate of exchange in effect at the balance sheet date.
The Company translates the assets and liabilities of self-sustaining foreign operations to Canadian dollars at the rate of exchange prevailing at the balance sheet dates and revenues and expenses of those operations are translated using the average rates of exchange during the year. Gains and losses resulting from these translation adjustments for self-sustaining foreign operations are recorded in accumulated other comprehensive income, a component of shareholders’ equity, until there is a realized reduction in the net investment in the foreign operation.
| 3. | Recently issued accounting standards |
CICA Handbook Sections 1582, Business Combinations; 1601, Consolidated Financial Statements and 1602, Non-Controlling Interests
In January 2008, the CICA issued Handbook Sections 1582, Business Combinations; 1601, Consolidated Financial Statements and 1602, Non-Controlling Interests. These sections replace the former CICA Handbook Section 1581, Business Combinations and CICA 1600, Consolidated Financial Statements and establish a new section for accounting for a non-controlling interest in a subsidiary. These sections also provide the Canadian equivalent to IFRS 3, Business Combinations and IAS 27, Consolidated and Separate Financial Statements.
CICA 1582 is effective for business combinations for which the acquisition date is on or after the beginning of the first annual reporting period beginning on or after January 1, 2011. CICA 1601 and CICA 1602 apply to interim and annual consolidated financial statements relating to years beginning on or after January 1, 2011.
EIC 175, Revenue Arrangements with Multiple Developments
In December 2009, the CICA issued Emerging Issue Committee Abstract (“EIC”) 175, Revenue Arrangement with multiple Deliverables an amendment to EIC 142, “Revenue Arrangements with Multiple Deliverables”. EIC 175 provides guidance on certain aspects of the accounting for arrangements under which the Company will perform multiple revenue-generating activities. Under the new guidance, when vendor specific objective evidence or third party evidence for deliverables in an arrangement cannot be determined, a best estimate of the selling price is required to separate deliverables and allocate arrangement consideration using the relative selling price method. EIC 175 also includes new disclosure requirements on how the application of the relative selling price method affects the timing and amount of revenue recognition. EIC 175 is effective prospectively, with retrospective adoption permitted, for revenue arrangements entered into or materially modified in fiscal years beginning on or after January 1, 2011.
| PNI Digital Media Inc. |
| Notes to Consolidated Financial Statements |
| Unaudited – Prepared by Management |
| (expressed in Canadian dollars) |
Management is currently in the process of determining the impact of this EIC on the Company’s consolidated financial statements.
| 4. | Seasonality of operations |
Demand for photofinishing products is highly seasonal, with a significant proportion of recurring revenues being generated during the Company’s first fiscal (fourth calendar) quarter, ended December 31. The Company’s rapid growth over the past several years may have overshadowed seasonal or cyclical factors which might have influenced business to date. Due to the seasonal nature of the Company’s business, the results of operations for any interim period are not necessarily indicative of the results of operations to be expected for the fiscal year.
| 5. | Accounts receivable |
As at March 31, 2011 | As at September 30, 2010 | |||||||
| Trade accounts receivable | $ | 3,800,202 | $ | 5,425,805 | ||||
| Allowance for doubtful accounts | (182,766 | ) | (176,531 | ) | ||||
| 3,617,436 | 5,249,274 | |||||||
| Commodity taxes recoverable | 144,562 | 53,591 | ||||||
| Other | 20,820 | - | ||||||
| Total | $ | 3,782,818 | $ | 5,302,865 | ||||
Reconciliation of changes in allowance for doubtful accounts:
As at March 31, 2011 | As at September 30, 2010 | |||||||
| Balance, beginning of period | $ | 176,531 | $ | 154,945 | ||||
| Increase in allowance for doubtful accounts | 9,086 | 33,781 | ||||||
| Write-off of bad debts | - | (9,945 | ) | |||||
| Impact of foreign currency translation | (2,851 | ) | (2,250 | ) | ||||
| Balance, end of period | $ | 182,766 | $ | 176,531 | ||||
During the six month period ended March 31, 2011 the Company incurred bad debt expenses of $9,086 (six month period ending March 31, 2010 - $28,516).
| PNI Digital Media Inc. |
| Notes to Consolidated Financial Statements |
| Unaudited – Prepared by Management |
| (expressed in Canadian dollars) |
| 6. | Share capital and stock options |
a) Consolidated statement of shareholders’ equity
| Capital stock | ||||||||||||||||||||||||
Number of Common Shares | Amount | Contributed surplus | Deficit | Accumulated other comprehensive loss | Total Shareholders’ equity | |||||||||||||||||||
| Balance - September 30, 2010 | 33,853,782 | $ | 66,200,215 | $ | 18,933,619 | $ | (65,684,820 | ) | $ | (2,319,536 | ) | $ | 17,129,478 | |||||||||||
| Stock-based compensation recorded in net earnings | - | - | 103,539 | - | - | 103,539 | ||||||||||||||||||
| Compensation expense in connection with acquisition of WorksMedia Limited | - | - | 95,558 | - | - | 95,558 | ||||||||||||||||||
| Cancellation of shares repurchased | (115,200 | ) | (43,143 | ) | 43,143 | - | - | - | ||||||||||||||||
| Purchase of share capital for cancellation (98,300 shares) | - | (161,065 | ) | - | - | - | (161,065 | ) | ||||||||||||||||
| Net earnings for the period | - | - | - | 1,083,521 | - | 1,083,521 | ||||||||||||||||||
| Other comprehensive loss | - | - | - | - | (456,637 | ) | (456,637 | ) | ||||||||||||||||
| Balance – December 31, 2010 | 33,738,582 | $ | 65,996,007 | $ | 19,175,859 | $ | (64,601,299 | ) | $ | (2,776,173 | ) | $ | 17,794,394 | |||||||||||
| Issuance of shares on exercise of options | 291,776 | 498,937 | (134,217 | ) | - | - | 364,720 | |||||||||||||||||
| Stock-based compensation recorded in net profit | - | - | 92,455 | - | - | 92,455 | ||||||||||||||||||
| Compensation expense in connection with acquisition of WorksMedia Limited | - | - | 67,848 | - | - | 67,848 | ||||||||||||||||||
| Issuance of shares held in escrow | 178,500 | 290,952 | (290,952 | ) | - | - | - | |||||||||||||||||
| Cancellation of shares repurchased | (88,500 | ) | (33,580 | ) | 33,580 | - | - | - | ||||||||||||||||
| Purchase of share capital for cancellation (75,400 shares) | - | (118,885 | ) | - | - | - | (118,885 | ) | ||||||||||||||||
| Net loss for the period | - | - | - | (852,479 | ) | - | (852,479 | ) | ||||||||||||||||
| Other comprehensive gain | - | - | - | - | 62,942 | 62,942 | ||||||||||||||||||
| Balance - March 31, 2011 | 34,120,358 | $ | 66,633,431 | $ | 18,944,573 | $ | (65,453,778 | ) | $ | (2,713,231 | ) | $ | 17,410,995 | |||||||||||
| b) | Options |
| The Company has a stock option plan (the “Plan”) which is described in note 12(d) to the most recent audited consolidated financial statements for the year ended September 30, 2010. The Plan grants to directors, employees and consultants of the Company the option to purchase common shares of the Company. The Plan allows for a maximum of 10% of the Company’s issued and outstanding common shares be reserved for issuance, less any previously granted and outstanding options. The exercise price of each option is determined by the market price of the Company’s stock on the date of the grant and an options’ maximum term is five years. Options vest over eighteen (18) months. |
| PNI Digital Media Inc. |
| Notes to Consolidated Financial Statements |
| Unaudited – Prepared by Management |
| (expressed in Canadian dollars) |
During the six month period ended March 31, 2011, the Company granted 500,000 options to officers and directors (period ended March 31, 2010: nil). The weighted average fair value of each option issued was estimated at the grant date using the Black-Scholes option-pricing model using the following assumptions:
| Description | Six Months Ended March 31, 2011 | |||
| Exercise price | $ | 1.55 | ||
| Market price on date of grant | 1.55 | |||
| Expected volatility | 60 | % | ||
| Risk-free interest rate | 1.79 | % | ||
| Expected life (years) | 4.5 | |||
| Expected dividend yield | 0 | % | ||
| Weighted average grant-date fair value ($ per share) | $ | 0.77 | ||
| The Company recorded $132,156 in compensation expense associated with stock options. |
| c) | Performance Share Unit Awards |
A Performance Share Unit (“PSU”) is a right granted to an executive level employee to receive one common share of the Company. The PSU’s will be earned only if performance goals over the performance periods established by or under the direction of the Compensation Committee are met. PSU’s vest over three years in equal annual instalments on each anniversary of the date of grant and will be delivered in common stock at the end of each vesting period, based on the recipient’s actual performance compared to the target performance and may equal from zero percent (0%) to one hundred percent (100%) of the target award. The fair value of each PSU awarded is based upon the quoted price of the Company’s stock on the date of grant. The Company recognizes the expense based on an estimate at the end of each reporting period of the degree to which the performance goals are being met and adjusts the estimate at the conclusion of the performance period. The expense is amortized on a straight-line basis over the vesting period.
During the six months ended March 31, 2010, the Company granted 100,000 target PSU’s at a fair value of $1.55 per share. The Company recognized compensation expense of $11,238 during the six months ended March 31, 2011 (period ended March 31, 2010: nil).
| PNI Digital Media Inc. |
| Notes to Consolidated Financial Statements |
| Unaudited – Prepared by Management |
| (expressed in Canadian dollars) |
| d) | Restricted Share Unit Awards |
A Restricted Share Unit (“RSU”) is a right granted to a non-executive director or key employee to receive one common share of the Company on a time vested basis. The fair value of the restricted share awards is determined based upon the number of shares granted and the quoted price of the Company’s stock on the date of grant. Restricted shares vest over three years in equal annual instalments on each anniversary of the date of grant and will be delivered in common stock at the end of each vesting period. The Company recognizes the expense on a straight-line basis over the vesting period.
During the six month period ended March 31, 2011, 206,600 RSU’s were awarded at a fair value of $1.55 per share; consisting of 146,600 awarded to key employees and 60,000 awarded to non-executive directors of the Company. The Company recognized compensation expense of $52,600 during the six months ended March 31, 2011 (period ended March 31, 2010: nil).
| e) | Shares held in escrow |
In connection with the acquisition of WorksMedia Limited, which was completed in March 2009, 750,000 common shares of the Company were issued. 214,500 of these common shares have been included as part of the purchase consideration, while the remaining 535,500 common shares are only being released from escrow upon the continued employment of the Principle Vendors over a three year period.
On March 10, 2011, the Company released 250,000 common shares consisting of 71,500 common shares included as part of the purchase consideration while the remaining 178,500 common shares released related to the continued employment of the Principle Vendors. As at March 31, 2011, 178,500 common shares remain in escrow and have been excluded from the number of common shares shown as outstanding and will only be recognized as they are released from escrow.
| f) | Normal course issuer bid |
On April 15, 2010, the Company received approval from the TSX Venture Exchange (“TSX-V”) for a Normal Course Issuer Bid (the “Bid”) that enables the Company to purchase and cancel up to 340,000, or approximately 1%, of its outstanding common shares between May 1, 2010 and April 30, 2011. During the three month period ended December 31, 2010 the Company received approval from the TSX-V to revise the authorized purchase amount from 340,000 shares to approximately 1.7 million shares, or 5% of the outstanding common shares of the Company.
As at September 30, 2010, the Company held 30,000 shares that had been purchased for cancellation. During the six month period ended March 31, 2011, the Company purchased a further 173,700 shares under the Bid for a total purchase price of $279,950. As at March 31, 2011, all 203,700 of these shares have been cancelled.
| PNI Digital Media Inc. |
| Notes to Consolidated Financial Statements |
| Unaudited – Prepared by Management |
| (expressed in Canadian dollars) |
On cancellation of these 203,700 shares, $76,723, representing the difference between the purchase price and the average book value of the common shares was recorded as an adjustment to contributed surplus.
Since inception of the Bid, the Company has purchased 273,700 shares for a purchase price of $430,553.
| g) | Earnings per share |
The following is a reconciliation of the numerator and the denominators used for the computation of basic and diluted earnings per share amounts:
| Three Months Ended | Six Months Ended | |||||||||||||||
March 31, 2011 | March 31, 2010 | March 31, 2011 | March 31, 2010 | |||||||||||||
| Net (loss) earnings for the period (numerator) | $ | (852,479 | ) | $ | (90,866 | ) | $ | 231,042 | $ | 1,153,437 | ||||||
| Weighted average number of shares outstanding (denominator) | ||||||||||||||||
| Basic | 33,788,064 | 33,749,332 | 33,782,850 | 33,728,278 | ||||||||||||
| Effect of dilutive securities: | ||||||||||||||||
| Stock options | - | - | 85,181 | 133,516 | ||||||||||||
| RSU’s | - | - | 18,765 | |||||||||||||
| PSU’s | - | - | 7,535 | |||||||||||||
| Total | 33,788,064 | 33,749,332 | 33,894,331 | 33,861,794 | ||||||||||||
| PNI Digital Media Inc. |
| Notes to Consolidated Financial Statements |
| Unaudited – Prepared by Management |
| (expressed in Canadian dollars) |
| 7. | Segment information |
The Company has two operating segments that have similar economic characteristics which are aggregated into a single reportable segment based on the manner in which the Company has organized its operations and provision of financial information to senior management.
The Company’s sales by geographical area are as follows:
| Three Months Ended | Six Months Ended | |||||||||||||||
| Description | March 31, 2011 | March 31, 2010 | March 31, 2011 | March 31, 2010 | ||||||||||||
| Canada | $ | 1,056,419 | $ | 1,086,378 | $ | 2,572,043 | $ | 2,693,919 | ||||||||
| United States | 2,797,333 | 2,728,829 | 7,620,472 | 7,117,126 | ||||||||||||
| United Kingdom | 1,121,598 | 1,355,921 | 2,446,901 | 2,994,009 | ||||||||||||
| Other | 55,913 | 90,594 | 125,652 | 212,881 | ||||||||||||
| Total | $ | 5,031,263 | $ | 5,261,722 | $ | 12,765,068 | $ | 13,017,935 | ||||||||
Revenue is attributed to the geographic location of the Company’s customer.
As at March 31, 2011 and September 30, 2010, the Company’s assets by geographical location are as follows:
| Canada | United Kingdom | Total | ||||||||||
| March 31, 2011 | ||||||||||||
| Property and equipment | $ | 5,613,002 | $ | 4,960 | $ | 5,617,962 | ||||||
| Goodwill and intangible assets | $ | 77,382 | $ | 1,249,042 | $ | 1,326,424 | ||||||
| September 30, 2010 | ||||||||||||
| Property and equipment | $ | 5,216,602 | $ | 14,227 | $ | 5,230,829 | ||||||
| Goodwill and intangible assets | $ | 77,382 | $ | 1,697,316 | $ | 1,774,698 | ||||||
Major customers representing 10% or more of the Company’s sales for the period are as follows:
| Three Months Ended | Six Months Ended | |||||||||||||||
| Description | March 31, 2011 | March 31, 2010 | March 31, 2011 | March 31, 2010 | ||||||||||||
| Customer A | $ | 1,173,562 | $ | 1,292,861 | $ | 3,331,109 | $ | 3,725,437 | ||||||||
| Customer B | $ | 663,330 | $ | 592,572 | $ | 1,789,416 | $ | 1,529,285 | ||||||||
| Customer C | $ | 544,478 | $ | 638,888 | $ | 1,160,004 | $ | 1,356,079 | ||||||||
| Customer D | $ | 1,884,424 | $ | 1,911,408 | $ | 4,900,674 | $ | 4,719,502 | ||||||||
| PNI Digital Media Inc. |
| Notes to Consolidated Financial Statements |
| Unaudited – Prepared by Management |
| (expressed in Canadian dollars) |
| 8. | Revenue |
| Three Months Ended | Six Months Ended | |||||||||||||||
| Description | March 31, 2011 | March 31, 2010 | March 31, 2011 | March 31, 2010 | ||||||||||||
| Transaction fees | $ | 3,454,606 | $ | 3,727,516 | $ | 9,754,267 | $ | 10,033,737 | ||||||||
| Software licenses and installation fees | 777,775 | 756,983 | 1,434,236 | 1,532,348 | ||||||||||||
| Membership fees | 416,846 | 445,777 | 865,662 | 842,179 | ||||||||||||
| Professional fees | 7,477 | 62,236 | 21,822 | 109,293 | ||||||||||||
| Archive fees | 374,559 | 269,210 | 689,081 | 500,378 | ||||||||||||
| Total | $ | 5,031,263 | $ | 5,261,722 | $ | 12,765,068 | $ | 13,017,935 | ||||||||
Product revenue is presented in note 13(a)
| 9. | Related Party Transactions |
During the three month period ended March 31, 2011, the Company incurred legal fees of $32,004 (period ended March 31, 2010 - $31,382) for services provided by a law firm of which a director of the Company is a partner. Accounts payable and accrued liabilities at March 31, 2011 included $24,323 (September 30, 2010 $4,968) related to these services.
During the three month period ended March 31, 2011, the Company incurred consulting fees of $14,900 (period ended March 31, 2010 - $nil) for services provided by a company of which a Director and Officer of the Company controls. Accounts payable and accrued liabilities at March 31, 2011 included $nil (September 30, 2010 - $4,993) related to these services.
During the three month period ended March 31, 2011, the Company incurred expenses in relation to setting up e-mail marketing campaigns on behalf of a number of our retail customers of $nil (period ending March 31, 2010 - $11,316) and website services of $1,500 (period ended March 31, 2010 - $1,275) of which a director of the Company is Chairman and Chief Executive Officer. Accounts payable and accrued liabilities at March 31, 2011 included $500 (September 30, 2010 - $7,128) related to these services. The amounts charged were recorded at their exchange amount, which is the amount of consideration established and agreed to by the related parties and having normal trade terms.
The Company shares its UK premises with another company of which an Officer is a majority shareholder. During the three month period ended March 31, 2011, the Company was recharged its proportional share of office running costs totalling $54,132 (period ended March 31, 2010: $50,619) by this related party. In addition, during the three month period ended March 31, 2011, the Company used the software development services of this company, incurring costs of $17,064 (period ended March 31, 2010: $39,087). At March 31, 2011, accounts payable included $28,294 (September 30, 2010: $25,118) related to these services and cost recharges.
| PNI Digital Media Inc. |
| Notes to Consolidated Financial Statements |
| Unaudited – Prepared by Management |
| (expressed in Canadian dollars) |
| 10. | Commitments |
At March 31, 2011, the Company was committed to purchase items of equipment with a cost of $39,073 (September 30, 2010 - $34,802).
The contractual obligations and payments due as at March 31, 2011 are as follows:
| Payments due by period | ||||||||||||||||
| Total | Less than 1 year | 1-3 years | 3-5 years | |||||||||||||
| Property leases | 877,939 | 263,382 | 526,763 | 87,794 | ||||||||||||
| Other service agreements | 7,870,550 | 1,615,560 | 3,363,460 | 2,891,530 | ||||||||||||
| Purchase obligations | 39,073 | 39,073 | - | - | ||||||||||||
| 8,787,562 | 1,918,015 | 3,890,223 | 2,979,324 | |||||||||||||
During the year ended September 30, 2010, the Company received notice from a former customer that a possible patent infringement had been brought to their attention regarding software which in previous years had been sold by one of our subsidiaries and which is unrelated to the PNI Platform and to the Company’s kiosk software. During the quarter ended December 31, 2010, the Company received notice from its former customer that a settlement had been reached between it and the entity that had been making the claims of patent infringement. As a result, the Company’s former customer requested that the Company pay a portion of the settlement amount under an indemnification clause included in the contract that was in place during the previous relationship. After considering all of the available facts, including the expected legal costs of disputing the matter, the Company agreed to pay a contribution of the settlement charge, up to a maximum amount of US$100,000. Subsequent to the March 31, 2011, the Company continues to negotiate the final allocation of the settlement charge with the former customer and expects to conclude its discussions prior to the end of the three month period ended June 30, 2011. Included in the consolidated financial statements for the six month period ended March 31, 2011 is an accrual of US$80,000 representing the Company’s best estimate of the amount that it will be required to pay out.
| PNI Digital Media Inc. |
| Notes to Consolidated Financial Statements |
| Unaudited – Prepared by Management |
| (expressed in Canadian dollars) |
During the three month period ended December 31, 2010, the Company received notice from a customer that a claim had been brought against them from a United States based entity (the “entity”), alleging that certain services offered by the Company’s customer infringed on a patent licenced by the entity. A portion of the services that are alleged to be in breach of this patent are provided by the Company. The Company’s customer had previously requested that the Company indemnify them from any damages resulting from this claim. Subsequent to the period end, the claim made against the Company’s customer was dismissed in full without prejudice. No payments were required to be made by the Company as a result of this dismissal and no adjustment has been made in these financial statements.
| 11. | Bank Facility |
In March 2010, the Company entered into a Credit Agreement with its bank (the “Bank”) which provides the Company with two separate credit facilities, being a $1,500,000 revolving demand facility (“Revolving Demand Facility) and a $750,000 reducing facility by way of Leases (“Lease Facility”). The two credit facilities and all other obligations of the Company to the Bank are secured by way of a General Security Agreement between the Bank and the Company, constituting a first ranking security interest in all personal property of the Company.
The Revolving Demand Facility bears interest at a rate of Bank prime + 1.50% and contains a financial covenant requiring us not to exceed a borrowing limit of 67% of good Canadian and US Accounts receivable less potential prior-ranking claims which include items such as sales and excise taxes, payroll liabilities, and overdue rent, property and business taxes. The Company has not drawn any amount with respect to the Revolving Demand Facility.
The Lease Facility will be subject to separate agreements between the Bank and the Company, and as at March 31, 2011 no amount has been drawn on this facility.
| PNI Digital Media Inc. |
| Notes to Consolidated Financial Statements |
| Unaudited – Prepared by Management |
| (expressed in Canadian dollars) |
| 12. | Supplementary cash flow information |
Net change in non-cash working capital items
| Three Months Ended | Six Months Ended | |||||||||||||||
March 31, 2011 | March 31, 2010 | March 31, 2011 | March 31, 2010 | |||||||||||||
| Accounts receivable | $ | 2,355,351 | $ | 786,718 | $ | 1,447,894 | $ | 369,690 | ||||||||
| Prepaid expenses and other current assets | (40,611 | ) | 42,133 | (51,723 | ) | 43,501 | ||||||||||
| Accounts payable and accrued liabilities | (764,333 | ) | (5,103,333 | ) | (2,330,537 | ) | (3,125,799 | ) | ||||||||
| Changes in deferred revenue | (179,558 | ) | 85,095 | (194,001 | ) | 108,953 | ||||||||||
| Total | $ | 1,370,849 | $ | (4,189,387 | ) | $ | (1,128,367 | ) | $ | (2,603,655 | ) | |||||
| PNI Digital Media Inc. |
| Notes to Consolidated Financial Statements |
| Unaudited – Prepared by Management |
| (expressed in Canadian dollars) |
| 13. | Reconciliation to accounting principles generally accepted in the United States of America |
The financial statements have been prepared in accordance with Canadian generally accepted accounting principles (“Canadian GAAP”), which differ in certain material respects from those principles and practices that the Company would have followed had its financial statements been prepared in accordance with accounting principles and practices generally accepted in the United States (“US GAAP”).
| a) | Statements of loss and comprehensive loss |
Net profit from operations, separately identifying revenue earned from the sale of tangible products and the sale of services, together with the respective costs associated with those sales is as follows:
| Three Months Ended | Six Months Ended | |||||||||||||||
March 31, 2011 | March 31, 2010 | March 31, 2011 | March 31, 2010 | |||||||||||||
| Revenue | ||||||||||||||||
| Service revenue | $ | 4,934,588 | $ | 4,474,186 | $ | 12,360,388 | $ | 11,184,430 | ||||||||
| Product revenue | 96,675 | 787,536 | 404,680 | 1,833,505 | ||||||||||||
| 5,031,263 | 5,261,722 | 12,765,068 | 13,017,935 | |||||||||||||
| Expenses | ||||||||||||||||
| Network delivery – service revenue | 901,823 | 937,049 | 2,106,796 | 2,122,797 | ||||||||||||
| Network delivery – product revenue | 90,675 | 301,220 | 375,657 | 1,063,156 | ||||||||||||
| Software development | 2,879,128 | 1,922,796 | 5,607,417 | 3,847,388 | ||||||||||||
| General and administration | 1,056,037 | 1,009,289 | 2,079,828 | 2,090,047 | ||||||||||||
| Sales and marketing | 257,919 | 215,027 | 561,029 | 455,530 | ||||||||||||
| Amortization | 692,853 | 1,322,910 | 1,382,232 | 2,695,726 | ||||||||||||
| Impairment of property and equipment (d) | 71,241 | - | 90,713 | - | ||||||||||||
| 5,949,676 | 5,708,291 | 12,203,672 | 12,274,644 | |||||||||||||
| Net (loss) earnings from operations | $ | (918,413 | ) | $ | (446,569 | ) | $ | 561,396 | $ | 743,291 | ||||||
| PNI Digital Media Inc. |
| Notes to Consolidated Financial Statements |
| Unaudited – Prepared by Management |
| (expressed in Canadian dollars) |
The reconciliation between Canadian GAAP and US GAAP of the net (loss) earnings for the period is as follows:
Three Months Ended | Six Months Ended | |||||||||||||||
March 31, 2011 | March 31, 2010 | March 31, 2011 | March 31, 2010 | |||||||||||||
| Net (loss) earnings for the period under Canadian GAAP | $ | (852,479 | ) | $ | (90,886 | ) | $ | 231,042 | $ | 1,153,437 | ||||||
| Deferred tax expense (g) | 26,706 | - | 53,412 | - | ||||||||||||
| Net (loss) earnings for the period under US GAAP | (825,773 | ) | (90,886 | ) | 284,454 | 1,153,437 | ||||||||||
| Other comprehensive (loss) gain: | ||||||||||||||||
| Unrealized foreign exchange loss on translation of foreign subsidiaries with different functional currencies | 63,363 | (659,784 | ) | (393,274 | ) | (971,840 | ) | |||||||||
| Comprehensive (loss) gain under US GAAP | $ | (762,410 | ) | $ | (750,670 | ) | $ | (108,820 | ) | $ | 181,597 | |||||
| (Loss) earnings per share under US GAAP | ||||||||||||||||
| Basic | $ | (0.02 | ) | $ | (0.00 | ) | $ | 0.01 | $ | 0.03 | ||||||
| Fully diluted | $ | (0.02 | ) | $ | (0.00 | ) | $ | 0.01 | $ | 0.03 | ||||||
| PNI Digital Media Inc. |
| Notes to Consolidated Financial Statements |
| Unaudited – Prepared by Management |
| (expressed in Canadian dollars) |
| (b) | Balance Sheet |
The reconciliation of the balance sheet between Canadian GAAP and US GAAP is as follows:
March 31, 2011 | September 30, 2010 | |||||||||||||||
Canadian GAAP | U.S. GAAP | Canadian GAAP | U.S. GAAP | |||||||||||||
| Assets | ||||||||||||||||
| Current assets | $ | 10,200,527 | $ | 10,200,527 | $ | 11,560,897 | $ | 11,560,897 | ||||||||
| Intangible assets | 691,821 | 691,821 | 1,115,794 | 1,115,794 | ||||||||||||
| Goodwill (note f, g) | 634,603 | 8,094,818 | 658,904 | 8,119,119 | ||||||||||||
| Deferred tax asset (g) | 4,523,033 | 4,523,033 | 4,953,934 | 4,953,934 | ||||||||||||
| Other long-term assets | 5,617,962 | 5,617,962 | 5,230,829 | 5,230,829 | ||||||||||||
| Total assets | $ | 21,667,946 | $ | 29,128,161 | $ | 23,520,358 | $ | 30,980,573 | ||||||||
| Liabilities & Shareholders’ Equity | ||||||||||||||||
| Liabilities | ||||||||||||||||
| Current liabilities | $ | 4,201,238 | $ | 4,201,238 | $ | 6,312,004 | $ | 6,312,004 | ||||||||
| Long-term liabilities | 55,713 | 55,713 | 78,876 | 78,876 | ||||||||||||
| Shareholders’ Equity | ||||||||||||||||
| Share capital | 66,633,431 | 66,579,470 | 66,200,215 | 66,199,666 | ||||||||||||
Contributed surplus (note c) | 18,944,573 | 16,340,748 | 18,933,619 | 16,329,794 | ||||||||||||
| Deficit (note f, g) | (65,453,778 | ) | (55,335,777 | ) | (65,684,820 | ) | (55,620,231 | ) | ||||||||
| Accumulated other comprehensive loss | (2,713,231 | ) | (2,713,231 | ) | (2,319,536 | ) | (2,319,536 | ) | ||||||||
| $ | 21,667,946 | $ | 29,128,161 | $ | 23,520,358 | $ | 30,980,573 | |||||||||
| (c) | Stock-based compensation |
Effective October 1, 2004, the Company adopted ASC 718, Compensation – Stock Compensation (formerly Financial Accounting Standard (“FAS”) No. 123, Accounting for Stock-Based Compensation, as subsequently revised by FAS No. 123(R) (“FAS 123(R)”), Share-Based Payment, effective October 1, 2006.) The adoption of this guidance, effective October 1, 2006 under the modified prospective method, had no material impact on the Company’s financial position or results of operations. Under US GAAP, the Company recognizes the grant-date fair value of stock-based compensation awards granted to employees and directors over the requisite service period for all awards granted, modified, repurchased or cancelled after October 1, 2004 and the unvested portions of outstanding awards as at October 1, 2004. The Company also adopted CICA Handbook Section 3870, Stock-Based Compensation and Other Stock-Based Payments effective October 1, 2004 for awards granted on or after October 1, 2002.
| PNI Digital Media Inc. |
| Notes to Consolidated Financial Statements |
| Unaudited – Prepared by Management |
| (expressed in Canadian dollars) |
As a result of these new accounting standards in Canada and the United States, there are no material GAAP differences related to the Company’s stock-based compensation awards during the period ended March 31, 2011 and 2010.
At March 31, 2011, the total compensation cost related to non-vested awards not yet recognized is as follows:
| Award type | March 31, 2011 | March 31, 2010 | Weighted average remaining vesting period | ||||||
| Stock options | $ | 255,384 | $ | 193,555 | 12 months | ||||
| RSU’s | 262,981 | - | 30 months | ||||||
| PSU’s | 56,187 | - | 30 months | ||||||
| Total | $ | 574,552 | $ | 193,555 | |||||
No amount has been included for forfeitures as the amount is immaterial.
| (d) | Classification of impairment charges |
Losses recognized with respect to impairments of long-lived assets have been classified as having arisen from non-operating results for Canadian reporting purposes. Under US GAAP, these items are included in the determination of the Company’s loss from operations.
| (e) | Cash flow statements |
The Canadian accounting standard for the preparation of cash flow statements is consistent with the guidance provided by International Accounting Standard (IAS) 7, and accordingly, the cash flow statements presented herein have not been reconciled to US GAAP under the accommodation provided by the SEC.
| (f) | Redemption of Limited Partnership units |
During the year ended September 30, 2004, the Company redeemed limited partnership units and recorded the cost as a charge to deficit for Canadian GAAP purposes. Under US GAAP, the Company applied ASC 805, Business Combinations (formerly SFAS No. 141, “Business Combinations”), and allocated the cost of issuing the common shares and share purchase warrants to goodwill, after first considering any allocation to tangible and intangible assets acquired. This resulted in an increase of $6,511,063 in goodwill and shareholders’ equity. The Company applies ASC 350, Intangibles – Goodwill and Other, in determining if there is any impairment in value. As at March 31, 2011, no impairment in value has been recorded to date.
| PNI Digital Media Inc. |
| Notes to Consolidated Financial Statements |
| Unaudited – Prepared by Management |
| (expressed in Canadian dollars) |
| (g) | Income taxes |
The Company follows the liability method with respect to accounting for income taxes. Deferred tax assets and liabilities are determined based on temporary differences between the carrying amounts and the tax basis of assets and liabilities. Deferred income tax assets and liabilities are measured using enacted tax rates that will be in effect when these differences are expected to reverse. Deferred income tax assets are reduced by a valuation allowance, if based on the weight of available evidence; it is more likely than not that some portion or all of the deferred tax assets will not be realized.
In July 2006, the Financial Accounting Standards Board (the “FASB”) issued Financial Interpretation No. 48, Accounting for Uncertainty in Income Taxes, subsequently codified as ASC 740, which clarifies the accounting for uncertainty in income taxes recognized in a company’s financial statements in accordance with Statement of Financial Accounting Standards No. 109, Accounting for Income Taxes. ASC 740 prescribes a recognition threshold and measurement process for recording in the financial statements uncertain tax positions taken or expected to be taken in a tax return. Additionally, ASC 740 provides guidance on the de-recognition, classification, interest and penalties, accounting in interim periods, and disclosure requirements for uncertain tax positions. The Company adopted the provisions of ASC 740 beginning October 1, 2007.
We file income tax returns in the U.S., Canada and the United Kingdom. We are subject to income tax examination by tax authorities in all jurisdictions from our inception to date. Our policy is to recognize interest expense and penalties related to income tax matters as tax expense. At June 30, 2010, we do not have any significant accruals for interest related to unrecognized tax benefits or tax penalties. Based on the Company’s evaluation, there are no significant uncertain tax positions requiring recognition or measurement in accordance with ASC 740.
During the year ended September 30, 2010, the Company recorded a deferred tax asset relating to the utilization of Pixology loss carryforwards to offset the current year income taxes payable in the amount of $363,728. The Company also determined that a portion of the previously unrecognized Pixology loss carry forwards should be recognized as the likelihood of realization of the tax asset was estimated to be more likely than not.
Canadian GAAP requires that a future income tax asset acquired in a business combination that was not recognized at the time of acquisition as an identifiable asset but is subsequently recognized by the acquirer should be applied to reduce goodwill and intangibles to zero, with any remaining amount recognized as a reduction to income tax expense.
Accordingly, an amount of $949,152 and $89,266 was credited against Pixology goodwill and intangibles respectively.
| PNI Digital Media Inc. |
| Notes to Consolidated Financial Statements |
| Unaudited – Prepared by Management |
| (expressed in Canadian dollars) |
US GAAP requires reversals of a valuation allowance related to acquired losses and deductible temporary differences to be recognized as a deferred tax benefit in the Statement of Earnings (Loss) and Comprehensive Gain (Loss).
During the year ended September 30, 2010, the Company determined that it was more likely than not to realize the loss carryforwards and other deductible temporary differences arising in Canada. As a result the Company reversed the valuation allowance relating to these items and recorded a future tax benefit. A portion of the valuation allowance of $107,611 related to share issue costs that are deductible for tax purposes. In accordance with Canadian GAAP, this was recorded as a future tax benefit within the Company’s Statement of Earnings (Loss) and Comprehensive Gain (Loss). US GAAP, however, requires the benefit associated with the reversal of a valuation allowance relating to equity items be recorded as an increase to share capital. Accordingly, for US GAAP an amount of $107,611 was recorded as an increase to share capital. During the six month period ended March 31, 2011, under Canadian GAAP the Company recorded a future tax expense of $53,412 associated with the realization of a portion of share issue costs; however under US GAAP the expense was recorded as a decrease to share capital.
| (h) | Recent adopted U.S. standards |
Accounting Standards Update 2009-05
Effective October 1, 2009, the Company adopted ASU 2009-05, “Fair Value Measurements and Disclosures”. The ASU provides a number of amendments to Subtopic 820-10, “Fair Value Measurements and Disclosures – Overall”, regarding the fair value measurements of liabilities. The adoption of this ASU did not have a significant impact on the financial statements of the Company.
Accounting Standards Update 2009-06
Effective October 1, 2009 the Company adopted ASU 2009-06, “Income Taxes”. ASU 2009-06 provides additional implementation guidance on accounting for uncertainty in income taxes. The adoption of this ASU has had no significant impact on the financial statements of the Company.
Accounting Standards Update 2009-13
In October 2009, the FASB released ASU 2009-13, “Multiple-deliverable revenue arrangements”. ASU 2009-13 is effective for revenue arrangements entered into or materially modified in years beginning on or after June 15, 2010 and provides another alternative for determining the selling price of deliverables and eliminates the residual method of allocating arrangement consideration. The adoption of this ASU has not had a significant impact on the financial statements of the Company.
| PNI Digital Media Inc. |
| Notes to Consolidated Financial Statements |
| Unaudited – Prepared by Management |
| (expressed in Canadian dollars) |
Accounting Standards Update 2009-14
In October 2009, the FASB released ASU 2009-14, “Revenue arrangements that include software elements”. ASU 2009-14 is effective for revenue arrangements entered into or materially modified in years beginning on or after June 15, 2010 and removes non-software components of tangible products and certain software components of tangible products from the scope of existing software revenue guidance resulting in the recognition of revenue similar to that for other tangible products. The adoption of this ASU has not had a significant impact on the financial statements of the Company.
Accounting Standards Update 2010-02
In January 2010, the FASB released ASU 2010-02, “Consolidation (Topic 810): accounting and reporting for decreases in ownership of a subsidiary – a scope clarification”. ASU 2010-02 is effective at the beginning of the period ending on or after December 15, 2009 and describes amendments that clarify the types of transactions that should be accounted for as a decrease in ownership of a subsidiary as set forth in consolidations topic of the FASB Accounting Standards Codification (Subtopic 810-10). The Board’s objective in making the amendments is to remove the potential conflict between guidance in that Subtopic and asset de-recognition and gain or loss recognition guidance that may exist in other U.S. GAAP. The adoption of this ASU has had no impact on the financial statements of the Company.
Accounting Standards Update 2010-05
In January 2010, the FASB released ASU 2010-05, “Compensation – Stock Compensation (Topic 718): escrowed share arrangements and the presumption of compensation”. ASU 2010-05 codifies EITF Topic D-110, escrowed share arrangements and the Presumption of Compensation, and amends paragraphs 505-50-S25-3, 718-10-S25-1, and 718-10-S99-2. The adoption of these amendments had no impact on these financial statements.
Accounting Standards Update 2010-06
In January 2010, the FASB released ASU 2010-06, “Fair Value Measurements and Disclosures (Topic 820): improving disclosures about fair value measurements”. The ASU provides a number of amendments to Subtopic 820-10, that require new disclosures and that clarify certain existing disclosures related to fair value measurements. ASU 2010-06 is effective at the beginning of the period ending on or after December 15, 2009. The adoption of this ASU did not have a significant impact on these financial statements.
| PNI Digital Media Inc. |
| Notes to Consolidated Financial Statements |
| Unaudited – Prepared by Management |
| (expressed in Canadian dollars) |
Accounting Standards Update 2010-08
In February 2010, the FASB released ASU 2010-08, “Technical corrections to various topics”. ASU 2010-08 was issued to amend certain US GAAP provisions to eliminate inconsistencies, outdated provisions and provide further clarifications where required. The Board concluded that the guidance in the amendments will not result in pervasive changes to current practice, and while none of the provisions in the amendments in this ASU fundamentally change U.S. GAAP, certain clarifications made to the guidance on embedded derivatives and hedging (Subtopic 815-15) may cause a change in the application of that Subtopic and, thus, special transition provisions are provided for accounting changes related to that Subtopic. The amendments in ASU 2010-08 are effective for the first reporting period beginning after issuance, except for certain amendments made to Topic 815 which are effective for fiscal years beginning after December 15, 2009. The amendments of this ASU have had no impact on the financial statements of the Company.
Accounting Standards Update 2010-09
In February 2010, the FASB released ASU 2010-09, “Subsequent Events (Topic 855): amendments to certain recognition and disclosure requirements. The amendments in ASU 2010-09 are effective upon issuance, and address certain implementation issues including: (i) eliminating the requirement for SEC filers to disclose the date through which it has evaluated subsequent events; (ii) clarifying the period through which conduit bond obligors must evaluate subsequent events; and (iii) refining the scope of the disclosure requirements for reissued financial statements. The Board’s objective in making the amendments is to remove potential conflicts between U.S. GAAP and SEC guidance. The adoption of this ASU has had no significant impact on the financial statements of the Company.
Accounting Standards Update 2010-11
In March 2010, the FASB released ASU 2010-11, “Derivatives and Hedging (Topic 815): scope exception related to embedded credit derivatives”. The amendments in ASU 2010-11 are effective for each reporting entity at the beginning of its first fiscal quarter beginning after June 15, 2010. ASU 2010-11 provides clarifications and related additional examples to improve financial reporting by resolving potential ambiguity about the breadth of the embedded credit derivative scope exception in paragraphs 815-15-15-8 through 15-9 of Topic 815. The adoption of this ASU has had no impact on the financial statements of the Company.
Accounting Standards Update 2010-12
In April 2010, the FASB released ASU 2010-12, “Income Taxes (Topic 740): accounting for certain tax effects of the 2010 health care reform acts”. ASU 2010-12 codifies Subtopic 740-10. The amendments have had no impact on the financial statements of the Company.
Accounting Standards Update 2010-20
In July 2010, the FASB released ASU 2010-20, “Receivables (Topic 310)”. ASU 2010-20 is effective for interim and annual reporting periods ending on or after December 15, 2010. The objective of ASU 2010-20 is to provide additional information to assist financial statement users in assessing an entity’s credit risk exposures and evaluating the adequacy of its allowance for credit losses as it relates to an entity’s portfolio of financing receivables. The amendments in ASU 2010-20 affect all entities with financing receivables, excluding short-term trade accounts receivable or receivables at fair value or lower of cost or fair value. The amendments have had no impact on the financial statements of the Company.
| PNI Digital Media Inc. |
| Notes to Consolidated Financial Statements |
| Unaudited – Prepared by Management |
| (expressed in Canadian dollars) |
Accounting Standards Update 2010-21
In August 2010, the FASB released ASU 2010-21, “Accounting for Technical Amendments to Various SEC Rules and Schedules”. ASU 2010-21 amends various SEC paragraphs pursuant to the issuance of Release No. 33-9026: Technical Amendments to Rules, Forms, Schedules and Codification of Financial Reporting Policies. The amendments have had no impact on the financial statements of the Company.
Accounting Standards Update 2010-22
In August 2010, the FASB released ASU 2010-22, “Accounting for Various Topics”. ASU 2010-22 amends various SEC paragraphs based on external comments received and the issuance of SAB 112, which amends or rescinds portions of certain SAB topics. The amendments have had no impact on the financial statements of the Company.
Accounting Standards Update 2010-28
In December 2010, the FASB released ASU 2010-28, “Intangibles – Goodwill and Other (Topic 350): When to Perform Step 2 of the Goodwill Impairment Test for Reporting Units with Zero or Negative Carrying Amounts”. The amendments in ASU 2010-28 are effective for fiscal years, and interim periods within those years, beginning after December 15, 2010. The objective of ASU 2010-28 is to address circumstances where entities have concluded that despite factors that indicate goodwill assigned to a reporting unit may be impaired, Step 2 of the goodwill impairment test (measuring the amount of impairment loss) is not performed as reporting units with zero or negative carrying amounts will generally have a fair value greater than zero. ASU 2010-28 modifies Step 1 of the goodwill impairment test to require an entity to perform Step 2 of the goodwill impairment test, for reporting units with zero or negative carrying amounts if it is more likely than not that a goodwill impairment exists. The amendments have had no impact on the financial statements of the Company.
Business Combinations
In December 2007, the Financial Accounting Standards Board (FASB) issued new accounting guidance as outlined in ASC 805, Business Combinations regarding business combinations and non-controlling interests in consolidated financial statements. This new guidance retains the fundamental requirements in previous guidance for business combinations requiring that the use of the purchase method be used for all business combinations. The acquirer is required to recognize the assets acquired, the liabilities assumed, and any non-controlling interest in the acquiree at the acquisition date, measured at their fair values as of that date. Additionally, business combinations will now require that acquisition costs to be expensed as incurred, the recognition of contingencies, restructuring costs associated with a business combination must generally be expensed and changes in deferred tax asset valuation allowances and income tax uncertainties after the acquisition date generally will affect income tax expense. This guidance applies prospectively to business combinations for which the acquisition date is on or after the beginning of the first annual reporting period beginning on or after December 15, 2008, which is the year ending September 30, 2010 for the Company. Since adoption of this standard, effective October 1, 2009, the Company has not undertaken any transactions to which these revised rules apply.
| PNI Digital Media Inc. |
| Notes to Consolidated Financial Statements |
| Unaudited – Prepared by Management |
| (expressed in Canadian dollars) |
Non-controlling Interests in Consolidated Financial Statements
In December 2007, the FASB clarified guidance on non-controlling interests in consolidated financial statements. The clarification requires ownership interests in subsidiaries held by other parties to be classified as equity in the consolidated financial statements and changes in ownership interests in a subsidiary to be accounted for as equity transactions. Deconsolidation of a subsidiary is to be accounted for at fair value. This update is applicable for fiscal years beginning on or after December 15, 2008 on a prospective basis, except for the presentation and disclosure requirements which are to be applied to all periods presented. The Company does not currently have any partially owned subsidiaries and does not expect, based on its current structure, the adoption, effective October 1, 2009 to have any significant impact.
Determination of the Useful Life of Intangible Assets
Effective October 1, 2009 the Company adopted FASB’s updated guidance as outlined in ASC 350, Intangibles – Goodwill and Other regarding the factors that should be considered in developing renewal or extension assumptions used to determine the useful life of a recognized intangible asset. The intent of this revised guidance is to improve the consistency between the useful life of a recognized intangible and the period of expected cash flows used to measure the fair value of the asset. The adoption of this revised guidance has not had a significant impact on the financial statements of the Company.
| (i) | Recent U.S. announcements |
Accounting Standards Update 2010-13
In April 2010, the FASB released ASU 2010-13, “Compensation – Stock Compensation (Topic 718): effect of denominating the exercise price of a share based payment award in the currency of the market in which the underlying equity security trades – a consensus of the FASB Emerging Issues Task Force.” ASU 2010-13 is effective for fiscal years, and interim periods within those fiscal years, beginning on or after December 15, 2010. ASU 2010-13 clarifies that a share-based payment award with an exercise price denominated in the currency of a market in which a substantial portion of the entity’s equity securities trades should not be considered to contain a condition that is not a market, performance, or service condition, therefore such an award should not be classified as a liability. The Company does not anticipate the amendments of ASU 2010-13 will have a financial impact on the Company’s results.
| PNI Digital Media Inc. |
| Notes to Consolidated Financial Statements |
| Unaudited – Prepared by Management |
| (expressed in Canadian dollars) |
Accounting Standards Update 2010-29
In December 2010, the FASB released ASU 2010-29 “Business Combinations (Topic 805) – Disclosure of Supplementary Pro Forma Information for Business Combinations”. The objective of ASU 2010-29 is to address diversity in practice about the interpretation of the pro forma revenue and earnings disclosure requirements for business combinations. Under ASU 2010-29, if a public entity presents comparative financial statements, the entity should disclose revenue and earnings of the combined entity as though the business combination(s) that occurred during the current year had occurred as of the beginning of the comparable prior annual reporting period only. The amendments in ASU 2010-29 are effective prospectively for business combinations for which the acquisition date is on or after the beginning of the first annual reporting period beginning on or after December 15, 2010. The amendments have had no impact on the financial statements of the Company.
PNI Digital Media Inc.
(TSX-V: PN / OTCBB: PNDMF)
Management’s Discussion & Analysis
For the Period Ended March 31, 2011
May 26, 2011
| PNI Digital Media Inc. | |
| Management’s Discussion and Analysis | |
| For the period ended March 31, 2011 | Page 1 |
This discussion and analysis is a review of the operating results, financial condition, and business risks of PNI Digital Media Inc. (“PNI”, the “Company”, “we” or “our”). This discussion should be read in conjunction with the Management’s Discussion and Analysis included in PNI’s 2010 Annual Report and our consolidated financial statements and accompanying notes for the year ended September 30, 2010 and for the period ended March 31, 2011. The financial information reported herein has been prepared in accordance with Canadian Generally Accepted Accounting Principles (“GAAP”) and is presented in Canadian dollars, unless otherwise noted.
This discussion and analysis may contain forward-looking statements. Statements which are not historical facts reflect our views at May 26, 2011 with respect to future events and are subject to certain risks, uncertainties and assumptions. These risks and assumptions include, but are not limited to, changes in the market for our services, changes in the economy, increasing competition in our market, the risk of loss of current customers, risks related to changes in technology, risks related to our technology, employee retention, inability to deliver on contracts, failure of customers to adequately market the online photo-finishing services they provide, foreign exchange, and risks with respect to our financial capacity. Our actual results could differ materially from those expressed or implied by such forward-looking statements.
Business Highlights
Second Quarter Highlights
| · | Processed 3.6 million transactions during the period, compared to 3.3 million during the second quarter of fiscal 2010, a 10% increase |
| · | Revenue for the quarter was $5.0 million compared to $5.3 million in the second quarter of fiscal 2010 |
| · | Revenue on a constant currency basis was $5.2 million compared to $5.3 million in the second quarter of fiscal 2010 |
| · | Transactional revenue was $3.5 million, compared to $3.7 million in the second quarter of fiscal 2010 |
| · | Transaction fees represented 69% of total revenue vs. 71% during the same period of fiscal 2010 |
| · | Generated GAAP loss after income taxes for the quarter of $852,000 compared to $91,000 in the second quarter of fiscal 2010 |
| · | Non-GAAP adjusted EBITDA1 was negative $0.1 million during the second quarter of 2011, compared to a non-GAAP adjusted EBITDA of $1.0 million during the second quarter of 2010 |
1 – Adjusted EBITDA is a non-GAAP financial measure which the Company defines as net profit plus amortization, interest expense, tax expense, share-based compensation expense and un-realized foreign exchange loss (gain). A full reconciliation of the Company’s results between these non-GAAP figures and the results in accordance with GAAP is included on page 19 of this MD&A.
| PNI Digital Media Inc. | |
| Management’s Discussion and Analysis | |
| For the period ended March 31, 2011 | Page 2 |
Selected financial information
The following selected financial information has been prepared in accordance with generally accepted accounting principles in Canada and is presented in Canadian dollars.
| Three Months Ended March 31, | Six Months Ended March 31, | |||||||||||||||
| 2011 | 2010 | 2011 | 2010 | |||||||||||||
| Revenue | $ | 5,031,263 | $ | 5,261,722 | $ | 12,765,068 | $ | 13,017,935 | ||||||||
| (Loss) profit from operations | $ | (847,172 | ) | $ | (446,569 | ) | $ | 652,109 | $ | 743,291 | ||||||
| Net (loss) profit before income taxes | $ | (1,080,957 | ) | $ | (54,640 | ) | $ | 563,803 | $ | 1,254,595 | ||||||
| Net (loss) profit for the period | $ | (852,479 | ) | $ | (90,886 | ) | $ | 231,042 | $ | 1,153,437 | ||||||
| Basic (loss) earnings per common share | $ | (0.03 | ) | $ | (0.00 | ) | $ | 0.01 | $ | 0.03 | ||||||
| Fully diluted (loss) earnings per common share | $ | (0.03 | ) | $ | (0.00 | ) | $ | 0.01 | $ | 0.03 | ||||||
| As at | ||||||||
March 31, 2011 | September 30, 2010 | |||||||
| Total assets | $ | 21,667,946 | $ | 23,520,358 | ||||
| Net assets | $ | 17,410,995 | $ | 17,129,478 | ||||
| Working capital | $ | 5,999,289 | $ | 5,248,893 | ||||
| PNI Digital Media Inc. | |
| Management’s Discussion and Analysis | |
| For the period ended March 31, 2011 | Page 3 |
Business Overview:
The Company operates the PNI Digital Media Platform, which provides transaction processing and order routing services for major retailers. The PNI Digital Media Platform connects consumer ordered digital content, whether from in-store kiosks, online sites or desktop software, with retailers that have on-demand manufacturing capabilities for the production of merchandise such as photos and business documents. The Company successfully generates and routes millions of transactions each year for a range of retailers enabling thousands of locations worldwide.
The Company’s customers include some of the largest retailers on a worldwide basis, including, Costco, SAM’s Club, Blacks, CVS/Pharmacy, Tesco, ASDA, Walmart Canada, Kodak and Fujifilm among others.
The Company’s core value proposition is to provide an effective and dynamic technology platform to allow its customers to transact and transport photo and digital media orders from the consumer, whether via a website over the internet or from an in-store kiosk, to the retailers’ production facilities. The technology that delivers this end to end service is generically known as the PNI Digital Media Platform (the “Platform” or “Network”). The Company earns revenue through multiple channels, including recording transaction fees for all such orders that pass through the Network.
The Company’s goal is to provide leading retailers who have digital manufacturing facilities with the ability to produce merchandise on-demand from digital orders received via the internet or kiosk, including being able to support and enable one-hour photo operations.
The Company has built its current business around the conversion of photography from film-based to digital-based and has positioned itself to be one of the most significant providers of internet infrastructure that facilitates the delivery of digital imaging from order origination to fulfillment through our relationships with large retailers.
The digital photography market is intensely competitive with a wide range of companies competing for market share through various avenues. PNI does not have a consumer facing business model, instead positioning itself behind the established brand names of major retail partners. By positioning itself in such a manner, the Company is able to reduce some of its business risk as it is able to reduce reliance on one particular market segment or geographic concentration and does not have to concentrate on building consumer brand awareness of its own.
Direct competitors in the market who also provide digital print services on behalf of retailers include Snapfish (a division of Hewlett Packard), LifePics, Storefront.com Online Inc. and Photobox. Of these competitors, Snapfish is the only one which currently partners with large North American retailers of a size that is comparable to those serviced by the Company.
The competition for in-store kiosk software is provided by companies such as HP, Lucidiom, Storefront.com Online Inc., Kodak and Fujifilm. Although there continues to be an increased trend of business being conducted over the internet and away from the traditional store environment, a significant portion of photo and photo related business is still conducted in-store through kiosk interfaces and the Company believes there remains significant business potential to increase market share and revenue by connecting kiosk-based interfaces to the PNI Digital Media platform.
| PNI Digital Media Inc. | |
| Management’s Discussion and Analysis | |
| For the period ended March 31, 2011 | Page 4 |
The Company has invested in, and is building a future towards, enabling e-commerce for all types of digital content for the retailers’ ‘Media Center’. The PNI Digital Media Platform can enable this type of harmonized e-commerce activity, by enabling the routing of content to the manufacturing location(s) equipped to produce the end product.
Growth Strategy:
Our strategy for growth is to:
| · | Continue to contract or partner with leading retailers and web portals in the photofinishing and photo gifting industry; |
| · | Innovate to deliver new product lines to our customers, such as our innovative new product lines for small business printing and social stationery; |
| · | Maintain service and product excellence for strong customer retention and development; |
| · | Maintain a close relationship with our customers by providing marketing solutions that encourage both new user adoption and accelerate existing user frequency; |
| · | Leverage off existing partnerships and work with distributors to expand internationally, including further deployments in Europe and Asia-Pacific; and |
| · | Provide a workplace conducive to attracting and retaining talented people. |
Seasonality of Operations
Demand for photofinishing products is highly seasonal, with a significant proportion of recurring revenues being generated during the Company’s first fiscal (fourth calendar) quarter. The Company’s rapid growth over the past several years may have overshadowed seasonal or cyclical factors which might have influenced business to date. Due to the seasonal nature of our business, the results of operations for any interim period are not necessarily indicative of the results of operations to be expected for the fiscal year.
Dependence on General Economic Conditions
The majority of transactions conducted through the Company’s Network are for the sale of personal items that help consumers preserve or share their memories. Because all of these sales are discretionary in nature, our results are influenced by general economic conditions.
| PNI Digital Media Inc. | |
| Management’s Discussion and Analysis | |
| For the period ended March 31, 2011 | Page 5 |
Market Segmentation
The Company has two operating segments that have similar economic characteristics which are aggregated into a single reportable segment based on the manner in which the Company has organized its operations and provision of financial information to senior management.
Revenue by geographic region
During the three and six month periods ended March 31, 2011 and 2010, the percentage of the Company’s revenue earned by geographic segment was as follows:
Three Months Ended March 31, | Six Months Ended March 31, | |||||||||||||||
| 2011 | 2010 | 2011 | 2010 | |||||||||||||
| United States | 56 | % | 52 | % | 60 | % | 55 | % | ||||||||
| Canada | 21 | % | 21 | % | 20 | % | 21 | % | ||||||||
| Total North America | 77 | % | 73 | % | 80 | % | 76 | % | ||||||||
| United Kingdom | 22 | % | 26 | % | 19 | % | 23 | % | ||||||||
| Other | 1 | % | 1 | % | 1 | % | 1 | % | ||||||||
| Total | 100 | % | 100 | % | 100 | % | 100 | % | ||||||||
Results from operations: 3 Months Ended March 31, 2011
Revenue
| Description | Three Months Ended March 31, 2011 | Three Months Ended March 31, 2010 | Change | % Change | ||||||||||||
| Transaction fees | $ | 3,454,606 | $ | 3,727,516 | $ | (272,910 | ) | (7 | )% | |||||||
| Software licences and Installation fees | 777,775 | 756,983 | 20,792 | 3 | % | |||||||||||
| Membership fees | 416,846 | 445,777 | (28,931 | ) | (7 | )% | ||||||||||
| Professional fees | 7,477 | 62,236 | (54,759 | ) | (88 | )% | ||||||||||
| Archive fees | 374,559 | 269,210 | 105,349 | 39 | % | |||||||||||
| Total | $ | 5,031,263 | $ | 5,261,722 | $ | (230,459 | ) | (4 | )% | |||||||
| PNI Digital Media Inc. | |
| Management’s Discussion and Analysis | |
| For the period ended March 31, 2011 | Page 6 |
Revenue (Constant currency basis)
| Description | Three Months Ended March 31, 2011 | Three Months Ended March 31, 2010 | Change | % Change | ||||||||||||
| Transaction fees | $ | 3,592,413 | $ | 3,727,516 | $ | (135,103 | ) | 4 | % | |||||||
| Software licences and Installation fees | 799,931 | 756,983 | 42,948 | 6 | % | |||||||||||
| Membership fees | 433,944 | 445,777 | (11,833 | ) | (3 | )% | ||||||||||
| Professional fees | 7,771 | 62,236 | (54,465 | ) | (87 | )% | ||||||||||
| Archive fees | 392,961 | 269,210 | 123,751 | 46 | % | |||||||||||
| Total | $ | 5,227,020 | $ | 5,261,722 | $ | (34,702 | ) | (1 | )% | |||||||
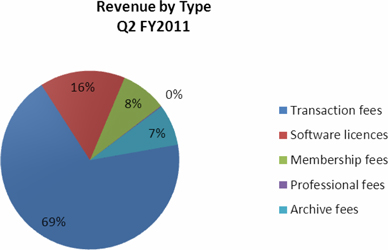
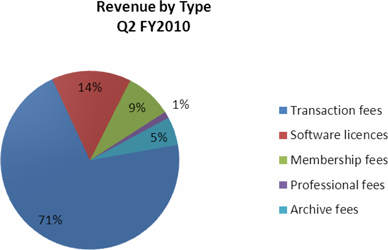
| PNI Digital Media Inc. | |
| Management’s Discussion and Analysis | |
| For the period ended March 31, 2011 | Page 7 |
Revenue for the second quarter, ended March 31 2011 was $5,031,263 reflecting a decline of $230,459 compared to the quarter ended March 31, 2010 at $5,261,722. Revenue period-on-period was impacted by the following:
| · | A period-on-period decline of 5% and 3% in the strength of the US dollar and British Pound respectively compared to the Canadian dollar negatively impacted revenue by $195,757. As 78% of the Company’s revenue was earned from either the United States or the United Kingdom during the period, a weakening in the value of the US dollar and British Pound relative to the Canadian dollar has a significant impact on financial results. |
| · | During the fourth quarter of fiscal 2010 the Company eliminated one of the instances where it was responsible for providing fulfillment of certain items sold and as a result realized lower revenue of approximately $183,000. This change in circumstances also led to a reduction in network delivery costs during the period. |
While revenues declined period-on-period due to the two factors noted above, the number of orders placed through the PNI Platform increased by 10% reaching 3.6 million for the three month period.
Transaction fees continue to be the largest element of our revenue base and totaled $3,454,606 for the quarter, accounting for 69% of total recorded revenue reflecting a slight decline from 71% of total recorded revenue in the second quarter of fiscal 2010. Transaction fees were negatively impacted by the following:
| · | A period-on-period decline in the strength of the US dollar and British Pound compared to the Canadian dollar resulting in approximately $138,000 in lower realized revenue; and |
| · | Elimination of an instance where the Company was responsible for providing fulfillment of certain items sold resulting in lower realized revenue of approximately $183,000. |
Had it not been for the two factors noted above, transaction fees would have increased period-on-period by 1% to approximately $3.8 million. After taking into consideration the two factors noted above, growth in Transaction fees continues to lag growth in order volume mainly due to changes in product mix which result in lower realized revenues for PNI based on our pricing structure with certain customers.
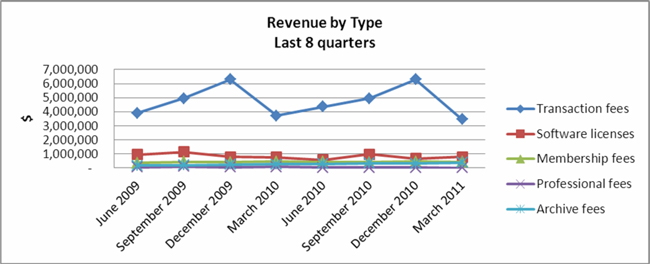
| PNI Digital Media Inc. | |
| Management’s Discussion and Analysis | |
| For the period ended March 31, 2011 | Page 8 |
Software license and installation fees increased by 3% period-on-period to $777,775. While a portion of revenue from this source continues to track at consistent levels each month through recurring license fees earned from some of our UK based customers the 3% period-on-period weakening of the UK pound relative to the Canadian dollar has resulted in the amount of license revenue booked in the consolidated financial statements being impacted negatively by approximately $22,000. Other elements of this revenue are non-recurring and are earned either through developing and installing new sites for customers or by making sales of kiosk software licenses.
Membership fees are earned either through monthly fixed fees based on the number of locations customers have connected to the PNI Platform or through annual recurring service and maintenance revenue from customers who have purchased our kiosk software. Fees earned during the second quarter totaled $416,846, representing a decrease of $28,931 (or 7%) period-on-period. While revenue earned from this source is largely recurring in nature and remains relatively stable period to period, the decrease was mainly due to a period-on-period decline of 5% and 3% in the strength of the US dollar and British Pound respectively compared to the Canadian dollar negatively impacting revenue by $17,098.
Professional fees have shown an overall decrease of 88% period-on-period, falling to $7,477. This is primarily due to a number of one-off projects completed on behalf of a number of our customers during the same period last year. Professional fee revenue is non-recurring in nature and dependant on both the demand from our customers and also the availability of internal resources to allocate to this kind of work. While we continue to expect projects to arise and be taken on in future periods this type of revenue stream is not seen as core to our business and may fluctuate considerably from period to period.
Archive fees, which represent charges made to our customers after the volume of data held on their behalf reaches pre-determined limits, increased 39% period-on-period to $374,559. This continues the trend seen throughout fiscal 2010. While the past twelve months has seen revenue from this source grow, our customers remain in charge of the business rules offered to their consumers around storage and therefore future revenue growth in this area could be curtailed should any of our customers stop providing their own customers with free storage solutions.
| PNI Digital Media Inc. | |
| Management’s Discussion and Analysis | |
| For the period ended March 31, 2011 | Page 9 |
Expenses
| Description | Three Months Ended March 31, 2011 | Three Months Ended March 31, 2010 | Change | % Change | ||||||||||||
| Network delivery | $ | 992,188 | $ | 1,236,945 | $ | (244,757 | ) | (20 | )% | |||||||
| Software development | 2,822,743 | 1,875,028 | 947,715 | 51 | % | |||||||||||
| General and administration | 958,138 | 888,452 | 69,686 | 8 | % | |||||||||||
| Sales and marketing | 252,210 | 203,084 | 49,126 | 24 | % | |||||||||||
| 5,025,279 | 4,203,509 | 821,770 | 20 | % | ||||||||||||
| Share-based compensation | 160,303 | 181,872 | (21,569 | ) | (12 | )% | ||||||||||
| Amortization | 692,853 | 1,322,910 | (630,057 | ) | (48 | )% | ||||||||||
| Total | $ | 5,878,435 | $ | 5,708,291 | $ | 170,144 | 3 | % | ||||||||
Total expenses for the second quarter of fiscal 2011 are 3% higher than the second quarter of fiscal 2010. Excluding non-cash expenditures of share-based compensation and amortization, controllable cash expenses increased by 20% to $5,025,279.
The Company is currently working on a number of new initiatives in addition to supporting its existing customer base and as such is investing in additional development resources. It is anticipated that these initiatives will provide the Company with long-term benefits and potential future growth. While controllable cash costs increased period-on-period by 20%, revenue declined by 4%. Management believes the Company’s technology can be further leveraged in future periods, however, the increase in development headcount in recent quarters means that the overall cost base of the Company will likely show further period on period increases for several more quarters and the Company’s operating results will remain under pressure until our new product offerings are launched through retail partners. Should the Company suffer the loss of significant customers or change certain aspects of its current operations requiring additional development expenditures to be incurred, this relationship between revenues and costs may alter.
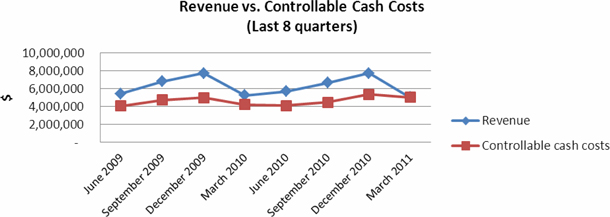
| PNI Digital Media Inc. | |
| Management’s Discussion and Analysis | |
| For the period ended March 31, 2011 | Page 10 |
Quarterly summary
Network delivery costs decreased $244,757, or 20% period-on-period. This decrease period-on-period was principally driven by reduced direct costs of fulfillment and lab system installations as a result of changes in sales volumes in these areas. In addition, the Company realized reductions in costs associated with operating its data center in the UK and in providing the customer support function on behalf of our customers. Part of the reduction in costs of providing the customer support function was achieved as a result of transferring additional work on to a third party professional call centre operation. The remainder of the reduction came as a result of improvements made to customer sites during the past twelve months, including the improvement of workflows and the addition of more on-line ‘self-serve’ help content. Being able to decrease these support costs while maintaining high levels of customer services and simultaneously dealing with a 10% period-on-period volume increase was a major achievement for the Company and the result of a significant effort made during the past year by various site design teams to improve the quality of our product and service offerings.
Software development expenses have increased $947,715 or 51% period-on-period. 92 % of the increase was due to the addition of new development staff during the past twelve months who have been recruited to support the new initiatives the Company is pursuing, including the development of online business printing services and social stationery products. The remainder of the increase relates to costs of supporting an increased number of development staff. Outside of staffing costs, steps continue to be taken to control all other costs in this area, including travel, staff training and general costs of the department. Staffing requirements continue to be monitored on a regular basis with reference to upcoming projects for new and existing customers, ongoing commitments to maintain current service offerings for existing customers and new product development.
General and administration expenses have increased by 8% to $958,138 period-on-period. The increase was mainly driven by increases in legal fees, and additional headcount and office running costs associated with supporting an increased number of development staff. The increase in legal fees was due to investigating the possible patent infringement case against one of our customers which was brought to the Company’s attention during the first quarter of fiscal 2011, further details of which can be found on page 20. In addition, approximately $35,000 in accretion expense was booked in the second quarter of fiscal 2010 relating to payments made to the prior owners of WorksMedia to acquire the business; whereas no accretion was recorded during the current quarter as all the amount owed to the prior owners was fully paid in fiscal 2010.
Sales and marketing expenses increased by 24% to $252,210 period-on-period as a result of an increase in headcount that began towards the end of the third quarter of fiscal 2010 as the Company strengthened both its sales team and also added further internal marketing resources who work closely with the Company’s retail partners in order to help them improve their strategic marketing plans. As a result of these increases in headcount, expenditures in this area are expected to remain at broadly similar levels to those seen this quarter in future periods.
Share-based compensation costs, representing both the cost of the Company’s stock based compensation awards issued to employees, directors and consultants of the Company and compensation expense associated with shares issued as part of the acquisition of WorksMedia, have decreased period-on-period by 12% to $160,303. The period-on-period decrease is principally driven by a decrease in stock option expense due to a period-on-period decrease in the number of options that vested during the current quarter, offset by additional share based compensation costs associated with the implementation of the Company’s Deferred Share Unit Incentive Plan during the first quarter of fiscal 2011.
| PNI Digital Media Inc. | |
| Management’s Discussion and Analysis | |
| For the period ended March 31, 2011 | Page 11 |
Amortization decreased by 48% period-on-period to $692,853. Amortization relates to a mixture of both the amortization of intangible assets as well as items of property and equipment. The decrease period-on-period was principally attributable to an approximate $586,000 decline in intangible asset amortization as a result of the intangible assets acquired as part of the Pixology acquisition in 2007 being fully amortized by the end of the third quarter of fiscal 2010.
Other income and expenses
During the second quarter, ended March 31, 2011, the Company recorded a realized foreign exchange loss of $57,549 and unrealized losses of $104,980. The unrealized loss arose primarily as a result of the translation of intercompany balances between the UK subsidiaries and the Canadian parent, whilst the realized loss arose primarily as a result of unfavorable changes in Canadian dollar exchange rates relative to the US dollar between the time sales invoices were raised and the receipt of funds.
In addition the Company incurred a loss on the disposal of property and equipment in the amount of $71,241. During the second quarter of fiscal 2011, the Company disposed of computer equipment no longer used, that was purchased in and prior to fiscal 2007 for proceeds of $1,650.
Cash flows
The Company recorded cash inflows from operations of $1,319,269 during the second quarter of fiscal 2011 compared to cash outflows of $3,298,942 during the second quarter of fiscal 2010. The change period-on period was principally due to the management of working capital with the remaining change due to an increase in controllable cash costs of 20% without a corresponding increase in revenues.
The Company’s most significant uses of cash in the current period were as follows:
| · | On a net basis, accounts payable and accrued liabilities were reduced by $764,333. |
| · | An investment of $479,393 was made in items of property and equipment, principally relating to additional storage equipment purchased to support the continuing growth in order volumes. |
| · | Payments totaling $139,589 were made to repurchase for cancellation shares of the Company under the terms of a Normal Course Issuer Bid that was originally approved by TSX-V in April 2010 and revised during October 2010 to enable the Company to purchase up to 5% of the outstanding common shares of the Company or approximately 1.7 million shares; |
The investment in items of property and equipment and payments to repurchase the Company’s own shares were funded from cash inflows from operations. Additional funds in the amount of $364,720 were raised through the issuance of common shares related to the exercise of stock options by executives, directors and employees.
| PNI Digital Media Inc. | |
| Management’s Discussion and Analysis | |
| For the period ended March 31, 2011 | Page 12 |
Results from operations: 6 Months Ended March 31, 2011
Revenue
| Description | Six Months Ended March 31, 2011 | Six Months Ended March 31, 2010 | Change | % Change | ||||||||||||
| Transaction fees | $ | 9,754,267 | $ | 10,033,737 | $ | (279,470 | ) | (3 | )% | |||||||
| Software licenses and installation fees | 1,434,236 | 1,532,348 | (98,112 | ) | (6 | )% | ||||||||||
| Membership fees | 865,662 | 842,179 | 23,483 | 3 | % | |||||||||||
| Professional fees | 21,822 | 109,293 | (87,471 | ) | (80 | )% | ||||||||||
| Archive fees | 689,081 | 500,378 | 188,703 | 38 | % | |||||||||||
| Total | $ | 12,765,068 | $ | 13,017,935 | $ | (252,857 | ) | (2 | )% | |||||||
Revenue (Constant currency basis)
| Description | Six Months Ended March 31, 2011 | Six Months Ended March 31, 2010 | Change | % Change | ||||||||||||
| Transaction fees | $ | 10,150,371 | $ | 10,033,737 | $ | 116,634 | 1 | % | ||||||||
| Software licenses and installation fees | 1,504,729 | 1,532,348 | (27,619 | ) | (2 | )% | ||||||||||
| Membership fees | 899,942 | 842,179 | 57,763 | 7 | % | |||||||||||
| Professional fees | 22,309 | 109,293 | (86,984 | ) | (80 | )% | ||||||||||
| Archive fees | 717,659 | 500,378 | 217,281 | 43 | % | |||||||||||
| Total | $ | 13,295,010 | $ | 13,017,935 | $ | 277,075 | 2 | % | ||||||||
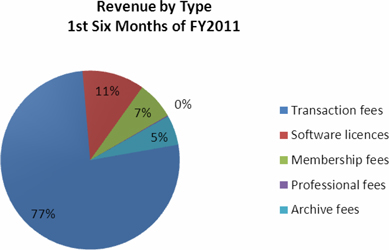
| PNI Digital Media Inc. | |
| Management’s Discussion and Analysis | |
| For the period ended March 31, 2011 | Page 13 |
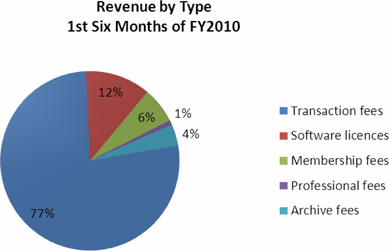
Revenues for the six months ended March 31, 2011 decreased $252,857 or 2% period-on-period to $12,765,068.
Revenue period-on-period was impacted by the following:
| · | A period-on-period decline of approximately 5% in the strength of both the US dollar and British Pound compared to the Canadian dollar negatively impacted revenue by $529,942. As 78% of the Company’s revenue was earned from either the United States or the United Kingdom during the period, a weakening in the value of the US dollar and British Pound relative to the Canadian dollar has a significant impact on financial results. |
| · | During the fourth quarter of fiscal 2010 the Company eliminated one of the instances where it was responsible for providing fulfillment of certain items sold and as a result realized lower revenue during the period of approximately $437,000. This change in circumstances also led to a reduction in network delivery costs during the period. |
While revenues declined period-on-period due to the two factors noted above, the number of orders placed through the PNI Platform increased by 13% reaching 10.1 million for the six month period.
Transaction fees continue to be the largest element of our revenue base and totaled $9,754,267 for the quarter, accounting for 77% of total recorded revenue and consistent with the second quarter of fiscal 2010. Transaction fees were negatively impacted by the following:
| · | A period-on-period decline in the strength of the US dollar and British Pound compared to the Canadian dollar resulting in approximately $396,000 in lower realized revenue; and |
| · | Elimination of an instance where the Company was responsible for providing fulfillment of certain items sold resulting in lower realized revenue of approximately $437,000. |
Had it not been for the two factors noted above, transaction fees would have increased period-on-period by 6% to approximately $10.6 million. After taking into consideration the two factors noted above, growth in Transaction fees continues to lag growth in order volume mainly due to changes in product mix which result in lower realized revenues for PNI based on our pricing structure with certain customers.
| PNI Digital Media Inc. | |
| Management’s Discussion and Analysis | |
| For the period ended March 31, 2011 | Page 14 |
Software license and installation fees fell by 6% during the period to $1,434,236. A large portion of revenue from this source continues to track at consistent levels each month through recurring license fees earned from some of our UK based customers, however as a result of a 5% period-on-period weakening of the UK pound relative to the Canadian dollar the amount of revenue booked in the consolidated financial statements has been impacted negatively by approximately $69,000. Other elements of this revenue are non-recurring and are earned either through developing and installing new sites for customers or by making sales of kiosk software licenses. A number of our contracts that provide for recurring revenue in this area expire during fiscal 2010 and therefore sales will become more difficult to predict as they will primarily become one-off in nature.
Membership fees are earned either through monthly fixed fees based on the number of locations customers have connected to the PNI Platform or through annual recurring service and maintenance revenue from customers who have purchased our kiosk software. Fees earned during six months ended March 31, 2011 totaled $865,662, representing growth of 3% period-on-period. Revenue earned from this source is largely recurring in nature and remains relatively stable period to period.
Professional fees have shown an overall decrease of 80% or $87,471 during the period compared to the first half of fiscal 2010. This is primarily due to a number of one-off projects completed on behalf of a number of our customers during the same period last year. Professional fee revenue is non-recurring in nature and dependant on both the demand from our customers and also the availability of internal resources to allocate to this kind of work. While we continue to expect projects to arise and be taken on in future periods this type of revenue stream is not seen as core to our business and may fluctuate considerably from period to period.
Archive fees, which represent charges made to our customers after the volume of data held on their behalf reaches pre-determined limits, have increased by 38% to $689,081 during the first half of fiscal 2011 compared to the same period in fiscal 2010. This continues the trend seen throughout fiscal 2010 as the amount of revenue we earned from this source increased steadily throughout the year. While the past twelve months has seen revenue from this source grow, our customers remain in charge of the business rules offered to their consumers around storage and therefore future revenue growth in this area could be curtailed should any of our customers stop providing their own customers with free storage solutions.
| PNI Digital Media Inc. | |
| Management’s Discussion and Analysis | |
| For the period ended March 31, 2011 | Page 15 |
Expenses
| Description | Six Months Ended March 31, 2011 | Six Months Ended March 31, 2010 | Change | % Change | ||||||||||||
| Network delivery | $ | 2,481,835 | $ | 3,183,153 | $ | (701,318 | ) | (22 | )% | |||||||
| Software development | 5,490,474 | 3,748,798 | 1,741,676 | 47 | % | |||||||||||
| General and administration | 1,879,631 | 1,848,372 | 31,259 | 2 | % | |||||||||||
| Sales and marketing | 519,387 | 431,646 | 87,741 | 20 | % | |||||||||||
| 10,371,327 | 9,211,969 | 1,159,358 | 13 | % | ||||||||||||
| Share-based compensation | 359,400 | 366,949 | (7,549 | ) | (2 | )% | ||||||||||
| Amortization | 1,382,232 | 2,695,726 | (1,313,494 | ) | (49 | )% | ||||||||||
| Total | $ | 12,112,959 | $ | 12,274,644 | $ | (161,685 | ) | (1 | )% | |||||||
Total expenses for the first half of fiscal 2011 are 1% less than for the same period of fiscal 2010. Excluding non-cash expenditures of share-based compensation and amortization, controllable cash expenses increased by 13%.
The Company is currently working on a number of new initiatives in addition to supporting its existing customer base and as such is investing in additional development resources. It is anticipated that these initiatives will provide the Company with long-term benefits and potential future growth. While controllable cash costs increased period-on-period by 13%, revenue declined by 2%. Management believes the Company’s technology can be further leveraged in future periods, however, the increase in development headcount in recent quarters means that the overall cost base of the Company will likely show further period on period increases for several more quarters and the Company’s operating results will remain under pressure until our new product offerings are launched through retail partners. Should the Company suffer the loss of significant customers or change certain aspects of its current operations requiring additional development expenditures to be incurred, this relationship between revenues and costs may alter.
Network delivery costs decreased $701,318, or 22% period-on-period. This decrease period-on-period was principally driven by reduced direct costs of fulfillment and lab system installations as a result of changes in sales volumes in these areas. In addition, the Company realized a reduction in costs of providing the customer support function on behalf of our customers. Part of this reduction was achieved as a result of transferring additional work on to a third party professional call centre operation. The remainder of the reduction came as a result of improvements made to customer sites during the past twelve months, including the improvement of workflows and the addition of more on-line ‘self-serve’ help content. Being able to decrease these support costs while maintaining high levels of customer services and simultaneously dealing with a 13% period-on-period volume increase was a major achievement for the Company and the result of a significant effort made during the past year by various site design teams to improve the quality of our product and service offerings.
| PNI Digital Media Inc. | |
| Management’s Discussion and Analysis | |
| For the period ended March 31, 2011 | Page 16 |
Software development expenses have increased $1,741,676 or 47% period-on-period. 88% of the increase was due to the addition of new development staff during the past twelve months who have been recruited to support the new initiatives the Company is pursuing, including the development of online business printing services and social stationery products. The remainder of the increase relates to costs of supporting an increased number of development staff. Outside of staffing costs, steps continue to be taken to control all other costs in this area, including travel, staff training and general costs of the department. Staffing requirements continue to be monitored on a regular basis with reference to upcoming projects for new and existing customers, ongoing commitments to maintain current service offerings for existing customers and new product development.
General and administration expenses have increased by $31,259 or 2% to $1,879,631 period-on-period. Period-on-period increases in accounting and legal fees, quarterly fees to non-executive members of the board, investor relations, travel costs, bank charges and bad debt expense were partially offset by a reduction in office running costs. Offsetting these increases was an amount of approximately $79,000 in accretion expense which was booked in the six months ended March 31, 2010 relating to payments made to the prior owners of WorksMedia to acquire the business. No accretion was recorded during the current quarter as all the amount owed to the prior owners was fully paid in fiscal 2010.
Sales and marketing expenses increased by $87,741 or 20% to $519,387 during the first half of the fiscal year as a result of an increase in headcount that began towards the end of the third quarter of fiscal 2010 as the Company strengthened both its sales team and also added further internal marketing resources who work closely with the Company’s retail partners in order to help them improve their strategic marketing plans.
Share-based compensation costs, representing both the cost of the Company’s stock based compensation awards issued to employees, directors and consultants of the Company and compensation expense associated with shares issued as part of the acquisition of WorksMedia, have decreased period-on-period by 2% to $359,400. The period-on-period decrease is principally driven by a decrease in stock option expense due to a period-on-period decrease in the number of options that vested during the current period; offset by additional share based compensation costs associated with the implementation of the Company’s Deferred Share Unit Incentive Plan during the first quarter of fiscal 2011, and the acceleration of a portion of the compensation expense associated with shares issued as part of the WorksMedia acquisition as a result of the change in the service period of one of the principal vendors of WorksMedia acquisition.
Amortization decreased by 49% period-on-period to $1,382,232. The amortization relates to a mixture of both the amortization of intangible assets as well as items of property and equipment. The decrease period-on-period was principally attributable to an approximate $1,225,000 decline in intangible asset amortization as a result of the intangible assets acquired as part of the Pixology acquisition in 2007 being fully amortized by the end of the third quarter of fiscal 2010.
| PNI Digital Media Inc. | |
| Management’s Discussion and Analysis | |
| For the period ended March 31, 2011 | Page 17 |
Other income and expenses
During the first half of fiscal 2011, the Company recorded a realized foreign exchange loss of $82,998 and unrealized gains of $90,908. The realized losses were incurred as a result of the weakening US dollar compared to the Canadian dollar and the collection of US denominated accounts receivable balances. The unrealized gains arose primarily as a result of the translation of inter-company balances between the UK subsidiaries and the Canadian parent.
In addition, the Company incurred losses on the disposal of property and equipment in the amount of $90,713. During the first half of fiscal 2011, the Company has disposed of computer equipment no longer used, that was purchased in and prior to fiscal 2007 for proceeds of $2,459.
Cash flows
The Company recorded cash inflows from operations of $1,185,959 during the first half of fiscal 2011 compared to cash inflows from operations of $974,152 during the same period of fiscal 2010. The change period-on-period was principally due to:
| · | An increase in cash flow from the management of working capital; |
| · | The prior period including one-off payments totaling $189,778 relating to the break of the Company’s UK property lease and cost of returning the property to its original condition; offset by |
| · | Offset by an increase in controllable cash costs of 13% without a corresponding increase in revenues. |
The Company’s most significant uses of cash in the current period were as follows:
| · | On a net basis, accounts payable and accrued liabilities were reduced by $2,330,537. |
| · | An investment of $857,417 was made in items of property and equipment; |
| · | Payments totaling $279,950 were made to repurchase for cancellation shares of the Company under the terms of a Normal Course Issuer Bid that was originally approved by TSX-V in April 2010 and revised during the first quarter of fiscal 2011 to enable the Company to purchase up to 5% of the outstanding common shares of the Company or approximately 1.7 million shares; |
| · | Payment of $107,964 was made to repay the capital element of the Company’s equipment lease, and represents the final payment associated with this financing arrangement. |
The investment in items of property and equipment, payments to repurchase the Company’s own shares and payments against the capital lease were funded out of the Company’s cash inflows from operations. Additional funds in the amount of $364,720 were raised through the issuance of common shares related to the exercise of stock options by executives, directors and employees.
| PNI Digital Media Inc. | |
| Management’s Discussion and Analysis | |
| For the period ended March 31, 2011 | Page 18 |
Non-GAAP Financial Measures
The following table provides a reconciliation of the Company’s profit reported in accordance with GAAP to non-GAAP Adjusted EBITDA.
| Three Months Ended | ||||||||
| March 31, 2011 | March 31, 2010 | |||||||
| Net (loss) in accordance with GAAP | $ | (852,479 | ) | $ | (90,886 | ) | ||
| Amortization | 692,853 | 1,322,910 | ||||||
| Interest expense | 15 | 21,915 | ||||||
| Income tax (benefit) expense | (228,478 | ) | 36,246 | |||||
| Stock based compensation expense | 160,303 | 181,872 | ||||||
| Unrealized foreign exchange loss (gain) | 104,980 | (458,835 | ) | |||||
| Adjusted EBITDA | $ | (122,806 | ) | $ | 1,013,222 | |||
| Adjusted EBITDA per share – Basic | $ | (0.00 | ) | $ | 0.03 | |||
| Weighted average shares outstanding – Basic | 33,788,064 | 33,749,332 | ||||||
| Six Months Ended | ||||||||
| March 31, 2011 | March 31, 2010 | |||||||
| Net earnings (loss) in accordance with GAAP | $ | 231,042 | $ | 1,153,437 | ||||
| Amortization | 1,382,232 | 2,695,726 | ||||||
| Interest expense | 5,551 | 50,798 | ||||||
| Income tax expense | 332,761 | 101,158 | ||||||
| Stock based compensation expense | 359,400 | 366,949 | ||||||
| Unrealized foreign exchange (gain) | (90,908 | ) | (626,808 | ) | ||||
| Adjusted EBITDA | $ | 2,220,078 | $ | 3,741,260 | ||||
| Adjusted EBITDA per share – Basic | $ | 0.07 | $ | 0.11 | ||||
| Adjusted EBITDA per share – Fully diluted | $ | 0.07 | $ | 0.11 | ||||
| Weighted average shares outstanding – Basic | 33,782,850 | 33,728,278 | ||||||
| Weighted average shares outstanding – Fully diluted | 33,894,331 | 33,861,794 | ||||||
The Company continues to provide all information required in accordance with GAAP, but believes evaluating its ongoing operating results may not be as useful if an investor is limited to reviewing only GAAP financial measures. Accordingly, the Company uses non-GAAP financial information to evaluate its ongoing operations and for internal planning and forecasting purposes. The primary non-GAAP financial measures utilized by the Company include adjusted EBITDA and adjusted EBITDA per share. Adjusted EBITDA is defined as earnings before interest expense, taxes, depreciation, amortization, unrealized foreign currency gains and losses and stock-based compensation.
| PNI Digital Media Inc. | |
| Management’s Discussion and Analysis | |
| For the period ended March 31, 2011 | Page 19 |
To supplement the Company's consolidated financial statements presented on a GAAP basis, we believe that these non-GAAP measures provide useful information about the Company's core operating results and thus are appropriate to enhance the overall understanding of the Company's past financial performance and its prospects for the future. These adjustments to the Company's GAAP results are made with the intent of providing both management and investors a more complete understanding of the Company's underlying operational results and trends and performance. Management uses these non-GAAP measures to evaluate the Company's financial results, develop budgets, manage expenditures, and determine employee compensation. The presentation of additional information is not meant to be considered in isolation or as a substitute for or superior to net income or net income per share determined in accordance with GAAP.
Contingencies and commitments
During the year ended September 30, 2010, the Company received notice from a former customer that a possible patent infringement had been brought to their attention regarding software which in previous years had been sold by one of our subsidiaries and which is unrelated to the PNI Platform and to the Company’s kiosk software. During the quarter ended December 31, 2010, the Company received notice from its former customer that a settlement had been reached between it and the entity that had been making the claims of patent infringement. As a result, the Company’s former customer requested that the Company pay a portion of the settlement amount under an indemnification clause included in the contract that was in place during the previous relationship. After considering all of the available facts, including the expected legal costs of disputing the matter, the Company agreed to pay a contribution of the settlement charge, up to a maximum amount of US$100,000. Subsequent to March 31, 2011, the Company continues to negotiate the final allocation of the settlement charge with the former customer and expects to conclude its discussions prior to the end of the three month period ended June 30, 2011. Included in the consolidated financial statements for the six month period ended March 31, 2011 is an accrual of US$80,000 representing the Company’s best estimate of the amount that it will be required to pay out.
During the three month period ended December 31, 2010, the Company received notice from a customer that a claim had been brought against them from a United States based entity (the “entity”), alleging that certain services offered by the Company’s customer infringed on a patent licenced by the entity. A portion of the services that are alleged to be in breach of this patent are provided by the Company. The Company’s customer had previously requested that the Company indemnify them from any damages resulting from this claim. Subsequent to the period end, the claim made against the Company’s customer was dismissed in full without prejudice. No payments were required to be made by the Company as a result of this dismissal and no adjustment has been made in these financial statements.
The contractual obligations and payments due as at March 31, 2011 are as follows:
| Payments due by period | ||||||||||||||||
| Total | Less than 1 year | 1-3 years | 3-5 years | |||||||||||||
| Property leases | 877,939 | 263,382 | 526,763 | 87,794 | ||||||||||||
| Other service agreements | 7,870,550 | 1,615,560 | 3,363,460 | 2,891,530 | ||||||||||||
| Purchase obligations | 39,073 | 39,073 | - | - | ||||||||||||
| 8,787,562 | 1,918,015 | 3,890,223 | 2,979,324 | |||||||||||||
| PNI Digital Media Inc. | |
| Management’s Discussion and Analysis | |
| For the period ended March 31, 2011 | Page 20 |
Bank Facility
In March 2010, the Company entered into a Credit Agreement with its bank (the “Bank”) which provides the Company with two separate credit facilities, being a $1,500,000 revolving demand facility (“Revolving Demand Facility) and a $750,000 reducing facility by way of Leases (“Lease Facility”). The two credit facilities and all other obligations of the Company to the Bank are secured by way of a General Security Agreement between the Bank and the Company, constituting a first ranking security interest in all personal property of the Company.
The Revolving Demand Facility bears interest at a rate of Bank prime + 1.50% and contains a financial covenant requiring us not to exceed a borrowing limit of 67% of good Canadian and US Accounts receivable less potential prior-ranking claims which include items such as sales and excise taxes, payroll liabilities, and overdue rent, property and business taxes. The Company has not drawn any amount with respect to the Revolving Demand Facility.
The Lease Facility will be subject to separate agreements between the Bank and the Company, and as at March 31, 2011 no amount has been drawn on this facility.
Liquidity and capital resources
Liquidity risk is the risk that the Company will encounter difficulty in meeting obligations associated with its financial liabilities that are settled by delivery of cash or other financial assets. The Company's approach to managing liquidity risk is to ensure it has sufficient cash available to manage the payment of its financial liabilities. The Company has the Revolving Demand Facility in place to help manage its liquidity position, thus its liquidity position is not solely dependent on its overall volume of business activity and its ability to manage the collection and payment of its accounts receivable and accounts payable through cash flow management techniques.
During the six month period ended March 31, 2011 the Company generated positive cash flow from operations of $1,185,958. During the same six month period its working capital improved by $750,396 to a surplus of $5,999,289. The Company's liquidity position may fluctuate during the year due to a number of factors which could include unanticipated changes to its volume of business, credit losses and the extent of capital expenditure in the year. The Company's liquidity position may also be adversely impacted by the seasonal nature of its business with the Company's busiest period of activity typically during the first quarter of the fiscal year. As the Company has a concentration of business with select key customers, its liquidity position would be adversely impacted if one of its key customer relationships was discontinued.
The Company primarily monitors its liquidity position through forecasting expected cash flows based on the timing of expected receipts and payments. Management monitors its cash balances and projections on a weekly and monthly basis. The starting point for its analysis is based upon the contractual maturity date of its liabilities and its expected collection period for its receivables. The Company has a positive working capital position of $5,999,289 at March 31, 2011 and it manages the payment of its financial liabilities based on available cash and matching the settlement of its financial liabilities to realized financial assets. The Company also monitors its debtor collection as described in the credit risk note above. As the Company's revenues are primarily collectible within 30 days of invoicing, which is performed weekly for some customers and monthly for others, the Company aims to be able to collect its accounts receivable more promptly than it settles its third party accounts payable. However, as certain of the Company's operating expenses such as its payroll obligations are contractually due at least monthly, the Company’s working capital level could periodically change depending on the timing of the maturity of its accounts receivable and accounts payable and accrued liabilities.
| PNI Digital Media Inc. | |
| Management’s Discussion and Analysis | |
| For the period ended March 31, 2011 | Page 21 |
In prior years the Company purchased a number of items of property and equipment using a finance lease. At September 30, 2010, the Company had an outstanding obligation under this lease of $107,964, all of which was paid by December 31, 2010.
The Company’s activities are being funded out of its operating cash flow. As a result of generating positive results during the six month period ending March 31, 2011 the Company has not encountered any difficulties doing so, however if positive results are not continued in future periods there is a risk that the Company would not be able to meet all of its contractual commitments when due.
Related Party Transactions
During the three month period ended March 31, 2011, the Company incurred legal fees of $32,004 (period ended March 31, 2010 - $31,382) for services provided by a law firm of which a director of the Company is a partner. Accounts payable and accrued liabilities at March 31, 2011 included $24,323 (September 30, 2010 $4,968) related to these services.
During the three month period ended March 31, 2011, the Company incurred consulting fees of $14,900 (period ended March 31, 2010 - $nil) for services provided by a company of which a Director and Officer of the Company controls. Accounts payable and accrued liabilities at March 31, 2011 included $nil (September 30, 2010 - $4,993) related to these services.
During the three month period ended March 31, 2011, the Company incurred expenses in relation to setting up e-mail marketing campaigns on behalf of a number of our retail customers of $nil (period ending March 31, 2010 - $11,316) and website services of $1,500 (period ended March 31, 2010 - $1,275) of which a director of the Company is Chairman and Chief Executive Officer. Accounts payable and accrued liabilities at March 31, 2011 included $500 (September 30, 2010 - $7,128) related to these services. The amounts charged were recorded at their exchange amount, which is the amount of consideration established and agreed to by the related parties and having normal trade terms.
The Company shares its UK premises with another company of which an Officer is a majority shareholder. During the three month period ended March 31, 2011, the Company was recharged its proportional share of office running costs totalling $54,132 (period ended March 31, 2010: $50,619) by this related party. In addition, during the three month period ended March 31, 2011, the Company used the software development services of this company, incurring costs of $17,064 (period ended March 31, 2010: $39,087). At March 31, 2011, accounts payable included $28,294 (September 30, 2010: $25,118) related to these services and cost recharges.
| PNI Digital Media Inc. | |
| Management’s Discussion and Analysis | |
| For the period ended March 31, 2011 | Page 22 |
Financial instruments
Credit risk
Financial instruments that potentially subject the Company to concentrations of credit risk consist of cash and cash equivalents and accounts receivable. The Company aims to protect its cash and cash equivalents from undue risk by holding them with various high credit quality financial institutions located in Canada and the United Kingdom. In circumstances in which a bank in which the Company holds a deposit has any significant decline in its credit rating, the Company carefully monitors the extent of any credit risk net of government deposit guarantees and, where appropriate, would take remedial action to minimise the risk of any potential credit loss. Of the amounts held with financial institutions on deposit, $177,965 is covered by either the Financial Services Compensation Scheme in the United Kingdom or the Canada Deposit Insurance Corporation, leaving $4,567,471 at risk should the financial institutions with which the deposits are held cease trading.
The Company's accounts receivable are all from large, well-known retailers located primarily in Canada, the United States and the United Kingdom. Credit risk from accounts receivable encompasses the default risk of retail customers. The Company manages its exposure to credit risk by only working with larger, reputable companies and prior to accepting new customers; the Company assesses the risk of default associated with a particular company. In addition, on an ongoing basis, management monitor the level of accounts receivable attributable to each customer and the length of time taken for amounts to be settled and where necessary, takes appropriate action to follow up on those balances considered overdue.
Management does not believe that there is significant credit risk arising from any of the Company's customers; however, should one of the Company's main customers be unable to settle amounts due, the impact on the Company could be significant. The maximum exposure to loss arising from accounts receivable is equal to their total carrying amounts. At March 31, 2011, five customers each account for 10% or more of total trade accounts receivable (March 31, 2010 – two customers).
Financial assets past due
At March 31, 2011, the Company has a provision of $182,766 against trade accounts receivable, the collection of which is considered doubtful.
| PNI Digital Media Inc. | |
| Management’s Discussion and Analysis | |
| For the period ended March 31, 2011 | Page 23 |
The following table provides information regarding the ageing of financial assets that are past due but which are not impaired.
At March 31, 2011
Financial assets that are past due but not impaired | ||||||||||||||||||||
Neither past due nor impaired | 31 – 60 days | 61 – 90 days | 91 days + | Carrying value on the balance sheet $ | ||||||||||||||||
| Trade accounts receivable | 2,168,146 | 858,087 | 41,508 | 549,695 | 3,617,436 | |||||||||||||||
| Commodity taxes recoverable | 144,562 | - | - | - | 144,562 | |||||||||||||||
| Other | 20,820 | - | - | - | 20,820 | |||||||||||||||
The definition of items that are past due is determined by reference to terms agreed with individual customers. Of the 91 days+ balance outstanding at March 31, 2011, 12% has been subsequently collected as at May 25, 2011. None of the amounts outstanding have been challenged by the respective customer(s) and the Company continues to conduct business with them on an ongoing basis. Accordingly, management has no reason to believe that this balance is not fully collectable in the future.
The Company reviews financial assets past due on an ongoing basis with the objective of identifying potential matters which could delay the collection of funds at an early stage. Once items are identified as being past due, contact is made with the respective company to determine the reason for the delay in payment and to establish an agreement to rectify the breach of contractual terms. At March 31, 2011, the Company had a provision for doubtful accounts of $182,766 which was made against trade accounts receivable in excess of twelve months old or where collection efforts to date have been unsuccessful. All amounts neither past due nor impaired are collectible from large, well-known retailers located in Canada, the United States and the United Kingdom. The Company is not aware of any information suggesting that the collectability of these amounts is in doubt.
Market risk
Market risk is the risk to the Company that the fair value or future cash flows of financial instruments will fluctuate due to changes in interest rates and foreign currency exchange rates. Market risk arises as a result of the Company generating revenues and incurring expenses in foreign currencies, holding cash and cash equivalents which earn interest and having operations based in the United Kingdom in the form of its wholly owned subsidiary, PNI Digital Media Europe Ltd.
| PNI Digital Media Inc. | |
| Management’s Discussion and Analysis | |
| For the period ended March 31, 2011 | Page 24 |
Interest rate risk
The only financial instruments that expose the Company to interest rate risk are its cash and cash equivalents. The Company’s objectives of managing its cash and cash equivalents are to ensure sufficient funds are maintained on hand at all times to meet day-to-day requirements and to place any amounts which are considered in excess of day-to-day requirements on short-term deposit with the Company's banks so that they earn interest. When placing amounts of cash and cash equivalents on short-term deposit, the Company only uses high quality commercial banks and ensures that access to the amounts placed can be obtained on short-notice.
Currency risk
The Company generates revenues and incurs expenses and expenditures primarily in Canada, the United States and the United Kingdom and is exposed to risk from changes in foreign currency rates. In addition, the Company holds financial assets and liabilities in foreign currencies that expose the Company to foreign exchange risks. The Company does not utilise any financial instruments or cash management policies to mitigate the risks arising from changes in foreign currency rates.
At March 31, 2011, through its wholly owned subsidiaries, the Company had cash and cash equivalents of $2,473,647, accounts receivable of $1,004,358 and accounts payable of $982,239 which were denominated in UK £. In addition, at March 31, 2011, the Company had cash and cash equivalents of $2,221,511, accounts receivable of $1,652,773 and accounts payable of $1,121,434 which were denominated in US$.
Sensitivity analysis
The Company has completed a sensitivity analysis to estimate the impact on net earnings for the period which a change in foreign exchange rates or interest rates during the three months ended March 31, 2011 would have had.
This sensitivity analysis includes the following assumptions:
| · | Changes in individual foreign exchange rates do not cause foreign exchange rates in other countries to alter |
| · | Changes in market interest rates do not cause a change in foreign exchange rates |
The results of the foreign exchange rate sensitivity analysis can be seen in the following table:
Impact on net profit $ | ||||
| Change of +/- 10% in US$ foreign exchange rate | +/-275,260 | |||
| Change of +/- 10% in UK£ foreign exchange rate | +/-512,613 | |||
The above results arise primarily as a result of the Company having US$ denominated trade accounts receivable balances, trade accounts payable balances and bank account balances.
| PNI Digital Media Inc. | |
| Management’s Discussion and Analysis | |
| For the period ended March 31, 2011 | Page 25 |
Limitations of sensitivity analysis
The above table demonstrates the effect of either a change in foreign exchange rates or interest rates in isolation. In reality, there is a correlation between the two factors.
Additionally, the financial position of the Company may vary at the time that a change in either of these factors occurs, causing the impact on the Company’s results to differ from that shown above.
Income taxes
During the year ended September 30, 2010, the Company recorded a net income tax recovery of $4,809,864 representing a charge for current year income tax expense of $11,892 and a release of the Company’s valuation allowance against deductible temporary differences, and available loss carry-forwards totaling $4,821,756.
Due to the Company’s history of loss making activities, in prior years there was sufficient uncertainty regarding the ability of the group to generate profits in future periods and as a result, the Company determined that it was appropriate to take a full valuation allowance against the available future income tax assets associated with loss carry-forwards. Based on current results and future projections, management has determined that it is more likely than not that a portion of the losses available to the Company will be utilized and accordingly, an element of the valuation allowance was released and a net future income tax asset totaling $5,861,504 was recorded on the balance sheet as at September 30, 2010.
During the six month period ended March 31, 2011, the Company recorded an income tax expense in the amount of $332,761 (March 31, 2010: $101,158) mainly associated with the realization of a portion of the future tax asset.
| PNI Digital Media Inc. | |
| Management’s Discussion and Analysis | |
| For the period ended March 31, 2011 | Page 26 |
Condensed quarterly financial information
The following table provides selected quarterly information for our eight most recent quarters. This information is unaudited, but reflects all adjustments of a normal, recurring nature which are, in the opinion of management, necessary to present a fair statement of our results of operations for the periods presented. Quarter-to-quarter comparisons of our financial results are not necessarily meaningful and should not be relied upon as an indicator of future performance.
| Mar 31, 2011 | Dec 31, 2010 | Sep 30, 2010 | Jun 30, 2010 | |||||||||||||
| Revenue | $ | 5,031,263 | $ | 7,733,805 | $ | 6,657,414 | $ | 5,681,221 | ||||||||
| Net (loss) profit for the period | (852,479 | ) | 1,083,521 | 5,808,317 | (109,760 | ) | ||||||||||
| Basic (loss) profit per share | (0.03 | ) | 0.03 | 0.17 | (0.00 | ) | ||||||||||
| Fully diluted (loss) profit per share | (0.03 | ) | 0.03 | 0.17 | (0.00 | ) | ||||||||||
| Mar 31, 2010 | Dec 31, 2009 | Sep 30, 2009 | Jun 30, 2009 | |||||||||||||
| Revenue | $ | 5,261,722 | $ | 7,756,213 | $ | 6,811,437 | $ | 5,443,760 | ||||||||
| Net profit (loss) for the period | (90,886 | ) | 1,244,323 | 642,806 | (1,877,992 | ) | ||||||||||
| Basic profit (loss) per share | (0.00 | ) | 0.04 | 0.02 | (0.05 | ) | ||||||||||
| Fully diluted profit (loss) per share | (0.00 | ) | 0.04 | 0.02 | (0.05 | ) | ||||||||||
Quarterly revenue breakdown
| Mar 31, 2011 | Dec 31, 2010 | Sep 30, 2010 | Jun 30, 2010 | |||||||||||||
| Transaction fees | $ | 3,454,606 | $ | 6,299,661 | $ | 4,938,524 | $ | 4,359,745 | ||||||||
| Software licences and installation fees | 777,775 | 656,461 | 969,246 | 573,303 | ||||||||||||
| Membership fees | 416,846 | 448,816 | 409,752 | 426,944 | ||||||||||||
| Professional fees | 7,477 | 14,345 | 12,897 | 31,869 | ||||||||||||
| Archive fees | 374,559 | 314,522 | 326,995 | 289,360 | ||||||||||||
| $ | 5,031,263 | $ | 7,733,805 | $ | 6,657,414 | $ | 5,681,221 | |||||||||
| Mar 31, 2010 | Dec 31, 2009 | Sep 30, 2009 | Jun 30, 2009 | |||||||||||||
| Transaction fees | $ | 3,727,516 | $ | 6,306,221 | $ | 4,946,441 | $ | 3,905,096 | ||||||||
| Software licences and installation fees | 756,983 | 775,363 | 1,133,422 | 941,393 | ||||||||||||
| Membership fees | 445,777 | 396,402 | 432,186 | 367,594 | ||||||||||||
| Professional fees | 62,236 | 47,057 | 104,087 | 52,420 | ||||||||||||
| Archive fees | 269,210 | 231,170 | 195,301 | 177,257 | ||||||||||||
| $ | 5,261,722 | $ | 7,756,213 | $ | 6,811,437 | $ | 5,443,760 | |||||||||
| PNI Digital Media Inc. | |
| Management’s Discussion and Analysis | |
| For the period ended March 31, 2011 | Page 27 |
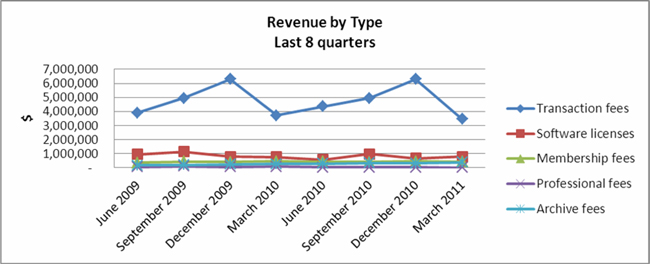
Outstanding share information
The following table provides outstanding share information for the Company as at March 31, 2011 and May 25, 2011.
| May 25, 2011 | March 31, 2011 | |||||||
| Authorized | ||||||||
| Common shares | Unlimited | Unlimited | ||||||
| Preferred shares | Unlimited | Unlimited | ||||||
| Issued and outstanding | ||||||||
| Common shares – issued | 34,298,858 | 34,298,858 | ||||||
| Common shares - outstanding | 34,120,358 | 34,120,358 | ||||||
| Preferred shares | - | - | ||||||
| Options | ||||||||
| Outstanding | 2,013,223 | 2,072,555 | ||||||
| Exercisable | 1,707,669 | 1,711,445 | ||||||
| Deferred share units | ||||||||
| Issued | 290,600 | 306,600 | ||||||
| Outstanding | 290,600 | 306,600 | ||||||
| PNI Digital Media Inc. | |
| Management’s Discussion and Analysis | |
| For the period ended March 31, 2011 | Page 28 |
Recently issued accounting standards
CICA Handbook Sections 1582, Business Combinations; 1601, Consolidated Financial Statements and 1602, Non-Controlling Interests
In January 2008, the CICA issued Handbook Sections 1582, Business Combinations; 1601, Consolidated Financial Statements and 1602, Non-Controlling Interests. These sections replace the former CICA Handbook Section 1581, Business Combinations and CICA 1600, Consolidated Financial Statements and establish a new section for accounting for a non-controlling interest in a subsidiary. These sections also provide the Canadian equivalent to IFRS 3, Business Combinations and IAS 27, Consolidated and Separate Financial Statements.
CICA 1582 is effective for business combinations for which the acquisition date is on or after the beginning of the first annual reporting period beginning on or after January 1, 2011. CICA 1601 and CICA 1602 apply to interim and annual consolidated financial statements relating to years beginning on or after January 1, 2011.
EIC 175, Revenue Arrangements with Multiple Developments
In December 2009, the CICA issued Emerging Issue Committee Abstract (“EIC”) 175, Revenue Arrangement with multiple Deliverables an amendment to EIC 142, “Revenue Arrangements with Multiple Deliverables”. EIC 175 provides guidance on certain aspects of the accounting for arrangements under which the Company will perform multiple revenue-generating activities. Under the new guidance, when vendor specific objective evidence or third party evidence for deliverables in an arrangement cannot be determined, a best estimate of the selling price is required to separate deliverables and allocate arrangement consideration using the relative selling price method. EIC 175 also includes new disclosure requirements on how the application of the relative selling price method affects the timing and amount of revenue recognition. EIC 175 is effective prospectively, with retrospective adoption permitted, for revenue arrangements entered into or materially modified in fiscal years beginning on or after January 1, 2011.
Management is currently in the process of determining the impact of this EIC on the Company’s consolidated financial statements.
Recent US GAAP pronouncements
| (h) | Recent adopted U.S. standards |
Accounting Standards Update 2009-05
Effective October 1, 2009, the Company adopted ASU 2009-05, “Fair Value Measurements and Disclosures”. The ASU provides a number of amendments to Subtopic 820-10, “Fair Value Measurements and Disclosures – Overall”, regarding the fair value measurements of liabilities. The adoption of this ASU did not have a significant impact on the financial statements of the Company.
| PNI Digital Media Inc. | |
| Management’s Discussion and Analysis | |
| For the period ended March 31, 2011 | Page 29 |
Accounting Standards Update 2009-06
Effective October 1, 2009 the Company adopted ASU 2009-06, “Income Taxes”. ASU 2009-06 provides additional implementation guidance on accounting for uncertainty in income taxes. The adoption of this ASU has had no significant impact on the financial statements of the Company.
Accounting Standards Update 2009-13
In October 2009, the FASB released ASU 2009-13, “Multiple-deliverable revenue arrangements”. ASU 2009-13 is effective for revenue arrangements entered into or materially modified in years beginning on or after June 15, 2010 and provides another alternative for determining the selling price of deliverables and eliminates the residual method of allocating arrangement consideration. The adoption of this ASU has not had a significant impact on the financial statements of the Company.
Accounting Standards Update 2009-14
In October 2009, the FASB released ASU 2009-14, “Revenue arrangements that include software elements”. ASU 2009-14 is effective for revenue arrangements entered into or materially modified in years beginning on or after June 15, 2010 and removes non-software components of tangible products and certain software components of tangible products from the scope of existing software revenue guidance resulting in the recognition of revenue similar to that for other tangible products. The adoption of this ASU has not had a significant impact on the financial statements of the Company.
Accounting Standards Update 2010-02
In January 2010, the FASB released ASU 2010-02, “Consolidation (Topic 810): accounting and reporting for decreases in ownership of a subsidiary – a scope clarification”. ASU 2010-02 is effective at the beginning of the period ending on or after December 15, 2009 and describes amendments that clarify the types of transactions that should be accounted for as a decrease in ownership of a subsidiary as set forth in consolidations topic of the FASB Accounting Standards Codification (Subtopic 810-10). The Board’s objective in making the amendments is to remove the potential conflict between guidance in that Subtopic and asset de-recognition and gain or loss recognition guidance that may exist in other U.S. GAAP. The adoption of this ASU has had no impact on the financial statements of the Company.
Accounting Standards Update 2010-05
In January 2010, the FASB released ASU 2010-05, “Compensation – Stock Compensation (Topic 718): escrowed share arrangements and the presumption of compensation”. ASU 2010-05 codifies EITF Topic D-110, escrowed share arrangements and the Presumption of Compensation, and amends paragraphs 505-50-S25-3, 718-10-S25-1, and 718-10-S99-2. The adoption of these amendments had no impact on these financial statements.
Accounting Standards Update 2010-06
In January 2010, the FASB released ASU 2010-06, “Fair Value Measurements and Disclosures (Topic 820): improving disclosures about fair value measurements”. The ASU provides a number of amendments to Subtopic 820-10, that require new disclosures and that clarify certain existing disclosures related to fair value measurements. ASU 2010-06 is effective at the beginning of the period ending on or after December 15, 2009. The adoption of this ASU did not have a significant impact on these financial statements.
| PNI Digital Media Inc. | |
| Management’s Discussion and Analysis | |
| For the period ended March 31, 2011 | Page 30 |
Accounting Standards Update 2010-08
In February 2010, the FASB released ASU 2010-08, “Technical corrections to various topics”. ASU 2010-08 was issued to amend certain US GAAP provisions to eliminate inconsistencies, outdated provisions and provide further clarifications where required. The Board concluded that the guidance in the amendments will not result in pervasive changes to current practice, and while none of the provisions in the amendments in this ASU fundamentally change U.S. GAAP, certain clarifications made to the guidance on embedded derivatives and hedging (Subtopic 815-15) may cause a change in the application of that Subtopic and, thus, special transition provisions are provided for accounting changes related to that Subtopic. The amendments in ASU 2010-08 are effective for the first reporting period beginning after issuance, except for certain amendments made to Topic 815 which are effective for fiscal years beginning after December 15, 2009. The amendments of this ASU have had no impact on the financial statements of the Company.
Accounting Standards Update 2010-09
In February 2010, the FASB released ASU 2010-09, “Subsequent Events (Topic 855): amendments to certain recognition and disclosure requirements. The amendments in ASU 2010-09 are effective upon issuance, and address certain implementation issues including: (i) eliminating the requirement for SEC filers to disclose the date through which it has evaluated subsequent events; (ii) clarifying the period through which conduit bond obligors must evaluate subsequent events; and (iii) refining the scope of the disclosure requirements for reissued financial statements. The Board’s objective in making the amendments is to remove potential conflicts between U.S. GAAP and SEC guidance. The adoption of this ASU has had no significant impact on the financial statements of the Company.
Accounting Standards Update 2010-11
In March 2010, the FASB released ASU 2010-11, “Derivatives and Hedging (Topic 815): scope exception related to embedded credit derivatives”. The amendments in ASU 2010-11 are effective for each reporting entity at the beginning of its first fiscal quarter beginning after June 15, 2010. ASU 2010-11 provides clarifications and related additional examples to improve financial reporting by resolving potential ambiguity about the breadth of the embedded credit derivative scope exception in paragraphs 815-15-15-8 through 15-9 of Topic 815. The adoption of this ASU has had no impact on the financial statements of the Company.
Accounting Standards Update 2010-12
In April 2010, the FASB released ASU 2010-12, “Income Taxes (Topic 740): accounting for certain tax effects of the 2010 health care reform acts”. ASU 2010-12 codifies Subtopic 740-10. The amendments have had no impact on the financial statements of the Company.
| PNI Digital Media Inc. | |
| Management’s Discussion and Analysis | |
| For the period ended March 31, 2011 | Page 31 |
Accounting Standards Update 2010-20
In July 2010, the FASB released ASU 2010-20, “Receivables (Topic 310)”. ASU 2010-20 is effective for interim and annual reporting periods ending on or after December 15, 2010. The objective of ASU 2010-20 is to provide additional information to assist financial statement users in assessing an entity’s credit risk exposures and evaluating the adequacy of its allowance for credit losses as it relates to an entity’s portfolio of financing receivables. The amendments in ASU 2010-20 affect all entities with financing receivables, excluding short-term trade accounts receivable or receivables at fair value or lower of cost or fair value. The amendments have had no impact on the financial statements of the Company.
Accounting Standards Update 2010-21
In August 2010, the FASB released ASU 2010-21, “Accounting for Technical Amendments to Various SEC Rules and Schedules”. ASU 2010-21 amends various SEC paragraphs pursuant to the issuance of Release No. 33-9026: Technical Amendments to Rules, Forms, Schedules and Codification of Financial Reporting Policies. The amendments have had no impact on the financial statements of the Company.
Accounting Standards Update 2010-22
In August 2010, the FASB released ASU 2010-22, “Accounting for Various Topics”. ASU 2010-22 amends various SEC paragraphs based on external comments received and the issuance of SAB 112, which amends or rescinds portions of certain SAB topics. The amendments have had no impact on the financial statements of the Company.
Accounting Standards Update 2010-28
In December 2010, the FASB released ASU 2010-28, “Intangibles – Goodwill and Other (Topic 350): When to Perform Step 2 of the Goodwill Impairment Test for Reporting Units with Zero or Negative Carrying Amounts”. The amendments in ASU 2010-28 are effective for fiscal years, and interim periods within those years, beginning after December 15, 2010. The objective of ASU 2010-28 is to address circumstances where entities have concluded that despite factors that indicate goodwill assigned to a reporting unit may be impaired, Step 2 of the goodwill impairment test (measuring the amount of impairment loss) is not performed as reporting units with zero or negative carrying amounts will generally have a fair value greater than zero. ASU 2010-28 modifies Step 1 of the goodwill impairment test to require an entity to perform Step 2 of the goodwill impairment test, for reporting units with zero or negative carrying amounts if it is more likely than not that a goodwill impairment exists. The amendments have had no impact on the financial statements of the Company.
Business Combinations
In December 2007, the Financial Accounting Standards Board (FASB) issued new accounting guidance as outlined in ASC 805, Business Combinations regarding business combinations and non-controlling interests in consolidated financial statements. This new guidance retains the fundamental requirements in previous guidance for business combinations requiring that the use of the purchase method be used for all business combinations. The acquirer is required to recognize the assets acquired, the liabilities assumed, and any non-controlling interest in the acquiree at the acquisition date, measured at their fair values as of that date. Additionally, business combinations will now require that acquisition costs to be expensed as incurred, the recognition of contingencies, restructuring costs associated with a business combination must generally be expensed and changes in deferred tax asset valuation allowances and income tax uncertainties after the acquisition date generally will affect income tax expense. This guidance applies prospectively to business combinations for which the acquisition date is on or after the beginning of the first annual reporting period beginning on or after December 15, 2008, which is the year ending September 30, 2010 for the Company. Since adoption of this standard, effective October 1, 2009, the Company has not undertaken any transactions to which these revised rules apply.
| PNI Digital Media Inc. | |
| Management’s Discussion and Analysis | |
| For the period ended March 31, 2011 | Page 32 |
Non-controlling Interests in Consolidated Financial Statements
In December 2007, the FASB clarified guidance on non-controlling interests in consolidated financial statements. The clarification requires ownership interests in subsidiaries held by other parties to be classified as equity in the consolidated financial statements and changes in ownership interests in a subsidiary to be accounted for as equity transactions. Deconsolidation of a subsidiary is to be accounted for at fair value. This update is applicable for fiscal years beginning on or after December 15, 2008 on a prospective basis, except for the presentation and disclosure requirements which are to be applied to all periods presented. The Company does not currently have any partially owned subsidiaries and does not expect, based on its current structure, the adoption, effective October 1, 2009 to have any significant impact.
Determination of the Useful Life of Intangible Assets
Effective October 1, 2009 the Company adopted FASB’s updated guidance as outlined in ASC 350, Intangibles – Goodwill and Other regarding the factors that should be considered in developing renewal or extension assumptions used to determine the useful life of a recognized intangible asset. The intent of this revised guidance is to improve the consistency between the useful life of a recognized intangible and the period of expected cash flows used to measure the fair value of the asset. The adoption of this revised guidance has not had a significant impact on the financial statements of the Company.
| (i) | Recent U.S. announcements |
Accounting Standards Update 2010-13
In April 2010, the FASB released ASU 2010-13, “Compensation – Stock Compensation (Topic 718): effect of denominating the exercise price of a share based payment award in the currency of the market in which the underlying equity security trades – a consensus of the FASB Emerging Issues Task Force.” ASU 2010-13 is effective for fiscal years, and interim periods within those fiscal years, beginning on or after December 15, 2010. ASU 2010-13 clarifies that a share-based payment award with an exercise price denominated in the currency of a market in which a substantial portion of the entity’s equity securities trades should not be considered to contain a condition that is not a market, performance, or service condition, therefore such an award should not be classified as a liability. The Company does not anticipate the amendments of ASU 2010-13 will have a financial impact on the Company’s results.
| PNI Digital Media Inc. | |
| Management’s Discussion and Analysis | |
| For the period ended March 31, 2011 | Page 33 |
Accounting Standards Update 2010-29
In December 2010, the FASB released ASU 2010-29 “Business Combinations (Topic 805) – Disclosure of Supplementary Pro Forma Information for Business Combinations”. The objective of ASU 2010-29 is to address diversity in practice about the interpretation of the pro forma revenue and earnings disclosure requirements for business combinations. Under ASU 2010-29, if a public entity presents comparative financial statements, the entity should disclose revenue and earnings of the combined entity as though the business combination(s) that occurred during the current year had occurred as of the beginning of the comparable prior annual reporting period only. The amendments in ASU 2010-29 are effective prospectively for business combinations for which the acquisition date is on or after the beginning of the first annual reporting period beginning on or after December 15, 2010. The amendments have had no impact on the financial statements of the Company.
International Financial Reporting Standards (“IFRS”)
In February 2008, the Canadian Accounting Standards Board (“AcSB”) confirmed that the use of IFRS will be required in 2011 for publicly accountable enterprises in Canada. In October 2009, the AcSB issued a third and final Omnibus Exposure Draft confirming that publicly accountable enterprises in Canada will be required to apply IFRS, in full and without modification for fiscal years beginning on or after January 1, 2011. For the Company, this will be the fiscal year beginning on October 1, 2011.
The Company’s IFRS transition will require the restatement, for comparative purposes, of amounts reported on the Company’s opening IFRS balance sheet as at October 1, 2010 and amounts reported by the Company for the year ended September 30, 2011.
IFRS Conversion Project
The Company commenced its IFRS conversion project during 2009 and has established a formal project governance structure which includes the audit committee and a separate steering committee comprised of Cory Kent, Robert Chisholm and Kyle Hall as well as other members of senior management. The Company has engaged an independent external advisor to assist with the conversion project.
The Company’s IFRS conversion project addresses matters including changes in accounting policies, IT and data systems, restatement of comparative periods, organizational and internal controls and any required changes to the business processes. The Company has reviewed its internal and disclosure control processes and believes they will not need significant modification as a result of the conversion to IFRS. Further, the Company has assessed the impact on IT and data systems and has concluded there will be no significant impact to applications arising from the transition to IFRS.
The Company’s IFRS conversion project consists of three stages; scoping and diagnostics, analysis and implementation.
Stage one; Scoping and Diagnostics involves project planning and identification of differences between current Canadian GAAP and IFRS and is now complete. The Company has identified those differences which are expected to have the highest impact on the Company.
Stage two; Analysis involves detailed diagnostics and evaluation of the financial impacts of various options and alternative methodologies provided for under IFRS; identification and design of operational and financial business processes; initial staff training; analysis of IFRS 1 optional exemptions and mandatory exceptions to the general requirement for full retrospective application upon transition and summarization of new disclosure requirements upon adoption of IFRS. This stage is currently underway; preliminary findings from this stage are discussed under IFRS First-Time Adoption of International Financial Reporting Standards and Significant Impacts on Transition to IFRS below.
| PNI Digital Media Inc. | |
| Management’s Discussion and Analysis | |
| For the period ended March 31, 2011 | Page 34 |
Stage three; Implementation will involve the execution of any changes to business or financial processes that were identified during stage one or two, formal authorization of any accounting policy changes that will be implemented and further training as necessary. All necessary information required to complete our first set of IFRS compliant financial statements will be collected during this stage. This stage is expected to be completed during the fourth quarter of fiscal 2011.
IFRS 1 First-Time Adoption of International Financial Reporting Standards
Adoption of IFRS requires the application of IFRS 1 First-time Adoption of International Financial Reporting Standards, which provides guidance for an entity’s initial adoption of IFRS. IFRS 1 gives entities adopting IFRS for the first time a number of optional exemptions and mandatory exceptions, in certain areas, to the general requirement for full retrospective application of IFRS. The following are the optional exemptions available under IFRS 1 that the Company currently intends to elect on transition to IFRS. The Company continues to review all IFRS 1 exemptions and will implement those determined to be most appropriate in the circumstances on transition to IFRS. The list below should not be regarded as a complete list of IFRS 1 that are available to the Company on transition to IFRS.
Share-based payments
IFRS 1 permits the application of IFRS 2 Share Based Payments only to equity instruments granted after November 7, 2002 that had not vested by the date of transition to IFRS. The Company intends to apply this exemption and will apply IFRS 2 for equity instruments granted after November 7, 2002 that had not vested by October 1, 2010.
Business combinations
Under IFRS 1 an entity has the option to retroactively apply IFRS 3 Business Combinations to all business combinations or may elect to apply the standard prospectively only to those business combinations that occur after the date of transition. The Company expects to elect this exemption under IFRS 1, which removes the requirement to retrospectively restate all business combinations prior to the date of transition to IFRS.
Cumulative translation differences
The application of IAS 21 The Effects of Changes in Foreign Exchange Rates requires translation differences arising on translation of foreign operations to be accumulated in a separate reserve within equity. A first-time adopter has the option to reset its cumulative translation differences at the date of transition to IFRS. We expect to elect this exemption, which would involve re-classifying the cumulative translation differences to retained earnings on October 1, 2010.
| PNI Digital Media Inc. | |
| Management’s Discussion and Analysis | |
| For the period ended March 31, 2011 | Page 35 |
Significant Impacts on Transition to IFRS
The Company has completed its initial assessment of the impacts of the transition to IFRS. Based on an analysis of Canadian GAAP and IFRS, the Company identified significant differences between current accounting policies and those expected to apply in preparing IFRS consolidated financial statements. In the determination of what constitutes a significant impact to the Company’s consolidated financial statements, we have identified the following:
| · | Areas of difference between IFRS and Canadian GAAP which have a significant opening day transition financial statement impact; and |
| · | Areas of difference between IFRS and Canadian GAAP which present greater risk of potential future financial statement impact. |
Information on those changes that management considers most significant to the Company are presented below.
Share-based payments
The Company will modify its accounting for stock-based compensation in two significant respects to conform with the guidance in IFRS 2 Share-Based Payments.
Under Canadian GAAP, the fair value of stock-based awards with multiple installments are calculated as one grant and the resulting fair value is recognized on a straight-line basis over the vesting period. Forfeitures of awards are recognized as they occur.
Under IFRS, fair value measurement is required for each vesting installment within the grant. Each installment must be valued separately, based on assumptions determined from historical data, and recognized as compensation expense over each installment’s individual tranche vesting period. Forfeiture estimates are incorporated into the initial measurement of stock-based compensation, and are revised for actual forfeitures in subsequent periods.
The adoption of IFRS 2 Share-Based Payments will likely result in an increase in the amount of stock-based compensation expense recognized during the year ended September 30, 2011.
Income taxes
There are certain differences between IAS 12 Income Taxes and the corresponding guidance in Canadian GAAP that may result in recognition and measurement adjustments for the Company on transition to IFRS. These differences relate to the recognition of deferred tax benefits realized after a business combination, the reversal of a valuation allowance relating to equity items, and the ability to offset future tax assets of one entity in a consolidated group against future income tax liabilities of another entity in a consolidated group.
The Company is currently performing a detailed analysis of IAS 12 Income Taxes and relevant transactions to determine the measurement impact of adopting this standard.
The discussion above on potential significant impacts on transition to IFRS is provided to allow readers to obtain a better understanding of the Company’s IFRS changeover plan and the resulting potential effects on the Company’s consolidated financial statements. Readers are cautioned, however, that it may not be appropriate to use such information for any other purpose. This discussion reflects the Company’s most recent assumptions and expectations; circumstances may arise, such as changes in IFRS, regulations or economic conditions, which could change these assumptions or expectations. The Company is still in the process of completing the selection of IFRS accounting policies and the quantification of identified differences. Accordingly, the discussion above is subject to change.
| PNI Digital Media Inc. | |
| Management’s Discussion and Analysis | |
| For the period ended March 31, 2011 | Page 36 |
Critical accounting estimates
The Company prepares its financial statements in accordance with Canadian Generally Accepted Accounting Principles (“GAAP”). The preparation of consolidated financial statements in conformity with GAAP requires management to make estimates and assumptions that affect the reported amounts of assets and liabilities and disclosure of contingent assets and liabilities at the date of the financial statements and the reported amounts of revenues and expenses during the reporting period. Estimates are based upon historical experience and various other assumptions that are believed to be reasonable under the circumstances. These estimates are evaluated on an ongoing basis and form the basis for making judgments regarding the carrying values of assets and liabilities and the reported amount of revenues and expenses. Actual results may differ from these estimates under different assumptions.
Stock-based compensation
The Company grants stock options to directors, employees and consultants of the Company as an element of compensation. The cost of the service received as consideration is measured based on an estimate of fair value at the date of grant. The grant-date fair value is recognized as compensation expense over the related service period with a corresponding increase in contributed surplus. On exercise of stock options, consideration received together with the compensation expense previously recorded to contributed surplus is credited to share capital. The Company uses the Black-Scholes option pricing model to estimate the fair value of each stock option. This option pricing model takes into account, as of the grant date, the exercise price, the expected life of the option, the current price of the underlying stock and its expected volatility, expected dividends on the stock, staff turnover, and the risk-free interest rate over the expected life of the option.
Goodwill and intangible assets
Intangible assets acquired both individually or with a group of other assets are initially recognized and measured at cost. The cost of a group of intangible assets acquired in a transaction, including those acquired in a business combination that meet the specified criteria for recognition apart from goodwill, is allocated to the individual assets acquired based on their fair values. Intangible assets with finite useful lives are amortized over their estimated useful lives. The amortization methods and estimated useful lives of intangible assets are reviewed annually. Intangible assets with indefinite useful lives are not amortized and are tested for impairment annually or more frequently if events or changes in circumstances indicate that the asset might be impaired. The impairment test compares the carrying amount of the intangible asset with its fair value, and an impairment loss would be recognized in income for the excess, if any.
Intangible assets with finite useful lives, including acquired software and customer relationships, are amortized over their estimated useful lives of three years.
Goodwill is allocated as of the date of the business combination to the Company’s reporting units that are expected to benefit from the synergies of the business combination. Goodwill is not amortized and is tested for impairment annually or more frequently if events or changes in circumstances indicate that the asset might be impaired. Goodwill of the reporting unit is considered to be impaired when the carrying amount of the reporting unit exceeds its fair value. An impairment loss, if any, is recognized as a separate line item in the statement of earnings.
| PNI Digital Media Inc. | |
| Management’s Discussion and Analysis | |
| For the period ended March 31, 2011 | Page 37 |
The process of determining the nature and amount of the individual intangible assets and for carrying out annual impairment tests, calls for considerable use of judgment, and requires all parties involved to make estimates and assumptions regarding future cash flow projections, future operating costs and appropriate discount rates to be used in the calculations. These determinations impact the amount that is initially recorded as goodwill or other intangible assets and the amortization expense to be recognized in future periods over the estimated useful lives of the intangible assets. Changes in estimates and assumptions can affect the reported value of goodwill and other intangible assets with indefinite useful lives.
Future income taxes
The Company follows the asset and liability method of accounting for income taxes. Under this method, future income tax assets and liabilities are recognized for the expected future tax consequences attributable to differences between the tax basis of assets and liabilities and their respective reported amounts, and tax losses carried forward. The resulting changes in the net future income tax asset or liability are included in income. Future income tax assets and liabilities are measured using substantively enacted tax rates expected to apply to taxable income in the years in which temporary differences are expected to be recovered or settled. The effect on future income tax assets and liabilities of a change in tax rates is included in income when a change in tax rates is substantively enacted. Future income tax assets are evaluated periodically and if realization is not considered “more likely than not” a valuation allowance is provided. At March 31, 2011 the Company has a net future income tax asset of $5,495,321.
At the end of the Company’s last fiscal year, September 30, 2010, the Company had net operating loss carry-forwards for Canadian tax purposes of approximately $8,812,504 that are available for carry forward to reduce taxable income in future years. In addition, the Company had $17,235,764 (£10,591,633) of losses for tax purposes in the United Kingdom which are available to reduce taxable income in future periods.
Business risks
The Company is subject to various risks and uncertainties that can significantly affect its financial performance. Key risks include the following:
Market and competition
There are inherent risks in the market for technological solutions. With the recent mass acceptance of the digital camera and camera cellular phone, the photography industry is quickly moving to employ an online technology, such as that offered by the Company. The Company’s primary competition consists of very large, established corporations which can afford to meet the ever changing demands of this marketplace. To the extent that the Company does not have, or cannot continue to raise, the funds necessary to expand its market offering or to penetrate this market in a timely and cost effective manner, or achieve cost-effective pricing for its services, the Company’s business growth could be adversely affected.
Changes in technology
The markets in which the Company operates are characterized by changing technology and evolving industry standards. The Company’s ability to anticipate changes in technology, technical standards and service offerings is a significant factor in its ability to compete or expand into new markets. With limited experience in meeting customer requirements, there can be no assurance that the Company will be successful in continuing to identify, develop and market service offerings that will respond to technological change, evolving standards or individual customer standards and requirements.
| PNI Digital Media Inc. | |
| Management’s Discussion and Analysis | |
| For the period ended March 31, 2011 | Page 38 |
Dependence on key people
The Company’s growth and continued success depend on its ability to attract, retain, train and motivate highly skilled people. There can be significant competition for such people. There can be no assurance that the Company can retain its current key employees or attract and retain additional employees as needed. The loss of certain key employees could have an adverse impact upon the Company’s growth, business and profitability.
Potential for liability
There is a risk that the Company’s systems may contain errors or defects or fail to perform. The Company currently contractually limits its liability for damages arising from its provision of services. While this is true of the vast majority of the Company’s contracts today, such limitations of liability may not have been included in all of the Company’s contractual arrangements in the past. Where such limitations have been included, there can be no assurance that they will be enforceable in all circumstances and will protect the Company from liability for damages. Furthermore, litigation regardless of contracts could result in substantial cost to the Company, divert management’s attention and resources from the Company’s operation, and result in negative publicity that may impair the Company’s ongoing marketing efforts.
Currency exchange risk
Transaction risk. The Company has customers in various countries around the World and in some cases issues invoices in the customer’s currency. As a result of this, the Company is exposed to fluctuations in the value of the foreign currency in which invoices are raised compared to the functional currency of the entity that raised the invoice. The main exposure for the Company in this regard relates to fluctuations in the value of the U.S. dollar and U.K. pound against the Canadian dollar. At this time the Company does not employ a hedge program. However, if there is a material change in circumstances and if the Company’s expansion into either the U.S. or U.K. marketplaces place results in either a significant increase in revenues or expenses, then the level of the Company’s risks to changes in the exchange rate could become important. Monetary assets and liabilities denominated in a currency that is not the primary or functional currency of the related subsidiary are translated to the functional currency of the subsidiary at the rate of exchange in effect at the balance sheet date with any resulting gain or loss included in the statement of loss.
Translation risk. The Company translates the assets and liabilities of self-sustaining foreign operations to Canadian dollars at the rate of exchange prevailing at the balance sheet dates. Gains and losses resulting from these translation adjustments for self-sustaining foreign operations are recorded in accumulated other comprehensive income, a component of shareholders’ equity, until there is a realized reduction in the net investment in the foreign operation.
| PNI Digital Media Inc. | |
| Management’s Discussion and Analysis | |
| For the period ended March 31, 2011 | Page 39 |
Rapid growth and expansion
We have operations in Vancouver, Canada and Southampton, United Kingdom. Our rapid growth and expansion has placed and will continue to place, a strain on our administrative and operational infrastructure. Our ability to manage our operations and future growth will require us to continue to refine our operational, financial and management controls, human resource policies and reporting systems. If we are unable to manage future expansion, we may not be able to implement improvement to our controls, policies and systems in an efficient or timely manner which could impact the services we offer to our customers and our ultimately our business results.
Interruption to our network infrastructure
The satisfactory performance, reliability and availability of our network infrastructure is critical to our business. Any interruptions that result in the unavailability of services to our customers could result in financial penalties, damage our reputation and limit our ability to renew contracts with customers as they come due or win business from new customers. All of the hardware that makes up network infrastructure is located in secure third party locations in Canada and as a result we depend in part on these third parties to offer continued secure and reliable services including security, power, air conditioning and bandwidth. We have in place with these third parties service level agreements that provide us with financial compensation in the event of circumstances that interrupt the provision of services, however any financial compensation received under these agreements may not be sufficient to cover actions taken by our customers for their loss of business or the longer-term effects on our reputation if we are unable to maintain the services we are contractually required to.
Management’s statement of responsibility
The consolidated financial statements contained in this report have been prepared by management in accordance with generally accepted accounting principles in Canada and have been approved by the Board of Directors. The integrity and objectivity of the consolidated financial statements are the responsibility of management. In addition, management is responsible for all other information in this report and for ensuring that this information is consistent, where appropriate, with the information contained in the consolidated financial statements.
Management maintains a system of internal accounting controls to provide reasonable assurance that the Company’s assets are safeguarded and accounted for, and to facilitate the preparation of relevant, reliable, and timely financial information. Where necessary, management uses its best judgment to make estimates required to ensure fair and consistent presentation of this information.
The Company's management, including the Chief Executive Officer (CEO) and Chief Financial Officer (CFO), believe that any disclosure controls and procedures or internal controls and procedures, no matter how well conceived and operated, can provide only reasonable, not absolute, assurance that the objectives of the control system are met.
The CEO and the CFO have evaluated the design and operation of the Company’s disclosure controls and procedures related to the preparation of Management’s discussion and analysis and the consolidated financial statements. They have concluded that the Company’s disclosure controls and procedures were effective.
| PNI Digital Media Inc. | |
| Management’s Discussion and Analysis | |
| For the period ended March 31, 2011 | Page 40 |
Further, the design of a control system must reflect the fact that there are resource constraints, and the benefits of controls must be considered relative to their costs. Because of the inherent limitations in all control systems, they cannot provide absolute assurance that all control issues and instances of fraud, if any, within the Company have been prevented or detected. These inherent limitations include the realities that judgments in decision-making can be faulty, and that breakdowns can occur because of a simple error or mistake. Additionally, controls can be circumvented by the individual acts of some persons, by collusion of two or more people, or by unauthorized override of the control. The design of any systems of controls also is based in part upon certain assumptions about the likelihood of future events, and there can be no assurance that any design will succeed in achieving its stated goals under all potential future conditions. Accordingly, because of the inherent limitations in a cost effective control system, misstatements due to error or fraud may occur and not be detected.
There has been no change in the Company’s disclosure controls or internal control over financial reporting during the three month period ended March 31, 2011 that have materially affected, or are reasonably likely to materially affect, the Company’s internal control over financial reporting.
Based on the evaluation of the design and operating effectiveness of the company’s internal controls over financial reporting, the CEO and the CFO concluded that the company’s internal control over financial reporting was effective as at March 31, 2011.
The Board of Directors is responsible for ensuring that management fulfills its responsibilities for financial reporting and internal control, and exercises this responsibility principally through the Audit Committee. The Audit Committee includes three directors, two of whom are not involved in the daily operations of the Company. The functions of the Audit Committee are to review the quarterly and annual consolidated financial statements; review the adequacy of the system of internal controls; review any relevant accounting, financial and security regulatory matters; and recommend the appointment of external auditors.
Forward looking statements
This Management’s discussion and analysis contains statements about expected future events and financial and operating results of PNI Digital Media Inc. that are forward-looking. By their nature, forward-looking statements require the Company to make assumptions and are subject to inherent risks and uncertainties. These forward-looking statements are based on current expectations. There is substantial risk that forward-looking statements will not prove to be accurate. Readers are cautioned not to place undue reliance on the Company’s forward-looking statements as a number of factors including, but not limited to, changes in the market for our services, changes in the economy, increasing competition in our market, the risk of loss of current customers, risks related to changes in technology, employee retention, inability to deliver on contracts, failure of customers to adequately market the online photo-finishing services they provide, foreign exchange, and risks with respect to our financial capacity could cause actual future results, conditions, actions or events to differ materially from targets, expectations, estimates or intentions expressed in the forward-looking statements; many of which are beyond the Company’s control.
| PNI Digital Media Inc. | |
| Management’s Discussion and Analysis | |
| For the period ended March 31, 2011 | Page 41 |
Future events and results may vary significantly from what the Company currently foresees. We are under no obligation to update or alter the forward-looking statements whether as a result of new information, future events or otherwise. For a more detailed discussion of factors that may affect actual results, see the section entitled “Business Risks”.
Additional information
Additional information related to the Company can be found on SEDAR at www.sedar.com and on the SEC’s website at www.sec.gov/edgar.shtml
| PNI Digital Media Inc. | |
| Management’s Discussion and Analysis | |
| For the period ended March 31, 2011 | Page 42 |
| News Release |
PNI Digital Media Announces Fiscal 2011 Second Quarter Financial Results
VANCOUVER, BC – May 26th, 2011 - PNI Digital Media (TSX–V: PN; OTCBB: PNDMF), (“PNI” or the “Company”), the leading innovator in digital media solutions for retailers, announced financial results for the second quarter of Fiscal Year 2011. Revenue for the quarter was $5.0 million. If foreign currency exchange rates had remained constant, revenue for the quarter would have been approximately $5.2 million, compared to $5.3 million during the same period last year.
Fiscal 2011 Second Quarter Financial and Operational Highlights:
| · | Transacted 3.6 million orders over the PNI Digital Media Platform, a 10% increase compared to the second quarter of Fiscal 2010 |
| · | Revenue of $5.0 million, compared to $5.3 million in second quarter of Fiscal 2010 |
| · | Transactional revenue of $3.5 million, compared to $3.7 million during the second quarter of Fiscal 2010 Transaction fees represented 69% of total revenue for the quarter, consistent with the same period last year |
| · | Non-GAAP adjusted EBITDA1 of $(0.1 million), compared to $1.0 million during the same period last year |
| · | GAAP net loss after income taxes of $852,000 for the quarter |
| · | The Company extended its agreement with Costco for an additional five year term through 2016 |
| · | More than 700 promotions were offered over the PNI Digital Media Platform during the quarter |
“Our second quarter is historically our weakest and this year was no exception,” said Kyle Hall, Chief Executive Officer of PNI Digital Media. “We were happy to announce our contract extension with Costco through 2016 and look forward to announcing more customer news as we are able.”
Conference Call
The Company will host a conference call on Thursday, May 26th, 2011 at 4:30pm ET (1:30pm PT) to discuss the Company’s Fiscal 2011 second quarter financial results. Mr. Kyle Hall, Chief Executive Officer, Mr. Aaron Rallo, President and Chief Operating Officer and Mr. Simon Bodymore, Chief Financial Officer will host the call.
To join the call, please dial (888) 241-0394 (US/Canada) or (647) 427-3413 (International) and quote conference ID no. 67562578. Please call 10 minutes prior to the scheduled start time. PNI Digital Media will also provide a live webcast and slide presentation, available on the Company's website at www.pnimedia.com/webcast. The presentation will be available for download for dial-in callers.
| Page 1 |
| News Release |
Consolidated Balance Sheets
| March 31, 2011 | September 30, 2010 | |||||||
| Assets | ||||||||
| Current assets | ||||||||
| Cash and cash equivalents | $ | 4,745,436 | $ | 4,690,355 | ||||
| Accounts receivable | 3,782,818 | 5,302,865 | ||||||
| Prepaid expenses and other current assets | 590,213 | 541,026 | ||||||
| Current portion of future income tax asset | 1,082,060 | 1,026,651 | ||||||
| 10,200,527 | 11,560,897 | |||||||
| Property and equipment | 5,617,962 | 5,230,829 | ||||||
| Future income tax asset | 4,531,907 | 4,953,934 | ||||||
| Intangible assets | 691,821 | 1,115,794 | ||||||
| Goodwill | 634,603 | 658,904 | ||||||
| $ | 21,667,946 | $ | 23,520,358 | |||||
| Liabilities | ||||||||
| Current liabilities | ||||||||
| Accounts payable and accrued liabilities | $ | 3,667,556 | $ | 5,471,878 | ||||
| Current portion of deferred revenue | 423,910 | 613,081 | ||||||
| Current portion of capital lease obligations | - | 107,964 | ||||||
| Future income tax liability | 109,772 | 119,081 | ||||||
| 4,201,238 | 6,312,004 | |||||||
| Deferred revenue | 55,713 | 78,876 | ||||||
| 4,256,951 | 6,390,880 | |||||||
| Shareholders’ Equity | ||||||||
| Share capital | $ | 66,633,431 | $ | 66,200,215 | ||||
| Contributed surplus | 18,944,573 | 18,933,619 | ||||||
| 85,578,004 | 85,133,834 | |||||||
| Deficit | (65,453,778 | ) | (65,684,820 | ) | ||||
| Accumulated other comprehensive loss | (2,713,231 | ) | (2,319,536 | ) | ||||
| (68,167,009 | ) | (68,004,356 | ) | |||||
| 17,410,995 | 17,129,478 | |||||||
| $ | 21,667,946 | $ | 23,520,358 | |||||
| Page 2 |
| News Release |
Consolidated Statements of Earnings and Comprehensive Gain
| Three Months Ended | Six Months Ended | |||||||||||||||
| March 31, 2011 | March 31, 2010 | March 31, 2011 | March 31, 2010 | |||||||||||||
| Revenue | $ | 5,031,263 | $ | 5,261,722 | $ | 12,765,068 | $ | 13,017,935 | ||||||||
| Expenses | ||||||||||||||||
| Network delivery | 992,498 | 1,238,269 | 2,482,453 | 3,185,953 | ||||||||||||
| Software development | 2,879,128 | 1,922,796 | 5,607,417 | 3,847,388 | ||||||||||||
| General and administration | 1,056,037 | 1,009,289 | 2,079,828 | 2,090,047 | ||||||||||||
| Sales and marketing | 257,919 | 215,027 | 561,029 | 455,530 | ||||||||||||
| Amortization | 692,853 | 1,322,910 | 1,382,232 | 2,695,726 | ||||||||||||
| 5,878,435 | 5,708,291 | 12,112,959 | 12,274,644 | |||||||||||||
| (Loss) earnings from operations before the undernoted | (847,172 | ) | (446,569 | ) | 652,109 | 743,291 | ||||||||||
| Realized foreign exchange (loss) | (57,549 | ) | (40,434 | ) | (82,998 | ) | (60,575 | ) | ||||||||
| Unrealized foreign exchange (loss) gain | (104,980 | ) | 458,835 | 90,908 | 626,808 | |||||||||||
| Interest income | - | 253 | 48 | 679 | ||||||||||||
| Interest expense – capital lease | - | (21,915 | ) | (5,536 | ) | (49,238 | ) | |||||||||
| Interest expense - other | (15 | ) | - | (15 | ) | (1,560 | ) | |||||||||
| Loss on disposal of property and equipment | (71,241 | ) | - | (90,713 | ) | - | ||||||||||
| Loss on settlement of asset retirement obligation | - | (4,810 | ) | - | (4,810 | ) | ||||||||||
| (233,785 | ) | 391,929 | (88,306 | ) | 511,304 | |||||||||||
| (Loss) earnings before income taxes | (1,080,957 | ) | (54,640 | ) | 563,803 | 1,254,595 | ||||||||||
| Current income tax benefit (expense) | - | - | - | - | ||||||||||||
| Future income tax benefit (expense) | 228,478 | (36,246 | ) | (332,761 | ) | (101,158 | ) | |||||||||
| Net (loss) earnings | (852,479 | ) | (90,886 | ) | 231,042 | 1,153,437 | ||||||||||
| Other comprehensive gain (loss): | ||||||||||||||||
| Unrealized foreign exchange gain (loss) on translation of self sustaining foreign operations | 62,942 | (659,784 | ) | (393,695 | ) | (971,840 | ) | |||||||||
| Comprehensive (loss) gain | $ | (789,537 | ) | $ | (750,670 | ) | $ | (162,653 | ) | $ | 181,597 | |||||
| (Loss) earnings per share | ||||||||||||||||
| Basic | $ | (0.03 | ) | $ | (0.00 | ) | $ | 0.01 | $ | 0.03 | ||||||
| Fully diluted | $ | (0.03 | ) | $ | (0.00 | ) | $ | 0.01 | $ | 0.03 | ||||||
| Page 3 |
| News Release |
Non-GAAP Financial Measures
| Three Months Ended | ||||||||
| March 31, 2011 | March 31, 2010 | |||||||
| Net (loss) in accordance with GAAP | $ | (852,479 | ) | $ | (90,886 | ) | ||
| Amortization | 692,853 | 1,322,910 | ||||||
| Interest expense | 15 | 21,915 | ||||||
| Income tax (benefit) expense | (228,478 | ) | 36,246 | |||||
| Stock based compensation expense | 160,303 | 181,872 | ||||||
| Unrealized foreign exchange loss (gain) | 104,980 | (458,835 | ) | |||||
| Adjusted EBITDA | $ | (122,806 | ) | $ | 1,013,222 | |||
| Six Months Ended | ||||||||
| March 31, 2011 | March 31, 2010 | |||||||
| Net earnings (loss) in accordance with GAAP | $ | 231,042 | $ | 1,153,437 | ||||
| Amortization | 1,382,232 | 2,695,726 | ||||||
| Interest expense | 5,551 | 50,798 | ||||||
| Income tax expense | 332,761 | 101,158 | ||||||
| Stock based compensation expense | 359,400 | 366,949 | ||||||
| Unrealized foreign exchange (gain) | (90,908 | ) | (626,808 | ) | ||||
| Adjusted EBITDA | $ | 2,220,078 | $ | 3,741,260 | ||||
Notes:
1 - Non-GAAP Measures
The Company continues to provide all information required in accordance with GAAP, but believes evaluating its ongoing operating results may not be as useful if an investor is limited to reviewing only GAAP financial measures. Accordingly, the Company uses non-GAAP financial information to evaluate its ongoing operations and for internal planning and forecasting purposes. The primary non-GAAP financial measures utilized by the Company include adjusted EBITDA and adjusted EBITDA per share. Adjusted EBITDA is defined as earnings (loss) before interest expense, taxes, depreciation, amortization, unrealized foreign currency gains and losses and stock-based compensation.
To supplement the Company's financial statements presented on a GAAP basis, we believe that these non-GAAP measures provide useful information about the Company's core operating results and thus are appropriate to enhance the overall understanding of the Company's past financial performance and its prospects for the future. These adjustments to the Company's GAAP results are made with the intent of providing both management and investors a more complete understanding of the Company's underlying operational results and trends and performance. Management uses these non-GAAP measures to evaluate the Company's financial results, develop budgets, manage expenditures, and determine employee compensation. The presentation of additional information is not meant to be considered in isolation or as a substitute for or superior to net (loss) earnings or net (loss) earnings per share determined in accordance with GAAP.
| Page 4 |
| News Release |
Currency:
All amounts are expressed in Canadian dollars. This notice is qualified in its entirety by reference to the Company’s financial statements and accompanying Management Discussion and Analysis, which are accessible on the SEC’S website at www.sec.gov/edgar.shtml and on SEDAR at www.sedar.com.
About PNI Digital Media- Founded in 1995, PNI Digital Media operates the PNI Digital Media Platform, which provides transaction processing and order routing services for major retailers. The PNI Digital Media Platform connects consumer-ordered digital content, whether from online, in-store kiosks, desktop software or mobile phones, with retailers that have on-demand manufacturing capabilities for the production of personalized products such as photos, photo books and calendars, business cards and stationery. PNI Digital Media successfully generates millions of transactions each year for retailers and their thousands of locations worldwide.
Further information on our company can be found at www.pnimedia.com.
For Financial Information, Contact:
Simon Bodymore, CFO
(604) 893-8955 ext.229
For Investor Relations and Press, Contact:
Simon Cairns
(866) 544-4881
ir@pnimedia.com
The statements that are not historical facts contained in this release are forward-looking statements that involve risks and uncertainties. PNI Digital Media’s actual results could differ materially from those expressed or implied by such forward-looking statements. Factors that could cause or contribute to such differences include, but are not limited to, changes in technology, employee retention, inability to deliver on contracts, failure of customers to continue marketing the online solution, competition, general economic conditions, foreign exchange and other risks detailed in the Company’s annual report and other filings. Additional information related to the Company can be found on SEDAR at www.sedar.com and on the SEC’S website at www.sec.gov/edgar.shtml. The information contained herein is subject to change without notice. PNI Digital Media shall not be liable for technical or editorial errors or omissions contained herein.
The TSX Venture Exchange has neither approved nor disapproved the information contained in this release. PNI Digital Media relies upon litigation protection for "forward-looking" statements.
Neither TSX Venture Exchange nor its Regulation Services Provider (as that term is defined in the policies of the TSX Venture Exchange) accepts responsibility for the adequacy or accuracy of this release.
| Page 5 |