Exhibit 99.3
PNI Digital Media Inc.
(TSX: PN / OTCBB: PNDMF)
Management’s Discussion & Analysis
For the Three and Six Month Period March 31, 2012
May 10, 2012
| |
| PNI Digital Media Inc. | |
| Management's Discussion and Analysis | |
| For the three and six month period ended March 31, 2012 | Page 1 |
This discussion and analysis is a review of the operating results, financial condition, and business risks of PNI Digital Media Inc. (“PNI”, the “Company”, “we” or “our”). This discussion should be read in conjunction with the Management's Discussion and Analysis included in PNI's 2011 Annual Report and our consolidated financial statements and accompanying notes for the year ended September 30, 2011 and for the three and six months ended March 31, 2012. The financial information reported herein has been prepared in accordance with International Financial Reporting Standards (“IFRS”) and is presented in Canadian dollars, unless otherwise noted.
This discussion and analysis may contain forward-looking statements. Statements which are not historical facts reflect our views at May 10, 2012 with respect to future events and are subject to certain risks, uncertainties and assumptions. These risks and assumptions include, but are not limited to, changes in the market for our services, changes in the economy, increasing competition in our market, the risk of loss of current customers, risks related to changes in technology, risks related to our technology, employee retention, inability to deliver on contracts, failure of customers to adequately market the online photo-finishing services they provide, foreign exchange, and risks with respect to our financial capacity. Our actual results could differ materially from those expressed or implied by such forward-looking statements.
Business Highlights
Financial and Operational Highlights
Processed a record number of transactions during the period, 3.8 million compared to 3.6 million during the second quarter of fiscal 2011, a 4% increase
Revenue for the quarter was $5.0 million compared to $5.03 million in the second quarter of fiscal 2011
Revenue on a constant currency basis was $4.97 million compared to $5.03 million in the second quarter of fiscal 2011
Transactional revenue was $3.6 million, compared to $3.5 million in the second quarter of fiscal 2011
Transaction fees represented 73% of total revenue vs. 69% during the same period of fiscal 2011
Generated IFRS loss before income taxes for the quarter of $0.9 million compared to a loss of $1.1 million in the second quarter of fiscal 2011 and IFRS loss after income taxes of $0.4 million compared to $0.9 million in the second quarter of fiscal 2011
Non-IFRS adjusted EBITDA1was negative $39,233 during the second quarter of 2012, compared to a non-IFRS adjusted EBITDA of negative $122,806 during the second quarter of 2011
1– Adjusted EBITDA is a non-IFRS financial measure which the Company defines as net profit plus amortization, interest expense, tax expense, share-based compensation expense and unrealized foreign exchange loss (gain). A full reconciliation of the Company's results between
| |
| PNI Digital Media Inc. | |
| Management's Discussion and Analysis | |
| For the three and six month period ended March 31, 2012 | Page 2 |
these non-IFRS figures and the results in accordance with IFRS is included on page 21 of this MD&A.
Selected financial information
The following selected financial information has been prepared in accordance with International Financial Reporting Standards and is presented in Canadian dollars.
| | | | | | | | | |
| | Three Months Ended March 31, | Six Months Ended March 31, | |
| | | 2012 | | 2011 | | 2012 | | 2011 | |
| Revenue | $ | 5,005,226 | $ | 5,031,263 | $ | 11,955,602 | $ | 12,765,068 | |
| Gross Profit | $ | 2,734,547 | $ | 2,801,755 | $ | 7,093,354 | $ | 7,881,035 | |
| (Loss) Profit before income taxes | $ | (921,529) | $ | (1,137,941) | $ | 114,963 | $ | 376,282 | |
| (Loss) Profit for the period | $ | (360,711) | $ | (882,757) | $ | 679,512 | $ | 96,933 | |
| Basic earnings per common share | $ | (0.01) | $ | (0.03) | $ | 0.02 | $ | 0.00 | |
| Fully diluted earnings per common share | $ | (0.01) | $ | (0.03) | $ | 0.02 | $ | 0.00 | |
| | | | | |
| | | As at | |
| | | March 31, | | September | |
| | | 2012 | | 30, 2011 | |
| Total assets | $ | 24,842,734 | $ | 22,472,894 | |
| Net assets | $ | 19,585,995 | $ | 18,904,362 | |
| Working capital | $ | 5,953,322 | $ | 5,397,594 | |
| |
| PNI Digital Media Inc. | |
| Management's Discussion and Analysis | |
| For the three and six month period ended March 31, 2012 | Page 3 |
Business Overview:
The Company operates the PNI Digital Media Platform, which provides transaction processing and order routing services for major retailers. The PNI Digital Media Platform connects consumer ordered digital content, whether from in-store kiosks, online sites or desktop software, with retailers that have on-demand manufacturing capabilities for the production of merchandise such as photos and business documents. The Company successfully generates and routes millions of transactions each year for a range of retailers enabling thousands of locations worldwide.
The Company's customers include some of the largest retailers on a worldwide basis, including, Costco, SAM's Club, Blacks, CVS/Pharmacy, Tesco, ASDA, Walmart Canada, Kodak and Fujifilm among others.
The Company's core value proposition is to provide an effective and dynamic technology platform to allow its customers to transact and transport photo and digital media orders from the consumer, whether via a website over the internet or from an in-store kiosk, to the retailers production facilities. The technology that delivers this end to end service is generically known as the PNI Digital Media Platform (the “Platform” or “Network”). The Company earns revenue through multiple channels, including recording transaction fees for all such orders that pass through the Network.
The Company's goal is to provide leading retailers who have digital manufacturing facilities with the ability to produce merchandise on-demand from digital orders received via the internet or kiosk, including being able to support and enable one-hour photo operations.
The Company has built its current business around the conversion of photography from film-based to digital-based and has positioned itself to be one of the most significant providers of internet infrastructure that facilitates the delivery of digital imaging from order origination to fulfillment through our relationships with large retailers.
The digital photography market is intensely competitive with a wide range of companies competing for market share through various avenues. PNI does not have a consumer facing business model, instead positioning itself behind the established brand names of major retail partners. By positioning itself in such a manner, the Company is able to reduce some of its business risk as it is able to reduce reliance on one particular market segment or geographic concentration and does not have to concentrate on building consumer brand awareness of its own.
Direct competitors in the market who also provide digital print services on behalf of retailers include Snapfish (a division of Hewlett Packard), LifePics, Storefront.com Online Inc. and Photobox. Of these competitors, Snapfish is the only one which currently partners with large North American retailers of a size that is comparable to those serviced by the Company.
The competition for in-store kiosk software is provided by companies such as HP, Lucidiom, Storefront.com Online Inc., Kodak and Fujifilm. Although there continues to be an increased trend of business being conducted over the internet and away from the traditional store environment, a significant portion of photo and photo related business is still conducted in-store through kiosk interfaces and the Company believes there remains significant business potential
| |
| PNI Digital Media Inc. | |
| Management's Discussion and Analysis | |
| For the three and six month period ended March 31, 2012 | Page 4 |
to increase market share and revenue by connecting kiosk-based interfaces to the PNI Digital Media platform.
The Company has invested in, and is building a future towards, enabling e-commerce for all types of digital content for the retailers „Media Center . The PNI Digital Media Platform can enable this type of harmonized e-commerce activity, by enabling the routing of content to the manufacturing location(s) equipped to produce the end product.
Growth Strategy:
Our strategy for growth is to:
Continue to contract or partner with leading retailers and web portals in the photofinishing and photo gifting industry;
Innovate to deliver new product lines to our customers, such as our innovative new product lines for small business printing and social stationery;
Maintain service and product excellence for strong customer retention and development;
Maintain a close relationship with our customers by providing marketing solutions that encourage both new user adoption and accelerate existing user frequency;
Leverage off existing partnerships and work with distributors to expand internationally, including further deployments in Europe and Asia-Pacific; and
Provide a workplace conducive to attracting and retaining talented people.
Seasonality of Operations
Demand for photofinishing products is highly seasonal, with a significant proportion of recurring revenues being generated during the Company's first fiscal (fourth calendar) quarter. Due to the seasonal nature of our business, the results of operations for any interim period are not necessarily indicative of the results of operations to be expected for the fiscal year.
Dependence on General Economic Conditions
The majority of transactions conducted through the Company's Network are for the sale of personal items that help consumers preserve or share their memories. Because all of these sales are discretionary in nature, our results are influenced by general economic conditions.
Market Segmentation
The Company has two operating segments that have similar economic characteristics which are aggregated into a single reportable segment based on the manner in which the Company has organized its operations and provision of financial information to senior management.
| |
| PNI Digital Media Inc. | |
| Management's Discussion and Analysis | |
| For the three and six month period ended March 31, 2012 | Page 5 |
Revenue by geographic region
During the three and six months ended March 31, 2012 and 2011, the percentage of the Company's revenue earned by geographic segment was as follows:
| | | | | | | | |
| | Three Months Ended March 31, | | Six Months Ended March 31, | |
| | 2012 | | 2011 | | 2012 | | 2011 | |
| United States | 57 | % | 56 | % | 61 | % | 60 | % |
| Canada | 21 | % | 21 | % | 20 | % | 20 | % |
| Total North America | 78 | % | 77 | % | 81 | % | 80 | % |
| United Kingdom | 21 | % | 22 | % | 18 | % | 19 | % |
| Other | 1 | % | 1 | % | 1 | % | 1 | % |
| Total | 100 | % | 100 | % | 100 | % | 100 | % |
Results from operations: 3 Months Ended March 31, 2012
Revenue
| | | | | | | | | |
| | | Three Months | | Three Months | | | | | |
| | | Ended | | Ended | | | | | |
| Description | | March 31, 2012 | | March 31, 2011 | | Change | | % Change | |
| | | | | | | | | | |
| Transaction fees | $ | 3,648,613 | $ | 3,454,606 | $ | 194,007 | | 6 | % |
| Software licences and Installation fees | | 526,973 | | 777,775 | | (250,802 | ) | (32 | )% |
| Membership fees | | 447,959 | | 416,846 | | 31,113 | | 8 | % |
| Professional fees | | 116,524 | | 7,477 | | 109,047 | | 1,458 | % |
| Archive fees | | 265,157 | | 374,559 | | (109,402 | ) | (29 | )% |
| | | | | | | | | | |
| Total | $ | 5,005,226 | $ | 5,031,263 | $ | (26,037 | ) | (1 | )% |
| |
| PNI Digital Media Inc. | |
| Management's Discussion and Analysis | |
| For the three and six month period ended March 31, 2012 | Page 6 |
Revenue (Constant currency basis)
| | | | | | | | | |
| | | Three Months | | Three Months | | | | | |
| | | Ended | | Ended | | | | | |
| Description | | March 31, 2012 | | March 31, 2011 | | Change | | % Change | |
| | | | | | | | | | |
| Transaction fees | $ | 3,615,102 | $ | 3,454,606 | $ | 160,496 | | 5 | % |
| Software licences and Installation fees | | 527,638 | | 777,775 | | (250,137 | ) | (32 | )% |
| Membership fees | | 446,323 | | 416,846 | | 29,477 | | 7 | % |
| Professional fees | | 116,007 | | 7,477 | | 108,530 | | 1,452 | % |
| Archive fees | | 263,177 | | 374,559 | | (111,382 | ) | (30 | )% |
| | | | | | | | | | |
| Total | $ | 4,968,247 | $ | 5,031,263 | $ | (63,016 | ) | (1 | )% |
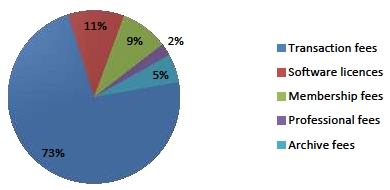
Revenue by Type
Q2 FY2012
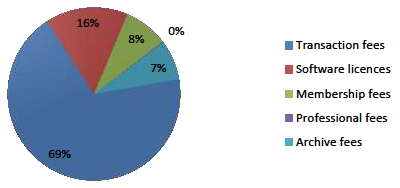
Revenue by Type
Q2 FY2011
| |
| PNI Digital Media Inc. | |
| Management's Discussion and Analysis | |
| For the three and six month period ended March 31, 2012 | Page 7 |
Revenues for the second quarter, ended March 31, 2012 were $5,005,226, reflecting a decline of $26,037, or 1% from revenues generated in the same period last year of $5,031,263.
Revenue period-on-period was mainly impacted by the following:
Decreases in software license and installation fees and archive fees of $250,000 and $111,000 respectively, as the Company performed less site installation and development work this period as compared to the previous year and the deletion of stored images as a result of our customers reducing the images stored for consumers whose accounts have been inactive over the previous twelve months; partially offset by
An increase in transaction fees of $160,000, this was mainly driven by an increase in order volumes;
An increase in professional fees of $109,000 as a result of one-off development work completed for customers;
A period-on-period strengthening of 2% in the strength of the US dollar compared to the Canadian dollar. As 57% of the Company's revenue was earned from the United States during the period, a strengthening in the value of the US dollar relative to the Canadian dollar has a significant impact on financial results. If exchange rates during the current quarter had been at the same levels as they were during the same period in fiscal 2011, revenue would have decreased period-on-period by approximately $37,000 or 1% to approximately $4.968 million.
While revenues decreased period-on-period, the number of orders placed through the PNI Platform increased by 4% reaching 3.8 million for the three month period, compared to 3.6 million in the same period last year.
Transaction fees continue to be the largest element of our revenue base and totaled $3,648,613 for the quarter, accounting for 73% of total recorded revenue as compared to 69% during the same period of fiscal 2011. Transaction fees were positively impacted by a period-on-period strengthening of the US dollar compared to the Canadian dollar resulting in approximately $34,000 in higher realized revenue.
After excluding the positive impact of the strengthening US dollar, transaction fees increased period-on-period by 5% to $3,615,102. The increase in transaction fees is mainly due to the increase in order volumes. In addition, unlike the last six months, the volume of prints ordered through our retailer sites remained strong and accounted for a larger element of the products sold than we've experienced in recent months.
Software license and installation fees fell by 32% period-on-period to $526,973. The period-on-period decline was principally due to performing less site installation and development work. While a portion of revenue from this source continues to track at consistent levels each month through recurring license fees earned from some of our UK based customers, other elements of this revenue are non-recurring and are earned either through developing and installing new sites for customers or by making sales of kiosk software licenses.
Membership fees are earned either through monthly fixed fees based on the number of locations customers have connected to the PNI Platform or through annual recurring service and maintenance revenue from customers who have purchased our kiosk software. Revenue from this source has increased period-on-period by 8% to $447,959, principally as a result of a period on period increase in the number of locations customers have connected to the PNI
| |
| PNI Digital Media Inc. | |
| Management's Discussion and Analysis | |
| For the three and six month period ended March 31, 2012 | Page 8 |
Platform as a result of the launch of the Rite Aid photocentre. Revenue earned from this source is largely recurring in nature and remains relatively stable period to period.
Professional fees have shown an overall increase of 1,458% period-on-period to $116,524. This is primarily due to a number of one-off projects completed on behalf of some of our customers this year compared to fewer such projects in the same period last year. Professional fee revenue is non-recurring in nature and dependant on both the demand from our customers and also the availability of internal resources to allocate to this kind of work. While we continue to expect projects to arise and be taken on in future periods this type of revenue stream is not seen as core to our business and may fluctuate considerably from period to period.
Archive fees, which represent charges made to our customers after the volume of data held on their behalf reaches pre-determined limits, decreased 29% period-on-period to $265,157. The period-on-period decrease is principally due to the deletion of stored images as a result of our customers reducing the images stored for consumers whose accounts have been inactive over the previous twelve months. Our customers remain in charge of the business rules offered to their consumers around storage and therefore future revenue in this area could be curtailed should any of our customers stop providing their own customers with free storage solutions.
Expenses
| | | | | | | | | |
| | | Three Months | | Three Months | | | | | |
| | | Ended | | Ended | | | | | |
| Description | | March 31, 2012 | | March 31, 2011 | | Change | | % Change | |
| | | | | | | | | |
| Cost of sales | $ | 1,663,640 | $ | 1,587,809 | $ | 75,831 | | 5 | % |
| | | | | | | | | |
| Operating expenses | | | | | | | | | |
| Software development | | 2,186,767 | | 2,227,122 | | (40,355 | ) | (2 | )% |
| General and administration | | 920,350 | | 958,138 | | (37,788 | ) | (4 | )% |
| Sales and marketing | | 250,006 | | 252,210 | | (2,204 | ) | (1 | )% |
| | | 5,020,763 | | 5,025,279 | | (4,516 | ) | (0 | )% |
| | | | | | | | | |
| Share-based compensation | | 65,492 | | 217,287 | | (151,795 | ) | (70 | )% |
| Amortization of property and equipment | | 417,678 | | 501,683 | | (84,005 | ) | (17 | )% |
| Amortization of intangible assets | | 268,467 | | 191,170 | | 77,297 | | 40 | % |
| Loss on disposal of property and equipment | | - | | 71,241 | | (71,241 | ) | (100 | )% |
| | | | | | | | | | |
| Total | $ | 5,772,400 | $ | 6,006,660 | $ | (234,260 | ) | (4 | )% |
Total expenses for the second quarter of fiscal 2012 are 4% less than the second quarter of fiscal 2011. Excluding non-cash expenditures of share-based compensation, amortization, and loss on disposal of property and equipment, controllable cash expenses remained broadly flat at $5,020,763.
While the Company has launched its new initiatives, social stationery and business printing, the Company has continued its investment in development resources to meet its planned roll out of its new offerings with additional customers. Management anticipates the technology can be
| |
| PNI Digital Media Inc. | |
| Management's Discussion and Analysis | |
| For the three and six month period ended March 31, 2012 | Page 9 |
further leveraged in future periods, and anticipates continuing the current investment in software development for the foreseeable future. Should the Company suffer the loss of significant customers or change certain aspects of its current operations requiring additional development expenditures to be incurred, this relationship between revenues and costs may alter.

Quarterly summary
Cost of sales and Gross Profit
Cost of sales is comprised of costs associated with providing hosting services to our customers, customer support provided on behalf of our customers, and costs of products sold as it relates to instances where the Company is responsible for fulfillment of certain items sold. Hosting services include costs for renting our data centers, personnel costs associated with maintaining and monitoring the performance of our network, personnel and consulting costs associated with maintaining our customer's sites and third party software licenses used in maintaining the performance of our network and platform. In addition, the Company includes costs for amortization of property and equipment used in our data centers, intangible assets such as acquired software and customer relationships, and internal use software related to revenue generating activities.
| | | | | | | | | | | | | | | | | | |
| | | Three months ended March 31, | |
| | | | | | 2012 | | | | | | | | | 2011 | | | | |
| | | Per
consolidated
financial
statements | | | Adjustments
(1)(2) (3) (4) | | | Controllable
cash
expense | | | Per
consolidated
financial
statements | | | Adjustments
(1)(2) (3) (4) | | | Controllable
cash
expense | |
| Revenue | $ | 5,005,226 | | $ | - | | $ | 5,005,226 | | $ | 5,031,263 | | $ | - | | $ | 5,031,263 | |
| Cost of sales | | 2,270,679 | | | (607,039 | ) | | 1,663,640 | | | 2,229,508 | | | (641,699 | ) | | 1,587,809 | |
| Gross Profit | | 2,734,547 | | | 607,039 | | | 3,341,586 | | | 2,801,755 | | | 641,699 | | | 3,443,454 | |
| | | | | | | | | | | | | | | | | | | |
| Gross Profit % | | 55 | % | | | | | 67 | % | | 56 | % | | | | | 68 | % |
Notes:
| (1) | Excludes amortization of property and equipment of $338,133 and $416,142 during the period ending March 31, 2012 and 2011 respectively. |
| (2) | Excludes amortization of intangible assets of $268,467 and $191,170 during the period ending March 31, 2012 and 2011 respectively. |
| |
| |
| PNI Digital Media Inc. | |
| Management's Discussion and Analysis | |
| For the three and six month period ended March 31, 2012 | Page 10 |
| (3) | Excludes loss on disposal of property and equipment during the period of $nil and $23,577 during the period ending March 31, 2012 and 2011 respectively. |
| (4) | Excludes share-based compensation during the period of $439 and $10,810 during the period ending March 31, 2012 and 2011 respectively. |
Cost of sales, after adjustments, increased period-on-period $75,831, or 5% to $1,663,640. The increase was principally driven by an increase in personnel costs (staff and short-term contractors) as a result of an increase in headcount to support and maintain the PNI Network as a result of increased order volumes, with the remaining increase associated with higher direct costs of fulfillment as a result of changes in sales volumes in this area and an increase in licensing fees associated with the use of third party software within the PNI Platform. These increases were offset by decreases in our third party call center and data center costs.
As a result of these period-on-period changes, gross profit, after adjustments, was 67% compared to 68% in the same period last year.
Operating expenses
| | | | | | | | | | | | | | | | |
| | | Three months ended March 31, | |
| | | | | | 2012 | | | | | | | 2011 | | | | |
| | | Per
consolidated
financial
statements | | | Adjustments
(1)(2) (3) | | | Controllable
cash
expense | | Per
consolidated
financial
statements | | Adjustments
(1)(2) (3) | | | Controllable
cash
expense | |
| Software development | $ | 2,272,113 | $ | | (85,346 | ) | $ | 2,186,767 | $ | 2,410,604 | $ | (183,482 | ) | $ | 2,227,122 | |
| General and administration | | 973,687 | | | (53,337 | ) | | 920,350 | | 1,092,311 | | (134,173 | ) | | 958,138 | |
| Sales and marketing | | 255,921 | | | (5,915 | ) | | 250,006 | | 274,237 | | (22,027 | ) | | 252,210 | |
| Total | $ | 3,501,721 | $ | | (144,598 | ) | $ | 3,357,123 | $ | 3,777,152 | $ | (339,682 | ) | $ | 3,437,470 | |
Notes:
| (1) | Software development: Excludes amortization of property and equipment of $66,798 and $72,356; loss on disposal of property and equipment of $nil and $40,784; and share-based compensation of $18,548 and $70,342 during the period ending March 31, 2012 and 2011 respectively. |
| (2) | General and administration: Excludes amortization of property and equipment of $7,307 and $7,440; loss on disposal of property and equipment of $nil and $3,931; and share-based compensation of $46,030 and $122,802 during the period ending March 31, 2012 and 2011 respectively. |
| (3) | Sales and marketing: Excludes amortization of property and equipment of $5,440 and $5,745; loss on disposal of property and equipment of $nil and $2,949; and share-based compensation of $475 and $13,333 during the period ending March 31, 2012 and 2011 respectively. |
Software development expenses, after adjustments, decreased by $40,355, or 2% to $2,186,767. The decrease is mainly driven by a 3% decline in personnel costs (staff and short-term contractors) as a result of the capitalization of $103,894 in staff costs; whereas in the same period last year no costs were capitalized.
Software development expenses include costs associated with customizing aspects of the Company's PNI Network software for specific customers as well as the cost of generating the Company's software used in the PNI Network and software sold to customers. The Company's policy is to classify software development costs between a research and development phase. The Company only capitalizes costs in the development phase if it is able to demonstrate that the software will generate future economic benefits.
| |
| PNI Digital Media Inc. | |
| Management's Discussion and Analysis | |
| For the three and six month period ended March 31, 2012 | Page 11 |
General and administration expenses, after adjustments, have decreased by $37,788, or 4% to $920,350 period-on-period. The decrease period-on-period is principally due to lower personnel costs (staff and short-term contractors), legal fees, and banking fees; offset by increases in travel costs and bad debt expense. The decrease in legal fees is due to the prior year including the costs of defending ourselves against allegations of certain patent infringements. As this case was dropped by the claimant shortly after it was commenced, the legal fees incurred were one-off in nature.
Sales and marketing expenses, after adjustments, have decreased by $2,204, or 1% to $250,006. During the current quarter, personnel costs were slightly lower than the same period in the previous year.
Share-based compensation costs, representing both the cost of the Company's share based compensation awards issued to employees, directors and consultants of the Company and compensation expense associated with shares issued as part of the acquisition of WorksMedia, have decreased period-on-period by $151,795, or 70% to $65,492. The period-on-period decrease is principally due to a combination of the Company not granting any share based compensation awards during the first half of fiscal 2012; whereas the Company issued awards in the previous year, and the requirement under IFRS that the expense associated with awards that vest on a graded schedule such as the Company's options, RSUs and PSUs be recognized on an accelerated basis.
Amortization expense related to property and equipment decreased by $84,005, or 17% to $417,678. The period-on-period decrease is mainly due to the fact the Company's amortization policy associated with Computer equipment is based on the declining balance amortization method which results in a large part of the cost of the asset being expensed at the beginning of an assets use with subsequently less taken in future periods. A portion of this decrease on the amortization of existing assets at the end of the first quarter of 2012 was partially offset by new purchases in the second quarter of fiscal 2012.
Amortization expense related to intangible assets increased by $77,297, or 40% to $268,467. The period-on-period increase is principally due to additional software purchases, and the current period including the Company's amortization of previously capitalized development costs relating to its new initiatives. As the Company launched its social stationery offering in February 2012, the Company began amortizing previously capitalized development costs.
The Company did not dispose of any property and equipment during the three month period ending March 31, 2012; whereas the Company incurred a loss of $71,241 as it related to the disposal of equipment in the same period last year.
Other income and expenses
During the second quarter, ended March 31, 2012, the Company recorded a realized foreign exchange loss of $24,065 and unrealized losses of $130,659. The unrealized loss arose as a result of a combination of the strengthening Pound Sterling which impacted the translation of intercompany balances between the UK subsidiaries and the Canadian parent, and the weakening of the US dollar to Canadian dollar exchange rate since the end of the previous quarter, which negatively impacts our US dollar working capital balances. The realized loss arose primarily as a result of the weakening of the US dollar to Canadian dollar exchange rate between the time sales invoices were raised and the receipt of the funds.
| |
| PNI Digital Media Inc. | |
| Management's Discussion and Analysis | |
| For the three and six month period ended March 31, 2012 | Page 12 |
Cash flows
The Company recorded cash inflows from operations of $729,804 during the second quarter of fiscal 2012 compared to cash inflows of $1,319,269 during the second quarter of fiscal 2011. The change period-on period was principally due to the management of working capital.
The Company's most significant uses of cash in the current period were as follows:
An investment of $172,816 was made in items of property and equipment;
An investment in intangible assets of $150,078; of which $103,894 related to the capitalization of costs associated with developing the Company's new initiatives, and the remaining amount related to the purchase of software used in managing our network.
The investment in items of property and equipment, and intangible assets were funded out of the Company's operating cash flows.
Results from operations: 6 Months Ended March 31, 2012
Revenue
| | | | | | | | | |
| | | Six Months | | Six Months | | | | | |
| | | Ended | | Ended | | | | | |
| Description | | March 31, 2012 | | March 31, 2011 | | Change | | % Change | |
| | | | | | | | | | |
| Transaction fees | $ | 9,438,903 | $ | 9,754,267 | $ | (315,364 | ) | (3 | )% |
| Software licences and Installation fees | | 1,016,620 | | 1,434,236 | | (417,616 | ) | (29 | )% |
| Membership fees | | 884,158 | | 865,662 | | 18,496 | | 2 | % |
| Professional fees | | 136,813 | | 21,822 | | 114,991 | | 527 | % |
| Archive fees | | 479,108 | | 689,081 | | (209,973 | ) | (31 | )% |
| | | | | | | | | | |
| Total | $ | 11,955,602 | $ | 12,765,068 | $ | (809,466 | ) | (6 | )% |
| |
| PNI Digital Media Inc. | |
| Management's Discussion and Analysis | |
| For the three and six month period ended March 31, 2012 | Page 13 |
Revenue (Constant currency basis)
| | | | | | | | | |
| | | Six Months | | Six Months | | | | | |
| | | Ended | | Ended | | | | | |
| Description | | March 31, 2012 | | March 31, 2011 | | Change | | % Change | |
| | | | | | | | | | |
| Transaction fees | $ | 9,359,666 | $ | 9,754,267 | $ | (394,601 | ) | (4 | )% |
| Software licences and Installation fees | | 1,015,209 | | 1,434,236 | | (419,027 | ) | (29 | )% |
| Membership fees | | 881,216 | | 865,662 | | 15,554 | | 2 | % |
| Professional fees | | 136,815 | | 21,822 | | 114,993 | | 527 | % |
| Archive fees | | 477,106 | | 689,081 | | (211,975 | ) | (31 | )% |
| | | | | | | | | | |
| Total | $ | 11,870,012 | $ | 12,765,068 | $ | (895,056 | ) | (7 | )% |
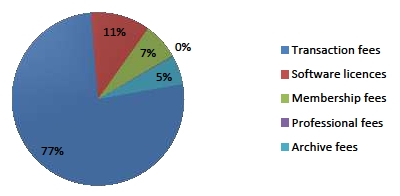
Revenue by Type
YTD2012

Revenue by Type
YTD2011
| |
| PNI Digital Media Inc. | |
| Management's Discussion and Analysis | |
| For the three and six month period ended March 31, 2012 | Page 14 |
Revenues for the six months ended March 31, 2012 were $11,955,602, reflecting a decline of $809,466, or 6% from revenues generated in the same period last year of $12,765,068.
Revenue period-on-period was mainly impacted by the following:
During the first quarter, the Company eliminated one of the instances where it was responsible for providing fulfillment of certain items sold and as a result realized lower revenue of approximately $151,000. This change in circumstances also led to a reduction in cost of sales during the period;
A change in product mix as a number of our retail partners experienced a decline in the number of photo prints sold as the popularity of non-print items such as photo books increased. Due to the structure of the majority of our contracts with photo retailers, this shift has led to a lower fee earned per transaction;
Decreases in software licence and installation fees and archive fees of $419,000 and $212,000 respectively; partially offset by
A period-on-period strengthening of 1% in the strength of the US dollar compared to the Canadian dollar. As 61% of the Company's revenue was earned from the United States during the period, a strengthening in the value of the US dollar relative to the Canadian dollar has a significant impact on financial results. If exchange rates during the current quarter had been at the same levels as they were during the first quarter of fiscal 2011, revenue would have decreased period-on-period by 7% to approximately $11.87 million.
While revenues decreased period-on-period, the number of orders placed through the PNI Platform increased by 4% reaching 10.5 million for the six month period, compared to 10.1 million in the same period last year.
Transaction fees continue to be the largest element of our revenue base and totaled $9,438,903 for the six months ended March 31, 2012, accounting for 79% of total recorded revenue as compared to 77% during the same period of fiscal 2011. Transaction fees were negatively impacted by the following:
Elimination of an instance where the Company was responsible for providing fulfillment of certain items sold resulting in lower realized revenue of approximately $151,000; partially offset by
A period-on-period strengthening of the US dollar compared to the Canadian dollar resulting in approximately $79,000 in higher realized revenue.
Had it not been for the two factors noted above, transaction fees would have decreased period-on-period by 3% to approximately $9.5 million. After taking into consideration the two factors noted above, the decline in transaction fees is mainly due to the changes experienced in product mix. While the Company continues to show growth in order volumes, the change in product mix has resulted in a lower value realized per order and a decline in revenue.
Software license and installation fees fell by 29% period-on-period to $1,016,620. The period-on-period decline was principally due to performing less site installation and development work. While a portion of revenue from this source continues to track at consistent levels each month through recurring license fees earned from some of our UK based customers, other elements of this revenue are non-recurring and are earned either through developing and installing new sites for customers or by making sales of kiosk software licenses.
| |
| PNI Digital Media Inc. | |
| Management's Discussion and Analysis | |
| For the three and six month period ended March 31, 2012 | Page 15 |
Membership fees are earned either through monthly fixed fees based on the number of locations customers have connected to the PNI Platform or through annual recurring service and maintenance revenue from customers who have purchased our kiosk software. Revenue from this source has increased period-on-period by 2% to $884,158. Revenue earned from this source is largely recurring in nature and remains relatively stable period to period.
Professional fees have shown an overall increase of 527% period-on-period to $136,813. This is primarily due to a number of one-off projects completed on behalf of some of our customers this year compared to fewer such projects in the same period last year. Professional fee revenue is non-recurring in nature and dependant on both the demand from our customers and also the availability of internal resources to allocate to this kind of work. While we continue to expect projects to arise and be taken on in future periods this type of revenue stream is not seen as core to our business and may fluctuate considerably from period to period.
Archive fees, which represent charges made to our customers after the volume of data held on their behalf reaches pre-determined limits, decreased 31% period-on-period to $479,108. The period-on-period decrease is principally due to the deletion of stored images as a result of our customers reducing the images stored for consumers whose accounts have been inactive over the previous twelve months. Our customers remain in charge of the business rules offered to their consumers around storage and therefore future revenue in this area could be curtailed should any of our customers stop providing their own customers with free storage solutions.
| |
| PNI Digital Media Inc. | |
| Management's Discussion and Analysis | |
| For the three and six month period ended March 31, 2012 | Page 16 |
Expenses
| | | | | | | | | | |
| | | Six Months Ended | | Six Months Ended | | | | | | |
| Description | | March 31, 2012 | | March 31, 2011 | | | Change | | % Change | |
| | | | | | | | | | | |
| Cost of sales | $ | 3,631,474 | $ | 3,618,625 | | $ | 12,849 | | 0 | % |
| | | | | | | | | | | |
| Operating expenses | | | | | | | | | | |
| Software development | | 4,301,469 | | 4,353,684 | | | (52,215 | ) | (1 | )% |
| General and administration | | 1,940,732 | | 1,879,631 | | | 61,101 | | 3 | % |
| Sales and marketing | | 417,442 | | 519,387 | | | (101,945 | ) | (20 | )% |
| | | 10,291,117 | | 10,371,327 | | | (80,210 | ) | (1 | )% |
| | | | | | | | | | |
| Share-based compensation | | 144,761 | | 546,921 | | | (402,160 | ) | (74 | )% |
| Amortization of property and equipment | | 822,453 | | 997,058 | | | (174,605 | ) | (18 | )% |
| Amortization of intangible assets | | 533,798 | | 385,174 | | | 148,624 | | 39 | % |
| Loss on disposal of property and equipment | | - | | 90,713 | | | (90,713 | ) | (100 | )% |
| | | | | | | | | | | |
| Total | $ | 11,792,129 | $ | 12,391,193 | | $ | (599,064 | ) | (5 | )% |
Total expenses for the six months ended March 31, 2012 are 5% less than the same period in fiscal 2011. Excluding non-cash expenditures of share-based compensation, amortization, and loss on disposal of property and equipment, controllable cash expenses decreased by 1% to $10,291,117.
Year to date summary
Cost of sales and Gross Profit
Cost of sales is comprised of costs associated with providing hosting services to our customers, customer support provided on behalf of our customers, and costs of products sold as it relates to instances where the Company is responsible for fulfillment of certain items sold. Hosting services include costs for renting our data centers, personnel costs associated with maintaining and monitoring the performance of our network, personnel and consulting costs associated with maintaining our customer's sites and third party software licenses used in maintaining the performance of our network and platform. In addition, the Company includes costs for amortization for property and equipment used in our data centers, intangible assets such as acquired software and customer relationships, and internal use software related to revenue generating activities.
| |
| PNI Digital Media Inc. | |
| Management's Discussion and Analysis | |
| For the three and six month period ended March 31, 2012 | Page 17 |
| | | | | | | | | | | | | | | | | | |
| | | Six months ended March 31, | |
| | | | | | 2012 | | | | | | | | | 2011 | | | | |
| | | Per
consolidated
financial
statements | | | Adjustments
(1)(2) (3) (4) | | | Controllable
cash
expense | | | Per
consolidated
financial
statements | | | Adjustments
(1)(2) (3) (4) | | | Controllable
cash
expense | |
| Revenue | $ | 11,955,602 | | $ | - | | $ | 11,955,602 | | $ | 12,765,068 | | $ | - | | $ | 12,765,068 | |
| Cost of sales | | 4,862,248 | | | (1,230,774 | ) | | 3,631,474 | | | 4,884,033 | | | (1,265,408 | ) | | 3,618,625 | |
| Gross Profit | $ | 7,093,354 | | $ | 1,230,774 | | $ | 8,324,128 | | $ | 7,881,035 | | | 1,265,408 | | | 9,146,443 | |
| | | | | | | | | | | | | | | | | | | |
| Gross Profit % | | 59 | % | | | | | 70 | % | | 62 | % | | | | | 72 | % |
Notes:
| (5) | Excludes amortization of property and equipment of $695,439 and $829,209 during the period ending March 31, 2012 and 2011 respectively. |
| (6) | Excludes amortization of intangible assets of $533,798 and $385,174 during the period ending March 31, 2012 and 2011 respectively. |
| (7) | Excludes loss on disposal of property and equipment during the period of $nil and $29,440 during the period ending March 31, 2012 and 2011 respectively. |
| (8) | Excludes share-based compensation during the period of $1,537 and $21,585 during the period ending March 31, 2012 and 2011 respectively. |
Cost of sales, after adjustments, increased period-on-period $12,849, to $3,631,474. The increase was principally driven by an increase in personnel costs (staff and short-term contractors) as a result of an increase in headcount to support and maintain the PNI Network as a result of increased order volumes, an increase in licensing fees associated with the use of third party software within the PNI Platform; partially offset by reduced direct costs of fulfillment and lab system installations as a result of changes in sales volumes in these areas.
Gross profit, after adjustments, was 70% compared to 72% in the same period last year. The decrease was principally the result of the decrease in revenues.
Operating expenses
| | | | | | | | | | | | | | | | |
| | | Three months ended March 31, | |
| | | | | 2012 | | | | | | | | 2011 | | | | |
| | | Per
consolidated
financial
statements | | Adjustments
(1)(2) (3) | | | Controllable
cash
expense | | Per
consolidated
financial
statements | | | Adjustments
(1)(2) (3) | | | Controllable
cash
expense | |
| Software development | $ | 4,436,290 | $ | (134,821 | ) | $ | 4,301,469 | $ | 4,716,458 | $ | | (362,774 | ) | $ | 4,353,684 | |
| General and administration | | 2,066,716 | | (125,984 | ) | | 1,940,732 | | 2,192,620 | | | (312,989 | ) | | 1,879,631 | |
| Sales and marketing | | 426,875 | | (9,433 | ) | | 417,442 | | 598,082 | | | (78,695 | ) | | 519,387 | |
| Total | $ | 6,929,881 | $ | (270,238 | ) | $ | 6,659,643 | $ | 7,507,160 | $ | | (754,458 | ) | $ | 6,752,702 | |
Notes:
| (4) | Software development: Excludes amortization of property and equipment of $106,768 and $139,833; loss on disposal of property and equipment of $nil and $52,800; and share-based compensation of $28,053 and $170,141 during the period ending March 31, 2012 and 2011 respectively. |
| | |
| |
| PNI Digital Media Inc. | |
| Management's Discussion and Analysis | |
| For the three and six month period ended March 31, 2012 | Page 18 |
| (5) | General and administration: Excludes amortization of property and equipment of $11,819 and $14,855; loss on disposal of property and equipment of $nil and $4,323; and share-based compensation of $114,165 and $293,811 during the period ending March 31, 2012 and 2011 respectively. |
| (6) | Sales and marketing: Excludes amortization of property and equipment of $8,427 and $13,161; loss on disposal of property and equipment of $nil and $4,150; and share-based compensation of $1,006 and $61,384 during the period ending March 31, 2012 and 2011 respectively. |
Software development expenses, after adjustments, decreased by $52,215, or 1% to $4,301,469. Included within software development costs is $168,750 relating to one-off non-recurring termination payments. After excluding the one-off termination payments, software development expenses decreased period-on-period by $220,965, or 5%; of which $80,000 relates to the six month period ending March 31, 2011 including a charge associated with the Company's contribution towards the settlement of a potential claim made against a former customer by a third party, and the remaining amount mainly relates to a decrease in personnel costs (staff and short-term contractors). During the six months ended March 31, 2012, the Company capitalized $508,806 of costs incurred to develop its new service offerings prior to the launch date, of which $490,482 related to capitalized personnel costs (staff and short-term contractors), with the remaining costs relating to travel expenditures during the development process.
Software development expenses include costs associated with customizing aspects of the Company's PNI Network software for specific customers as well as the cost of generating the Company's software used in the PNI Network and software sold to customers. The Company's policy is to classify software development costs between a research and development phase. The Company only capitalizes costs in the development phase if it is able to demonstrate that the software will generate future economic benefits.
General and administration expenses, after adjustments, have increased by $61,101, or 3% to $1,940,732 period-on-period. The increase period-on-period is principally due to higher listing fees as a result of a one-off non-recurring initial listing fee of $50,000 as a result of the Company moving from the TSX Venture exchange to the main Toronto Stock Exchange on October 18, 2011, higher salary and wages mainly the result of an increase in headcount, with the remaining increase due to an increase in travel fees of $16,000 and bad debt expense associated with long overdue receivables of $24,000; partially offset by a decrease in legal fees as a result of the prior year including an investigation associated with the possible patent infringement case against one of our customers which was resolved by the end of the previous year, and lower banking and corporate communication fees.
Sales and marketing expenses, after adjustments, have decreased by $101,945, or 20% to $417,442. The period-on-period decrease is principally due to a decrease in personnel costs as a result of a decrease in headcount.
Share-based compensation costs, representing both the cost of the Company's share based compensation awards issued to employees, directors and consultants of the Company and compensation expense associated with shares issued as part of the acquisition of WorksMedia, have decreased period-on-period by $402,160, or 74% to $144,761. The period-on-period decrease is principally due to a combination of the Company not granting any share based compensation awards during the six months ending March 31, 2012; whereas the Company issued awards in the previous year, and the requirement under IFRS that the expense associated with awards that vest on a graded schedule such as the Company's options, RSUs and PSUs be recognized on an accelerated basis.
| |
| PNI Digital Media Inc. | |
| Management's Discussion and Analysis | |
| For the three and six month period ended March 31, 2012 | Page 19 |
Amortization expense related to property and equipment decreased by $174,605, or 18% to $822,453. The period-on-period decrease is mainly due to the fact the Company's amortization policy associated with Computer equipment is based on the declining balance amortization method which results in a large part of the cost of the asset being expensed at the beginning of an assets use with subsequently less taken in future periods. A portion of this decrease on the amortization of existing assets at the end of fiscal 2011 was partially offset by new purchases during the first six months of fiscal 2012.
Amortization expense related to intangible assets increased by $148,624, or 39% to $533,798. The period-on-period increase is principally due to additional software purchases during the first six months of fiscal 2012 when compared to the same period in fiscal 2011, and the current period including the Company's amortization of previously capitalized development costs relating to its new initiatives. As the Company launched its social stationery offering in February 2012, the Company began amortizing capitalized development costs.
The Company did not dispose of any property and equipment during the six month period ending March 31, 2012; whereas the Company incurred a loss of $90,713 as it related to the disposal of equipment in the same period last year.
Other income and expenses
During the six months ended March 31, 2012, the Company recorded a realized foreign exchange loss of $14,451 and unrealized losses of $34,987. The unrealized loss arose principally as a result of the weakening of the US dollar to Canadian dollar exchange rate since the end of the previous fiscal year, which negatively impacts our US dollar working capital balances. The realized loss arose primarily as a result of the weakening of the US dollar to Canadian dollar exchange rate between the time sales invoices were raised and the receipt of the funds.
Cash flows
The Company recorded cash inflows from operations of $3,116,738 during the six months ended March 31, 2012 compared to cash inflows of $1,185,959 during the same period of fiscal 2011. The change period-on period was principally due to the management of working capital, offset by the 6% decrease in revenue.
The Company's most significant uses of cash in the current period were as follows:
An investment of $275,729 was made in items of property and equipment;.
An investment in intangible assets of $840,856; of which $508,806 related to the capitalization of costs associated with developing the Company's new initiatives, and the remaining amount related to the purchase of software used in managing our network.
The investment in items of property and equipment, and intangible assets were funded out of the Company's operating cash flows.
| |
| PNI Digital Media Inc. | |
| Management's Discussion and Analysis | |
| For the three and six month period ended March 31, 2012 | Page 20 |
Non-IFRS Financial Measures
The following table provides a reconciliation of the Company's profit reported in accordance with IFRS to non-IFRS Adjusted EBITDA.
| | | | | | |
| | | Three Months Ended | |
| | | March 31, 2012 | | | March 31, 2011 | |
| | | | | | | |
| Net loss in accordance with IFRS | $ | (360,711 | ) | $ | (882,757 | ) |
| | | | | | | |
| Amortization of property and equipment | | 417,678 | | | 501,683 | |
| Amortization of intangible assets | | 268,467 | | | 191,170 | |
| Interest expense | | - | | | 15 | |
| Income taxes | | (560,818 | ) | | (255,184 | ) |
| Stock based compensation expense | | 65,492 | | | 217,287 | |
| | | | | | | |
| Unrealized foreign exchange loss | | 130,659 | | | 104,980 | |
| | | | | | | |
| Adjusted EBITDA | $ | (39,233 | ) | $ | (122,806 | ) |
| | | | | | | |
| Adjusted EBITDA per share–Basic | $ | (0.00 | ) | $ | (0.00 | ) |
| Adjusted EBITDA per share–Fully Diluted | $ | (0.00 | ) | $ | (0.00 | ) |
| | | | | | | |
| Weighted average shares outstanding–Basic | | 34,120,614 | | | 33,788,064 | |
| Weighted average shares outstanding–Fully Diluted | | 34,120,614 | | | 33,788,064 | |
| | | | |
| | | | |
| | | Six Months Ended | |
| | | March 31, 2012 | | | March 31, 2011 | |
| | | | | | | |
| Net profit in accordance with IFRS | $ | 679,512 | | $ | 96,933 | |
| | | | | | | |
| Amortization of property and equipment | | 822,453 | | | 997,058 | |
| Amortization of intangible assets | | 533,798 | | | 385,174 | |
| Interest expense | | - | | | 5,551 | |
| Income taxes | | (564,549 | ) | | 279,349 | |
| Stock based compensation expense | | 144,761 | | | 546,921 | |
| | | | | | | |
| Unrealized foreign exchange loss (gain) | | 34,987 | | | (90,908 | ) |
| | | | | | | |
| Adjusted EBITDA | $ | 1,650,962 | | $ | 2,220,078 | |
| | | | | | | |
| Adjusted EBITDA per share–Basic | $ | 0.05 | | $ | 0.07 | |
| Adjusted EBITDA per share–Fully Diluted | $ | 0.05 | | $ | 0.07 | |
| | | | | | | |
| Weighted average shares outstanding–Basic | | 34,098,409 | | | 33,782,850 | |
| Weighted average shares outstanding–Fully Diluted | | 34,110,327 | | | 33,912,533 | |
The Company continues to provide all information required in accordance with IFRS, but believes evaluating its ongoing operating results may not be as useful if an investor is limited to reviewing only IFRS financial measures. Accordingly, the Company uses non-IFRS financial information to evaluate its ongoing operations and for internal planning and forecasting purposes. The primary non-IFRS financial measures utilized by the Company include adjusted EBITDA and adjusted EBITDA per share. Adjusted EBITDA is defined as earnings before
| |
| PNI Digital Media Inc. | |
| Management's Discussion and Analysis | |
| For the three and six month period ended March 31, 2012 | Page 21 |
interest expense, taxes, depreciation, amortization, unrealized foreign currency gains and losses and stock-based compensation.
We note that the Company's adjusted EBITDA for the second quarter of 2011 has not changed as a result of the Company's adoption of IFRS; as all differences between Canadian GAAP and IFRS related to stock based compensation and income taxes, both of which are included as items added back to net income under the Company's definition of adjusted EBITDA.
To supplement the Company's consolidated financial statements presented on an IFRS basis, we believe that these non-IFRS measures provide useful information about the Company's core operating results and thus are appropriate to enhance the overall understanding of the Company's past financial performance and its prospects for the future. These adjustments to the Company's IFRS results are made with the intent of providing both management and investors a more complete understanding of the Company's underlying operational results and trends and performance. Management uses these non-IFRS measures to evaluate the Company's financial results, develop budgets, manage expenditures, and determine employee compensation. The presentation of additional information is not meant to be considered in isolation or as a substitute for or superior to net income or net income per share determined in accordance with IFRS.
Contingencies and commitments
The contractual obligations and payments due as at March 31, 2012 are as follows:
| | | | |
| | | Payments due by period | |
| | Total | Less than 1
year | 1-3 years | 3-5 years |
| Property leases | 649,434 | 278,329 | 371,105 | - |
| Other service agreements | 6,107,007 | 1,674,380 | 3,328,566 | 1,104,061 |
| Purchase obligations | 54,805 | 54,805 | - | - |
| | 6,811,246 | 2,007,514 | 3,699,671 | 1,104,061 |
Bank Facility
The Company has a Credit Agreement with its bank (the “Bank”) which provides the Company with two separate credit facilities, being a revolving demand facility of up to $1,500,000 (“Revolving Demand Facility”) and a $750,000 reducing facility by way of Leases (“Lease Facility”). The two credit facilities and all other obligations of the Company to the Bank are secured by way of a General Security Agreement between the Bank and the Company, constituting a first ranking security interest in all personal property of the Company.
The Revolving Demand Facility bears interest at a rate of Bank prime + 1.50% and contains a financial covenant requiring us not to exceed a borrowing limit of 67% of good Canadian and US Accounts receivable less potential prior-ranking claims which include items such as sales and excise taxes, payroll liabilities, and overdue rent, property and business taxes. The Company has not drawn any amount with respect to the Revolving Demand Facility.
The Lease Facility will be subject to separate agreements between the Bank and the Company, and as at March 31, 2012 no amount has been drawn on this facility.
| |
| PNI Digital Media Inc. | |
| Management's Discussion and Analysis | |
| For the three and six month period ended March 31, 2012 | Page 22 |
Liquidity and capital resources
Liquidity risk is the risk that the Company will encounter difficulty in meeting obligations associated with its financial liabilities that are settled by delivery of cash or other financial assets. The Company's approach to managing liquidity risk is to ensure it has sufficient cash available to manage the payment of its financial liabilities. The Company has the Revolving Demand Facility in place to help manage its liquidity position, thus its liquidity position is not solely dependent on its overall volume of business activity and its ability to manage the collection and payment of its accounts receivable and accounts payable through cash flow management techniques.
During the three and six month period ended March 31, 2012 the Company generated positive cash flow from operations of $729,804 (2011: $1,319,269) and $3,116,738 (2011: $1,185,959). During the same six month period its working capital improved by $555,728 to a surplus of $5,953,322. The Company's liquidity position may fluctuate during the year due to a number of factors which could include unanticipated changes to its volume of business, credit losses and the extent of capital expenditure in the year. The Company's liquidity position may also be adversely impacted by the seasonal nature of its business with the Company's busiest period of activity typically during the first quarter of the fiscal year. As the Company has a concentration of business with select key customers, its liquidity position would be adversely impacted if one of its key customer relationships was discontinued.
The Company primarily monitors its liquidity position through forecasting expected cash flows based on the timing of expected receipts and payments. Management monitors its cash balances and projections on a weekly and monthly basis. The starting point for its analysis is based upon the contractual maturity date of its liabilities and its expected collection period for its receivables. The Company has a positive working capital position of $5,953,322 at March 31, 2012 and it manages the payment of its financial liabilities based on available cash and matching the settlement of its financial liabilities to realized financial assets. The Company also monitors its debtor collection as described in the credit risk note above. As the Company's revenues are primarily collectible within 30 days of invoicing, which is performed weekly for some customers and monthly for others, the Company aims to be able to collect its accounts receivable more promptly than it settles its third party accounts payable. However, as certain of the Company's operating expenses such as its payroll obligations are contractually due at least monthly, the Company's working capital level could periodically change depending on the timing of the maturity of its accounts receivable and accounts payable and accrued liabilities.
The Company's activities are being funded out of its operating cash flow. As a result of generating positive results during the three and six month period ending March 31, 2012 the Company has not encountered any difficulties doing so, however if positive results are not continued in future periods there is a risk that the Company would not be able to meet all of its contractual commitments when due. The Company has in place a revolving demand facility with its bank which, subject to certain criteria being met, could provide the Company with additional funds of $1,500,000.
Related Party Transactions
During the three and six months ended March 31, 2012, the Company incurred legal fees of $56,755 (2011: $32,004) and $83,148 (2011: $66,640), respectively, for services provided by
| |
| PNI Digital Media Inc. | |
| Management's Discussion and Analysis | |
| For the three and six month period ended March 31, 2012 | Page 23 |
McMillan LLP, a law firm of which a director of the Company is a partner. Accounts payable and accrued liabilities at March 31, 2012 included $25,080 (September 30, 2011: $23,955) related to these services.
During the three and six months ended March 31, 2012, the Company incurred consulting fees of $15,832 (2011: $14,900) and $28,639 (2011: $29,800), respectively, for services provided by Digital Photoworks, a company of which a Director and Officer of the Company controls. Accounts payable and accrued liabilities at March 31, 2012 included $5,293 (September 30, 2011: $5,072) related to these services.
During the three and six months ended March 31, 2012, the Company did not incur expenses relating to setting up e-mail marketing campaigns on behalf of a number of our retail customers (three and six months ended March 31, 2011: $8,449) and website services (three and six months ended March 31, 2011: $1,500) with Photoblaster, a company of which a director of the Company is Chairman and Chief Executive Officer. The Company does not have any outstanding accounts payable or accrued liabilities as at March 31, 2012 related to this company (September 30, 2011: $nil).
The Company shares its UK premises with another company, Works Unit Ltd., of which an Officer is a director. During the three and six months ended March 31, 2012, the Company was recharged its proportional share of office running costs totalling $44,833 (2011: $54,132) and $101,804 (2011: $99,220), respectively, by this related party. In addition, during the three and six months ended March 31, 2012, the Company used the software development services of this company, incurring costs of $37,636 (2011: $17,064) and $73,909 (2011: $34,021). At March 31, 2012, accounts payable included $19,445 (September 30, 2011: $21,578) related to these services and cost recharges.
During the three and six months ended March 31, 2012, the Company generated revenue of $2,211 (2011: $1,218) and $3,530 (2011: $1,218), respectively, relating to transaction fees, software license and installation fees, and membership fees from a customer, Extrafilm, of which a Director and Officer of the Company controls. Accounts receivable at March 31, 2012 included $2,012 (September 30, 2011: $2,102) related to these services.
All amounts charged were recorded at their exchange amount, which is the amount of consideration established and agreed to by the related parties and having normal trade terms.
Financial instruments
Credit risk
Financial instruments that potentially subject the Company to concentrations of credit risk consist of cash and cash equivalents and accounts receivable. The Company aims to protect its cash and cash equivalents from undue risk by holding them with various high credit quality financial institutions located in Canada and the United Kingdom. In circumstances in which a bank in which the Company holds a deposit has any significant decline in its credit rating, the Company carefully monitors the extent of any credit risk net of government deposit guarantees and, where appropriate, would take remedial action to minimise the risk of any potential credit loss. Of the amounts held with financial institutions on deposit, $179,730 is covered by either the Financial Services Compensation Scheme in the United Kingdom or the Canada Deposit
| |
| PNI Digital Media Inc. | |
| Management's Discussion and Analysis | |
| For the three and six month period ended March 31, 2012 | Page 24 |
Insurance Corporation, leaving $5,615,182 at risk should the financial institutions with which the deposits are held cease trading.
The Company's accounts receivable are all from large, well-known retailers located primarily in Canada, the United States and the United Kingdom. Credit risk from accounts receivable encompasses the default risk of retail customers. The Company manages its exposure to credit risk by only working with larger, reputable companies and prior to accepting new customers; the Company assesses the risk of default associated with a particular company. In addition, on an ongoing basis, management monitor the level of accounts receivable attributable to each customer and the length of time taken for amounts to be settled and where necessary, takes appropriate action to follow up on those balances considered overdue.
Management does not believe that there is significant credit risk arising from any of the Company's customers; however, should one of the Company's main customers be unable to settle amounts due, the impact on the Company could be significant. The maximum exposure to loss arising from accounts receivable is equal to their total carrying amounts. At March 31, 2012, three customers each account for 10% or more of total trade accounts receivable (March 31, 2011 – five customers).
Financial assets past due
At March 31, 2012, the Company has a provision of $176,500 against trade accounts receivable, the collection of which is considered doubtful.
The following table provides information regarding the ageing of financial assets that are past due but which are not impaired.
At March 31, 2012
| | | | | | |
| | | | | |
| | | Financial assets that are past due but
not impaired | |
| | | | | | Carrying | |
| | Neither past | | | | value on the | |
| | due nor | 31– 60 | 61– 90 | 91days | balance sheet | |
| | impaired | days | days | + | $ | |
| Trade accounts receivable | 2,124,796 | 1,179,236 | 132,410 | 957,070 | 4,393,512 | |
| Commodity taxes recoverable | 47,921 | - | - | - | 47,921 | |
| Other | 1,847 | - | - | - | 1,847 | |
| Total | 2,174,564 | 1,179,236 | 132,410 | 957,070 | 4,443,280 | |
The definition of items that are past due is determined by reference to terms agreed with individual customers. Of the 91 days+ balance outstanding at March 31, 2012, none has been subsequently collected as at May 9, 2012. None of the amounts outstanding have been challenged by the respective customer(s) and the Company continues to conduct business with them on an ongoing basis. Accordingly, management has no reason to believe that this balance is not fully collectable in the future.
| |
| PNI Digital Media Inc. | |
| Management's Discussion and Analysis | |
| For the three and six month period ended March 31, 2012 | Page 25 |
The Company reviews financial assets past due on an ongoing basis with the objective of identifying potential matters which could delay the collection of funds at an early stage. Once items are identified as being past due, contact is made with the respective company to determine the reason for the delay in payment and to establish an agreement to rectify the breach of contractual terms. At March 31, 2012, the Company had a provision for doubtful accounts of $176,500 which was made against trade accounts receivable in excess of twelve months old or where collection efforts to date have been unsuccessful. All amounts neither past due nor impaired are collectible from large, well-known retailers located in Canada, the United States and the United Kingdom. The Company is not aware of any information suggesting that the collectability of these amounts is in doubt.
Market risk
Market risk is the risk to the Company that the fair value or future cash flows of financial instruments will fluctuate due to changes in interest rates and foreign currency exchange rates. Market risk arises as a result of the Company generating revenues and incurring expenses in foreign currencies, holding cash and cash equivalents which earn interest and having operations based in the United Kingdom in the form of its wholly owned subsidiary, PNI Digital Media Europe Ltd.
Interest rate risk
The only financial instruments that expose the Company to interest rate risk are its cash and cash equivalents. The Company's objectives of managing its cash and cash equivalents are to ensure sufficient funds are maintained on hand at all times to meet day-to-day requirements and to place any amounts which are considered in excess of day-to-day requirements on short-term deposit with the Company's banks so that they earn interest. When placing amounts of cash and cash equivalents on short-term deposit, the Company only uses high quality commercial banks and ensures that access to the amounts placed can be obtained on short-notice.
Currency risk
The Company generates revenues and incurs expenses and expenditures primarily in Canada, the United States and the United Kingdom and is exposed to risk from changes in foreign currency rates. In addition, the Company holds financial assets and liabilities in foreign currencies that expose the Company to foreign exchange risks. The Company does not utilise any financial instruments or cash management policies to mitigate the risks arising from changes in foreign currency rates.
At March 31, 2012, through its wholly owned subsidiaries, the Company had cash and cash equivalents of $4,626,684, accounts receivable of $1,050,502 and accounts payable of $1,258,742 which were denominated in UK £. In addition, at March 31, 2012, the Company had cash and cash equivalents of $1,060,834, accounts receivable of $2,413,401 and accounts payable of $673,760 which were denominated in US$.
Sensitivity analysis
The Company has completed a sensitivity analysis to estimate the impact on net earnings for the year which a change in foreign exchange rates or interest rates during the six months ended March 31, 2012 would have had.
| |
| PNI Digital Media Inc. | |
| Management's Discussion and Analysis | |
| For the three and six month period ended March 31, 2012 | Page 26 |
This sensitivity analysis includes the following assumptions:
The results of the foreign exchange rate sensitivity analysis can be seen in the following table:
| | | |
| | | Impact on net | |
| | | profit | |
| | | $ | |
| Change of +/- 10% in US$ foreign exchange rate | | +/-280,048 | |
| Change of +/- 10% in UK£ foreign exchange rate | | +/-585,291 | |
The above results arise primarily as a result of the Company having US$ denominated trade accounts receivable balances, trade accounts payable balances and bank account balances.
Limitations of sensitivity analysis
The above table demonstrates the effect of either a change in foreign exchange rates or interest rates in isolation. In reality, there is a correlation between the two factors.
Additionally, the financial position of the Company may vary at the time that a change in either of these factors occurs, causing the impact on the Company's results to differ from that shown above.
Income taxes
During the six month period ended March 31, 2012, the Company recorded an income tax recovery in the amount of $564,549 compared to the recognition of an income tax expense during the six month period ended March 31, 2011 of $279,349. The recovery was due to management's assessment that based on current results, it is probable that the Company will utilize a larger portion of the losses available to the Company in the UK. The Company's net deferred tax asset as at March 31, 2012 is $7,606,322. The Company expects to utilize the net deferred tax asset through a combination of retaining existing customers and closely monitoring controllable cash costs. The Company expects to utilize the majority of the net future income tax asset over the next three to five years.
Accounting Changes Adopted in Fiscal Year 2012
Basis of preparation and adoption of IFRS
We prepare our interim condensed consolidated financial statements in accordance with the Handbook of The Canadian Institute of Chartered Accountants. In 2010, this Handbook was revised to incorporate International Financial Reporting Standards (“IFRS”), and requires publicly accountable enterprises to apply such standards effective for years beginning on or after January 1, 2011. Accordingly, we have commenced reporting on this basis in our first quarter of 2012 interim condensed consolidated financial statements. Our basis of presentation
| |
| PNI Digital Media Inc. | |
| Management's Discussion and Analysis | |
| For the three and six month period ended March 31, 2012 | Page 27 |
and accounting policies are described in detail in notes 2, 3 and 21 of our interim condensed consolidated financial statements.
Condensed quarterly financial information
The following table provides selected quarterly information for our eight most recent quarters. We have identified the quarterly information that was prepared under Canadian GAAP (“CDN GAAP”) and information that was prepared in accordance with IFRS. As a result, readers are cautioned that the fiscal 2010 data is not comparable to the amounts reported for fiscal 2011 and 2012. This data is provided for informational purposes only.
This information is unaudited, but reflects all adjustments of a normal, recurring nature which are, in the opinion of management, necessary to present a fair statement of our results of operations for the periods presented. Quarter-to-quarter comparisons of our financial results are not necessarily meaningful and should not be relied upon as an indicator of future performance.
| | | | | | | | | | |
| | | Mar 31, 2012 | | | Dec 31, 2011 | | Sep 30, 2011 | | Jun 30, 2011 | |
| | | IFRS | | | IFRS | | IFRS | | IFRS | |
| Revenue | $ | 5,005,226 | | $ | 6,950,376 | $ | 5,605,041 | $ | 5,316,242 | |
| Net profit (loss) for the period | | (360,711 | ) | | 1,040,223 | | 980,427 | | 22,240 | |
| Basic profit (loss) per share | | (0.01 | ) | | 0.03 | | 0.03 | | 0.00 | |
| Fully diluted profit (loss) per share | | (0.01 | ) | | 0.03 | | 0.03 | | 0.00 | |
| | | | | | | | | | |
| | | Mar 31, 2011 | | | Dec 31, 2010 | | Sep 30, 2010 | | Jun 30, 2010 | |
| | | IFRS | | | IFRS | | CDN GAAP | | CDN GAAP | |
| Revenue | $ | 5,031,263 | | $ | 7,733,805 | $ | 6,657,414 | $ | 5,681,221 | |
| Net profit (loss) for the period | | (882,757 | ) | | 979,690 | | 5,808,317 | | (109,760 | ) |
| Basic profit (loss) per share | | (0.03 | ) | | 0.03 | | 0.17 | | (0.00 | ) |
| Fully diluted profit (loss) per share | | (0.03 | ) | | 0.03 | | 0.17 | | (0.00 | ) |
Quarterly revenue breakdown
| | | | | | | | | |
| | | Mar 31, 2012 | | Dec 31, 2011 | | Sep 30, 2011 | | Jun 30, 2011 | |
| | | IFRS | | IFRS | | IFRS | | IFRS | |
| Transaction fees | $ | 3,648,613 | $ | 5,790,290 | $ | 4,316,987 | $ | 3,978,814 | |
| Software licences and installation fees | | 526,973 | | 489,647 | | 523,874 | | 614,563 | |
| Membership fees | | 447,959 | | 436,199 | | 387,999 | | 397,008 | |
| Professional fees | | 116,524 | | 20,289 | | 43,911 | | 10,690 | |
| Archive fees | | 265,157 | | 213,951 | | 332,270 | | 315,167 | |
| | $ | 5,005,226 | $ | 6,950,376 | $ | 5,605,041 | $ | 5,316,242 | |
| | | | | | | | | |
| | | Mar 31, 2011 | | Dec 31, 2010 | | Sep 30, 2010 | | Jun 30, 2010 | |
| | | IFRS | | IFRS | | CDN GAAP | | CDN GAAP | |
| Transaction fees | $ | 3,454,606 | $ | 6,299,661 | $ | 4,938,524 | $ | 4,359,745 | |
| Software licences and installation fees | | 777,775 | | 656,461 | | 969,246 | | 573,303 | |
| Membership fees | | 416,846 | | 448,816 | | 409,752 | | 426,944 | |
| Professional fees | | 7,477 | | 14,345 | | 12,897 | | 31,869 | |
| Archive fees | | 374,559 | | 314,522 | | 326,995 | | 289,360 | |
| | $ | 5,031,263 | $ | 7,733,805 | $ | 6,657,414 | $ | 5,681,221 | |
| |
| PNI Digital Media Inc. | |
| Management's Discussion and Analysis | |
| For the three and six month period ended March 31, 2012 | Page 28 |

Outstanding share information
The following table provides outstanding share information for the Company as at March 31, 2012 and May 9, 2012.
| | | | | |
| | | May 9, 2012 | | March 31, 2012 | |
| Authorized | | | | | |
Common shares | | Unlimited | | Unlimited | |
Preferred shares | | Unlimited | | Unlimited | |
| | | | | |
| Issued and outstanding | | | | | |
Common shares – issued | | 34,257,922 | | 34,257,922 | |
Common shares - outstanding | | 34,257,922 | | 34,257,922 | |
Preferred shares | | - | | - | |
| | | | | |
| Options | | | | | |
Outstanding | | 1,057,112 | | 1,058,500 | |
Exercisable | | 1,057,112 | | 1,039,310 | |
| | | | | |
| Deferred share units | | | | | |
Issued | | 107,469 | | 116,136 | |
Outstanding | | 107,469 | | 116,136 | |
| |
| PNI Digital Media Inc. | |
| Management's Discussion and Analysis | |
| For the three and six month period ended March 31, 2012 | Page 29 |
Critical accounting estimates
The Company prepares its financial statements in accordance with International Financial Reporting Standards (“IFRS”). The preparation of consolidated financial statements in conformity with IFRS requires management to make estimates and assumptions that affect the reported amounts of assets and liabilities and disclosure of contingent assets and liabilities at the date of the financial statements and the reported amounts of revenues and expenses during the reporting period. Estimates are based upon historical experience and various other assumptions that are believed to be reasonable under the circumstances. These estimates are evaluated on an ongoing basis and form the basis for making judgments regarding the carrying values of assets and liabilities and the reported amount of revenues and expenses. Actual results may differ from these estimates under different assumptions.
Share-based payments
The Company grants stock-based awards that may take the form of stock options, Performance Share Units (“PSU”), and Restricted Share Units (“RSU”) to directors and certain employees of the Company as an element of compensation. The cost of the service received as consideration is measured based on an estimate of fair value at the date of grant. The grant-date fair value is recognized as compensation expense over the related service period with a corresponding increase in contributed surplus. If graded awards are granted, each vesting tranche is accounted for as a separate award. Compensation expense is recognized for awards expected to vest over the applicable vesting period with a corresponding increase in contributed surplus.
On exercise of stock options, the Company issues common shares from treasury and the consideration received together with the compensation expense previously recorded to contributed surplus is credited to share capital. On vesting of PSUs and RSUs, the Company issues common shares from treasury and the compensation expense previously recorded to contributed surplus is credited to share capital.
The Company uses the Black-Scholes option pricing model to estimate the fair value of each stock option. The Black-Scholes option pricing model requires the Company to estimate the expected term of the options granted, the volatility of the Company's common shares, forfeitures, and an expected dividend yield. The Company estimates the expected term of the options granted by considering the Company's historical experience involving stock option exercise; cancellations and expiries; volatility is estimated with reference to historical volatility data; forfeitures are estimated with reference to historical forfeiture data. The Company does not currently anticipate paying any cash dividends in the foreseeable future and therefore has used an expected dividend yield of zero. The Black-Scholes model also requires the Company to input a risk-free interest rate and the Company uses the Bank of Canada marketable bond rates.
The fair value of each PSU and RSU awarded is based upon the quoted price of the Company's stock on the date of grant. All PSU and RSU awards are equity settled. As it relates to PSUs and RSUs, the Company estimates the expected forfeiture rate and no value is attributed to awards that the employee is expected to forfeit as a result of not achieving the service or performance conditions. The expected forfeiture rate is adjusted for actual forfeitures when they occur.
| |
| PNI Digital Media Inc. | |
| Management's Discussion and Analysis | |
| For the three and six month period ended March 31, 2012 | Page 30 |
Goodwill and intangible assets
Intangible assets acquired in a business combination that meet the specified criteria for recognition, apart from goodwill, are initially recognized and measured at fair value. Intangible assets with finite useful lives, including acquired software, software developed for internal use and customer relationships, are amortized on a straight-line basis over their estimated useful lives as follows:
| |
| Acquired software | 3 years |
| Customer relationships | 3 years |
| Internal use software | 1-3 years |
Amortization of intangible assets is included within cost of sales. The amortization methods and estimated useful lives of intangible assets are reviewed annually or earlier if events and circumstances change.
Goodwill represents the excess of the purchase price of an acquired enterprise over the fair values assigned to the identifiable net assets of the acquired enterprise at the date of acquisition. Goodwill is allocated to each cash-generating unit (“CGU”) or group of CGUs that are expected to benefit from the related business combination. Goodwill is not amortized, and is carried at cost less accumulated impairment losses, if any.
The process of determining the nature and amount of the individual intangible assets and for carrying out annual impairment tests, calls for considerable use of judgment, and requires all parties involved to make estimates and assumptions regarding future cash flow projections, future operating costs and appropriate discount rates to be used in the calculations. These determinations impact the amount that is initially recorded as goodwill or other intangible assets and the amortization expense to be recognized in future periods over the estimated useful lives of the intangible assets. Changes in estimates and assumptions can affect the reported value of goodwill and other intangible assets with indefinite useful lives.
Deferred Income taxes
Deferred tax is recognized, using the balance sheet liability method of accounting for income taxes. Under this method, deferred tax assets and liabilities are recognized for the future tax consequences attributable to differences between the financial statement carrying amounts of existing assets and liabilities and their respective tax bases, and for operating losses or tax credits. Deferred income tax is determined on a non-discounted basis using tax rates and laws that have been enacted or substantively enacted at the balance sheet date and are expected to apply when the deferred tax asset is realized or liability is settled. Deferred tax assets are recognized to the extent that it is probable that future taxable profit will be available against which the deductible temporary differences can be utilized. At March 31, 2012 the Company has a deferred income tax asset of $7,606,322.
Deferred income tax assets and liabilities are presented as non-current.
At the end of the Company's last fiscal year, September 30, 2011, the Company had net operating loss carry-forwards for Canadian tax purposes of approximately $9,754,550 that are available for carry forward to reduce taxable income in future years. In addition, the Company had $14,796,141 (£9,166,238) of losses for tax purposes in the United Kingdom which are available to reduce taxable income in future periods.
| |
| PNI Digital Media Inc. | |
| Management's Discussion and Analysis | |
| For the three and six month period ended March 31, 2012 | Page 31 |
Adoption of International Financial Reporting Standards (“IFRS”)
The Company previously prepared its financial statements in accordance with Canadian generally accepted accounting principles (“Canadian GAAP”) as set out in the Handbook of the Canadian Institute of Chartered Accountants (“CICA Handbook”). In 2010, the CICA Handbook was revised to incorporate International Financial Reporting Standards (“IFRS”), and required publicly accountable enterprises to apply such standards effective for years beginning on or after January 1, 2011, with early adoption permitted. Accordingly, these unaudited interim condensed consolidated financial statements are based on IFRS, as issued by the International Accounting Standards Board (“IASB”). In these unaudited interim condensed consolidated financial statements, the term “Canadian GAAP” refers to Canadian GAAP before the Company's adoption to IFRS.
Overview
The effect of the Company's transition to IFRS is summarized as follows: transition elections; explanatory notes on Canadian GAAP/IFRS differences; and additional information and disclosures for the year ended September 30, 2011.
Refer to note 21 of the interim condensed consolidated financial statements for a detailed reconciliation of the impact of the differences between Canadian GAAP and IFRS on our financial position, results from operations, and cash flows as related to fiscal 2011.
Transition elections
The adoption of IFRS requires the application of IFRS 1,“First-time Adoption of InternationalFinancial Reporting Standards”(“IFRS 1”), which provides guidance for an entity's initial adoption of IFRS. IFRS 1 generally requires retrospective application of IFRS effective at the end of the Company's first annual IFRS reporting period. However, IFRS 1 also provides certain optional exemptions and mandatory exceptions to this retrospective treatment.
The Company has applied the following transitional exceptions and exemptions to full retrospective application of IFRS in its preparation of an opening IFRS consolidated statement of financial position at October 1, 2010 (the Company's “Transition Date”):
| i) | To apply IFRS 2,“Share-based Payments”, retrospectively only to awards that were issued after November 7, 2002 and where any portion of said awards had not vested by the Transition Date; |
| | |
| ii) | To apply IFRS 3,“Business Combinations”, prospectively from the Transition Date and, therefore, not restate business combinations that took place prior to the Transition Date. |
| | |
| iii) | To apply the IFRS 1 exemption whereby cumulative translation differences included in accumulated other comprehensive loss are reset to zero at the Transition Date. |
The Company's Transition Date IFRS consolidated statement of financial position is included as comparative information in the interim condensed consolidated statements of position in the interim condensed consolidated financial statements.
| |
| PNI Digital Media Inc. | |
| Management's Discussion and Analysis | |
| For the three and six month period ended March 31, 2012 | Page 32 |
Explanatory notes on differences between Canadian GAAP and IFRS
Income taxes–tax reclassification
In accordance with Canadian GAAP, deferred taxes are split between current and non-current components on the basis of either: (1) the underlying asset or liability, or (2) the expected reversal of items not related to an asset or liability.
In accordance with IFRS, all deferred tax assets and liabilities are classified as non-current. As a result current deferred tax assets and liabilities recognized under Canadian GAAP have been reclassified as non-current.
Income taxes–Pixology loss carry-forwards
During the years ended September 30, 2009, 2010 and 2011; the Company determined that a portion of the previously unrecognized Pixology loss carry forwards should be recognized as the likelihood of realization of the tax asset was estimated to be more likely than not. Canadian GAAP requires that a future income tax asset acquired in a business combination that was not recognized at the time of acquisition as an identifiable asset but is subsequently recognized by the acquirer should be applied to reduce goodwill and intangibles to zero, with any remaining amount recognized as a reduction to income tax expense. Accordingly, the following amounts were credited against goodwill and intangible assets arising from the Pixology acquisition as follows:
| | | | | | | |
| | | September 30, 2011 | | September 30, 2010 | | September 30, 2009 | |
| | | | | | | | |
| Intangible assets | $ | - | $ | 89,266 | $ | 452,390 | |
| Goodwill | | 77,382 | | 949,152 | | 432,574 | |
| Total | $ | 77,382 | $ | 1,038,418 | $ | 884,964 | |
IFRS requires the recognition of a deferred tax asset related to acquired losses and deductible temporary differences to be recognized as a deferred tax recovery in the Statement of Earnings (Loss) and Comprehensive Gain (Loss).
However, as the Company has elected to apply IFRS 3,Business Combinations, prospectively to business combinations that occur after the date of transition; the Company is not permitted to reverse adjustments to goodwill that IFRS 3 would not permit hence no reversal was made to the application of Pixology loss carry-forwards to goodwill prior to October 1, 2010. The Company has reversed the application of Pixology loss carry-forwards made during the year ended September 30, 2011.
While the application of IFRS 3 prospectively does not permit adjustments to goodwill prior to the transition date, the Company is required to reverse the application of Pixology loss carry-forwards to intangible assets. This change in accounting policy does not have an impact on the October 1, 2010 intangible asset balance as all Pixology related intangible assets would have been fully amortized by the year ended September 30, 2010 as the increase in amortization expense would be offset by the decrease in income tax expense.
| |
| PNI Digital Media Inc. | |
| Management's Discussion and Analysis | |
| For the three and six month period ended March 31, 2012 | Page 33 |
This change in accounting policy has impacted the following accounts as follows:
| | | | | | | |
| | | Twelve months | | Three months | | Six months | |
| | | ended September | | ended March 31, | | ended March 31, | |
| | | 30, 2011 | | 2011 | | 2011 | |
| | | | | | | |
| Consolidated statement of income and comprehensive income | | | | | | | |
| Increase in deferred income tax recovery | $ | 77,253 | $ | - | $ | - | |
| Increase in accumulated other comprehensive gain | | 129 | | - | | - | |
| Increase in comprehensive income | $ | 77,382 | $ | - | $ | - | |
| | | | | | | | |
| | | September 30, | | | | | | |
| | | 2011 | | | March 31, 2011 | | October 1, 2010 | |
| | | | | | | | |
| Consolidated statement of financial position | | | | | | | | |
| Increase in goodwill | $ | 77,382 | | $ | - | $ | - | |
| Decrease/(increase) in accumulated other comprehensive income | | (129 | ) | | - | | - | |
| Increase/(decrease) in retained earnings | $ | 77,253 | | $ | - | $ | - | |
Income taxes–share issue costs
During the year ended September 30, 2010, the Company determined that it was more likely than not to realize the loss carry forwards and other deductible temporary differences arising in Canada. As a result the Company recorded a deferred tax asset relating to these items and recorded a deferred tax benefit. A portion of the deferred tax asset recognized, in the amount of $107,611, related to share issue costs that are deductible for tax purposes. In accordance with Canadian GAAP, the portion of the deferred tax asset of $107,611 related to share issue costs was recorded as a deferred tax benefit within the Company's Statement of Earnings (Loss) and Comprehensive Gain (Loss). IFRS, however, requires temporary differences related to equity items be recognized as an increase or decrease to share capital.
This change in accounting policy has impacted the following accounts as follows:
| | | | | | | |
| | | Twelve months | | Three months | | Six months | |
| | | ended September | | ended March 31, | | ended March 31, | |
| | | 30, 2011 | | 2011 | | 2011 | |
| | | | | | | |
| Consolidated statement of income and comprehensive income | | | | | | | |
| Increase in deferred income tax recovery | $ | 106,823 | $ | 26,706 | $ | 53,412 | |
| Increase in comprehensive income | $ | 106,823 | $ | 26,706 | $ | 53,412 | |
| | | | | | | | | |
| | | September 30, | | | | | | | |
| | | 2011 | | | March 31, 2011 | | | October 1, 2010 | |
| | | | | | | | | |
| Consolidated statement of financial position | | | | | | | | | |
| (Decrease)/increase in share capital | $ | 788 | | $ | 54,199 | | $ | 107,611 | |
| Increase/(decrease) in retained earnings | $ | (788 | ) | $ | (54,199 | ) | $ | (107,611 | ) |
Cumulative translation adjustment
As the Company has elected to apply the IFRS 1 exemption for cumulative translation differences, the Company has recorded an adjusting entry to reset the cumulative translation differences to zero at the transition date. Application of this accounting policy choice results in a decrease of $2,319,536 in accumulated other comprehensive loss and a corresponding increase in deficit as of October 1, 2010.
| |
| PNI Digital Media Inc. | |
| Management's Discussion and Analysis | |
| For the three and six month period ended March 31, 2012 | Page 34 |
Share-based payments
There are two changes on transition regarding the accounting for share-based payments. Under Canadian GAAP, the Company treated its stock option, PSU and RSU tranches as single pools and determined fair value using an average life of the grant as a whole, and then recognized compensation expense on a straight-line basis. IFRS requires each tranche to be valued separately and recognized as compensation over its individual vesting period; this results in earlier recognition of the compensation expense as compared to Canadian GAAP. With respect to forfeitures, the Company recognized forfeitures as they occurred under Canadian GAAP; under IFRS, companies are required to estimate forfeitures at the time of grant with resulting effects on the compensation expense recognized.
This change in accounting policy has impacted the following accounts as follows:
| | | | | | | | | |
| | | Twelve months | | | Three months | | | Six months | |
| | | ended September | | | ended March 31, | | | ended March 31, | |
| | | 30, 2011 | | | 2011 | | | 2011 | |
| | | | | | | | | |
| Consolidated statement of income and comprehensive income | | | | | | | | | |
| Share-based payment expense | | | | | | | | | |
| Increase – Options | $ | 99,196 | | $ | 27,625 | | $ | 127,696 | |
| Increase – RSUs | | 80,255 | | | 20,362 | | | 41,223 | |
| Increase – PSUs | | 6,201 | | | 8,997 | | | 18,602 | |
| (Decrease)/increase in comprehensive income | $ | (185,652 | ) | $ | (56,984 | ) | $ | (187,521 | ) |
| | | | | | | | | |
| | | September 30, | | | | | | | |
| | | 2011 | | | March 31, 2011 | | | October 1, 2010 | |
| | | | | | | | | |
| Consolidated statement of financial position | | | | | | | | | |
| Increase in contributed surplus | $ | 185,652 | | $ | 187,521 | | $ | - | |
| Increase/(decrease) in retained earnings | $ | (185,652 | ) | $ | (187,521 | ) | $ | - | |
Other Reclassifications
Certain other balances and financial statement captions have been reclassified from Canadian GAAP to conform with the presentation requirements of IFRS. The reclassification of these balances had no impact on net equity as at transition to IFRS.
| |
| PNI Digital Media Inc. | |
| Management's Discussion and Analysis | |
| For the three and six month period ended March 31, 2012 | Page 35 |
Quarterly financial information under IFRS
The following table outlines our unaudited financial position as at the end of each quarter in fiscal 2011, accounted for under IFRS:
| | | | | | | | | | | | |
| | | September 30, | | | June 30, | | | March 31, | | | December 31, | |
| | | 2011 | | | 2011 | | | 2011 | | | 2010 | |
| | | | | | | | | | | | |
| Assets | | | | | | | | | | | | |
| | | | | | | | | | | | |
| Current assets | | | | | | | | | | | | |
Cash and cash equivalents | $ | 3,936,176 | | $ | 3,020,411 | | $ | 4,745,436 | | $ | 3,737,564 | |
Accounts receivable | | 4,535,912 | | | 4,471,718 | | | 3,782,818 | | | 6,125,136 | |
Prepaid expenses and other current assets | | 460,140 | | | 471,225 | | | 590,213 | | | 548,702 | |
| | | | | | | | | | | | |
| | | 8,932,228 | | | 7,963,354 | | | 9,118,467 | | | 10,411,402 | |
| | | | | | | | | | | | |
| Property and equipment | | 5,140,150 | | | 5,415,294 | | | 5,617,962 | | | 5,184,067 | |
| Deferred income tax asset | | 7,065,857 | | | 5,827,236 | | | 5,495,321 | | | 5,258,828 | |
| Intangible assets | | 680,437 | | | 679,429 | | | 691,821 | | | 873,775 | |
| Goodwill | | 654,222 | | | 636,569 | | | 634,603 | | | 630,351 | |
| | | | | | | | | | | | |
| | $ | 22,472,894 | | $ | 20,521,882 | | $ | 21,558,174 | | | 22,358,423 | |
| | | | | | | | | | | | |
| Liabilities | | | | | | | | | | | | |
| | | | | | | | | | | | |
| Current liabilities | | | | | | | | | | | | |
| | | | | | | | | | | | |
Accounts payable and accrued liabilities | $ | 3,284,311 | | $ | 2,710,935 | | $ | 3,667,556 | $ | | 3,911,753 | |
Current portion of deferred revenue | | 250,323 | | | 261,601 | | | 423,910 | | | 602,139 | |
Current portion of finance lease obligations | | - | | | - | | | - | | | - | |
| | | 3,534,634 | | | 2,972,536 | | | 4,091,466 | | | 4,513,892 | |
| | | | | | | | | | | | |
| Deferred revenue | | 33,898 | | | 36,158 | | | 55,713 | | | 50,137 | |
| | | 3,568,532 | | | 3,008,694 | | | 4,147,179 | | | 4,564,029 | |
| | | | | | | | | | | | |
| Shareholders’ Equity | | | | | | | | | | | | |
| | | | | | | | | | | | |
| Share capital | $ | 66,420,572 | | $ | 66,552,792 | | $ | 66,687,630 | | $ | 66,076,912 | |
| Contributed surplus | | 19,522,420 | | | 19,322,393 | | | 19,132,094 | | | 19,306,396 | |
| | | 85,942,992 | | | 85,875,185 | | | 85,819,724 | | | 85,383,308 | |
| | | | | | | | | | | | |
| Deficit | | (67,012,367 | ) | | (67,992,794 | ) | | (68,015,034 | ) | | (67,132,277 | ) |
| | | | | | | | | | | | |
| Accumulated other comprehensive loss | | (26,263 | ) | | (369,203 | ) | | (393,695 | ) | | (456,637 | ) |
| | | (67,038,630 | ) | | (68,361,997 | ) | | (68,408,729 | ) | | (67,588,914 | ) |
| | | 18,904,362 | | | 17,513,188 | | | 17,410,995 | | | 17,794,394 | |
| | $ | 22,472,894 | | $ | 20,521,882 | | $ | 21,558,174 | | $ | 22,358,423 | |
| |
| PNI Digital Media Inc. | |
| Management's Discussion and Analysis | |
| For the three and six month period ended March 31, 2012 | Page 36 |
The following table outlines our unaudited, summarized results from operations for each quarter in and for the full year of Fiscal 2011, accounted for under IFRS:
| | | | | | | | | | | | | | | |
| | | | | | For the three months ended | | | | | | For the year | |
| | | | | | | | | | | | | | | ended | |
| | | September 30, | | | June 30, | | | March 31, | | | December 31, | | | September | |
| | | 2011 | | | 2011 | | | 2011 | | | 2010 | | | 30, 2011 | |
| | | | | | | | | | | | | | | |
| Revenue | $ | 5,605,041 | | $ | 5,316,242 | | $ | 5,031,263 | | $ | 7,733,805 | | $ | 23,686,351 | |
| Cost of sales | | 2,239,819 | | | 2,195,707 | | | 2,229,508 | | | 2,654,525 | | | 9,319,559 | |
| Gross Profit | | 3,365,222 | | | 3,120,535 | | | 2,801,755 | | | 5,079,280 | | | 14,366,792 | |
| | | | | | | | | | | | | | | |
| Expenses | | | | | | | | | | | | | | | |
Software development | | 2,325,787 | | | 2,200,333 | | | 2,410,604 | | | 2,305,854 | | | 9,242,578 | |
General and administration | | 1,024,194 | | | 1,007,813 | | | 1,092,311 | | | 1,100,309 | | | 4,224,627 | |
Sales and marketing | | 162,808 | | | 207,375 | | | 274,237 | | | 323,845 | | | 968,265 | |
| | | | | | | | | | | | | | | |
| | | 3,512,789 | | | 3,415,521 | | | 3,777,152 | | | 3,730,008 | | | 14,435,470 | |
| | | | | | | | | | | | | | | |
| Profit from operations | | (147,567 | ) | | (294,986 | ) | | (975,397 | ) | | 1,349,272 | | | (68,678 | ) |
| | | | | | | | | | | | | | | |
| Foreign exchange gain | | (90,874 | ) | | (42,184 | ) | | (162,529 | ) | | 170,439 | | | (125,148 | ) |
| Finance income | | (494 | ) | | 446 | | | - | | | 48 | | | - | |
| Finance costs | | 416 | | | (464 | ) | | (15 | ) | | (5,536 | ) | | (5,599 | ) |
| | | | | | | | | | | | | | | |
| | | (90,952 | ) | | (42,202 | ) | | (162,544 | ) | | 164,951 | | | (130,747 | ) |
| | | | | | | | | | | | | | | |
| Profit (loss) before income tax | | (238,519 | ) | | (337,188 | ) | | (1,137,941 | ) | | 1,514,223 | | | (199,425 | ) |
| | | | | | | | | | | | | | | |
Current income tax recovery (expense) | | - | | | - | | | - | | | - | | | - | |
Deferred income tax recovery (expense) | | 1,218,946 | | | 359,428 | | | 255,184 | | | (534,533 | ) | | 1,299,025 | |
| Income tax recovery (expense) | | 1,218,946 | | | 359,428 | | | 255,184 | | | (534,533 | ) | | 1,299,025 | |
| | | | | | | | | | | | | | | |
| Profit for the period | | 980,427 | | | 22,240 | | | (882,757 | ) | | 979,690 | | | 1,099,600 | |
| | | | | | | | | | | | | | | |
| Other comprehensive gain (loss): | | | | | | | | | | | | | | | |
| | | | | | | | | | | | | | | |
| Cumulative translation adjustment | | 342,940 | | | 24,492 | | | 62,942 | | | (456,637 | ) | | (26,263 | ) |
| | | | | | | | | | | | | | | |
Total comprehensive income for the period | $ | 1,323,367 | | $ | 46,732 | | $ | (819,815 | ) | $ | 523,053 | | | 1,073,337 | |
| | | | | | | | | | | | | | | |
| Earnings (loss) per share | | | | | | | | | | | | | | | |
| Basic | $ | 0.03 | | $ | 0.00 | | $ | (0.03 | ) | $ | 0.03 | | $ | 0.03 | |
| Fully diluted | $ | 0.03 | | $ | 0.00 | | $ | (0.03 | ) | $ | 0.03 | | $ | 0.03 | |
| |
| PNI Digital Media Inc. | |
| Management's Discussion and Analysis | |
| For the three and six month period ended March 31, 2012 | Page 37 |
There were no material differences between the statements of cash flows presented under IFRSs and the statement of cash flows presented under previous Canadian GAAP and thus we have not presented the quarterly cash flow information.
Business risks
The Company is subject to various risks and uncertainties that can significantly affect its financial performance. Key risks include the following:
Market and competition
There are inherent risks in the market for technological solutions. With the recent mass acceptance of the digital camera and camera cellular phone, the photography industry is quickly moving to employ an online technology, such as that offered by the Company. The Company's primary competition consists of very large, established corporations which can afford to meet the ever changing demands of this marketplace. To the extent that the Company does not have, or cannot continue to raise, the funds necessary to expand its market offering or to penetrate this market in a timely and cost effective manner, or achieve cost-effective pricing for its services, the Company's business growth could be adversely affected.
Changes in technology
The markets in which the Company operates are characterized by changing technology and evolving industry standards. The Company's ability to anticipate changes in technology, technical standards and service offerings is a significant factor in its ability to compete or expand into new markets. With limited experience in meeting customer requirements, there can be no assurance that the Company will be successful in continuing to identify, develop and market service offerings that will respond to technological change, evolving standards or individual customer standards and requirements.
Dependence on key people
The Company's growth and continued success depend on its ability to attract, retain, train and motivate highly skilled people. There can be significant competition for such people. There can be no assurance that the Company can retain its current key employees or attract and retain additional employees as needed. The loss of certain key employees could have an adverse impact upon the Company's growth, business and profitability.
Potential for liability
There is a risk that the Company's systems may contain errors or defects or fail to perform. The Company currently contractually limits its liability for damages arising from its provision of services. While this is true of the vast majority of the Company's contracts today, such limitations of liability may not have been included in all of the Company's contractual arrangements in the past. Where such limitations have been included, there can be no assurance that they will be enforceable in all circumstances and will protect the Company from liability for damages. Furthermore, litigation regardless of contracts could result in substantial cost to the Company, divert management's attention and resources from the Company's operation, and result in negative publicity that may impair the Company's ongoing marketing efforts.
| |
| PNI Digital Media Inc. | |
| Management's Discussion and Analysis | |
| For the three and six month period ended March 31, 2012 | Page 38 |
Currency exchange risk
Transaction risk.The Company has customers in various countries around the World and in some cases issues invoices in the customer's currency. As a result of this, the Company is exposed to fluctuations in the value of the foreign currency in which invoices are raised compared to the functional currency of the entity that raised the invoice. The main exposure for the Company in this regard relates to fluctuations in the value of the U.S. dollar and U.K. pound against the Canadian dollar. At this time the Company does not employ a hedge program. However, if there is a material change in circumstances and if the Company's expansion into either the U.S. or U.K. marketplaces place results in either a significant increase in revenues or expenses, then the level of the Company's risks to changes in the exchange rate could become important. Monetary assets and liabilities denominated in a currency that is not the primary or functional currency of the related subsidiary are translated to the functional currency of the subsidiary at the rate of exchange in effect at the balance sheet date with any resulting gain or loss included in the statement of loss.
Translation risk
The Company translates the assets and liabilities of self-sustaining foreign operations to Canadian dollars at the rate of exchange prevailing at the balance sheet dates. Gains and losses resulting from these translation adjustments for self-sustaining foreign operations are recorded in accumulated other comprehensive income, a component of shareholders' equity, until there is a realized reduction in the net investment in the foreign operation.
Rapid growth and expansion
We have operations in Vancouver, Canada and Southampton, United Kingdom. Our rapid growth and expansion has placed and will continue to place, a strain on our administrative and operational infrastructure. Our ability to manage our operations and future growth will require us to continue to refine our operational, financial and management controls, human resource policies and reporting systems. If we are unable to manage future expansion, we may not be able to implement improvement to our controls, policies and systems in an efficient or timely manner which could impact the services we offer to our customers and our ultimately our business results.
Interruption to our network infrastructure
The satisfactory performance, reliability and availability of our network infrastructure is critical to our business. Any interruptions that result in the unavailability of services to our customers could result in financial penalties, damage our reputation and limit our ability to renew contracts with customers as they come due or win business from new customers. All of the hardware that makes up network infrastructure is located in secure third party locations in Canada and as a result we depend in part on these third parties to offer continued secure and reliable services including security, power, air conditioning and bandwidth. We have in place with these third parties service level agreements that provide us with financial compensation in the event of circumstances that interrupt the provision of services, however any financial compensation received under these agreements may not be sufficient to cover actions taken by our customers for their loss of business or the longer-term effects on our reputation if we are unable to maintain the services we are contractually required to.
| |
| PNI Digital Media Inc. | |
| Management's Discussion and Analysis | |
| For the three and six month period ended March 31, 2012 | Page 39 |
Management’s statement of responsibility
The consolidated financial statements contained in this report have been prepared by management in accordance with generally accepted accounting principles in Canada and have been approved by the Board of Directors. The integrity and objectivity of the consolidated financial statements are the responsibility of management. In addition, management is responsible for all other information in this report and for ensuring that this information is consistent, where appropriate, with the information contained in the consolidated financial statements.
Management maintains a system of internal accounting controls to provide reasonable assurance that the Company's assets are safeguarded and accounted for, and to facilitate the preparation of relevant, reliable, and timely financial information. Where necessary, management uses its best judgment to make estimates required to ensure fair and consistent presentation of this information.
The Company's management, including the Chief Executive Officer (CEO) and Chief Financial Officer (CFO), believe that any disclosure controls and procedures or internal controls and procedures, no matter how well conceived and operated, can provide only reasonable, not absolute, assurance that the objectives of the control system are met.
The CEO and the CFO have evaluated the design and operation of the Company's disclosure controls and procedures related to the preparation of Management's discussion and analysis and the consolidated financial statements. They have concluded that the Company's disclosure controls and procedures were effective.
Further, the design of a control system must reflect the fact that there are resource constraints, and the benefits of controls must be considered relative to their costs. Because of the inherent limitations in all control systems, they cannot provide absolute assurance that all control issues and instances of fraud, if any, within the Company have been prevented or detected. These inherent limitations include the realities that judgments in decision-making can be faulty, and that breakdowns can occur because of a simple error or mistake. Additionally, controls can be circumvented by the individual acts of some persons, by collusion of two or more people, or by unauthorized override of the control. The design of any systems of controls also is based in part upon certain assumptions about the likelihood of future events, and there can be no assurance that any design will succeed in achieving its stated goals under all potential future conditions. Accordingly, because of the inherent limitations in a cost effective control system, misstatements due to error or fraud may occur and not be detected.
There has been no change in the Company's disclosure controls or internal control over financial reporting during the three month period ended March 31, 2012 that have materially affected, or are reasonably likely to materially affect, the Company's internal control over financial reporting.
Based on the evaluation of the design and operating effectiveness of the company's internal controls over financial reporting, the CEO and the CFO concluded that the company's internal control over financial reporting was effective as at March 31, 2012.
The Board of Directors is responsible for ensuring that management fulfills its responsibilities for financial reporting and internal control, and exercises this responsibility principally through the Audit Committee. The Audit Committee includes four directors, all four of whom are not involved
| |
| PNI Digital Media Inc. | |
| Management's Discussion and Analysis | |
| For the three and six month period ended March 31, 2012 | Page 40 |
in the daily operations of the Company. The functions of the Audit Committee are to review the quarterly and annual consolidated financial statements; review the adequacy of the system of internal controls; review any relevant accounting, financial and security regulatory matters; and recommend the appointment of external auditors.
Forward looking statements
This Management's discussion and analysis contains statements about expected future events and financial and operating results of PNI Digital Media Inc. that are forward-looking. By their nature, forward-looking statements require the Company to make assumptions and are subject to inherent risks and uncertainties. These forward-looking statements are based on current expectations. There is substantial risk that forward-looking statements will not prove to be accurate. Readers are cautioned not to place undue reliance on the Company's forward-looking statements as a number of factors including, but not limited to, changes in the market for our services, changes in the economy, increasing competition in our market, the risk of loss of current customers, risks related to changes in technology, employee retention, inability to deliver on contracts, failure of customers to adequately market the online photo-finishing services they provide, foreign exchange, and risks with respect to our financial capacity could cause actual future results, conditions, actions or events to differ materially from targets, expectations, estimates or intentions expressed in the forward-looking statements; many of which are beyond the Company's control.
Future events and results may vary significantly from what the Company currently foresees. We are under no obligation to update or alter the forward-looking statements whether as a result of new information, future events or otherwise. For a more detailed discussion of factors that may affect actual results, see the section entitled “Business Risks”.
Additional information
Additional information related to the Company can be found on SEDAR at www.sedar.com and on the SEC's website at www.sec.gov/edgar.shtml
| |
| PNI Digital Media Inc. | |
| Management's Discussion and Analysis | |
| For the three and six month period ended March 31, 2012 | Page 41 |