CONFIDENTIAL
Paul O’Connor
Managing Director
312-269-0346
paul.oconnor@ryanbeck.com
May 17, 2005
Fairness Review
For Luxemburg Bancshares, Inc.

Private and Confidential
The attached materials have been compiled and prepared by Ryan Beck & Co., Inc. solely for
the use and information of the board of directors and management of Luxemburg Bancshares,
Inc. Such materials are not intended for viewing by any other person or party for any purpose,
and no such review should be undertaken without the prior written consent of Ryan Beck & Co.,
Inc. through one or more of its authorized officers.
Portions of the information contained herein are not publicly available and are not intended for
public dissemination. The public disclosure or personal use of such information may be
actionable under applicable federal and/or state securities laws.

Table of Contents
Page 3
1.
Transaction Summary
2.
Luxemburg Bancshares, Inc. Overview
3.
Valuation of Luxemburg Bancshares, Inc.
Discounted Dividend Analysis
Peer Group Comparison
4.
Control Premium Valuation
5.
Repurchase Analysis
6.
Conclusion
7.
Ryan Beck Relationship

Tab 1
Transaction Summary

Luxemburg Bancshares, Inc. (“LUX” or “Luxemburg”) has engaged Ryan Beck & Co. to assist it in de-
registering from the SEC. LUX intends to de-register from the SEC due to the costs associated with
SEC filing requirements and Sarbanes Oxley. Additionally, being a registered company has brought
very limited benefit to LUX relative to the trading in its stock. It is management’s assessment that
Luxemburg can serve its customers and enhance its returns to shareholders better without the burdens
placed upon it by the SEC.
Luxemburg management realizes that its projected total capital ratio, after taking into consideration the
share buy-back contemplated in this transaction, will be below the Federal Reserve’s “well-capitalized”
minimum of 10.0%. To alleviate any regulatory capital concerns, LUX has decided to finance the buy-
back of shares with subordinated debt.
In December of 2004, The Department of Financial Institutions for the State of Wisconsin and the FDIC
placed LUX under a Memorandum of Understanding. In the 8-K filed by LUX, management stated that
they were taking a $550,000 additional provision for loan losses due to the deterioration of two separate
loans identified by the FDIC and State of Wisconsin during its most recent examination. To repurchase
the proposed number of shares, LUX will need Federal Reserve approval.
LUX is represented by Godfrey & Kahn, Milwaukee, Wisconsin, and Ryan Beck is represented by
Pitney Hardin.
Page 5
Transaction Summary

De-registering from the SEC will be accomplished by using a reverse stock split to reduce the number of current
shareholders to below 300 (the “Transaction”).
LUX has requested our opinion as investment bankers of the fair value of 92,412 shares, the amount to be
repurchased as part of the reverse stock split, of Luxemburg Bancshares, Inc. common stock. The number
of shares to be redeemed through the Transaction is equal to approximately 16.5% of the outstanding
shares. The consummation of the Transaction will reduce Luxemburg’s shareholder base to 203
shareholders, a 75.1% reduction in the number of current shareholders. The Transaction will target
shareholders owning less than 500 shares.
The fair value range that we provide is expected to be used by Luxemburg’s Board of Directors to support
their determination of an offer price for its shareholders that will be cashed-out as a result of the Transaction.
By factoring in a control premium to the estimated current market value of Luxemburg common stock, we
were able to determine a fair value range of $52.00 to $56.00 per share. Luxemburg does not trade on any
exchange, the OTC Bulletin Board or the Pink Sheets. Management has kept a record of trades of which it is
aware. Luxemburg’s records indicate that during the last twelve months, 3,195 shares (0.57% of outstanding
shares) have traded. All shares have been exchanged in the range of $40.00 - $52.00 per share. The last
traded price was $52.00 per share. Given the lack of volume and infrequency of trades, we have not factored
in the most recent stock price of $52.00 into our analysis.
In addition, we have made no adjustment to reflect the potential negative impact the MOU could have on the
fair value of Luxemburg’s common stock.
Page 6
Transaction Summary

Page 7
Transaction Summary
We believe we have followed the court rulings for determining fair value to arrive at our
range. However, courts have not provided a precise formula. It is ultimately the
responsibility of the Board of Directors to set the repurchase price.
We have been advised by Luxemburg’s Wisconsin counsel that the Company will pay
“fair value” under the statutory dissenters rights under Wisconsin law, even though
shareholders will not have dissenters rights. Under Chapter 180, subchapter XIII, a
shareholder may dissent from and obtain payment of the “fair value” of his or her
shares in the event of certain corporate actions.
“Fair Value” is defined in Section 180.1301(4), Wisconsin Statutes as:
“Fair Value,” with respect to a dissenter’s shares other than in a business
combination, means the value of the shares immediately before the effectuation
of the corporate action to which the dissenter objects, excluding any
appreciation or depreciation in anticipation of the corporate action unless
exclusion would be inequitable.

Since the Transaction is not voluntary, the valuation criteria must reflect the June 2000
decision by the Wisconsin Supreme Court in the HMO-W Inc. v. SSM Healthcare
Systems case. The Supreme Court of Wisconsin quoted a leading Delaware case as
follows: “Where there is no objective market data available, the appraisal process is
not intended to reconstruct a pro forma sale but to assume that the shareholder was
willing to maintain his investment position, however slight, had the merger not
occurred…To fail to accord to a minority shareholder the full proportionate value of his
shares imposes a penalty for lack of control, and unfairly enriches the majority
shareholders who may reap a windfall from the appraisal process by cashing out a
dissenting shareholder, a clearly undesirable result.”
Additionally, the Court cited with approval an ALI Principle, which states that the fair
value of shares should reflect the value of the shareholder’s “proportionate interest in
the corporation, without any discount for minority status or, absent extraordinary
circumstances, lack of marketability.”
Transaction Summary
Page 8

As part of our analysis, we asked Luxemburg’s Wisconsin legal counsel whether
Wisconsin Statutes and/or Wisconsin published court decisions specifically addresses
the applicability of a control premium in connection with the determination of fair value
under Wisconsin law. According to Luxemburg’s Wisconsin legal counsel, if our use of
the control premium is to eliminate a minority share discount, then our analysis should
include one. In our analysis, we have included a control premium but not an acquisition
premium (i.e., a premium an acquirer would pay due to potential synergies associated
with actions following the transaction).
Transaction Summary
Page 9

As part of the valuation process, Ryan Beck has:
Performed due diligence of the company to identify the company’s strengths/weaknesses and
future prospects.
Discussed with management the financial condition, businesses, assets, earnings and
management’s views about the future performance of the company.
Reviewed certain publicly available financial information, both audited and unaudited, as well as
other internally generated financial reports.
Reviewed certain financial forecasts and projections of Luxemburg Bancshares prepared by its
management.
Reviewed certain information about the market prices and trading history of the common stock of
Luxemburg Bancshares.
Reviewed certain aspects of the financial performance of Luxemburg Bancshares and compared it
to similar available financial and stock trading data for a peer group of selected financial
institutions.
Reviewed the terms and conditions of the plan to reduce the number of shareholders to below
300.
Page 10
Transaction Summary

The cost of this transaction will be financed with subordinated debt and cash on hand. The cost of the
subordinated debt is estimated at the three year forward rate for three-month LIBOR (4.41%) plus 265
bps. Luxemburg has negotiated a subordinated debt agreement with Associated Bank in Green Bay,
Wisconsin.
One-time expenses have been estimated by management and included in the total cost of the reverse
stock split Transaction. They are summarized as follows:
Legal: $65,000
Accounting: $5,000
Ryan Beck: $85,000
Printing: $5,000
Subordinated Debt Fee: $32,500
Total: $192,500
Luxemburg Bancshares has provided an estimated range of cost savings related to the de-registration of
their securities with $375,000 being at the low end and $670,000 being at the high end. We have
chosen to include the low end of that range to be conservative in our analysis.
Page 11
Transaction Summary

Transaction Summary
Note: Assumes repurchase occurs on January 1, 2005.
(1) Based on the Ryan Beck’s estimate of the current market value of Luxemburg’s common stock.
Page 12
(dollars in thousands except per share data)
Repurchase Amount:
16.48%
(as a % of shares outstanding)
Current
(1)
15.71%
20.16%
24.61%
Luxemburg Bancshares Repurchase Price
$44.94
$52.00
$54.00
$56.00
Cost of Repurchase
$4,998
$5,183
$5,368
Shares Repurchased (000's)
92
92
92
Price/ 2005 Diluted Est. EPS
13.4x
12.9x
13.4x
14.0x
EPS Accretion
20.37%
20.10%
19.84%
Price/ Book Value
136.88%
181.58%
191.20%
201.09%
Price/ Tangible Book Value
136.88%
181.58%
191.20%
201.09%
Tangible Equity/ Assets
10.59%
7.72%
7.62%
7.52%
Leverage Ratio
10.28%
7.76%
7.66%
7.56%
Tier 1 Risk-Based Capital Ratio
10.84%
7.91%
7.81%
7.71%
Total Risk-Based Capital Ratio
12.09%
12.09%
11.99%
11.90%
ROAE (based on 2005 net income)
10.44%
14.54%
14.72%
14.90%
Premium to Current Market Value
(1)
Tab 2
Luxemburg Bancshares, Inc. Overview
Financial Highlights
Page 14
* Bank level data.
As of or for the 12
months ended
2000*
2001*
2002*
2003
2004
March 31, 2005
Balance Sheet Highlights
Total Assets
$124,229
$138,718
$153,117
$167,925
$180,642
$173,748
Total Loans
$94,645
$103,337
$117,477
$133,984
$151,216
$148,909
Loans/Assets (%)
76.19
74.49
76.72
79.79
83.71
85.70
Total Deposits
$108,321
$121,132
$133,560
$147,366
$158,124
$151,502
Loans/Deposits (%)
87.37
85.31
87.96
90.92
95.63
98.29
Performance Measures
Net Income
$1,190
$1,510
$1,919
$2,072
$1,436
$1,695
ROAA (%)
1.03
1.16
1.31
1.28
0.83
0.99
ROAE (%)
11.96
12.99
14.62
12.61
8.15
9.43
Noninterest Income/AA (%)
1.03
1.58
1.77
1.94
1.18
1.24
Noninterest Expense/AA (%)
3.11
3.09
3.06
3.22
3.20
3.34
Net Interest Margin (%)
3.85
3.67
3.9
3.69
4.12
4.35
Efficiency Ratio (%)
64.6
60.4
56.54
60.07
64.76
64.01
Capitalization
Equity Capital
$10,787
$12,200
$13,956
$16,979
$17,794
$18,406
Tier 1 Capital
$10,780
$11,964
$13,420
$16,435
$17,549
$18,273
Equity Capital/Total Assets (%)
8.68
8.79
9.11
10.11
9.85
10.59
Tang Equity/Tang Assets (%)
8.68
8.79
9.11
10.11
9.85
10.59
Tier 1 Risk Based Capital Ratio (%)
12.78
12.11
12.21
11.37
10.30
10.84
Total Risk Based Capital Ratio (%)
11.64
11.08
11.00
12.65
11.54
12.09
Leverage Ratio (%)
9.09
8.67
8.72
9.93
10.02
10.28
As of or for the years ended December 31,
Financial Highlights
Page 15
* Bank level data.
As of or for the 12
months ended
2000*
2001*
2002*
2003
2004
March 31, 2005
Loan Composition
Constr & Dev/Tot Lns (%)
7.19
11.21
9.71
9.23
8.36
7.44
1-4 Family/Tot Lns (%)
34.95
26.67
26.95
23.98
22.42
22.71
Multifamily/Tot Lns (%)
0.41
0.26
0.00
0.17
1.15
0.07
Farmland/ Tot Lns (%)
0.54
0.17
0.27
0.63
0.72
0.73
Cmrcl RE Loans/Tot Lns (%)
0.61
0.84
4.46
11.08
12.97
13.80
Total RE Loans/Tot Lns (%)
43.69
39.15
41.38
45.10
45.62
44.77
Tot C&I Loans/Tot Lns (%)
39.45
44.24
43.43
39.88
39.44
40.25
Tot Consumer Loans/Tot Lns (%)
8.78
7.60
7.38
6.94
6.53
6.62
Agricultural Prod/Tot Lns (%)
6.71
7.75
6.79
6.69
6.86
6.87
Deposit Composition
Nonint Bear Deps/Total Deposits (%)
13.47
13.97
16.93
14.87
14.88
14.36
Trans Accts/Total Deposits (%)
18.91
19.30
22.29
20.99
20.95
20.29
Savings+MMDAs/Total Deposits (%)
22.32
26.31
25.32
26.85
27.92
27.87
Retail CDs/Total Deposits (%)
47.31
42.58
40.25
38.34
35.47
37.46
Jumbo CDs/Total Deposits (%)
11.46
11.80
12.14
13.82
15.66
14.38
Asset Quality
NPLs/ Total Loans (%)
0.27
0.59
2.15
3.36
2.27
1.75
NPAs/Total Assets (%)
0.21
0.54
1.65
2.73
2.09
1.62
NPAs + 90s/Total Assets (%)
1.19
0.56
1.65
2.73
2.09
1.62
Reserves/Loans (%)
1.12
1.07
1.25
1.40
1.39
1.47
Reserves/NPAs (%)
410.85
145.90
58.06
41.06
55.54
77.38
NCOs/Average Loans (%)
-0.01
0.26
0.11
0.09
0.72
0.73
As of or for the years ended December 31,
Ownership Profile
Page 16
Total Insider Ownership of Luxemburg Bancshares, Inc.:
6.0%
All Directors and Executive
Officers of the Company
Shares Held
% Held
Raymond J. Balza
825
0.1
Lois M. Hoida
3,430
0.6
Sheri L. Knope
285
0.1
Ronald A. Ledvina
5,578
1.0
David Luebbers
6,625
1.2
Donald E. Pritzl
1,551
0.3
Thomas J. Rueckl
6,748
1.2
Stephan L. Seidl
1,147
0.2
John A. Slatky
7,457
1.3
Peter J. Tillman
30
0.0
Totals:
33,676
6.0

Tab 3
Valuation of Luxemburg Bancshares, Inc.
Discounted Dividend Analysis
Peer Group Comparison

Discounted Dividend Analysis

Page 19
Discounted Dividend Analysis
Luxemburg Bancshares Provided Assumptions:
5 years of earnings projections were provided:
2005: $1.9 million
2006: $2.0 million
2007: $2.2 million
2008: $2.4 million
2009: $2.6 million
Resulting 5-year CAGR from earnings projections of 8.0%
We note that management’s earnings estimate for 2005 represents an increase of 31% over
2004 earnings and is substantially higher than the 8.0% projected growth rate for years 2005 –
2009. Management expects to return to normal operating earnings in 2005, after having to
take a special loan loss provision in 2004 for the charge-off of a nonperforming loan. The
2005 earnings estimate will have Luxemburg generating an ROAA of approximately 1.0% for
2005. The Company’s historical ROAA has ranged from 1.0% - 1.3%.
Asset growth rate of 8.0%.
Tax rate of 35%.

Page 20
Discounted Dividend Analysis
Discounted Dividend Analysis Assumptions Cont.
A minimum capital ratio of 7.0% to reflect LUX’s asset growth rate and increased regulatory
scrutiny.
To determine an appropriate discount rate range, we first looked at Luxemburg’s current
ROAE. Luxemburg’s current ROAE of 9.43%, driven by a significant loan loss provision, is not
a reasonable proxy for a discount rate in this analysis. Historically, Luxemburg’s ROAE has
ranged from approximately 12.0% - 14.0%. Management expects ROAE levels to return to the
historical range and therefore we determined that 12.0% - 14.0% was an appropriate discount
rate range.
The terminal multiple range of 13.0x – 15.0x is based on historical trading multiples of the
banking industry.
Discounted Dividend Analysis
Page 21
(Dollars in thousands, except per share data)
MAINTAIN TANGIBLE EQUITY RATIO OF 7.00%.
LUXEMBURG BANCSHARES, INC. EARNINGS AS ESTIMATES
ASSUMES NO RESTRUCTURING CHARGE
Five Year Projections
2005
2006
2007
2008
2009
Beginning Equity (a)
$11,692
$12,628
$13,638
$14,729
$15,907
Unadjusted Net Income (a,b)
1,877
2,027
2,189
2,364
2,554
After Tax Income Impact (c)
(153)
(161)
(170)
(180)
(191)
Synergies/Restructuring Charge (d)
0
0
0
0
0
Adjusted Net Income (e)
$1,724
$1,866
$2,019
$2,184
$2,363
Dividends (f)
(789)
(856)
(928)
(1,006)
(1,090)
Ending Equity
12,628
13,638
14,729
15,907
17,180
Intangibles (g)
0
0
0
0
0
Ending Tangible Equity
$12,628
$13,638
$14,729
$15,907
$17,180
Net Change in Equity (h)
(367)
(400)
(436)
(474)
(516)
Cumulative Change in Equity
(7,081)
(7,480)
(7,916)
(8,390)
(8,906)
Total Assets (a,b)
$180,397
$194,828
$210,415
$227,248
$245,428
Asset Growth Rate
3.83%
8.00%
8.00%
8.00%
8.00%
Net Income Growth Rate (i)
NM
8.23%
8.20%
8.18%
8.17%
Return on Average Assets
1.04%
1.08%
1.08%
1.08%
1.08%
Adjusted ROAA
0.96%
0.99%
1.00%
1.00%
1.00%
Adjusted ROAE
14.18%
14.21%
14.24%
14.26%
14.28%
Equity / Assets
7.00%
7.00%
7.00%
7.00%
7.00%
Tangible Equity/ Tangible Assets
7.00%
7.00%
7.00%
7.00%
7.00%

Discounted Dividend Analysis
Page 22
Aggregate Net Present Value - Per Share (j)
Discount Rate:
12.00%
13.00%
14.00%
Terminal Year
13.00
$48.30
$46.77
$45.31
Multiple of
Earnings
14.00
$50.66
$49.02
$47.47
Adj. for Intangible
Amortization (k)
15.00
$53.02
$51.28
$49.62

Discounted Dividend Analysis
Page 23
Footnotes
Methodology: The Discounted Dividend Analysis produces values given earnings estimates and projections of achievable synergies,
over a range of discount rates and terminal year earnings multiples. An initial dividend for tangible capital in excess of a
specified target is assumed; earnings in subsequent years are adjusted to reflect the opportunity cost of this distribution.
Earnings in excess of those required to maintain Luxemburg Bancshares, Inc.’s tangible equity ratio at the specified targets are
dividendable. It should be noted that “Synergies” is defined as cost savings and revenue enhancements which are assumed to
approximate 0.00% of Luxemburg Bancshares, Inc.’s non-interest expenses in 2006.
* Present value = NPV of dividend stream plus terminal year multiple applied to net income less intangible amortization.
a)
Beginning equity for Luxemburg Bancshares, Inc. represents total equity for the period ended March 31, 2005, after an initial
dividend to reduce Luxemburg Bancshares, Inc.’s tangible equity to assets to specified target tangible capital levels.
b)
Earnings assumption based on Luxemburg Bancshares, Inc. projections for 2005, and are assumed to grow at 8.00% per
annum thereafter. Asset projections are assumed to grow at an annual rate of 8.00%.
c)
Assumes a pre-tax rate of 3.50% is earned/(lost) on any capital retained/(dividended) in excess of assumed regular dividend
payout. Assumes a tax rate of 35.00%.
d)
No synergies/revenue enhancements are assumed.
e)
Adjusted for income impact of paying dividends in excess of assumed regular dividend payout ratio.
f)
Assumed to pay the maximum dividend possible while maintaining a tangible equity/asset ratio of 7.00%.
g)
Intangibles assumed to be amortized at a rate of $000 per year.
h)
Represents dividends paid in excess of estimated payout ratio of 22.50%.
i)
Includes income impact of cumulative increase (decrease) in equity.
j)
Per share data is based on 560,635 diluted shares outstanding.
k)
The terminal year multiple, when applied to terminal year adjusted earnings produces a value which approximates the net
present value of the earnings in perpetuity, given certain assumptions regarding growth rates and discount rates.

Peer Group Comparison

Peer Group Comparison
Page 25
We chose the following peer group based upon these parameters:
Publicly traded.
Comparable profitability – LTM ROAA > 0.50%.
Comparable asset quality – NPL’s/Loans > 0.75%
Assets between $100 million and $500 million.
Excludes companies that have entered into an agreement to be
acquired.
Query resulted in 14 companies.
Page 26
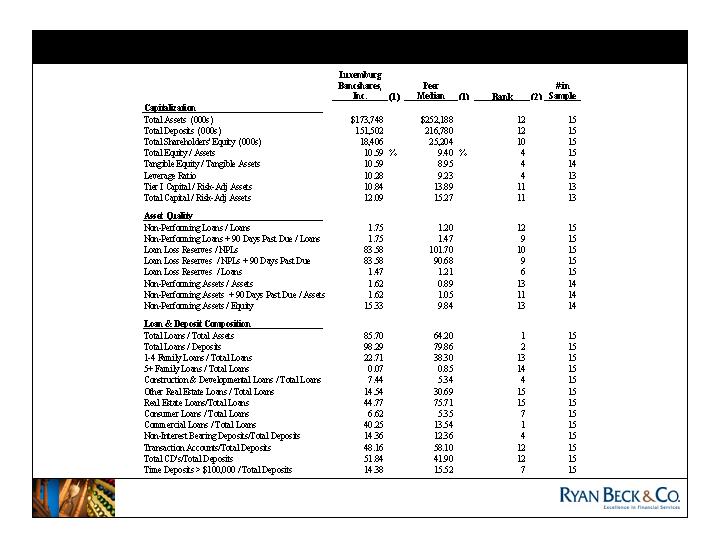
Peer Group Comparison
(1) For the 12 months ended March 31, 2005.
(2) The highest rank is 1 (from best performer in category to worst).
Page 27
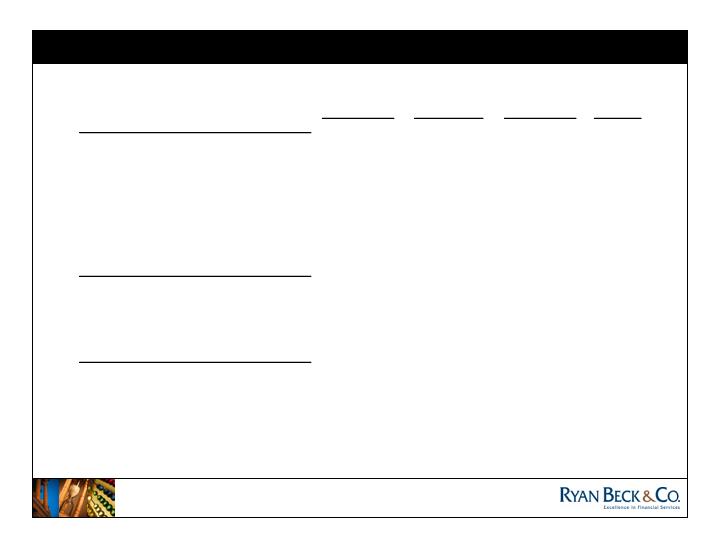
Peer Group Comparison
Luxemburg
Bancshares,
Inc.
(1)
Peer
Median
(1)
Rank
(2)
# in
Sample
Performance
Return on Average Assets
0.99
0.91
6
15
Core Return on Average Assets
0.84
0.90
10
15
Return on Average Equity
9.43
10.17
12
15
Core Return on Average Equity
7.95
10.16
12
15
Net Interest Margin
4.35
3.96
3
15
Non Interest Income / Average Assets
1.24
0.93
4
15
Non Interest Expense/Avg Assets
3.34
2.75
11
15
Efficiency Ratio
64.01
66.06
6
15
Growth Rates
Asset Growth
3.15
3.68
9
15
Loan Growth Rate
6.27
3.27
6
15
Deposit Growth Rate
4.28
3.08
7
15
Revenue Growth Rate
4.05
1.24
6
14
Market Statistics
Price / LTM EPS
13.44
x
Price / LTM Core EPS
13.57
Price / Book Value
131.38
%
Price / Tangible Book Value
137.39
Market Capitalization ($M)
$31.79
Dividend Yield
2.16
%
(1) For the 12 months ended March 31, 2005.
(2) The highest rank is 1 (from best performer in category to worst).

Page 28
Peer Group Comparison
Number
States
Total
of
of
Assets
Name
Ticker
State
Offices
Operation
($000)
Benton Financial Corporation
BTOF
IN
4
IN(4)
118,875
Blackhawk Bancorp, Inc.
BHWB
WI
9
IL(6),WI(3)
425,596
Brotherhood Bancshares, Inc.
BHDB
KS
7
KS(7)
434,786
Community National Corporation
CMNC
OH
5
OH(5)
135,504
Cortland Bancorp
CLDB
OH
13
OH(13)
446,393
Eastern Michigan Financial Corp
EFIN
MI
9
MI(9)
228,061
Empire Bancshares, Inc.
EBSH
OH
3
OH(2),IN(1)
142,250
Heartland Bancshares, Inc.
HRTB
IN
4
IN(4)
185,837
ICNB Financial Corporation
ICNB
MI
9
MI(9)
228,592
Landmark Bancorp, Inc.
LARK
KS
17
KS(17)
444,021
Ohio Legacy Corp
OLCB
OH
4
OH(4)
200,476
Pontiac Bancorp, Incorporated
PONT
IL
5
IL(5)
275,783
PSB Group, Inc.
PSBG
MI
11
MI(11)
461,342
West Pointe Bancorp, Incorporated
WTPT
IL
5
IL(5)
444,021
Median
6
252,188
Luxemburg Bancshares, Inc.
WI
7
WI(7)
173,748

Page 29
Our objective in preparing a comparable peer group analysis is to determine the implied price range
that Luxemburg would trade at if its shares were highly liquid and traded on a major stock
exchange. By making this adjustment, we eliminate the lack of marketability discount in
Luxemburg’s share value range.
In reviewing Luxemburg’s financial performance against this peer group, the results have shown
that LUX ranks in the middle overall with respect to balance sheet statistics and performance
measures.
Core earnings is defined as net income before extraordinary items less the after-tax portion of gains
(losses) from investment securities and nonrecurring items. For the latest twelve months ended
March 31, 2005, Luxemburg had $419,000 of realized pre-tax gains from the sale of available-for-
sale securities, resulting in a Core EPS for Luxemburg of $2.55 compared to the reported EPS for
the latest twelve months of $3.02.
We noted that there were four estimates in the peer group for 2005 EPS and two estimates for 2006
EPS.
The average of the implied values for Luxemburg produced by the peer group is $40.86 per share.
Peer Group Comparison

Page 31
Market Value Conclusion
By taking the average of the
implied values produced from the
discounted dividend analysis and
the peer group analysis, we believe
that the current market value of
Luxemburg common stock is
$44.94 per share.
Implied Value Per Share
Discounted Dividend Analysis
$49.02
Peer Group Analysis
$40.86
Average
$44.94

Tab 4
Control Premium Valuation

Page 33
In the Comparable Peer Group analysis, we eliminated the lack of marketability
discount. We used a 10.0% - 20.0% control premium to eliminate the minority share
discount in the implied valuation range. This adjustment complies with the
requirements of Wisconsin Statute, which requires that fair value have no discounts for
minority status or lack of marketability.
A typical control premium falls in the range of 10.0% - 20.0% of the implied market
value. Applying this range to the estimated current market value of Luxemburg’s
common stock established in the previous section results in the following per share
values.
Estimated current market value = $44.94
Implied value per share based on:
10% Premium = $49.43
15% Premium = $51.68
20% Premium = $53.93
Control Premium Valuation
Page 34
Based on the historical trading multiple
range of 13.0x – 15.0x for the banking
industry, we have assumed a terminal
multiple range of 16.0x – 18.0x to factor in a
control premium.
Incorporating a control premium into the
terminal multiple range while keeping all
other assumptions the same produced the
following per share price range.
Control Premium Valuation – Discounted Dividend Analysis
Aggregate Net Present Value - Per Share (j)
Discount Rate:
12.00%
13.00%
14.00%
Terminal Year
16.00
$55.38
$53.53
$51.78
Multiple of
Earnings
17.00
$57.74
$55.79
$53.93
Adj. for Intangible
Amortization (k)
18.00
$60.10
$58.04
$56.09

Page 35
Control Premium Valuation – Discounted Dividend Analysis
(Dollars in thousands, except per share data)
MAINTAIN TANGIBLE EQUITY RATIO OF 7.00%.
LUXEMBURG BANCSHARES, INC. EARNINGS AS ESTIMATES
ASSUMES NO RESTRUCTURING CHARGE
Five Year Projections
2005
2006
2007
2008
2009
Beginning Equity (a)
$11,692
$12,628
$13,638
$14,729
$15,907
Unadjusted Net Income (a,b)
1,877
2,027
2,189
2,364
2,554
After Tax Income Impact (c)
(153)
(161)
(170)
(180)
(191)
Synergies/Restructuring Charge (d)
0
0
0
0
0
Adjusted Net Income (e)
$1,724
$1,866
$2,019
$2,184
$2,363
Dividends (f)
(789)
(856)
(928)
(1,006)
(1,090)
Ending Equity
12,628
13,638
14,729
15,907
17,180
Intangibles (g)
0
0
0
0
0
Ending Tangible Equity
$12,628
$13,638
$14,729
$15,907
$17,180
Net Change in Equity (h)
(367)
(400)
(436)
(474)
(516)
Cumulative Change in Equity
(7,081)
(7,480)
(7,916)
(8,390)
(8,906)
Total Assets (a,b)
$180,397
$194,828
$210,415
$227,248
$245,428
Asset Growth Rate
3.83%
8.00%
8.00%
8.00%
8.00%
Net Income Growth Rate (i)
NM
8.23%
8.20%
8.18%
8.17%
Return on Average Assets
1.04%
1.08%
1.08%
1.08%
1.08%
Adjusted ROAA
0.96%
0.99%
1.00%
1.00%
1.00%
Adjusted ROAE
14.18%
14.21%
14.24%
14.26%
14.28%
Equity / Assets
7.00%
7.00%
7.00%
7.00%
7.00%
Tangible Equity/ Tangible Assets
7.00%
7.00%
7.00%
7.00%
7.00%

Page 36
Control Premium Valuation – Discounted Dividend Analysis
Footnotes
Methodology: The Discounted Dividend Analysis produces values given earnings estimates and projections of achievable synergies,
over a range of discount rates and terminal year earnings multiples. An initial dividend for tangible capital in excess of a
specified target is assumed; earnings in subsequent years are adjusted to reflect the opportunity cost of this distribution.
Earnings in excess of those required to maintain Luxemburg Bancshares, Inc.’s tangible equity ratio at the specified targets are
dividendable. It should be noted that “Synergies” is defined as cost savings and revenue enhancements which are assumed to
approximate 0.00% of Luxemburg Bancshares, Inc.’s non-interest expenses in 2006.
* Present value = NPV of dividend stream plus terminal year multiple applied to net income less intangible amortization.
a)
Beginning equity for Luxemburg Bancshares, Inc. represents total equity for the period ended March 31, 2005, after an initial
dividend to reduce Luxemburg Bancshares, Inc.’s tangible equity to assets to specified target tangible capital levels.
b)
Earnings assumption based on Luxemburg Bancshares, Inc. projections for 2005, and are assumed to grow at 8.00% per
annum thereafter. Asset projections are assumed to grow at an annual rate of 8.00%.
c)
Assumes a pre-tax rate of 3.50% is earned/(lost) on any capital retained/(dividended) in excess of assumed regular dividend
payout. Assumes a tax rate of 35.00%.
d)
No synergies/revenue enhancements are assumed.
e)
Adjusted for income impact of paying dividends in excess of assumed regular dividend payout ratio.
f)
Assumed to pay the maximum dividend possible while maintaining a tangible equity/asset ratio of 7.00%.
g)
Intangibles assumed to be amortized at a rate of $000 per year.
h)
Represents dividends paid in excess of estimated payout ratio of 22.50%.
i)
Includes income impact of cumulative increase (decrease) in equity.
j)
Per share data is based on 560,635 diluted shares outstanding.
k)
The terminal year multiple, when applied to terminal year adjusted earnings produces a value which approximates the net
present value of the earnings in perpetuity, given certain assumptions regarding growth rates and discount rates.

Tab 5
Repurchase Analysis

Repurchase Analysis
Page 38
Financials as of 03/31/05.
16.48%
16.48%
16.48%
Repurchase Data
Repurchase Price
$44.94
$52.00
$54.00
$56.00
Premium to Market Price
15.71%
20.16%
24.61%
Source of Cash and Amount
Sub Debt
$4,998
$5,183
$5,368
After-tax Cost of Cash
2.28%
2.28%
2.28%
2.28%
After-tax Cost of Trust Preferred
3.25%
3.25%
3.25%
3.25%
After-tax Cost of Debt 1/
4.59%
4.59%
4.59%
4.59%
Shares Repurchased
92
92
92
Basic Shares Outstanding
561
468
468
468
Diluted Shares Outstanding
561
468
468
468
Income Statement Data
Net Income (2005 Est. of $3.35 per share)
$1,877
$1,877
$1,877
$1,877
Income Adjustment 2/
10
6
2
Proforma Net Income
1,887
1,883
1,879
Balance Sheet Data
Assets
173,748
173,750
173,565
173,380
Average Assets
171,095
171,097
170,912
170,727
Risk-adjusted Assets
168,590
168,592
168,413
168,233
Equity
18,406
13,409
13,224
13,039
Goodwill and Intangible Assets
-
-
-
-
Tangible Equity
18,406
13,409
13,224
13,039
Average Equity
17,974
12,976
12,791
12,606
Trust Preferred
-
-
-
-
Sub Debt
-
5,000
5,000
5,000
Diluted Share Data
Basic Shares Outstanding
561
468
468
468
Diluted Shares Outstanding
561
468
468
468
Footnotes
Note: Assumes $5 million of subordinated debt raised to fund repurchase. Repurchase occurs on January 1, 2005.
1/ Debt cost is 3 mo. LIBOR 3 years forward plus 265 basis points to reflect the expectation of rising interest rates.
2/ Includes estimated pre-tax cost savings of $375,000.
(dollars in thousands except per share data)
Repurchased at Price of
Proforma for Stock Repurchase of
Repurchase Analysis
Page 39
Current
16.48%
16.48%
16.48%
Repurchase Price
$44.94
$52.00
$54.00
$56.00
Market Value Data
Price / 2005 Diluted Est. EPS (x)
13.4
12.9
13.4
14.0
Price / Stated Book - Current & Pro Forma 1/
136.88%
181.58%
191.20%
201.09%
Price / Tangible Book - Current & Pro Forma 1/
136.88%
181.58%
191.20%
201.09%
Market Capitalization 1/
$25,195
$24,348
$25,284
$26,220
Fully Diluted Per Share Data
Diluted Net Income (2005 Est.) 2/
$3.35
$4.03
$4.02
$4.01
Percent Change
20.37%
20.10%
19.84%
Stated Book Value
$32.83
$28.64
$28.24
$27.85
Percent Change
-12.78%
-13.98%
-15.18%
Tangible Book Value
$32.83
$28.64
$28.24
$27.85
Percent Change
-12.78%
-13.98%
-15.18%
Ratios
Equity/Assets
10.59%
7.72%
7.62%
7.52%
Tangible Equity/Assets
10.59%
7.72%
7.62%
7.52%
Leverage Ratio
10.28%
7.76%
7.66%
7.56%
Tier 1 Ratio
10.84%
7.91%
7.81%
7.71%
Total Capital Ratio
12.09%
12.09%
11.99%
11.90%
ROAA (based on 2005 net income)
1.10%
1.10%
1.10%
1.10%
ROAE (based on 2005 net income)
10.44%
14.54%
14.72%
14.90%
Footnotes
Note: Assumes repurchase occurs on January 1, 2005. Management earnings estimate used.
1/ Assumes stock price stays at repurchase price.
2/ Includes estimated pre-tax cost savings of $375,000.
(dollars in thousands except per share data)
Proforma for Stock Repurchase of
Tab 6
Conclusion
Page 41
Summary of Control Premium Values
Low
Midpoint
High
Discounted Dividend Analysis
$51.78
$55.79
$60.10
Premium Over Current Market Value
10%
15%
20%
Current Market Value - $44.94
$49.43
$51.68
$53.93
Average of Control Premium Values
Low
Midpoint
High
Average Value
$50.61
$53.73
$57.01

Page 42
Conclusion
Our opinion is directed to the Board of Directors of Luxemburg solely for
their use in valuing Luxemburg common stock. We have not considered,
nor are we expressing any opinion herein with respect to the price at which
Luxemburg common stock will trade subsequent to the share repurchase
and de-registration from the SEC.
It is the opinion of Ryan Beck that:
THE FAIR VALUE OF THE 92,412 SHARES, THE AMOUNT TO BE
REPURCHASED AS PART OF THE REVERSE STOCK SPLIT, OF
LUXEMBURG BANCSHARES, INC. COMMON STOCK IS WITHIN A
RANGE OF $52.00 AND $56.00 PER SHARE.

Tab 7
Ryan Beck Relationship

Ryan Beck has not had a prior Investment Banking relationship with Luxemburg
Bancshares. Ryan Beck’s research department does not provide published
investment analysis on Luxemburg Bancshares. Ryan Beck does not act as a
market maker in Luxemburg Bancshares common stock.
In the ordinary course of our business as a broker-dealer, we may actively trade
equity securities of Luxemburg Bancshares for our own account and the account
of our customers and, accordingly, may at any time hold long or short positions in
such securities.
Page 44
Relationship with Ryan Beck