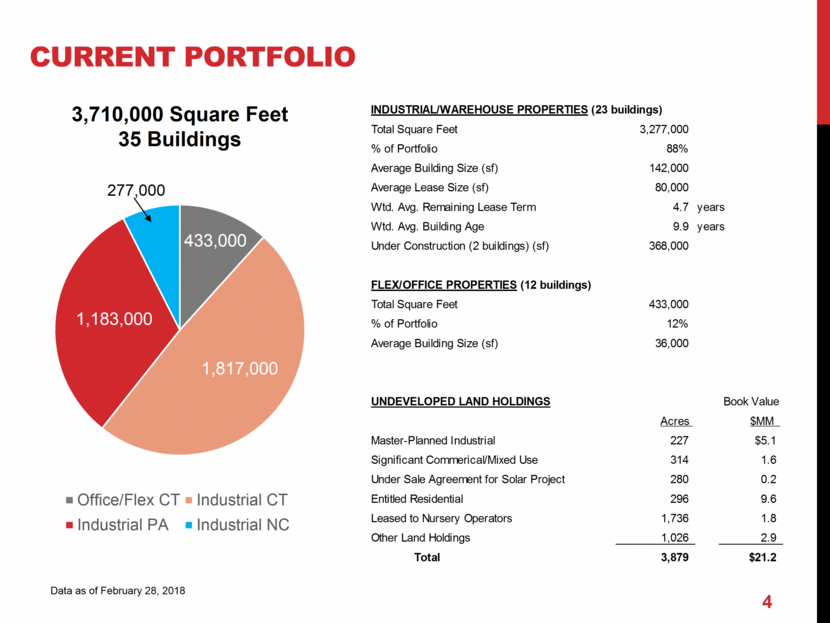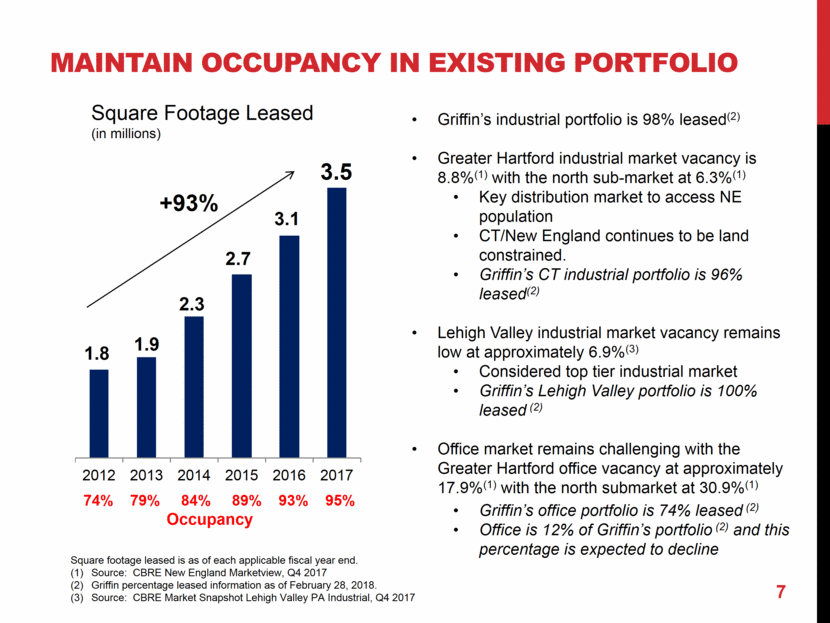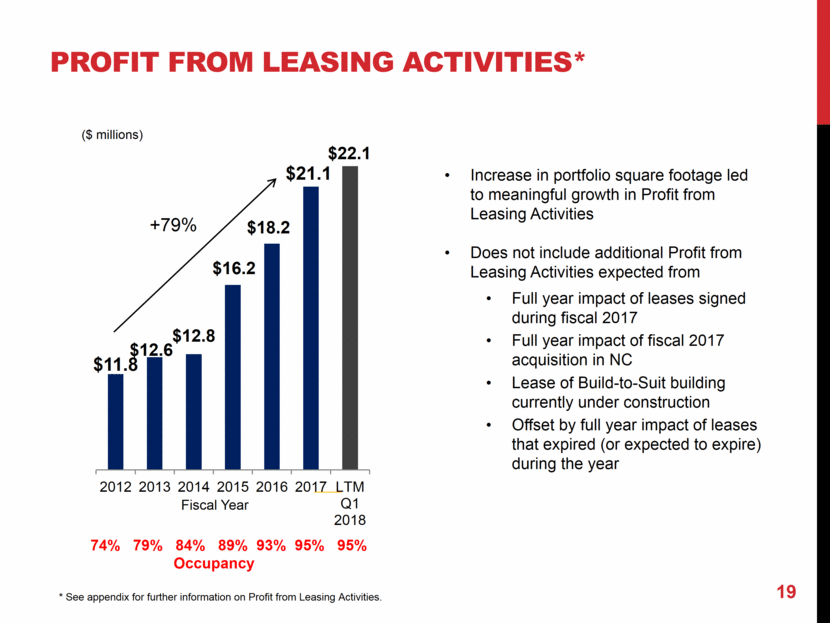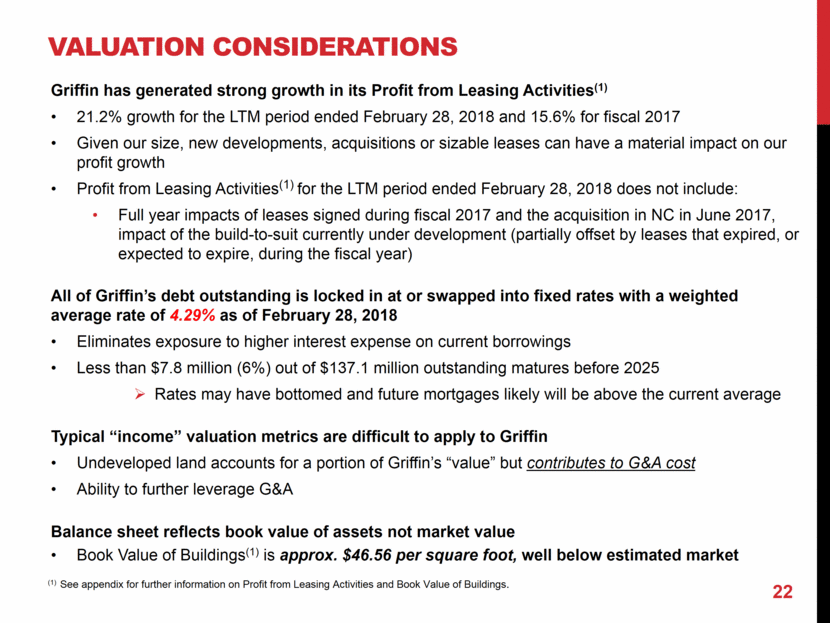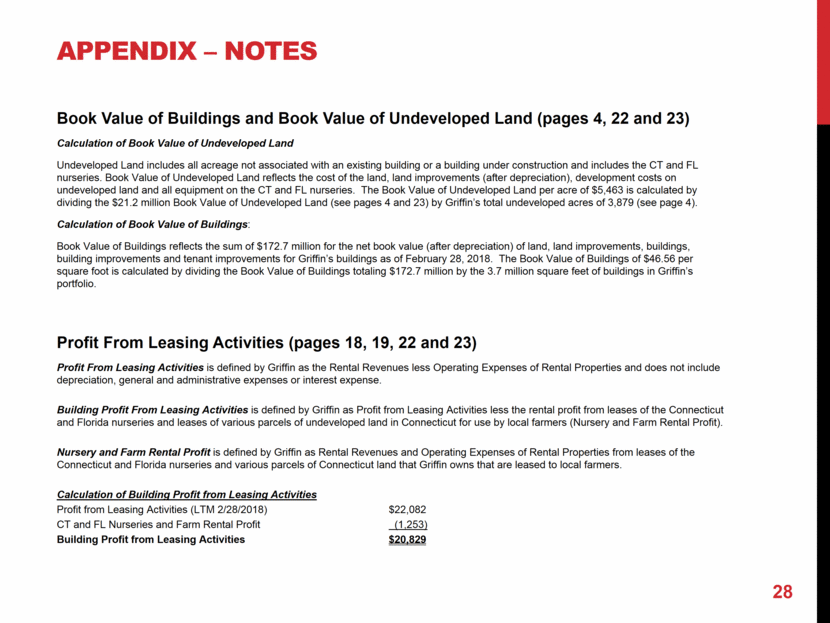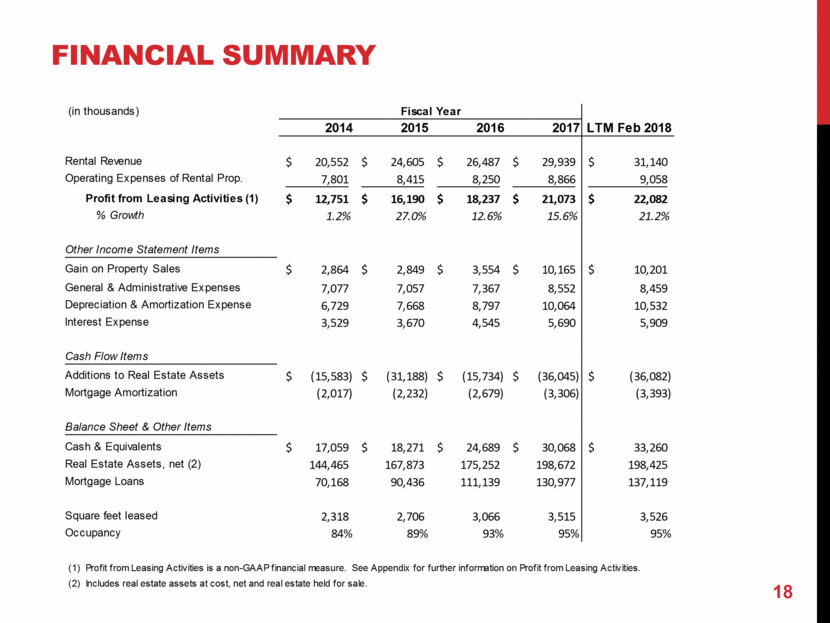
| Financial summary 18 (in thousands) 2014 2015 2016 2017 LTM Feb 2018 Rental Revenue 20,552 $ 24,605 $ 26,487 $ 29,939 $ 31,140 $ Operating Expenses of Rental Prop. 7,801 8,415 8,250 8,866 9,058 Profit from Leasing Activities (1) 12,751 $ 16,190 $ 18,237 $ 21,073 $ 22,082 $ % Growth 1.2% 27.0% 12.6% 15.6% 21.2% Other Income Statement Items Gain on Property Sales 2,864 $ 2,849 $ 3,554 $ 10,165 $ 10,201 $ General & Administrative Expenses 7,077 7,057 7,367 8,552 8,459 Depreciation & Amortization Expense 6,729 7,668 8,797 10,064 10,532 Interest Expense 3,529 3,670 4,545 5,690 5,909 Cash Flow Items Additions to Real Estate Assets (15,583) $ (31,188) $ (15,734) $ (36,045) $ (36,082) $ Mortgage Amortization (2,017) (2,232) (2,679) (3,306) (3,393) Balance Sheet & Other Items Cash & Equivalents 17,059 $ 18,271 $ 24,689 $ 30,068 $ 33,260 $ Real Estate Assets, net (2) 144,465 167,873 175,252 198,672 198,425 Mortgage Loans 70,168 90,436 111,139 130,977 137,119 Square feet leased 2,318 2,706 3,066 3,515 3,526 Occupancy 84% 89% 93% 95% 95% (1) Profit from Leasing Activities is a non-GAAP financial measure. See Appendix for further information on Profit from Leasing Activities. (2) Includes real estate assets at cost, net and real estate held for sale. Fiscal Year |
